Investigating Online Destination Images Using a Topic-Based Sentiment Analysis Approach

College of Business Administration, Pusan National University, Busan 46241, Korea
*
Author to whom correspondence should be addressed.
Sustainability 2017, 9(10), 1765; https://doi.org/10.3390/su9101765
Submission received: 17 July 2017
/
Revised: 22 September 2017
/
Accepted: 25 September 2017
/
Published: 29 September 2017
(This article belongs to the Special Issue Mobile Technology and Smart Tourism Development)
Abstract
:With the development of Web 2.0, many studies have tried to analyze tourist behavior utilizing user-generated contents. The primary purpose of this study is to propose a topic-based sentiment analysis approach, including a polarity classification and an emotion classification. We use the Latent Dirichlet Allocation model to extract topics from online travel review data and analyze the sentiments and emotions for each topic with our proposed approach. The top frequent words are extracted for each topic from online reviews on Ctrip.com. By comparing the relative importance of each topic, we conclude that many tourists prefer to provide “suggestion” reviews. In particular, we propose a new approach to classify the emotions of online reviews at the topic level utilizing an emotion lexicon, focusing on specific emotions to analyze customer complaints. The results reveal that attraction “management” obtains most complaints. These findings may provide useful insights for the development of attractions and the measurement of online destination image. Our proposed method can be used to analyze reviews from many online platforms and domains.
1. Introduction
The advent of Web 2.0 and the explosive growth of social media have produced huge amounts of data in the form of user-generated unstructured reviews. People have become accustomed to freely expressing their sentiments and emotions over different online platforms (e.g., Amazon, TripAdvisor, and Yelp), which provides us with credible and informative data (e.g., product features) [1,2]. Online reviews are important in decision making both for individuals and organizations [3]. They also have a significant effect on sales [1,4]. For instance, Spool [5] estimated that online Amazon reviews contributed to $2.7 billion in income annually through the promotion of helpful reviews, collected by investigating the question “Was this review helpful to you?”.
Social media plays an important role as an information source for travelers [6]. User-generated content (UGC) for travel refers to all online travel-related reviews, including attraction, hotel, and restaurant reviews [6,7,8]. In these reviews, people do many things (e.g., share personal experiences and evaluate services). As such, a new representation form has emerged to express travelers’ collective beliefs, knowledge, ideas, and feelings about a destination (e.g., the evaluation of local culture, transportation, food, or infrastructure) [8], called the destination image [9]. Analyzing and better understanding UGC data appear to be particularly necessary and important. However, manipulating vast amounts of data is intractable without the help of computers.
In recent years, an emerging stream of research became important: topic-based or aspect-based sentiment analysis [10,11,12], which refers to the process of identifying product topics for an online store (e.g., product features) and classifying the corresponding sentiments for each topic [13]. The topic-based sentiment analysis approach was also applied to extract tourism-related topics (e.g., hotel services and prices) using online reviews [14,15,16]. Previous topic-based sentiment analysis studies fall into two categories: topic extraction using topic modeling [14,15,16,17] and polarity classification at the topic level [12,13]. Topic extraction is the process of extracting topics that have been evaluated, while polarity classification at the topic level classifies the sentiments in each topic into positive, negative, or neutral [18].
Existing polarity classification methods at the topic level [10,13,14] have focused on using entire reviews. Instead of using entire reviews, we propose to use the reviews related to one or two topics. We assign the reviews to topics according to an employed threshold value. When processing a large volume of data, our proposed method is more efficient to analyze sentiments over topics than prior methods.
Few studies have conducted emotion classifications at the topic level. Compared to simple topic extraction and polarity classifications, we propose a new emotion classification method at the topic level. This method is based on an emotion lexicon, with the objective of classifying the sentiments into specific emotions (e.g., anger, joy, sadness, and disgust). Our analysis focuses on the negative sentiments of the online traveler reviewers, because negative sentiments are considered stronger than positive sentiments [19,20]. We analyze tourist complaints from negative sentiments and specific emotions by using a topic-based sentiment analysis method.
This study aims to propose a topic-based sentiment analysis (i.e., polarity classification and emotion classification) method, which assigns the reviews that are focused on one or two topics to the extracted specific topics. In this study, we perform our proposed method using online travel reviews, with the objective of addressing the following research questions: (1) Which topic receives the most attention from tourists? Identifying the topics discussed in online tourism portals is important for both potential tourists and attraction managers. We attempt to explore the latent topics hidden in tourist reviews using a Latent Dirichlet Allocation (LDA) model [21]; (2) What emotions do tourists express in each topic? We propose an extension of the topic-based sentiment analysis, which allows us to perform emotion classification at the topic level using an emotion lexicon. Identifying the emotions that tourists have experienced enables us to better understand UGC. Compared to polarity classification, emotion classification at the topic level can more specifically reflect customer satisfaction through several emotions (e.g., joy, disgust, trust, and sadness).
The rest of this paper is organized as follows. Section 2 introduces sentiment analysis and the related works that analyze tourist reviews using text mining techniques. Section 3 introduces our proposed method, including the data collection process, topic extraction process, and topic-based sentiment analysis method. Section 4 analyses the results. Section 5 presents our contributions and discusses future research.
2. Related Work
2.1. Sentiment Analysis
Sentiment analysis is a popular topic among recent research investigations [13,22,23]. Sentiment analysis, also known as opinion mining, involves analyzing sentiments and emotions from text using text-mining techniques [24]. Many previous studies have focused on subjectivity or polarity classification issues. Subjectivity classification refers to classifying one document as subjective or objective. Polarity classification refers to classifying one document as positive or negative using sentiment analysis. Subjective sentiment is a regular or comparative sentiment given in a subjective statement (e.g., I think this phone is good), while an objective sentiment expresses factual information that implies positive or negative sentiments (e.g., I bought the phone yesterday, but it does not work now) [18].
Two approaches are widely used in sentiment analysis: machine learning and lexicon-based semantic orientation. Most studies used the machine-learning approach, owing to its high performance. Various machine-learning techniques (e.g., support vector machines [23], neural networks [25], and naive Bayes [26]) are applied in this field. This approach works by building a classifier on the training data and then evaluating the test data. This method can fine-tune the performance, but suffers from the disadvantage of less generalizability, which means that it cannot ensure the performance in a new dataset using the trained model.
As mentioned previously, polarity classification is based on the classification of sentiment words as positive or negative, whereas emotion classification is based on the process of classifying sentiment words into several emotional categories. To gain a general understanding of the sentiments found in a large amount of documents, these sentiments must be classified into emotions according to a typology (e.g., Pleasure-Arousal-Dominance model [27], Plutchik’s eight basic emotional categories (i.e., anger, fear, sadness, disgust, surprise, anticipation, trust, and joy) [28]). Emotions can generally summarize a reviewer’s feelings more generally than detailed sentiment words. Hence, many studies focus on emotion classification based on machine learning approaches [29,30,31,32] or rule-based approaches [33,34,35] and demonstrate the importance of emotion classification [32].
According to learning granularity (i.e., learning unit: document, sentence, topic), sentiment analysis can be divided into three types of analyses: document-, sentence-, and topic-based sentiment analysis. Many studies focus on the document- or sentence-based sentiment analysis [13,22,23,36,37], which refers to the process that extracts sentiments from text at the document or sentence level. However, neither the document-level nor the sentence-level sentiment analyses identifies sentiment topics [18]. For instance, it refers to two topics, namely, “product” and “service” in the sentence of the bracket (The product is good, but the service is bad). When the document- or sentence-based sentiment analysis is employed, it is not easy to justify which topic (“product” or “service”) the sentiments (“good” or “bad”) belong to. Hence, many researchers have begun to conduct topic-based sentiment analyses [10,11,12,14].
2.2. Studies on Tourist Reviews Using Text Mining Techniques
Many prior studies have focused on analyzing online travel reviews using text mining techniques. There are three general techniques currently available: content analysis, document-based, and topic-based sentiment analysis (Table 1). In this section, we present the state of the art techniques on the application of text mining techniques for online travel reviews. With the tremendous growth of Web 2.0, online travel reviews are being applied to many fields (e.g., the exploitation of information value, the prediction of review helpfulness, and the extraction of review topics).
Content analysis. Recently, an increasing number of studies have focused on the content analysis of online reviews, which refers to the process of quantifying unstructured text data. Content analysis is widely used to extract content features from the text. Choi et al. [38] identified the destination image representations by extracting frequently used words for five sub-categories of 81 websites, respectively. Levy et al. [39] applied content analysis to explore hotel complaints, which were extracted and then analyzed by hotel and reviewer characteristics. Ariyasriwatana and Quiroga [40] explored expressions of deliciousness from restaurant reviews based on content analysis and then categorized them into eight primary dimensions. Liu and Park [41] extracted four text readability features from review contents using content analysis, and the results showed that two of the four features had a statistically significant and positive effect on review helpfulness.
Document-based sentiment analysis. Some prior studies focused on using sentiment analysis to assess the polarity (positive or negative) of each review by automatically using machine learning techniques [36,37]. Others made polarity classifications based on a lexicon [42]. Hu et al. [43] identified the top sentences from hotel reviews after calculating the sentence importance and the similarity between sentences. Hu and Chen [44] extracted positive and negative sentiments from each review and used them to predict review helpfulness.
Topic-based sentiment analysis. As described in Section 2.1, due to the disadvantages of document- or sentence-based sentiment analysis, some of these studies are devoted to topic-based sentiment analysis. Pearce and Wu [17] tried to extract the tourism topics of an iconic site in China by analyzing the online reviews written by international tourists. Cenni and Goethals [46] investigated whether there existed a divergence between negative hotel reviews written in different languages using a cross-linguistic analysis method. Guo et al. [16] identified key topics using LDA, uncovering 19 controllable topics by mining 266,544 online reviews from 25,670 hotels located in 16 countries. Xiang et al. [15] measured review data quality using linguistic characteristics; semantic features; and sentiment, rating, and usefulness features. They utilized these features to predict review helpfulness. However, a relatively limited number of these studies focused on sentiment analysis at the topic level. Marrese-Taylor et al. [14] proposed an extension of Liu’s topic-based sentiment analysis approach and applied it to the tourism domain. Their study proposed new, more complex NLP-based rules for subjective and sentiment classification tasks at the topic level. The results demonstrated the effectiveness of their proposed approach in sentiment orientation classification. Farhadloo et al. [45] proposed a topic-based sentiment analysis method for modeling customer satisfaction using a Bayesian approach.
There exist advantages and disadvantages for the three techniques (i.e., content, document-based and topic-based sentiment analysis). Content analysis helps to analyze the text by using quantitative or qualitative features, but it relies on subjective judgments, to some extent [38]. Moreover, computerized content analysis suffers from the limitation of the user-defined dictionary size and applicability [47]. In addition, content analysis cannot be applied to in-depth analyses, such as polarity and emotion classifications. Document-based sentiment analysis is efficient in analyzing sentiments from text, benefiting from the assumption that each document has only one single sentiment target. As mentioned in Section 2.1, document-based sentiment analysis suffers from the difficulties of identifying a sentiment target, which only classifies the entire document as positive (subjective) or negative (objective) [18]. Topic-based sentiment analysis overcomes such disadvantages to extract topics automatically or analyze sentiments at the topic level.
3. Methodology
3.1. Research Framework
The research framework of this study is illustrated in Figure 1. We conduct this study using three phases, namely, preprocessing, topic extraction, and topic-based sentiment analysis.
In Phase I, we collect and document online travel review data. Because languages like Chinese do not delimit the words in a sentence, we need to segment the words to extract the useful ones. After the segmentation, we eliminate the ”stop words” according to a HowNet stop-word list [48]. After the preprocessing is complete, each document is saved as a “bag of words”.
In Phase II, after applying the processed data to the LDA model, we obtain the probability-based word-topic matrix and the document-topic matrix, used for topic summarization and topic-based sentiment analysis, respectively. We investigate the destination image based on topic summarization using a word-topic matrix. For each latent topic, we extract the top 15 words. A topic naming process is conducted by grouping the meanings of the distinctive extracted words for each topic. We also present the topic salience by summing up the relative weights of the top 15 words, which helps to understand which topics tourists prefer to talk about. The different results are presented by fine tuning the number of topics (K). We select one appropriate topic number (K) by calculating the Kullback–Leibler (KL) divergence from the specified set to perform further analyses.
In Phase III, investigating and understanding sentiments and emotions is an important task. To investigate tourist complaints, we propose a new topic-based sentiment analysis, which helps to extract sentiments and emotions using the reviews that are focused on one or two topics. Regarding the document-topic matrix, we assign the reviews which are focused on one or two topics to the specific topics according to a defined threshold value. We initially perform a polarity classification using the selected reviews for each topic. We focus on negative sentiments rather than the polarity classification itself. The polarity classification at the topic level helps us to better understand the status of the tourist complaints for each topic. To provide a more comprehensive and in-depth investigation, we propose a lexicon-based emotion classification approach at the topic level to analyze tourist emotions towards specified topics. In other words, polarity classification is based on binary classification (e.g., positive or negative), while emotion classification (e.g., anger, joy, sadness, and trust) is based on multiple classification. Through comparing the emotions between topics, we can easily understand the tourist complaints and make a decision about the priority of urgent issues.
3.2. Data Collection
In this study, we use the online reviews of the top 10 domestic tourist attractions in China in 2015, which were crawled from Ctrip (www.ctrip.com) using Bazhuayu (bazhuayu.com) in September 2016. The posted date of each review was between September 2015 and August 2016, to guarantee that there were no big changes at each attraction. Ctrip is a provider of travel services, including accommodation reservations, transportation ticketing, packaged tours, travel information, and corporate travel management, in China. It is also one of the biggest tourist review sites in China, with ratings by 250 million users. For each of the top 10 tourist attractions, we randomly collect 100 positive (four or five stars) and 100 negative (one or two stars) reviews according to the ratings.
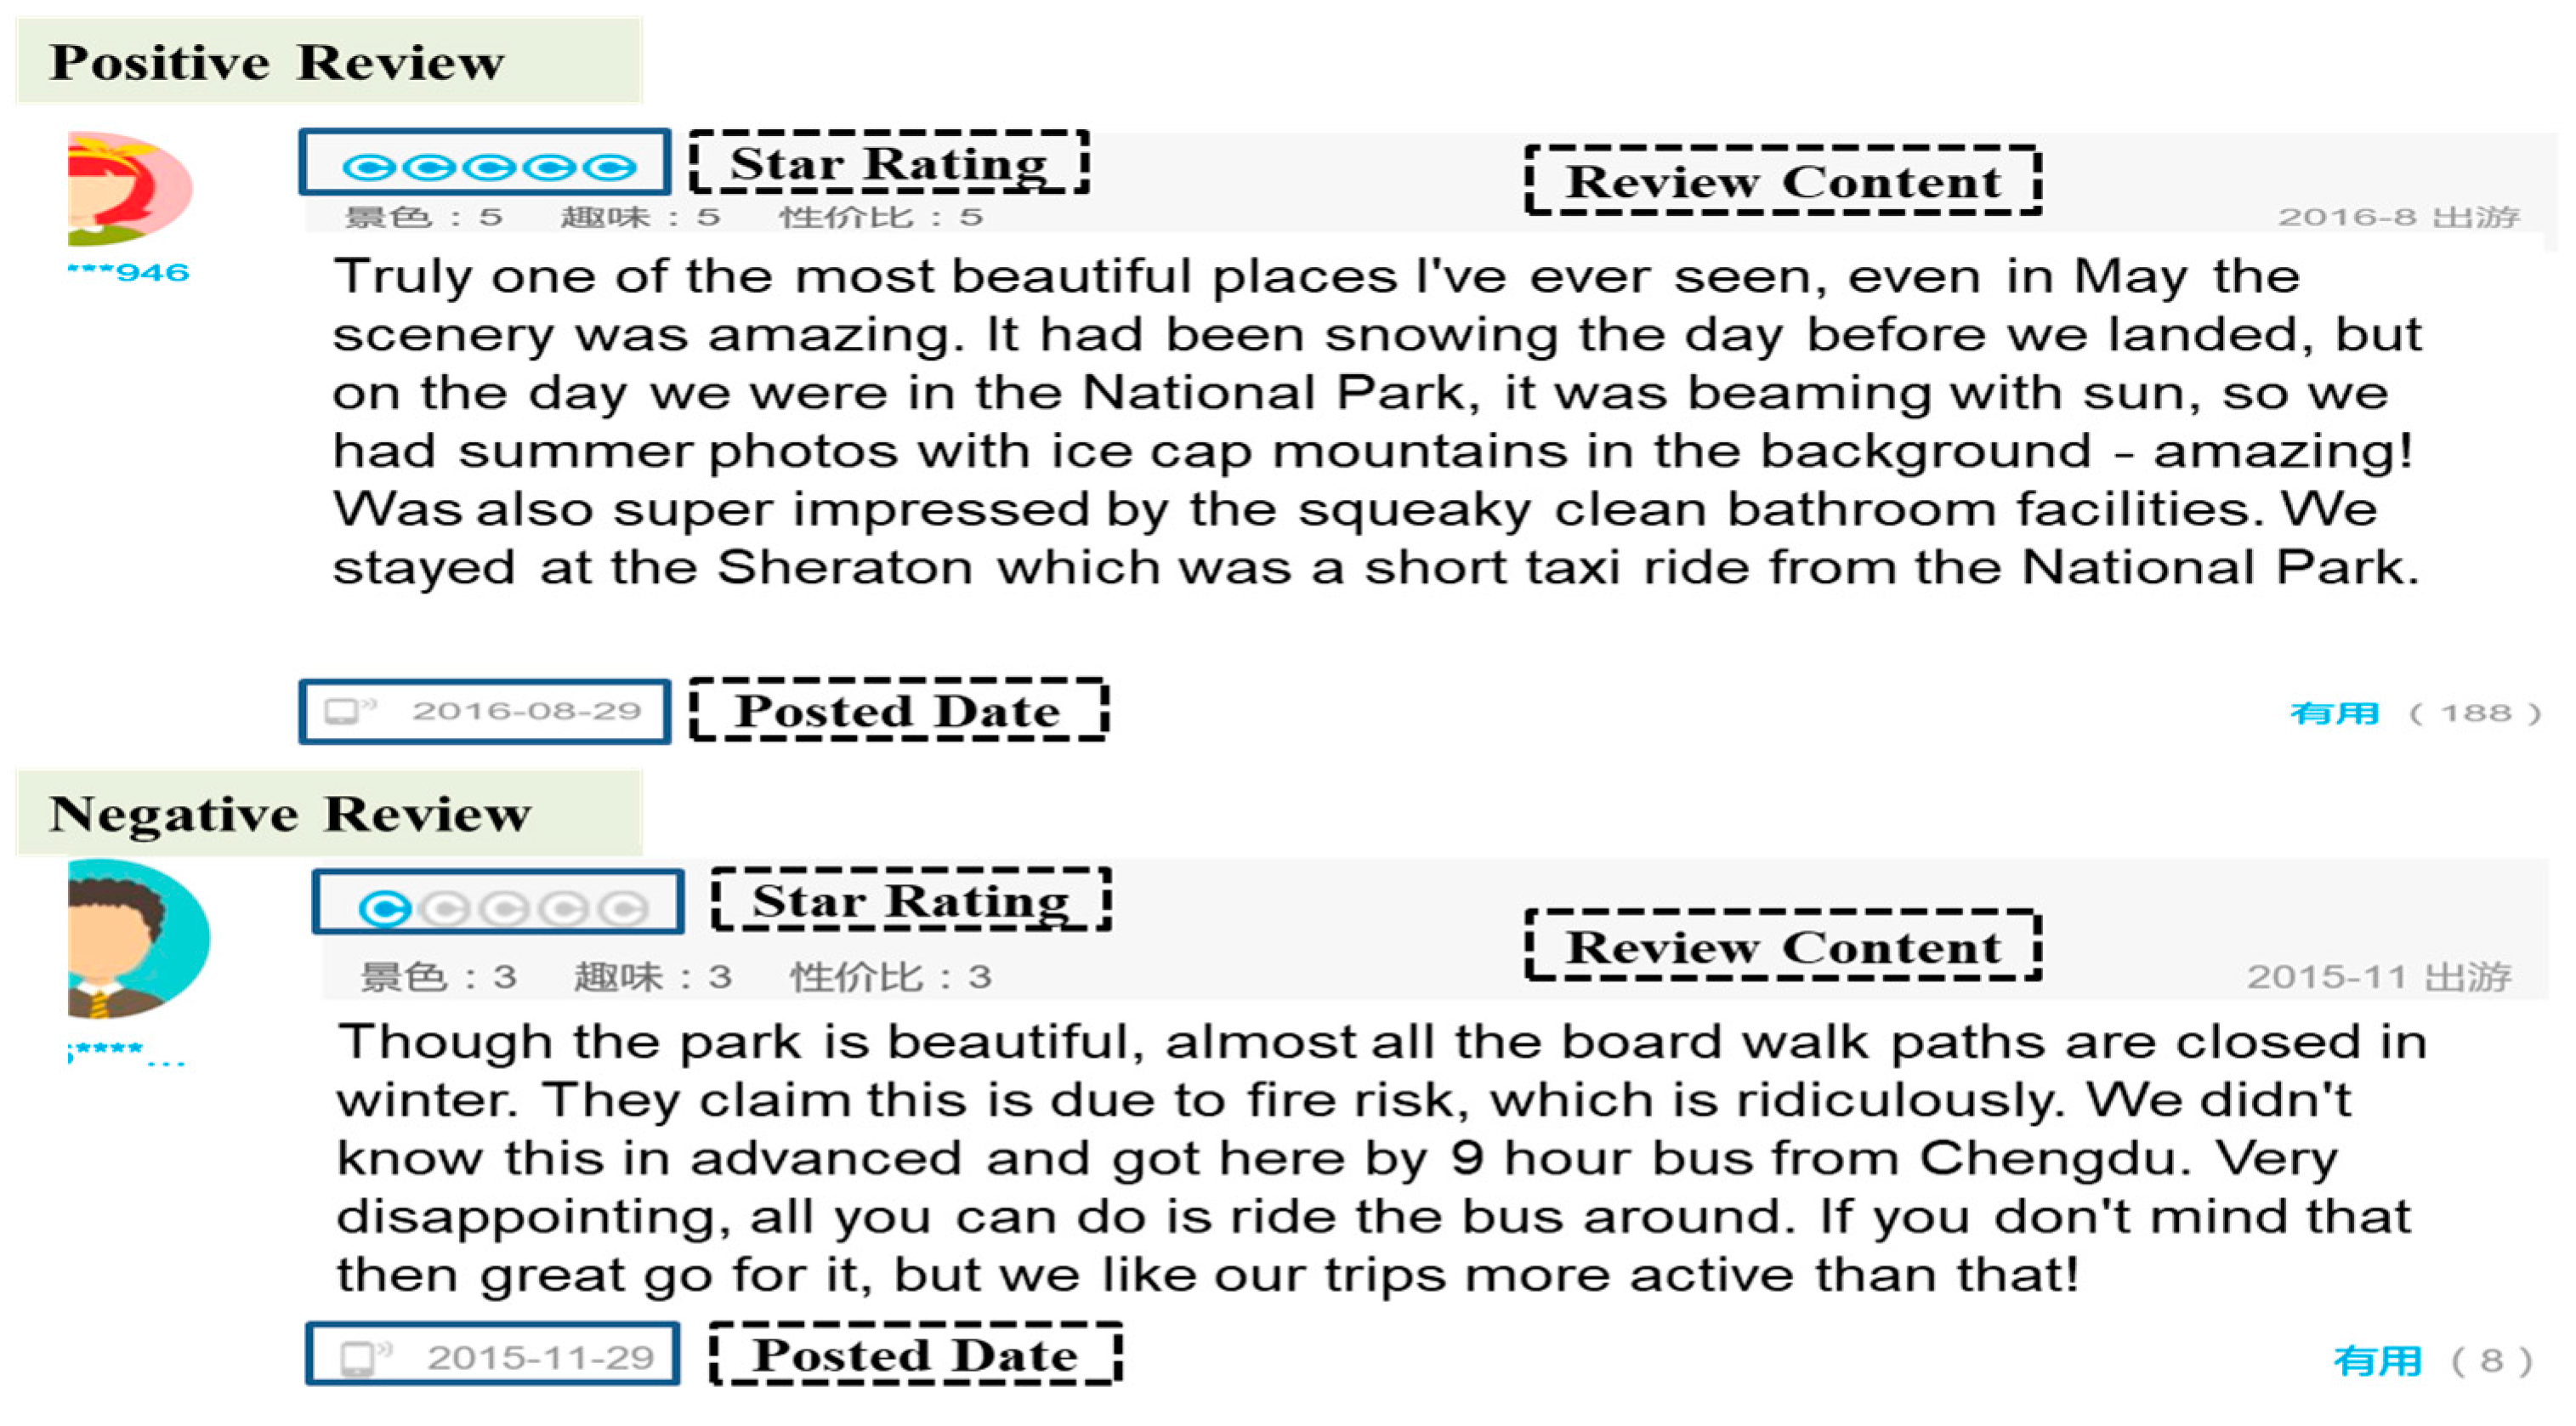
A total of 2000 reviews are obtained and saved as .txt files. As depicted in Table 2, we present the summary statistics for the word count of each review. The average number of words is 86. The average number of words for positive reviews and negative reviews is 87 and 85 words, respectively. In this study, each review is assumed to be a mixture of several latent topics. In addition, we present one positive review and one negative review as examples in Figure 2, wherein the review content has been translated into English. We find that it may refer to several topics simultaneously in one review. For example, in the positive review, it refers to price, accommodation, and people.
Because Chinese is written in a standard form without spaces between words, we need to split the texts into a sequence of words according to some word segmentation standard or user-defined lexicon. We select the HowNet word list [48] as the basic segmentation lexicon. HowNet is online common-sense knowledge based on Chinese and English. In particular, 37,367 Sogou Internet catchphrases and 2902 travel terms are added to the lexicon during the segmentation stage to improve the performance of the text segmentation. The Sogou Pinyin method is a popular Chinese Pinyin input-method editor developed by Sohu.com, Inc. (Beijing, China). In the preprocessing stage, we remove the punctuation, numbers, and names (e.g., tourist attraction names, location names). A Chinese stop-word list is also implemented in this study to remove the stop words.
3.3. Topic Extraction
Blei et al. [21] developed the LDA model, a generative probabilistic model, to collect discrete text data. The LDA model is a three-level (documents-topics-words) hierarchical Bayesian model based on unsupervised learning, which refers to the analysis used to draw inferences from unlabeled datasets (i.e., datasets without an output variable). The basic idea is that each document is assumed to be a random mixture of several underlying topics in which each topic is characterized by a probability distribution over different words. The order of the words can be neglected. LDA is widely used to extract the latent topic information from vast amounts of documents.
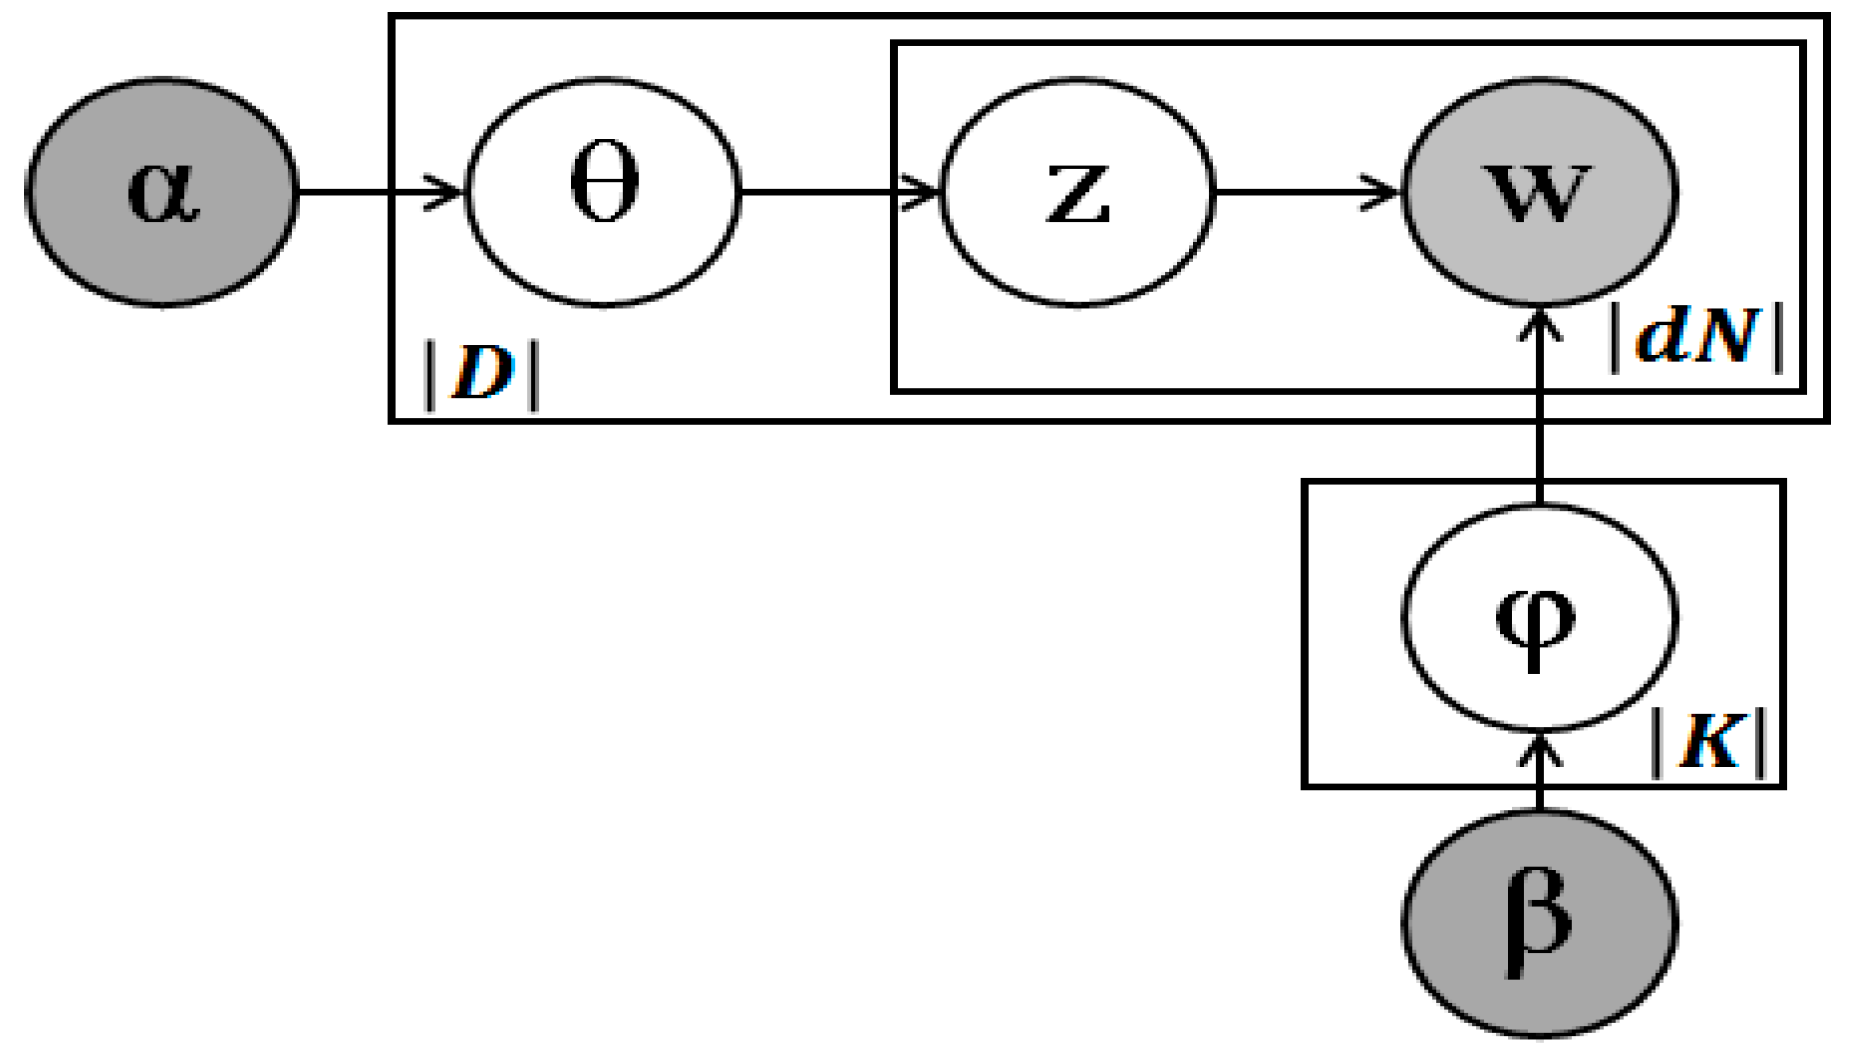
Let us assume that we have a corpus with a collection of documents denoted by , where |D| is the document number. The vocabulary is denoted by , where |V| is the word number. Each document in the corpus is a sequence of Nd words denoted by , where refers to the latent Nth word in document d. The latent topic set is denoted by , where |K| is the topic number. Figure 3 shows the graphical model representation of the LDA.
The LDA model trades off two goals in the learning process. The first goal is the allocation of words to different topics in each document. The second goal is the assignment of high probability to a few terms in each topic. However, these goals are at odds with each other. Putting a document in a single topic makes the second goal difficult. Putting very few words in each topic makes the first goal difficult. Trading off these goals leads to finding groups of tightly co-occurring words.
In the LDA model, the generative process for each document in corpus D is described as follows:
- Choose the topic distribution
- For each word
- -
- Choose a topic
- -
- Choose a word from , a multinomial probability conditioned on topic .
We have parameters α and β, where α denotes the hyper-parameter of the Dirichlet prior for the topic distribution and β denotes the hyper-parameter of the Dirichlet prior for the word distribution. α represents the topic generative probability, and β represents the word generative probability. Both document-topic distribution θ and topic-word distribution ϕ follow a multinomial distribution. Because the Dirichlet distribution is a conjugate prior of a multinomial distribution, the problem of statistical inference is simplified using the Dirichlet priors [18]. The joint distribution of θ, z, and w is expressed as follows:
where
p(w|α,β) in Equation (3) denotes the weight (probability value) of each extracted word.
In this study, we conduct two different analyses to answer the two research questions described in Section 1. LDA analyzes the importance of each topic utilizing an LDA model. The LDA is implemented in the R programming language. An R package, namely, jiebaR, is used for the Chinese text segmentation. This package supports four types of segmentation modes: maximum probability, hidden Markov model, query segment, and mix segment. The maximum probability segmentation model is employed as the segmentation algorithm in this study. For the LDA model, the lda package is applied to build the LDA model. To fine-tune the performance, different topic numbers, K, are tested in the LDA model. For the parameters, K is set to {3, 4, 5}, α is set to 50/K, and β is set to 0.01 [10]. The Gibbs sampling method is applied to approximate the inference. The number of latent topics is assumed to be known and fixed.
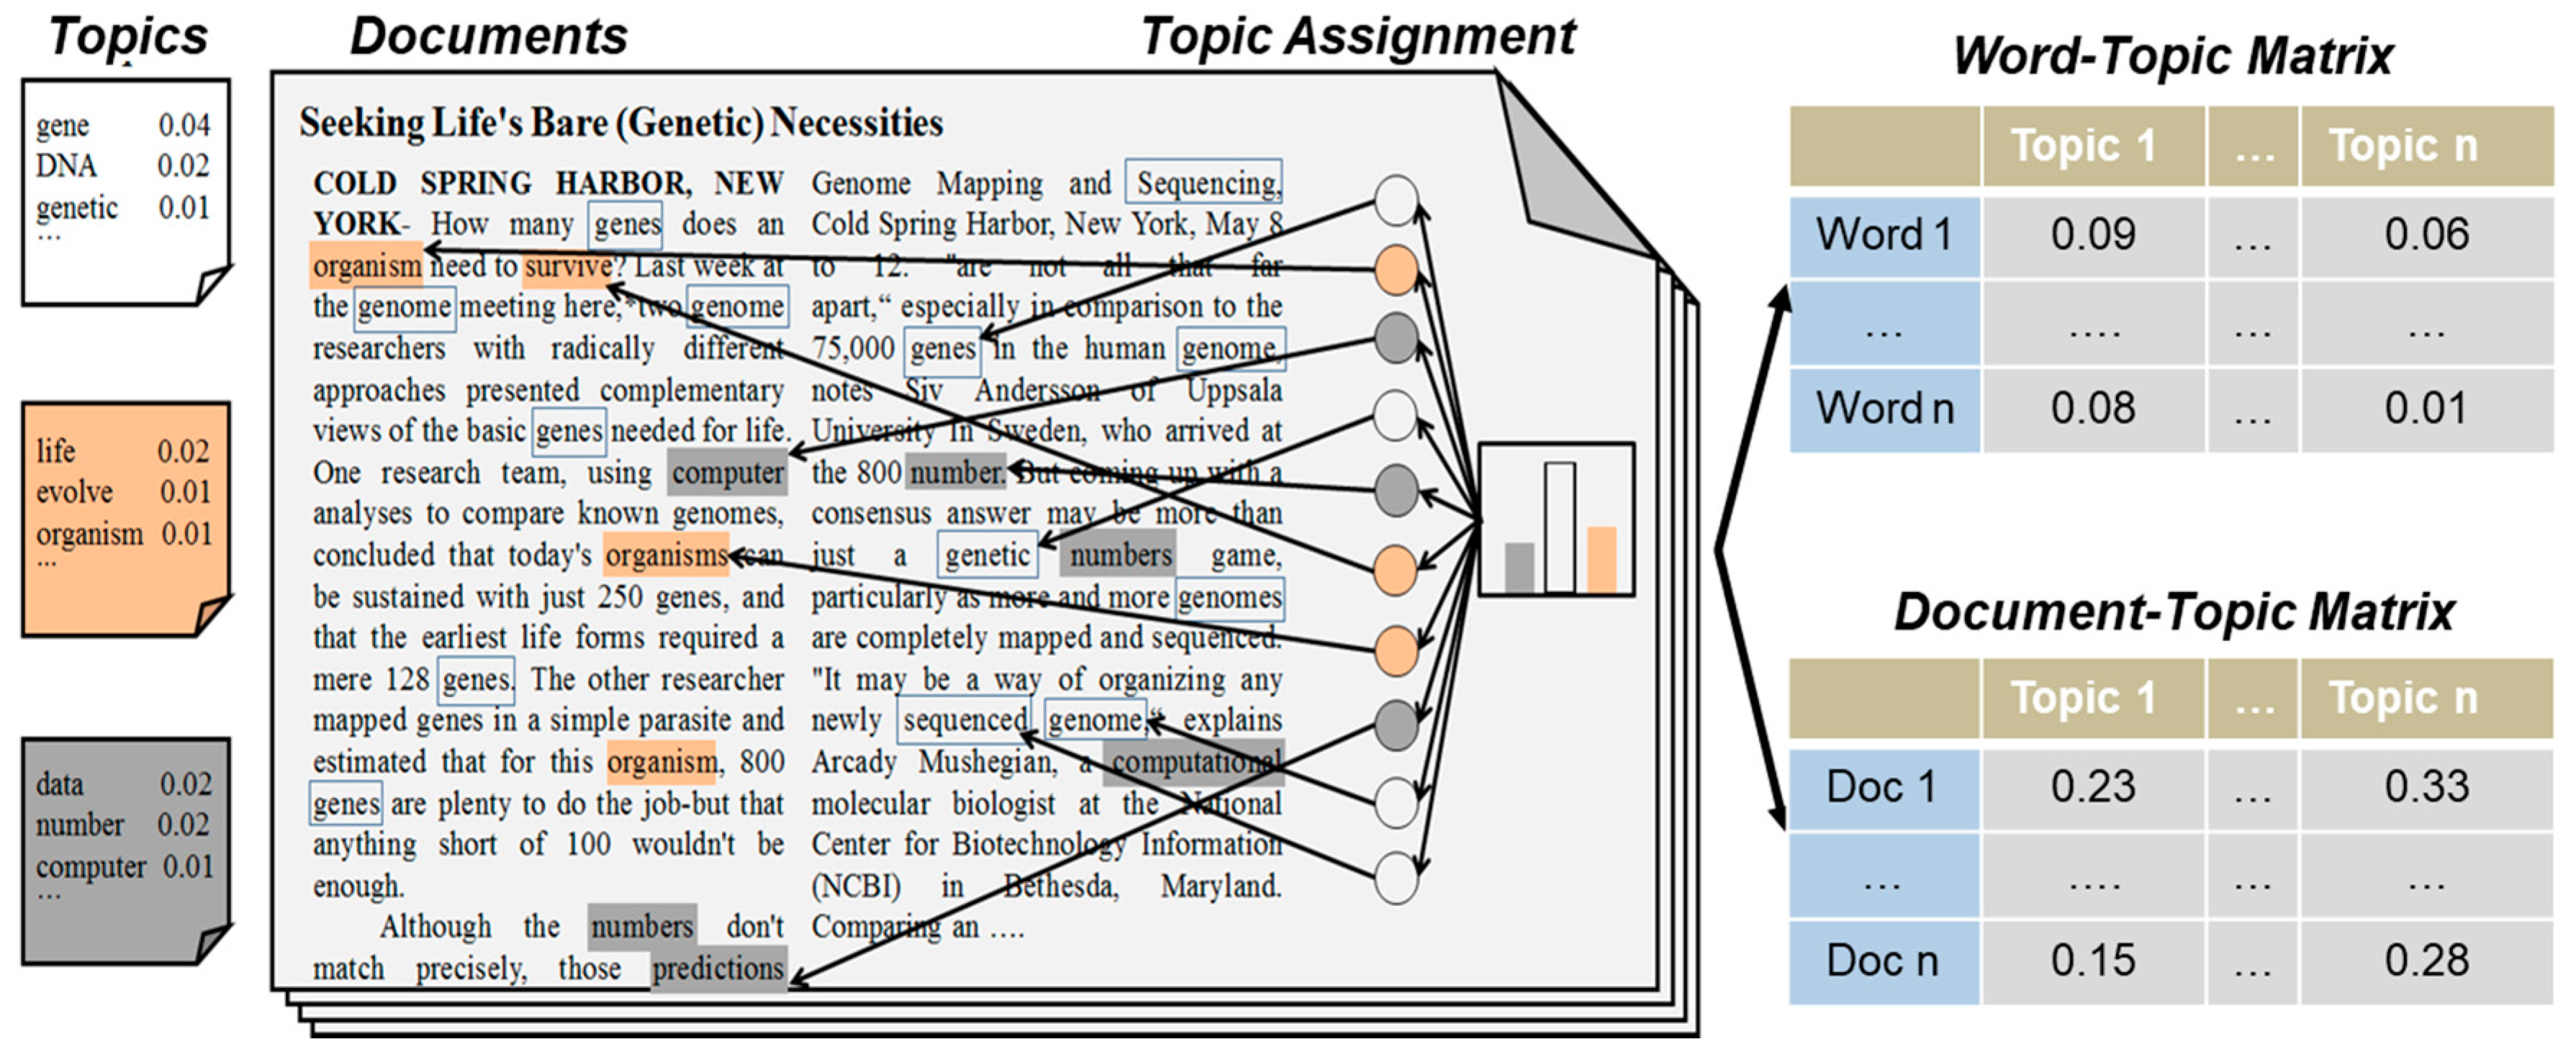
For a better understanding, we present a visualization of the entire process of LDA in Figure 4. The word-topic matrix, one output of LDA, represents the co-occurrence probability of one word and one latent topic. For each topic, we use the word-topic matrix to present the top 15 words and to present the corresponding weight of each word. The weights of each word reflect the relative importance of each topic. Accordingly, the total of these weights reflects the relative importance of each topic.
After running the LDA model, we select one appropriate topic number from this set of Ks by calculating the average Kullback–Leibler (KL) divergence between any two topics. The KL divergence (i.e., KL distance) is used to calculate the non-symmetric difference or dissimilarity between two probability distributions. Given the word probability distribution P for Topic 1 and Q for Topic 2, the KL divergence between Topics 1 and 2 is defined as:
where |V| is the total size of the vocabulary. Because of the non-symmetric difference, the KL distance between the two topics is calculated as
In this study, we select the appropriate topic number K with the maximum average KL distance between topics. For example, when the topic number K is set to three, the average KL distance between any two of the three topics is defined as
A greater average KL distance means less relevance between any two topics and, hence, a better performance of the classification.
As for topic naming, there are two approaches: one is based on the naming process that manually summarizes the meaning of the extracted top words [11,15,16,50,51,52]. The other approach is based on the naming process that automatically generates the topic meaning based on supervised learning and a word-list [53] (Table 3). However, a comprehensive word-list does not exist in many domains. Therefore, combined with the tourism domain knowledge, we employ the first approach to manually name a topic. More specifically, because there exists some identical words and synonyms among the topics, the topic name is given and supported by five distinctive meaningful words at least in each topic.
3.4. Topic-Based Sentiment Analysis
The document-topic matrix, another output of LDA, represents the co-occurrence probability of one document and one latent topic. For the polarity and emotion classification, we assign the reviews that are focused on one or two topics to the specific topics according to a threshold value, which is dependent on the distribution of document-topic probabilities. The assignment process is conducted after the topic extraction.
With regard to the topic-based sentiment analysis, we adopt a sentiment lexicon, the Dalian University of Technology Sentiment Dictionary (DUTSD), developed by Xu et al. [54]. The effectiveness of the DUTSD has been demonstrated in many studies [55,56]. The DUTSD provides a list of seven basic emotions: joy, trust, anger, sadness, fear, disgust, and surprise.
In this study, for the polarity and emotion classification, we employ a negative and an emotion ratio respectively to compare the topics. For topic i, the negative ratio is calculated as the proportion of negative sentiments in the total sentiments ():
For topic i and emotion j, the emotion ratio is calculated as the proportion of sentiments in the total sentiments.
4. Results
4.1. Topic Extraction
Table 4, Table 5 and Table 6 list the general descriptions of the generated keywords and the relative weights when K = 3, 4, 5. We select one appropriate topic number (K) by calculating the KL distance. Table 7 presents the average KL distance between any two topics under the different topic numbers. This distance obtains the maximum value, 7.7199, when the topic number is set at four. A greater average KL distance means less similarity between any two topics, and, hence, a better performance of the classification is obtained. As such, we select K = 4 as the appropriate value in the set {3, 4, 5}.
In this study, we conduct a naming process to summarize the meanings of each topic. According to the results, we summarize the topic meaning based on four topics, namely, “management”, “scenery”, “price”, and “suggestion”. The four topics are selected based on categorizing the extracted words, when the topic number equals 3, 4, or 5, which are not based on the topics (i.e., dimensions) used in the previous studies. This study prefers to use the data-driven topics. For each topic, the topic meaning is generated by summarizing the meaning of the extracted words. Because there exists some identical words and synonyms among topics, the topic name is given and supported by five distinctive meaningful words at least in each topic.
To gain a better understanding of topic naming process, we presented one example in Table 8. For instance, after topic extraction using the LDA model, we obtained the top 15 extracted words in Topic 1. We then selected five distinctive words at least, and named the topic according to these distinctive words. In Topic 1, “cableway” and “cable car” refers to the attraction infrastructure; “queue” and “hour” refers to the queuing time; and “service” refers to the attraction service. In general, we named Topic 1 “Management”. It includes the attraction infrastructure, queuing time, and service.
We named the extracted four topics. “Management” refers to attraction facility management, attraction services, queuing time arrangement, and attraction capacity. “Scenery” refers to natural resources (e.g., mountain, river, forest, grassland, valley, lake, and island). “Price” refers to the attraction ticket price, local price level, transportation fees, and extra fees. “Suggestion” refers to the reviewers’ travel experience, recommended scenery, time schedule, routes, and some thoughtful cautions. In general, this study covers the majority of topics that are measured in previous studies, namely, natural resources, attractions, transportation, price, and infrastructure [7,8,57,58].
As for the appropriate topic number K = 4 (Table 5), we can distinctly define each topic by summarizing the corresponding top 15 words. The four topics include “management”, “scenery”, “price”, and “suggestion”. As shown in Table 5, the total weights of each topic represent the relative importance of each topic. The weight (probability value) of each extracted word denotes the proportion of the extracted word frequency within each topic out of the total word number. The relative weight of each topic is calculated as the sum of the relative weights of its top 15 words. The results show that “suggestion” is the most important factor influencing the destination image. Many tourists tend to share their experience, time schedule, attraction recommendation, and route selection. We find that “management” is the second most important factor. The results indicate that tourists care about attraction management, infrastructure, queuing time, and service. “Price” ranks third; it is not difficult to conclude that most people are sensitive to price. We also find that fewer descriptions focus on “scenery”.
4.2. Topic-Based Sentiment Analysis
For the extracted topics, we conduct a topic-based polarity classification and emotion classification analyses of the tourist complaints. To this end, we select reviews with relatively distinctive topics based on the document-topic matrix generated by the LDA model. As shown in Figure 5, because some reviews are focused on specific topics and the corresponding document-topic probabilities are above 0.3, we employ 0.3 as the threshold value that helps to discriminate whether a review belongs to the topic or not. The topics of “management”, “scenery”, “price”, and “suggestion” correspond to 248, 221, 170, and 145 reviews, respectively. We obtain a data set with 784 records (i.e., 767 reviews) for the topic-based sentiment analysis, where 17 reviews belong to two topics simultaneously. After excluding the non-matching reviews, the topics of “management”, “scenery”, “price”, and “suggestion” are allocated to 184, 211, 154, and 123 reviews, respectively. Considering that the number of reviews is imbalanced, we evaluate the performance of each topic by using the negative sentiment ratio () and the emotion ratio ().
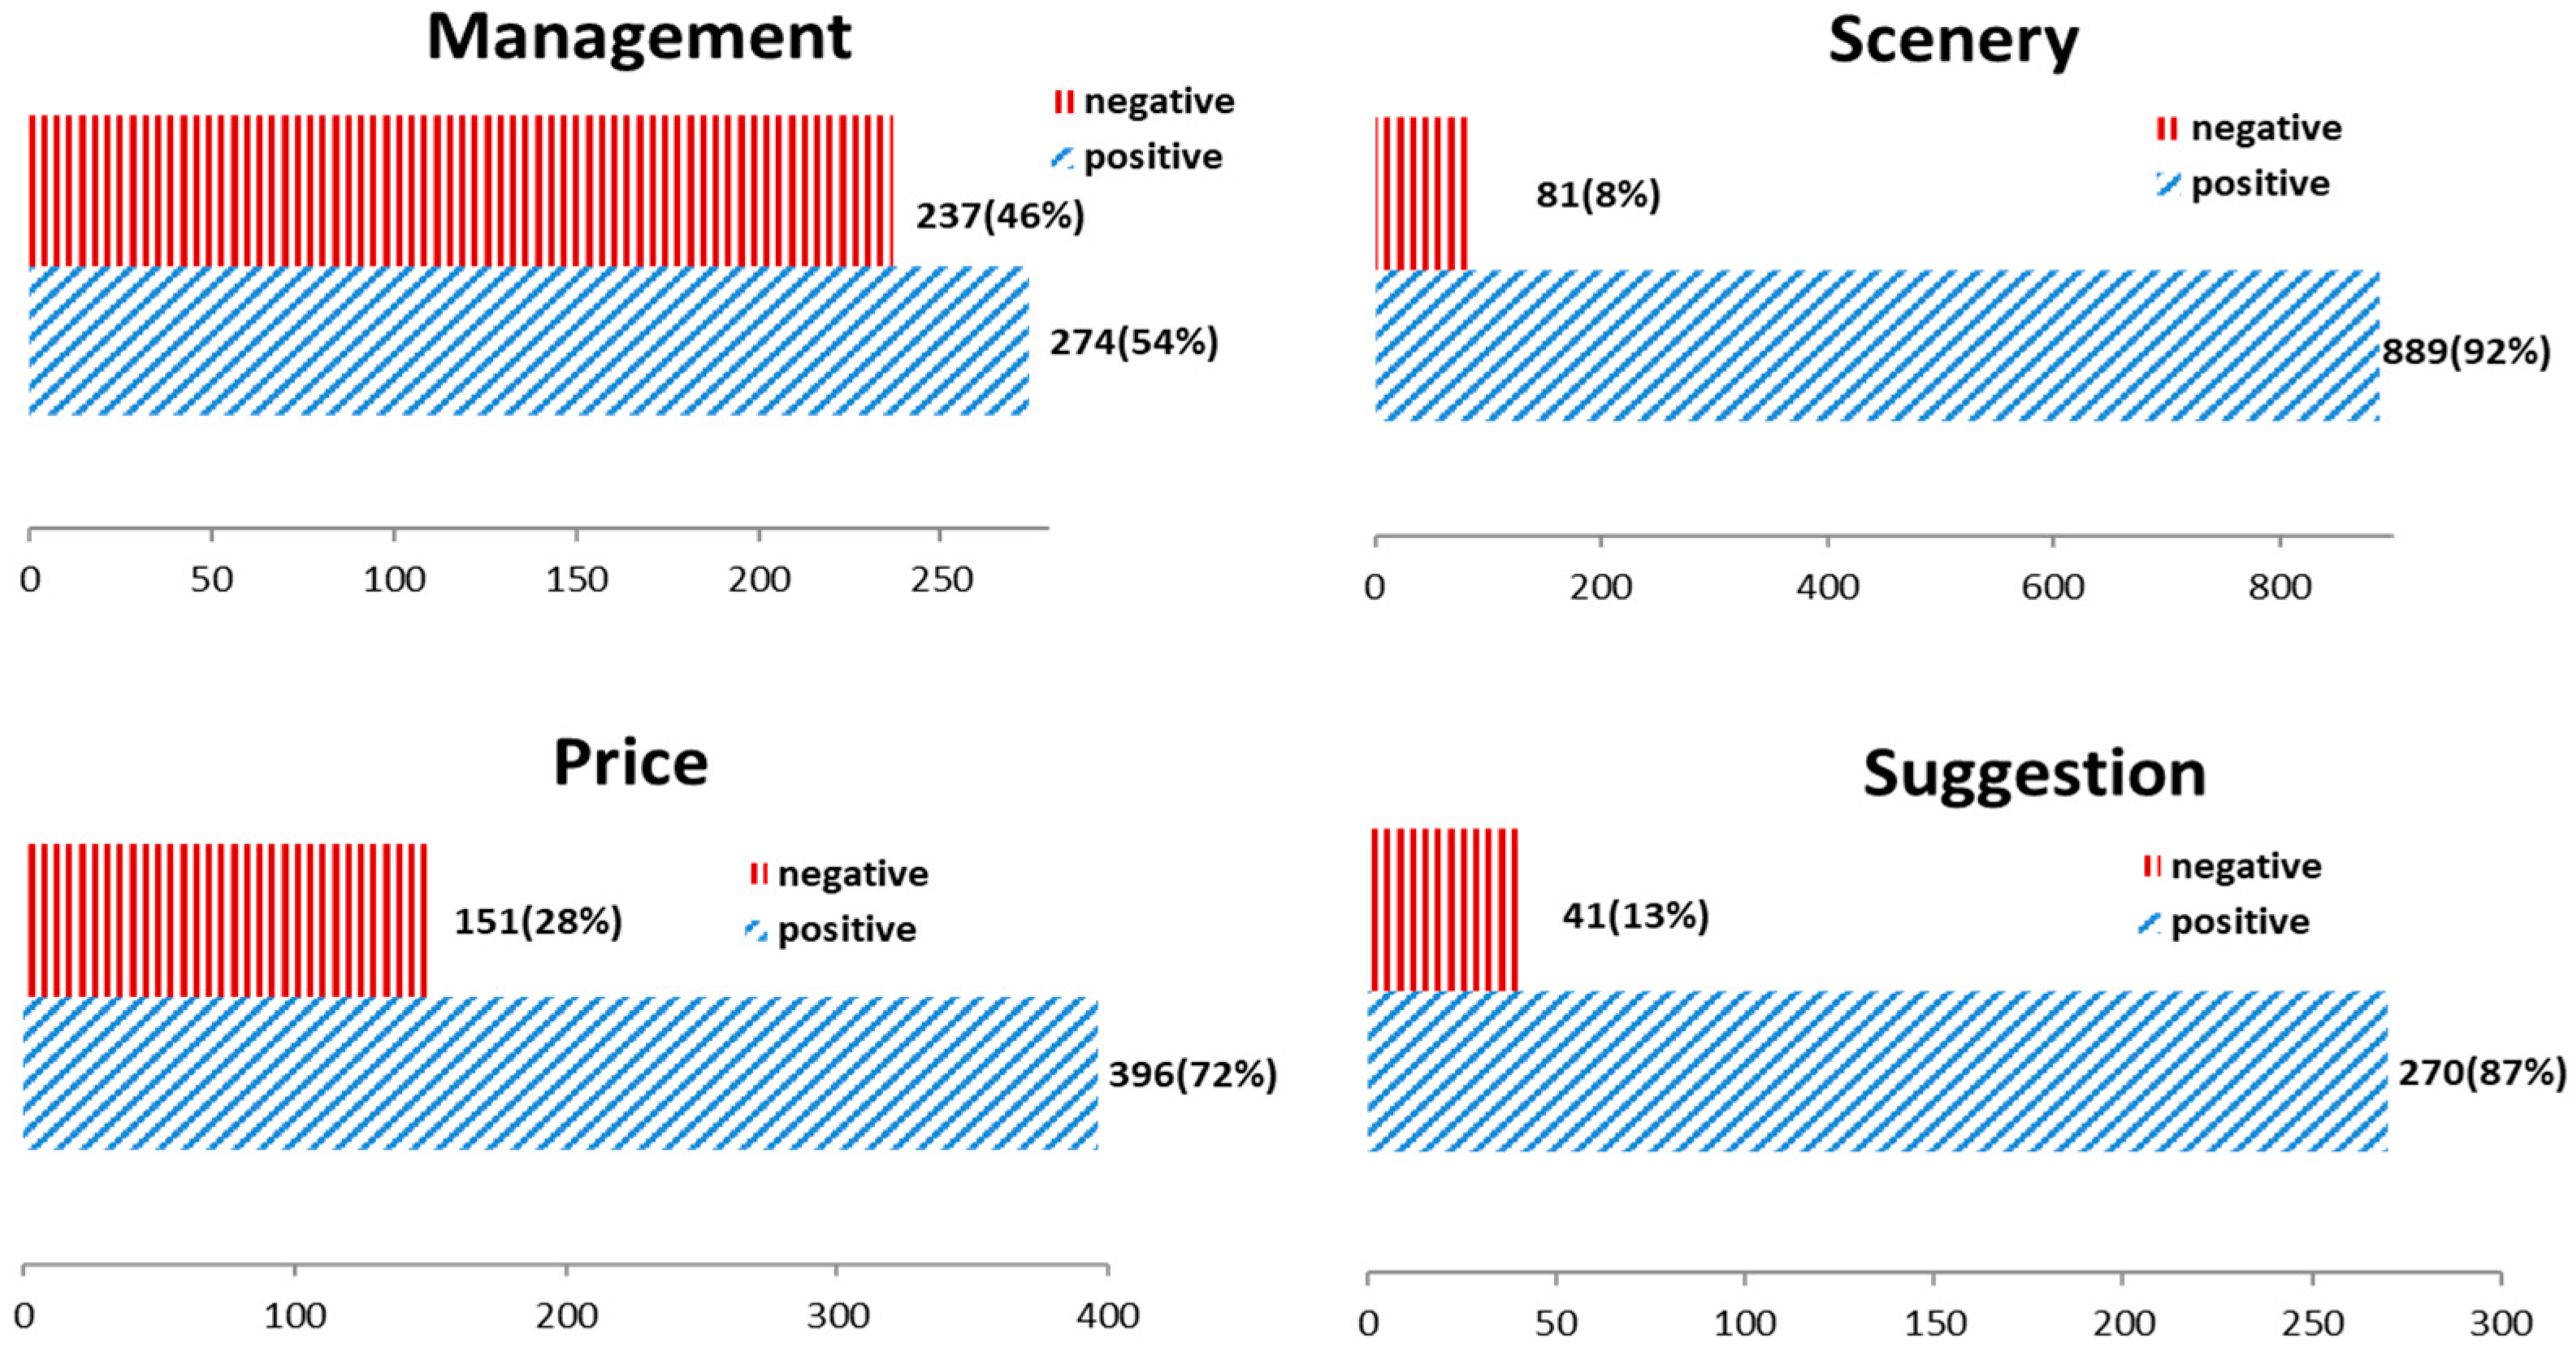
As depicted in Figure 6, “management” has the highest negative sentiment ratio (46%). Combining the extracted words in Table 5, we conclude that tourists have many complaints about attraction management components (e.g., infrastructure, queuing time, and service). “Price” also obtains a relatively high negative sentiment ratio (28%), but the ratio is lower than the “management” ratio. Consistent with the results of topic extraction, we find that people are sensitive to prices (e.g., ticket costs and extra fees). Because all our selected attractions are 5A-class attractions, the fewest number of people express negative sentiments (8%) about the scenery. As expected, “suggestion” has a relatively lower negative sentiment ratio (13%) across all topics. One explanation is that people have fewer negative sentiments when they volunteer to write about their experience, time schedule, attraction recommendations, and route selection.
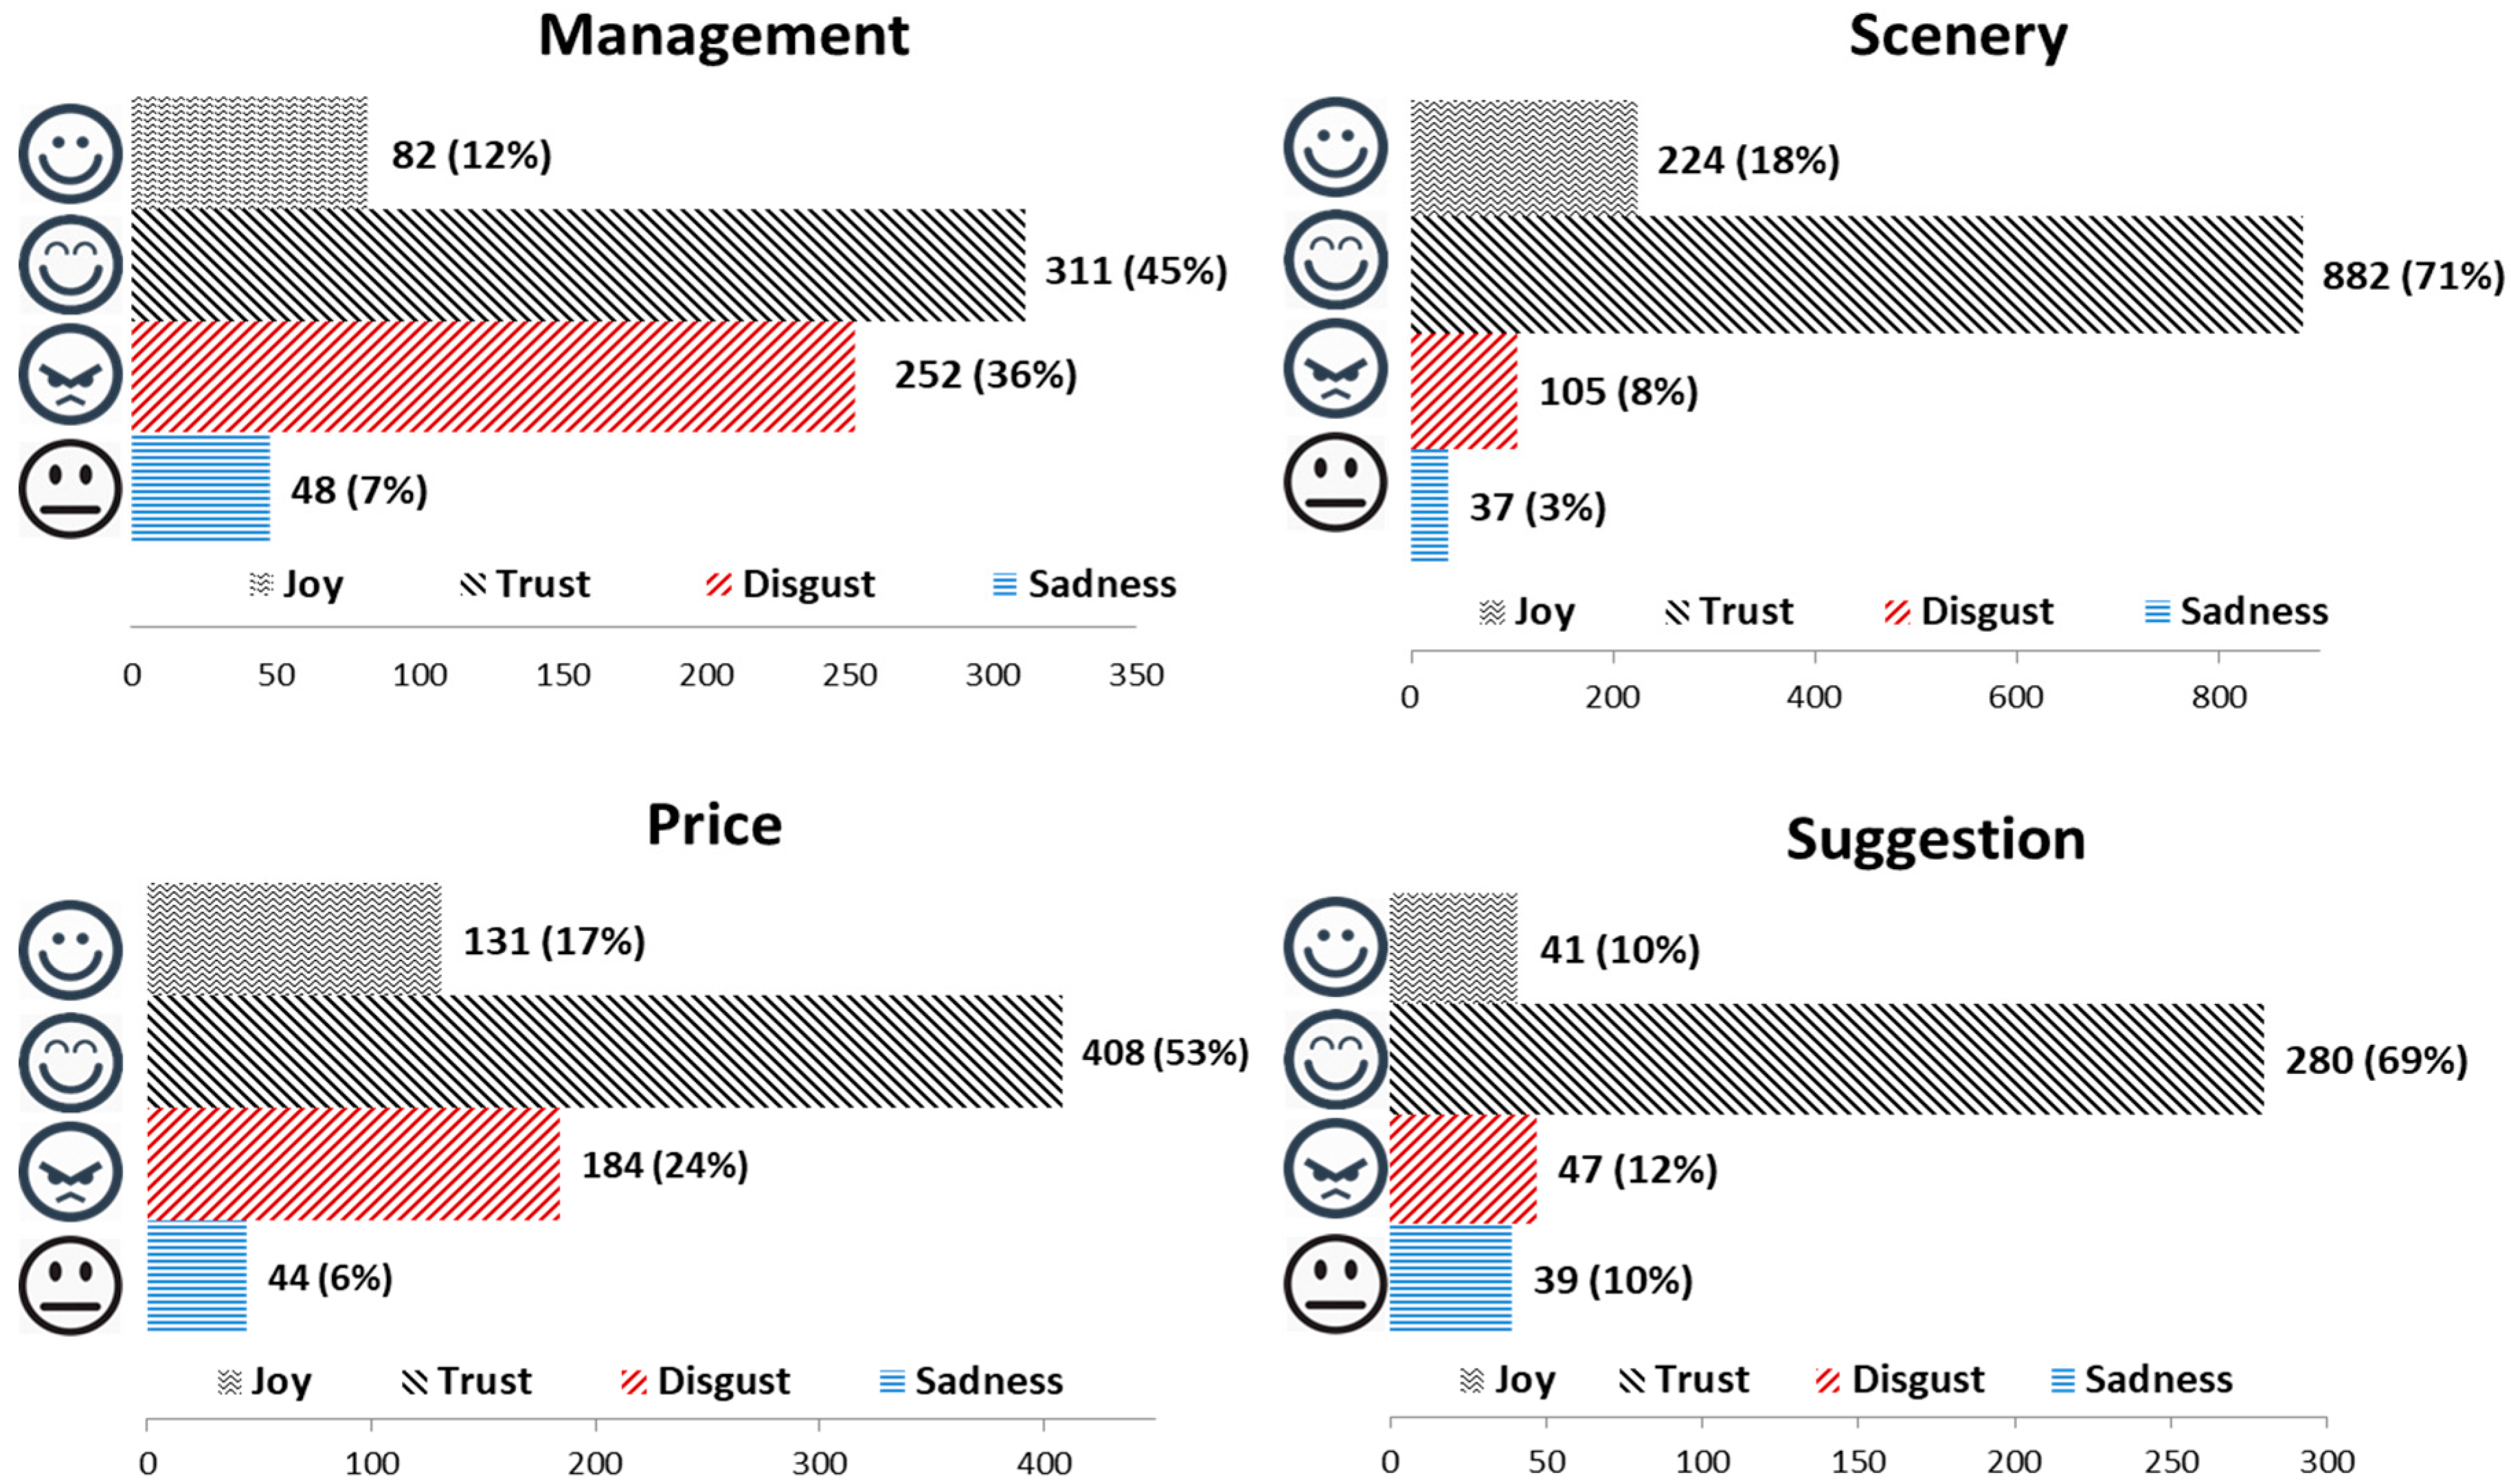
As for the emotion classification, we remove three of these emotions (anger, fear, and surprise) that occur less frequently, as they cannot be used to make a comparison across topics. For instance, when accounting the three removed emotions into the total emotions, their emotion ratios for the four topics are as follows: surprise (0.3%, 2.3%, 0.5% and, 0.5%), fear (3.7%, 1.1%, 2.9%, and 2.4%), and anger (1.4%, 0.3%, 0.4%, and 0.0%). Considering these emotions in a concrete tourism situation, “joy” refers to the enjoyment of the trip; “trust” refers to love for the scenery or praise for attractions, people, or services; “sadness” refers to regret or disappointment in the trip; and “disgust” refers to criticism, displeasure, or complaints about the attraction management, service, price, or scenery. Emotion classification is an extension of polarity classification. Comparing the results of the emotion classification, there exists a similar pattern across the four emotions for each topic, where “trust” obtains the most sentiments, and “sadness” obtains the fewest sentiments. As shown in Figure 7, “scenery” has the highest emotion ratio for “trust” (71%), which indicates that the beauty of the scenery is approved by many people. Conversely, “management” has the lowest emotion ratio for “trust” (45%), which means that some people dislike the attraction management.
The emotion lexicon defined the related words for each emotion. Combined with the extracted words in each topic and the distinct definition of each emotion in the emotion lexicon, we evaluated each topic according to its emotion ratio. For instance, because the results showed that “management” obtained the largest “disgust” ratio, combing with its distinctive words (i.e., “queue”, “cableway”, “hour”, “service”, and “cable car”), we interpreted that more people expressed their complaints on attraction management. Consistent with the result of the polarity classification, “management” has the maximum emotion ratio for “disgust” (36%). This is followed by “price”, with an emotion ratio of 24%. This result is consistent with the results of topic extraction, in which many people express complaints about “management” and “price”. Interestingly, the fewest people express “sadness” emotions (e.g., regret, disappointment), with regard to the “scenery” (3%). However, “suggestion” has a slightly higher emotion ratio for “sadness” (10%) than the other topics. When tourists write reviews with suggestions, they also express their disappointment or regret in the trip.
Taken together, because of insufficient management, tourists have expressed complaints about the management and the price, which should receive considerable attention. From the perspective of attraction management, managers should carefully control the daily capacity so as to shorten queuing time and ensure service quality. Furthermore, the management of prices (e.g., ticket costs, extra fees, and arbitrary charges) can be improved upon.
5. Discussion and Conclusions
This study proposes a topic-based sentiment analysis approach to analyze sentiments and emotions for the extracted topics, while the polarity and emotion classification of reviews for each topic is applied. The contributions are elaborated upon as follows. (1) Existing topic-based sentiment analysis studies are used to extract topics [14,15,16,17] or polarity classification [12,13]. However, the existing polarity classification methods at the topic level have focused on using entire reviews. One efficient method is imperative when processing a large volume of data. Exploring useful insights over topics is more important. Therefore, the proposed polarity classification in this study classifies the sentiments using the reviews that are focused on one or two topics, whereas the previous methods of polarity classification utilize the entire reviews. We assign the reviews to the specific topics extracted from the reviews according to an employed threshold value, determined by the distribution of the document-topic probabilities. Moreover, this method is to compare the negative sentiments over the topics rather than the classification itself. For instance, we compare the negative sentiment ratio of each topic to compare the tourist complaints over topics; (2) In particular, to our knowledge, the topic-based sentiment analysis for the emotion classification method used in this study is the first to analyze emotions at the topic level. Previous emotion classification methods [30,31] were based on the document or sentence level and focused on the classification itself, without an in-depth analysis of these emotions. However, this study helps to classify sentiments into specific emotions (e.g., trust, joy, sadness, and disgust) over topics and facilitates an understanding of customer emotions after classifications. Because emotions affect customer satisfaction significantly [59], emotion classification at the topic level seems to be more necessary and important. For instance, this study analyzes tourist complaints over topics by using the “disgust” ratio, obtained from an emotion classification. Compared to the polarity classification, the emotion classification is more specific, because some emotions (e.g., surprise and fear) may not refer to tourist complaints; (3) This study provides us with a research framework that can make most of the outcomes (word-topic matrix, document-topic matrix) of the LDA model. For instance, the word-topic matrix is used to extract top words of each topic and provide each word with relative weight, while the document-topic matrix helps us to assign the reviews that are focused on one or two topics to specific topics; (4) Because our method is based on an emotion lexicon, it increases the generalization and enables this method to be applied to many domains. More specifically, our proposed method can not only be applied to tourist reviews, but also can be applied to all online reviews from different platforms (e.g., Amazon, TripAdvisor, and Yelp). Meanwhile, given an appropriate emotion lexicon, this method can also be applied to analyze different online reviews using different languages (e.g., English).
The findings of this study have several valuable implications for managerial practice. First, from the perspective of potential tourists, we present the relative importance of topics and their related keywords using an LDA model. Because of the reliability of the data-driven analysis method, potential tourists can easily learn more about the attractions from a more comprehensive perspective. Second, from the perspective of attraction managers, we conducted polarity and emotion classifications at the topic level to analyze sentiments or emotions, which help to identify urgent issues. The results can provide attraction managers with knowledge of urgent issues. Third, managers can easily detect the tourists’ complaints for specific topics using our proposed approach. For example, tourists complain that the attractions are too crowded and it takes a very long time to see the sights. Attraction mangers can make an alternative solution to protect the natural environment by implementing separate waste collection. In addition, he/she utilizes crowd-control to reduce the unnecessary destruction of natural resources for the attractions’ sustainable management. Furthermore, this method can be applied to the modeling of real-time customer complaints on each extracted topic.
Nevertheless, this study has some limitations. First, the LDA model is based on the assumption that each tourist review is assumed to be a “bag-of-words” document. LDA may not obtain a desirable performance when applied to short documents [60]. Second, selecting a globally optimal topic number to train the LDA model is difficult. Third, in this study, we only analyzed four of the seven emotions in the lexicon. There may be a need to analyze all seven emotions when applied to a large volume of data. Moreover, there may be a problem with the matching between the net words and the sentiment lexicon DUTSD. An updated lexicon can help to mitigate this problem but cannot avoid it. The DUTSD has included 498 negation terms (e.g., “not good” and “not appropriate”) out of a total of 27,462 terms. It is recommended to use an updated lexicon for those negation terms that are not included in the DUTSD. In future studies, we recommend collecting more tourist reviews to conduct a topic-based sentiment analysis using a more well-defined and updated sentiment lexicon. In addition, work should be done to find an optimal K value from a broader interval to refine the performance.
Acknowledgments
This work was supported by the Ministry of Education of the Republic of Korea and the National Research Foundation of Korea (NRF-2016S1A3A2925146).
Author Contributions
Gang Ren and Taeho Hong conceived and designed the experiments; Gang Ren performed the experiments and analyzed the data; Gang Ren and Taeho Hong wrote the paper. All of authors contributed to read and approved the final manuscript.
Conflicts of Interest
The authors declare no conflicts of interest.
References
- Chevalier, J.A.; Mayzlin, D. The Effect of Word of Mouth on Sales: Online Book Reviews. J. Mark. Res. 2006, 43, 345–354. [Google Scholar] [CrossRef]
- Duan, W.; Gu, B.; Whinston, A.B. The dynamics of online word-of-mouth and product sales—An empirical investigation of the movie industry. J. Retail. 2008, 84, 233–242. [Google Scholar] [CrossRef]
- Hu, N.; Bose, I.; Gao, Y.; Liu, L. Manipulation in digital word-of-mouth: A reality check for book reviews. Decis. Support Syst. 2011, 50, 627–635. [Google Scholar] [CrossRef]
- Ye, Q.; Law, R.; Gu, B. The impact of online user reviews on hotel room sales. Int. J. Hosp. Manag. 2009, 28, 180–182. [Google Scholar] [CrossRef]
- Spool, J.M. The Magic Behind Amazon’s 2.7 Billion Dollar Question. Available online: https://articles.uie.com/magicbehindamazon/ (accessed on 5 June 2017).
- Xiang, Z.; Gretzel, U. Role of social media in online travel information search. Tour. Manag. 2010, 31, 179–188. [Google Scholar] [CrossRef]
- Sun, M.; Ryan, C.; Pan, S. Using Chinese Travel Blogs to Examine Perceived Destination Image: The Case of New Zealand. J. Travel Res. 2015, 54, 543–555. [Google Scholar] [CrossRef]
- Mak, A.H.N. Online destination image: Comparing national tourism organisation’s and tourists’ perspectives. Tour. Manag. 2017, 60, 280–297. [Google Scholar] [CrossRef]
- Crompton, J.L. An Assessment of the Image of Mexico as a Vacation Destination and the Influence of Geographical Location Upon That Image. J. Travel Res. 1979, 17, 18–23. [Google Scholar] [CrossRef]
- Lin, C.; He, Y. Joint sentiment/topic model for sentiment analysis. In Proceedings of the 18th ACM Conference on Information and Knowledge Management, Hong Kong, China, 2–6 November 2009; pp. 375–384. [Google Scholar]
- Xianghua, F.; Guo, L.; Yanyan, G.; Zhiqiang, W. Multi-aspect sentiment analysis for Chinese online social reviews based on topic modeling and HowNet lexicon. Knowl.-Based Syst. 2013, 37, 186–195. [Google Scholar] [CrossRef]
- Nguyen, T.H.; Shirai, K.; Velcin, J. Sentiment analysis on social media for stock movement prediction. Expert Syst. Appl. 2014, 42, 9603–9611. [Google Scholar] [CrossRef]
- Hu, M.; Liu, B. Mining and summarizing customer reviews. In Proceedings of the Tenth ACM SIGKDD International Conference on Knowledge Discovery and Data Mining, KDD’04, Seattle, WA, USA, 22–25 August 2004; Volume 4, p. 168. [Google Scholar]
- Marrese-Taylor, E.; Velásquez, J.D.; Bravo-Marquez, F. A novel deterministic approach for aspect-based opinion mining in tourism products reviews. Expert Syst. Appl. 2014, 41, 7764–7775. [Google Scholar] [CrossRef] [Green Version]
- Xiang, Z.; Du, Q.; Ma, Y.; Fan, W. A comparative analysis of major online review platforms: Implications for social media analytics in hospitality and tourism. Tour. Manag. 2017, 58, 51–65. [Google Scholar] [CrossRef]
- Guo, Y.; Barnes, S.J.; Jia, Q. Mining meaning from online ratings and reviews: Tourist satisfaction analysis using latent dirichlet allocation. Tour. Manag. 2017, 59, 467–483. [Google Scholar] [CrossRef]
- Pearce, P.L.; Wu, M.-Y. Entertaining International Tourists: An Empirical Study of an Iconic Site in China. J. Hosp. Tour. Res. 2015, XX, 1–21. [Google Scholar] [CrossRef]
- Liu, B. Sentiment Analysis: Mining Opinions, Sentiments, and Emotions, 1st ed.; Cambridge University Press: New York, NY, USA, 2015. [Google Scholar]
- Rozin, P.; Royzman, E.B. Negativity Bias, Negativity Dominance, and Contagion Paul. Personal. Soc. Psychol. Rev. 2001, 5, 296–320. [Google Scholar] [CrossRef]
- Baumeister, R.F.; Bratslavsky, E.; Finkenauer, C.; Vohs, K.D. Bad is stronger than good. Rev. Gen. Psychol. 2001, 5, 323–370. [Google Scholar] [CrossRef]
- Blei, D.M.; Edu, B.B.; Ng, A.Y.; Edu, A.S.; Jordan, M.I.; Edu, J.B. Latent Dirichlet Allocation. J. Mach. Learn. Res. 2003, 3, 993–1022. [Google Scholar]
- Li, N.; Wu, D. Using text mining and sentiment analysis for online forums hotspot detection and forecast. Decis. Support Syst. 2010, 48, 354–368. [Google Scholar] [CrossRef]
- Pang, B.; Lee, L.; Vaithyanathan, S. Thumbs up?: Sentiment classification using machine learning techniques. In Proceedings of the ACL-02 Conference on Empirical Methods in Natural Language Processing, Stroudsburg, PA, USA, 6–7 July 2002; pp. 79–86. [Google Scholar]
- Liu, B. Sentiment Analysis and Opinion Mining. Synth. Lect. Hum. Lang. Technol. 2012, 5, 1–167. [Google Scholar] [CrossRef]
- Moraes, R.; Valiati, J.F.; Gavião Neto, W.P. Document-level sentiment classification: An empirical comparison between SVM and ANN. Expert Syst. Appl. 2013, 40, 621–633. [Google Scholar] [CrossRef]
- Tan, S.; Zhang, J. An empirical study of sentiment analysis for chinese documents. Expert Syst. Appl. 2008, 34, 2622–2629. [Google Scholar] [CrossRef]
- Mehrabian, A.; Russell, J.A. An Approach to Environmental Psychology; MIT Press: Cambridge, CA, USA, 1974; Volume 315. [Google Scholar]
- Plutchik, R. Emotion: A Psychoevolutionary Synthesis; Harper and Row: Manhattan, NY, USA, 1980. [Google Scholar]
- Mishne, G. Experiments with mood classification in blog posts. In Proceedings of the ACM SIGIR Workshop on Stylistic Analysis of Text for Information Access, Salvador, Brazil, 15-19 August 2005; pp. 321–327. [Google Scholar]
- Yang, C.; Lin, K.; Chen, H.-H. Emotion Classification Using Web Blog Corpora. In Proceedings of the IEEE/WIC/ACM International Conference on Web Intelligence, Fremont, CA, USA, 2–5 November 2007. [Google Scholar]
- Lin, K.H.Y.; Yang, C.; Chen, H.H. Emotion classification of online news articles from the reader’s perspective. In Proceedings of the 2008 IEEE/WIC/ACM International Conference on Web Intelligence and Intelligent Agent Technology, WI-IAT’08, Sydney, Australia, 9–12 December 2008; pp. 220–226. [Google Scholar]
- Tokuhisa, R.; Matsumoto, Y. Emotion Classification Using Massive Examples Extracted from the Web. In Proceedings of the 22nd International Conference on Computational Linguistics, Manchester, UK, 18–22 August 2008; pp. 881–888. [Google Scholar]
- Chaumartin, F.-R. UPAR7: A knowledge-based system for headline sentiment tagging. In Proceedings of the 4th International Workshop on Semantic Evaluations, Prague, Czech Republic, 23–24 June 2007; pp. 422–425. [Google Scholar]
- Al Masum, S.M.; Prendinger, H.; Ishizuka, M. Emotion Sensitive News Agent: An Approach Towards User Centric Emotion Sensing from the News. In Proceedings of the IEEE/WIC/ACM International Conference on Web Intelligence, Fremont, CA, USA, 2–5 November 2007; pp. 614–620. [Google Scholar]
- Li, W.; Xu, H. Text-based emotion classification using emotion cause extraction. Expert Syst. Appl. 2014, 41, 1742–1749. [Google Scholar] [CrossRef]
- Zhang, Z.; Ye, Q.; Zhang, Z.; Li, Y. Sentiment classification of Internet restaurant reviews written in Cantonese. Expert Syst. Appl. 2011, 38, 7674–7682. [Google Scholar]
- Kang, H.; Yoo, S.J.; Han, D. Senti-lexicon and improved Naïve Bayes algorithms for sentiment analysis of restaurant reviews. Expert Syst. Appl. 2012, 39, 6000–6010. [Google Scholar] [CrossRef]
- Choi, S.; Lehto, X.Y.; Morrison, A.M. Destination image representation on the web: Content analysis of Macau travel related websites. Tour. Manag. 2007, 28, 118–129. [Google Scholar] [CrossRef]
- Levy, S.E.; Duan, W.; Boo, S. An Analysis of One-Star Online Reviews and Responses in the Washington, D.C., Lodging Market. Cornell Hosp. Q. 2013, 54, 49–63. [Google Scholar] [CrossRef]
- Ariyasriwatana, W.; Quiroga, L.M. A thousand ways to say “Delicious!” Categorizing expressions of deliciousness from restaurant reviews on the social network site Yelp. Appetite 2016, 104, 18–32. [Google Scholar] [CrossRef] [PubMed]
- Liu, Z.; Park, S. What makes a useful online review? Implication for travel product websites. Tour. Manag. 2015, 47, 140–151. [Google Scholar] [CrossRef] [Green Version]
- Bucur, C. Using Opinion Mining Techniques in Tourism. Procedia Econ. Financ. 2015, 23, 1666–1673. [Google Scholar] [CrossRef]
- Hu, Y.-H.; Chen, Y.-L.; Chou, H.-L. Opinion mining from online hotel reviews—A text summarization approach. Inf. Process. Manag. 2017, 53, 436–449. [Google Scholar] [CrossRef]
- Hu, Y.H.; Chen, K. Predicting hotel review helpfulness: The impact of review visibility, and interaction between hotel stars and review ratings. Int. J. Inf. Manag. 2016, 36, 929–944. [Google Scholar] [CrossRef]
- Farhadloo, M.; Patterson, R.A.; Rolland, E. Modeling Customer Satisfaction from Unstructured Data Using A Bayesian Approach. Decis. Support Syst. 2016, 90, 1–11. [Google Scholar] [CrossRef]
- Cenni, I.; Goethals, P. Negative hotel reviews on TripAdvisor: A cross-linguistic analysis. Discourse Context Media 2017, 16, 22–30. [Google Scholar] [CrossRef]
- Rosenberg, S.D.; Schnurr, P.P.; Oxman, T.E. Content Analysis: A Comparison of Manual and Computerized Systems. J. Personal. Assess. 1990, 54, 298–310. [Google Scholar]
- Dong, Z.; Dong, Q. HowNet—A hybrid language and knowledge resource. In Proceedings of the 2003 International Conference on Natural Language Processing and Knowledge Engineering, NLP-KE 2003, Beijing, China, 26–29 October 2003; pp. 820–824. [Google Scholar]
- Blei, D.M. Introduction to Probabilistic Topic Modeling. Commun. ACM 2012, 55, 77–84. [Google Scholar] [CrossRef]
- Maskeri, G.; Sarkar, S.; Heafield, K. Mining business topics in source code using latent dirichlet allocation. In Proceedings of the 1st India Software Engineering Conference—ISEC’08, Hyderabad, India, 19–22 February 2008; p. 113. [Google Scholar]
- Shi, Z.; Lee, G.; Whinston, A.B. Toward A Better Measure of Business Proximity: Topic Modeling for Industry Intelligence. MIS Q. 2016, 40, 1035–1056. [Google Scholar] [CrossRef]
- Alam, M.H.; Ryu, W.J.; Lee, S.K. Joint multi-grain topic sentiment: Modeling semantic aspects for online reviews. Inf. Sci. 2016, 339, 206–223. [Google Scholar] [CrossRef]
- Hindle, A.; Ernst, N.A.; Godfrey, M.W.; Mylopoulos, J. Automated Topic Naming to Support Cross-project Analysis of Software Maintenance Activities. In Proceedings of the 8th Working Conference on Mining Software Repositories, Honolulu, HI, USA, 21–22 May 2011; pp. 163–172. [Google Scholar]
- Xu, L.; Lin, H.; Pan, Y.; Ren, H.; Chen, J. Constructing the Affective Lexicon Ontology. J. China Soc. Sci. Tech. Inf. 2008, 27, 180–185. [Google Scholar]
- Liu, S.M.; Chen, J.-H. A multi-label classification based approach for sentiment classification. Expert Syst. Appl. 2015, 42, 1083–1093. [Google Scholar] [CrossRef]
- Gao, K.; Su, S.; Wang, J.S. A sentiment analysis hybrid approach for microblogging and E-commerce corpus. In Proceedings of the 2015 7th International Conference on Modelling, Identification and Control (ICMIC), Sousse, Tunisia, 18–20 December 2015; pp. 3–8. [Google Scholar]
- Beerli, A.; Martin, J.D. Factors influencing destination image. Ann. Tour. Res. 2004, 31, 657–681. [Google Scholar] [CrossRef]
- Chi, C.G.Q.; Qu, H. Examining the structural relationships of destination image, tourist satisfaction and destination loyalty: An integrated approach. Tour. Manag. 2008, 29, 624–636. [Google Scholar] [CrossRef]
- Westbrook, R.A.; Oliver, R. The Dimensionality of Consumption Emotion Pattems and Consumer Satisfaction. J. Consum. Res. 1991, 18, 84–91. [Google Scholar] [CrossRef]
- Jin, Q.; Liu, N.N.; Bay, C.W.; Kong, H.; Zhao, K. Transferring Topical Knowledge from Auxiliary Long Texts for Short Text Clustering. In Proceedings of the 20th ACM International Conference on Information and Knowledge Management, Scotland, UK, 24–28 October 2011; pp. 775–784. [Google Scholar]
Figure 1.
Research framework.
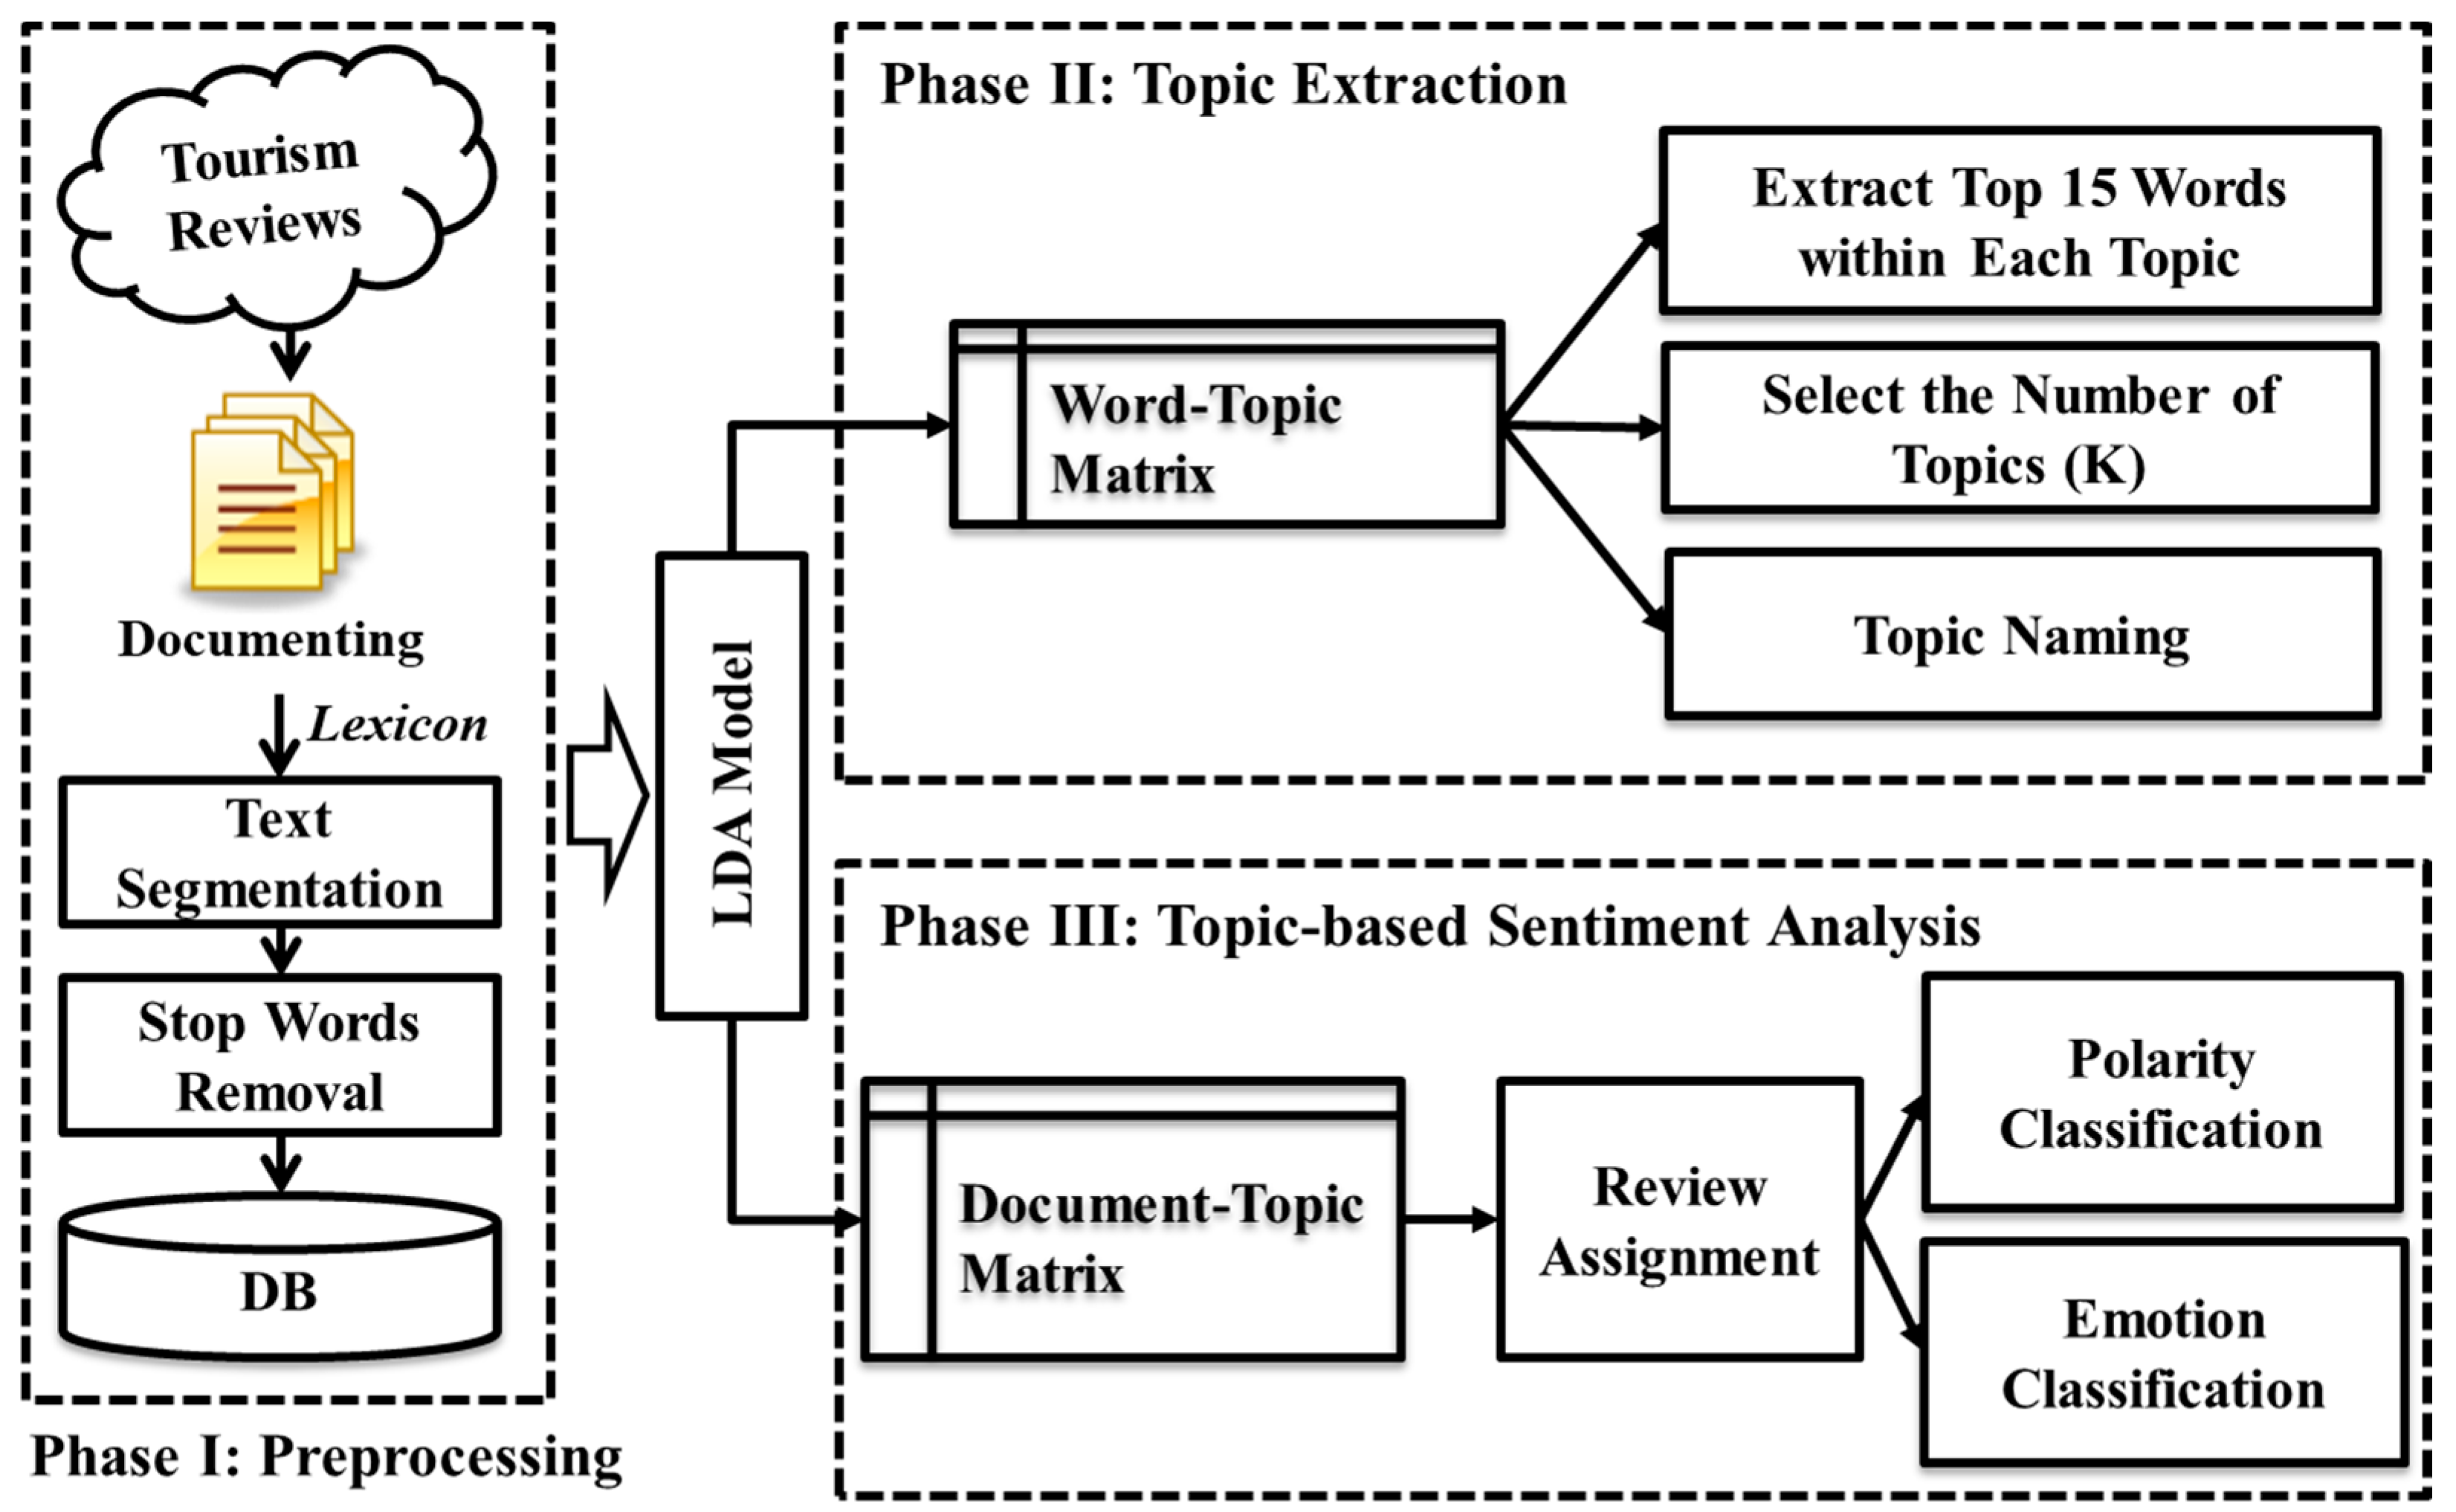
Figure 2.
Examples of reviews on Ctrip.com.
Figure 2.
Examples of reviews on Ctrip.com.

Figure 3.
Latent topic generative example [21].
Figure 3.
Latent topic generative example [21].

Figure 4.
Topic extraction process of Latent Dirichlet Allocation model (adapted from Blei [49]).
Figure 4.
Topic extraction process of Latent Dirichlet Allocation model (adapted from Blei [49]).

Figure 5.
Document-topic probability distribution for each topic.
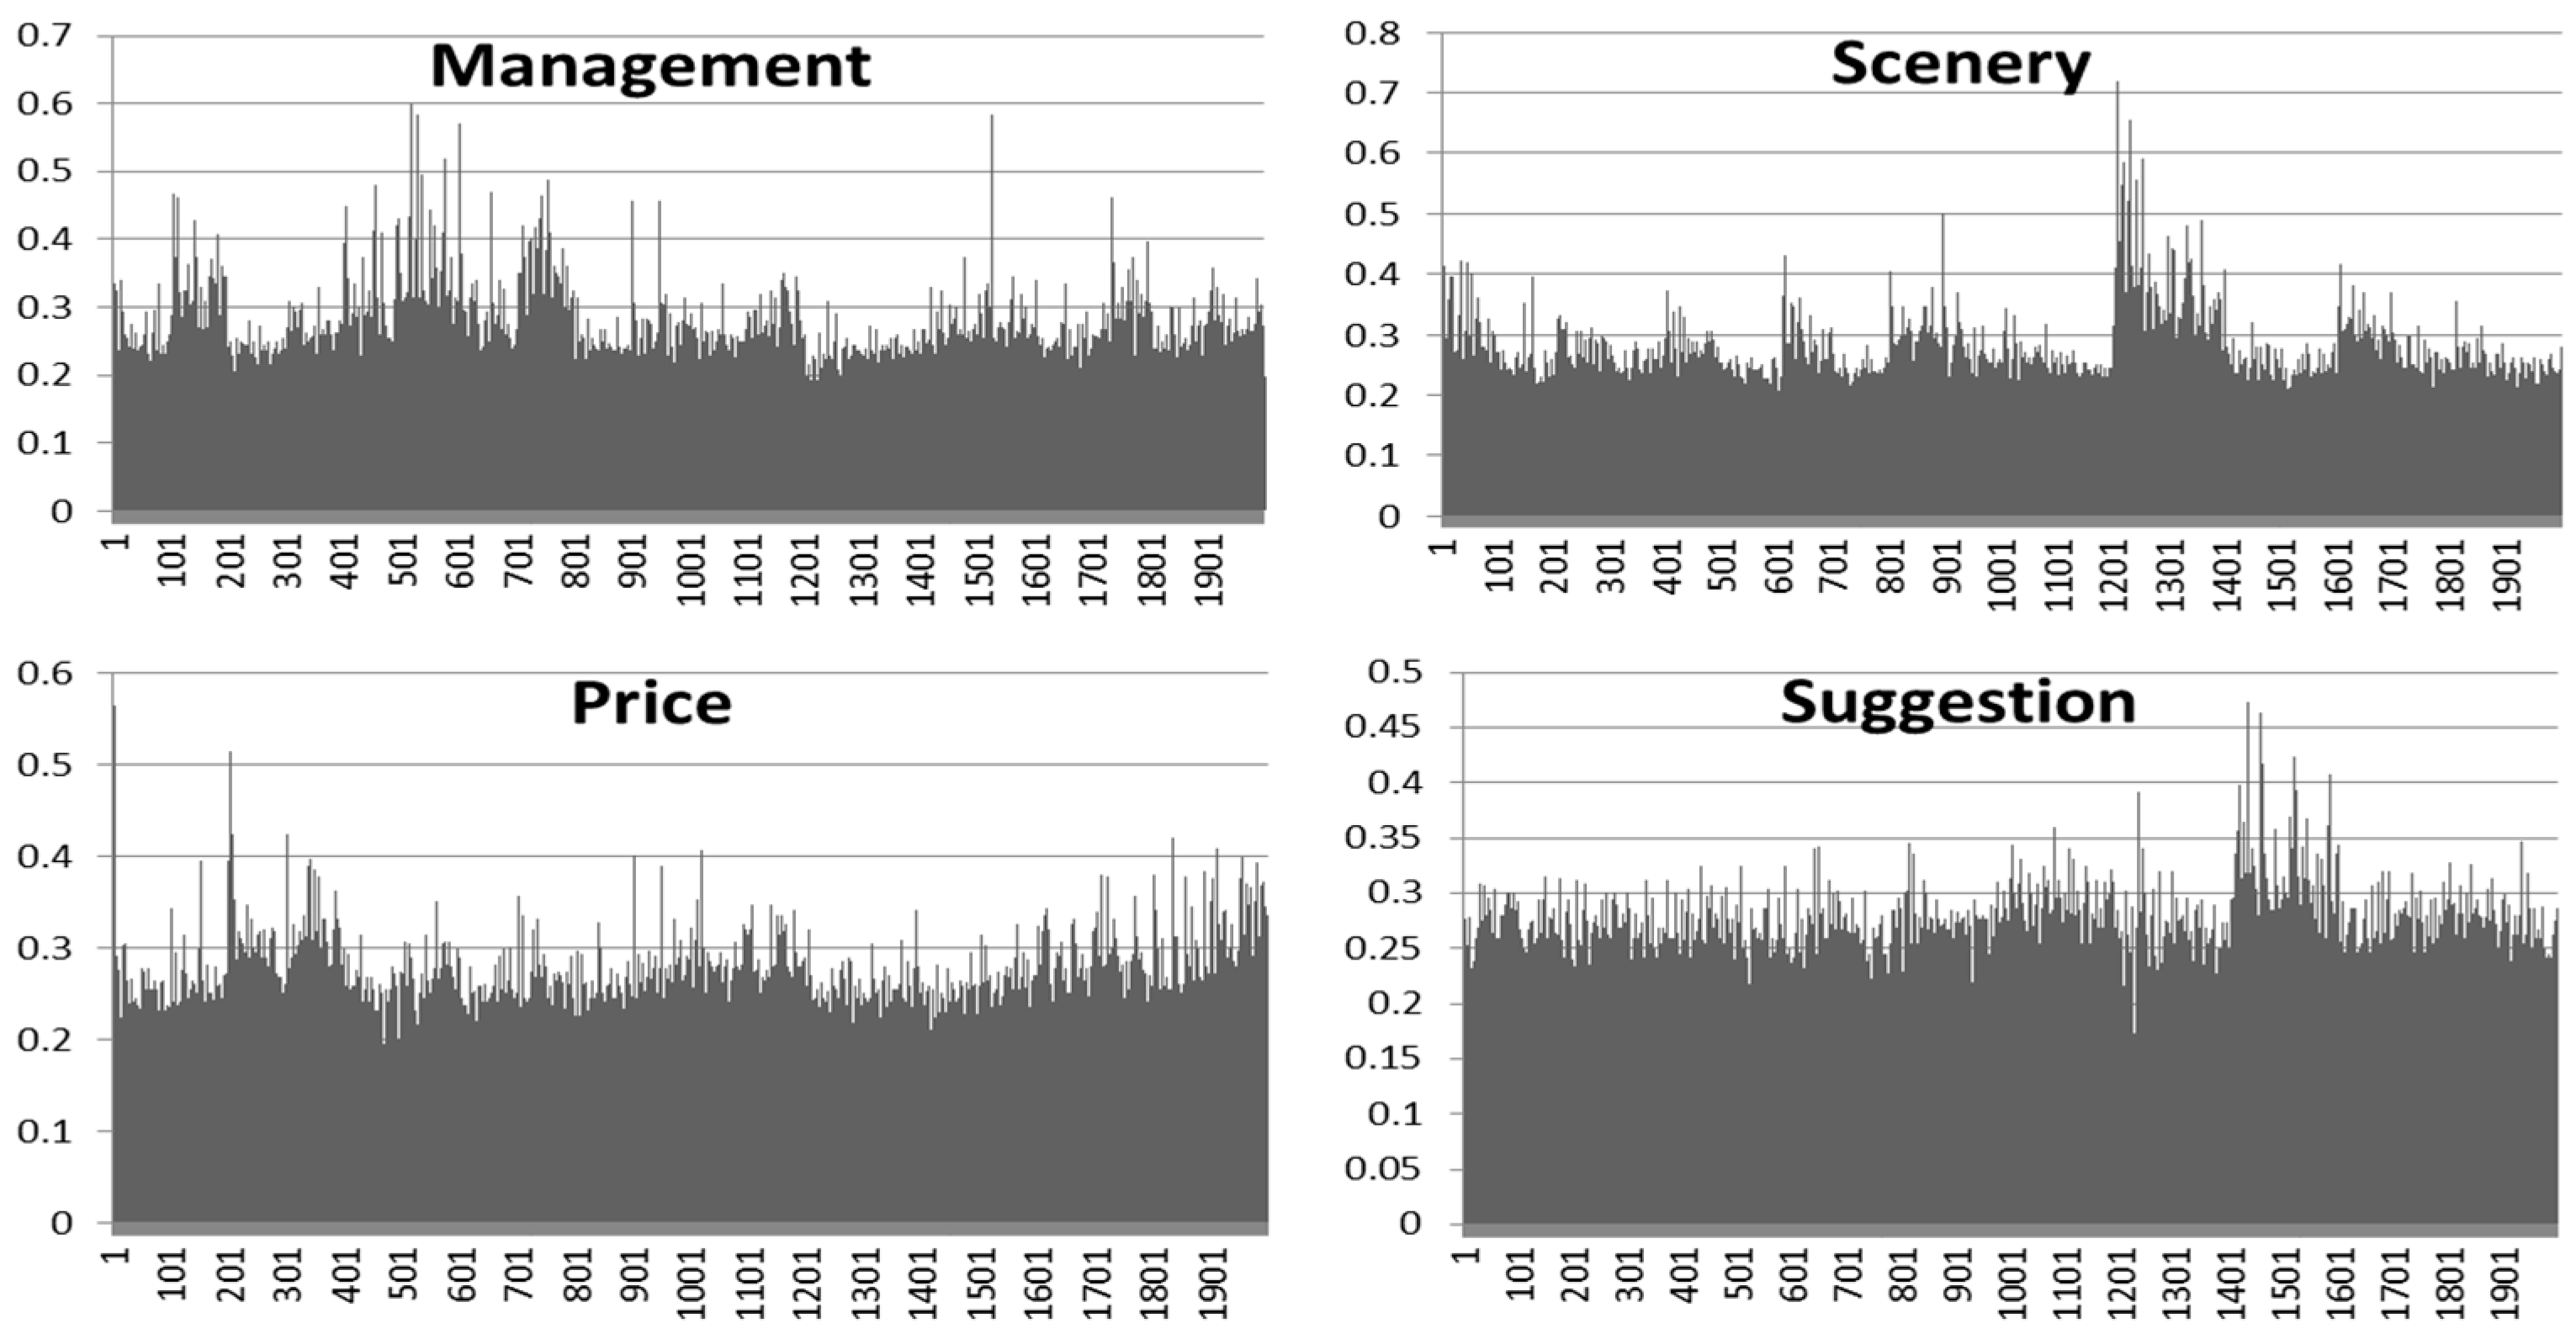
Figure 6.
Polarity frequency for the topics.

Figure 7.
Emotion frequency for the topics.


Table 1.
Previous studies on online travel reviews using text mining.
| Type | Concept | Study | Data 1 | Method 2 |
|---|---|---|---|---|
| Content analysis | Refers to the process that quantifies or qualifies the unstructured text data. | Choi et al. (2007) [38] | 81 sites | Identifies the words frequently used in each of five sub-categories of websites. |
| Levy et al. (2013) [39] | T | Extracts hotel complaints using one-star reviews | ||
| Ariyasriwatana and Quiroga (2016) [40] | Y | Explores expressions of deliciousness | ||
| Liu and Park (2015) [41] | Y | Examines the effect of review content features on helpfulness | ||
| Document-based sentiment analysis | Refers to the process that analyzes sentiments or emotions at the document level. | Zhang et al. (2011) [36] | - | Performs a polarity classification using SVM and NB |
| Kang et al. (2012) [37] | - | Proposes a polarity classification approach based on senti-lexicon and NB | ||
| Hu et al. (2017) [43] | T | Identifies the most informative sentences using a multi-text summarization technique | ||
| Bucur (2015) [42] | T | Performs polarity classifications based on a lexicon | ||
| Hu and Chen (2016) [44] | T | Uses review sentiment features to predict helpfulness. | ||
| Topic-based sentiment analysis | Refers to the process of topic extraction and analyzing sentiments and emotions at the topic level | Pearce and Wu (2015) [17] | T | Extracts tourism topics of attraction by a thematic and semantic analysis |
| Marrese-Taylor et al. (2014) [14] | T | Proposes a deterministic rule for word and sentiment orientation | ||
| Farhadloo et al. (2016) [45] | T | Extracts topics using a Bayesian approach | ||
| Xiang et al. (2017) [15] | T, E, Y | Extracts topics on three platforms using an LDA model | ||
| Cenni and Goethals (2017) [46] | T | Examines the divergence over topics written in different languages using a Cross-linguistic analysis approach | ||
| Guo et al. (2017) [16] | T | Extracts hotel topics using an LDA model |
1 Data: T, TripAdvisor; Y, Yelp; E, Expedia. 2 Note: SVM, Support Vector Machines; NB, Naïve Bayes; LDA, Latent Dirichlet Allocation.
Table 2.
Descriptive statistics for the word count of each review (words).
| Reviews | Number of Reviews | Mean | Maximum | Minimum |
|---|---|---|---|---|
| Positive reviews | 1000 | 87 | 1055 | 6 |
| Negative reviews | 1000 | 85 | 687 | 15 |
| Total reviews | 2000 | 86 | 1055 | 6 |
Table 3.
Related works on topic naming method.
| Topic Naming Method | Study |
|---|---|
| Topics are named manually by summarizing the meaning of frequent words or assigning a topic from the predefined topics | Maskeri et al. (2008) [50]; Xianghua et al. (2013) [11]; Shi et al. (2016) [51]; Alam et al. (2016) [52]; Xiang et al. (2017) [15]; Guo et al. (2017) [16] |
| Topics are named automatically based on supervised learning and a user-defined word-list | Hindle et al. (2011) [53] |
Table 4.
Topic Summary with K (the number of topics) = 3.
| Top 15 Words and Corresponding Weights 1 | |||||
|---|---|---|---|---|---|
| Topic 1. Management 0.2177 | |||||
| attraction | 0.0445 | time | 0.0212 | suggest | 0.0190 |
| hour | 0.0174 | tourist | 0.0153 | hotel | 0.0120 |
| queue | 0.0115 | guide | 0.0114 | cableway | 0.0114 |
| service | 0.0106 | cable car | 0.0101 | visit | 0.0095 |
| charged | 0.0081 | beauty | 0.0078 | management | 0.0077 |
| Topic 2. Scenery 0.1688 | |||||
| landscape | 0.0321 | worth | 0.0296 | rape flower | 0.0136 |
| beautiful | 0.0129 | season | 0.0108 | park | 0.0084 |
| all the way | 0.0079 | best | 0.0077 | esthetical | 0.0074 |
| rental car | 0.0073 | lakeside | 0.0065 | feel | 0.0065 |
| sunrise | 0.0063 | photograph | 0.0061 | cattle | 0.0057 |
| Topic 3. Price and Scenery 0.2873 | |||||
| local | 0.0415 | scenery | 0.0412 | good | 0.0348 |
| ticket | 0.0333 | feel | 0.0280 | special | 0.0167 |
| night | 0.0105 | just so so | 0.0132 | very beautiful | 0.0134 |
| like | 0.0105 | cost-effective | 0.0094 | commercialized | 0.0092 |
| really | 0.0088 | bad | 0.0085 | a visit | 0.0081 |
1 Here, we present the original output of the LDA model according to [51].
Table 5.
Topic summary with K (the number of topics) = 4.
| Top 15 Words and Corresponding Weights 1 | ||||||
|---|---|---|---|---|---|---|
| Topic 1. Management 0.2823 | ||||||
| attraction | 0.0583 | ticket | 0.0416 | hour | 0.0228 | |
| tourist | 0.0201 | just so so | 0.0162 | hotel | 0.0157 | |
| queue | 0.0151 | cableway | 0.0150 | service | 0.0139 | |
| cable car | 0.0133 | really | 0.0110 | bad | 0.0106 | |
| management | 0.0101 | top of mountain | 0.0098 | only | 0.0088 | |
| Topic 2. Scenery 0.1345 | ||||||
| beautiful | 0.0169 | season | 0.0137 | beauty | 0.0109 | |
| best | 0.0105 | all the way | 0.0103 | esthetical | 0.0097 | |
| feel | 0.0085 | sightseeing | 0.0079 | cattle | 0.0074 | |
| clouds | 0.0069 | experience | 0.0068 | back | 0.0066 | |
| lake | 0.0063 | km | 0.0061 | blue sky | 0.0061 | |
| Topic 3. Price 0.2412 | ||||||
| local | 0.0548 | feel | 0.0371 | guide | 0.0158 | |
| night | 0.0139 | like | 0.0139 | visit | 0.0131 | |
| recommend | 0.0126 | commercialized | 0.0121 | charged | 0.0112 | |
| park | 0.0109 | disappointed | 0.0102 | feature | 0.0097 | |
| weather | 0.0089 | cheap | 0.0088 | lodge | 0.0081 | |
| Topic 4. Suggestion 0.3818 | ||||||
| scenery | 0.0568 | good | 0.0480 | worth | 0.0443 | |
| landscape | 0.0435 | time | 0.0307 | suggest | 0.0275 | |
| special | 0.0230 | beautiful | 0.0185 | rape flower | 0.0185 | |
| friends | 0.0138 | cost-effective | 0.0130 | price | 0.0128 | |
| a visit | 0.0112 | be fit for | 0.0102 | choose | 0.0100 | |
1 Here, we present the original output of the LDA model according to [51].
Table 6.
Topic summary with K (the number of topics) = 5.
| Top 15 Words and Corresponding Weights 1 | |||||
|---|---|---|---|---|---|
| Topic 1. Management 0.2781 | |||||
| time | 0.0353 | suggest | 0.0316 | ticket | 0.0303 |
| hour | 0.0290 | hotel | 0.0200 | queue | 0.0192 |
| cableway | 0.0190 | friends | 0.0165 | cable car | 0.0130 |
| top of mountain | 0.0125 | schedule | 0.0107 | downhill | 0.0107 |
| several | 0.0104 | mood | 0.0102 | sunrise | 0.0098 |
| Topic 2. Scenery 0.1673 | |||||
| beautiful | 0.0210 | season | 0.0353 | beauty | 0.0136 |
| all the way | 0.0128 | best | 0.0126 | rental car | 0.0118 |
| lakeside | 0.0106 | feel | 0.0106 | cattle | 0.0092 |
| clouds | 0.0086 | experience | 0.0084 | on the way | 0.0082 |
| natives | 0.0078 | lake | 0.0078 | km | 0.0076 |
| Topic 3. Price and Management 0.2709 | |||||
| attraction | 0.0747 | tourist | 0.0257 | ticket | 0.0226 |
| guide | 0.0192 | service | 0.0178 | visit | 0.0159 |
| bad | 0.0135 | charged | 0.0135 | management | 0.0122 |
| only | 0.0112 | two | 0.0106 | dine | 0.0087 |
| drive | 0.0085 | staff | 0.0083 | too bad | 0.0083 |
| Topic 4. Suggestion 0.3265 | |||||
| good | 0.0587 | feel | 0.0473 | special | 0.0281 |
| rape flower | 0.0226 | just so so | 0.0220 | night | 0.0177 |
| cost- effective | 0.0159 | recommend | 0.0161 | like | 0.0177 |
| commercialized | 0.0155 | really | 0.0149 | price | 0.0126 |
| be fit for | 0.0124 | feature | 0.0124 | choose | 0.0122 |
| Topic 5. Scenery 0.3921 | |||||
| local | 0.0713 | scenery | 0.0709 | worth | 0.0553 |
| landscape | 0.0542 | very beautiful | 0.0231 | park | 0.0141 |
| a visit | 0.0139 | disappointed | 0.0133 | esthetical | 0.0125 |
| beautiful | 0.0123 | weather | 0.0116 | photograph | 0.0104 |
| sightseeing | 0.0102 | been | 0.0100 | pity | 0.0091 |
1 Here, we present the original output of the LDA model according to [51].
Table 7.
Average KL distance between any two topics.
| Topic Number K | 3 | 4 | 5 |
|---|---|---|---|
| Average KL distance between topics | 7.6899 | 7.7199 | 7.2895 |
Table 8.
Example for the topic naming process.
| Topic | Extracted Words | Distinctive Words | Topic Naming |
|---|---|---|---|
| Topic 1 | attraction, ticket, hour, tourist, just so so, hotel, queue, cableway, service, cable car, really, bad, management, top of mountain, only | queue, cableway, hour, service, cable car, management | management |
© 2017 by the authors. Licensee MDPI, Basel, Switzerland. This article is an open access article distributed under the terms and conditions of the Creative Commons Attribution (CC BY) license (http://creativecommons.org/licenses/by/4.0/).
Share and Cite
MDPI and ACS Style
Ren, G.; Hong, T. Investigating Online Destination Images Using a Topic-Based Sentiment Analysis Approach. Sustainability 2017, 9, 1765. https://doi.org/10.3390/su9101765
AMA Style
Ren G, Hong T. Investigating Online Destination Images Using a Topic-Based Sentiment Analysis Approach. Sustainability. 2017; 9(10):1765. https://doi.org/10.3390/su9101765
Chicago/Turabian StyleRen, Gang, and Taeho Hong. 2017. "Investigating Online Destination Images Using a Topic-Based Sentiment Analysis Approach" Sustainability 9, no. 10: 1765. https://doi.org/10.3390/su9101765
Note that from the first issue of 2016, this journal uses article numbers instead of page numbers. See further details here.