Using a Spatial Interaction Model to Assess the Accessibility of District Parks in Hong Kong


1
State Key Laboratory of Earth Surface Processes and Resource Ecology, School of Natural Resources, Faculty of Geographical Science, Beijing Normal University, Beijing 100875, China
2
Department of Geography, The University of Hong Kong, Hong Kong, China
*
Author to whom correspondence should be addressed.
Sustainability 2017, 9(11), 1924; https://doi.org/10.3390/su9111924
Submission received: 20 September 2017
/
Revised: 12 October 2017
/
Accepted: 23 October 2017
/
Published: 25 October 2017
(This article belongs to the Section Sustainable Urban and Rural Development)
Abstract
:Urban parks are key elements of the urban landscape. They provide important ecological, environmental, and social value as well as spaces for outdoor activities to contribute to urban sustainability. Reasonable accessibility is fundamental for people to take full advantage of the benefits of parks. Spatial interaction models are useful in many fields, especially in static systems. The proposed model has been validated for analyzing the accessibility of district parks in Hong Kong. The accessibility index was calculated using the population in catchment zones lying within a walking distance of 400 m, considering the population that the parks serve, the distance between residential areas and parks, the park area, and the facilities and current condition of green spaces in the parks. The results indicate that the index is strongly related to the spatial pattern of residential areas and the shape and spatial pattern of district parks. High accessibility is always associated with parks located in centers of population concentration rather than in the geographical centers of built-up areas. The catchment zones of district parks within walking distance only cover one-fourth of residential areas, and most residents do not have convenient access to reach parks on foot. The district parks were established without much concern for increasing accessibility. No districts have enough district parks to meet the needs of their residents. Future parks should preferably be elongated to serve more nearby residents, especially in extremely compact cities like Hong Kong.
1. Introduction
People need green spaces at different functional levels, and no one wants to replace urban green spaces (UGS) near their home with those situated far away at the urban fringe or in the countryside [1,2]. Accessibility to green spaces are especially important for residents of the extremely compact city of Hong Kong because of the highly congested urban environment, with numerous skyscrapers and inordinately stressful daily living. The vicissitudes of UGS in Hong Kong reflect the universal phenomenon of intensive conflict between natural and artificial components in cities, calling for smart landscape planning and management to find better solutions [3]. An optimal spatial pattern of parks that can serve most residents satisfactorily in terms of accessibility and quality of recreational experience can fulfil a key quest of a sustainable city.
The district parks are the main components of UGS and are important nodes of the green network in Hong Kong. These parks have an area of at least 1 ha and act as district open spaces to provide facilities to satisfy the core recreational demands of a district population [4]. They play important roles in providing ecological, economic, and social benefits for urban life. People seek a plethora of natural and social facilities in these parks [5]. Whether or not the district parks provide sufficient services is a major quality-of-life concern of the target population.
Accessibility is crucial for parks to attract residents. A district park is expected to be appropriately located to allow convenient access to most residents in the district. It is an important indicator for assessing the optimal layout of urban green spaces and for defining the optimal locations for parks [6,7]. Accessibility is defined using a specific methodology to analyze the systematic relationship between the spatial distribution of activity destinations and the amount of travel within a region [8]. Distance or travel time from home has been the most important factor in assessing park accessibility in current research [9,10]. Euclidean distance is the easiest measure and is often a preferred indicator when analyzing spatial patterns related to distance [11]. Geographic information systems (GIS) provide an important spatial technique to analyze accessibility [1].
When considering the effect of parks on health and well-being, Ekkel and Vries [12] classified accessibility into two types: cumulative opportunity metrics [13,14], which calculate amounts within an administrative area and within a certain distance from home, and residential proximity indicators, which use the distance to the nearest green space. However, these measures only deal with the distance between the facilities and consumers. The optimal locations of the facilities and their attractiveness to costumers are not considered. The spatial interaction model or gravity potential model [15] was originally introduced by Huff [16,17]. These studies drew an analogy to Newton’s gravitational law to account for aggregate human behaviors, and the equilibrium force between two objects was related to their spatial interaction [18]. The model directly deals with optimal locations, incorporating attractiveness of service facilities to customers, and travel distance between customers and facilities [19]. Many studies have used this model to evaluate the location suitability of shops, universities, competitive facilities, and playgrounds because of its simplicity and generalizability [20,21]. However, few studies have attempted to apply it to accessibility assessment of parks.
The spatial interaction model can measure the optimal locations of service facilities on the condition that the customers patronize the closest available facilities. The location suitability of a park directly determines its spatial accessibility. Hence, in this research, the spatial interaction model was modified to evaluate the spatial accessibility of district parks in Hong Kong with the intent of better serving the nearby population within walking distance using orthophoto maps and high-resolution digital land-use maps (0.5 m resolution). Factors influencing accessibility of district parks include the distance between parks and residential areas, the populations in residential areas, the facilities and areas of parks, the amount of green cover, and the total area and vegetation configuration of green spaces in parks. This study was confined to built-up areas.
2. Materials and Methods
2.1. Study Area
As one of the most congested cities in the world, Hong Kong was selected as the case study area for its special characteristics of urban congestion and urban form. The study area was divided into old towns and new towns. The new towns were developed in rural areas and were intended to solve the problems of population expansion and environment deterioration in the old towns. Three stages of new towns exist in the New Territories; the remaining districts are old towns.
Figure 1 showed the distribution of district parks and residential zones by districts in built-up areas. To perform a comprehensive analysis of park accessibility in Hong Kong, all the district parks were selected. Of the 26 district parks, five are in Hong Kong Island and 16 in Kowloon. To analyze the effect of town development on park accessibility, five additional parks with characteristics similar to district parks were selected because no information was available about district parks in the New Territories (Table 1 and Figure 1). Kowloon City (KC) has the most district parks and Sham Shui Po (SSP) has the largest total area (Table 1). Happy Valley and Tai Po Waterfall Parks have the largest park areas, and Fung Tak and Sham Shui Po Parks have the smallest. The distribution of district parks and residential areas (Figure 1) indicates that most district parks are concentrated in Kowloon.
2.2. Data Collection and Analysis
2.2.1. Information about Green Cover, Elevation, and Buildings
Orthophoto and B5000 digital maps with 0.5 m resolution were purchased from the Hong Kong government. Then GIS techniques were used to derive maps of green spaces (to calculate green cover) and other land uses such as buildings and different kinds of roads to obtain their distributions. Elevation information was extracted from the LANDFILL layers of the B5000 digital maps in five categories: 0–100, 100–200, 200–400, 400–700, and >700 m. To facilitate calculation, these land data were standardized as values between 0 and 1, and the average values for each cell are retained. Thus, the corresponding standardized values of elevation are 0.05, 0.15, 0.3, 0.55, and 0.85. The Tertiary Planning Unit/Street Block system (TPUs) with 2015 population data [23,24] was used as the basic unit to calculate population density and building density. Building area is defined as the area demarcated by building block outline and building outline under elevated structure. This definition is derived from the data of BLDG.cov of B5000 digital maps. In the same file, buildings are classified into several types: BP, building block outline, and BUP, building outline under elevated structure. BP and BUP are used to calculate the building areas.
Orthophoto maps and digital land-use maps with 0.5 m resolution were purchased from the HKSAR government. In ArcMap 9.0, different categories of green space were digitized piece by piece from the Orthophoto maps, and land uses such as buildings and related information including building height and building area were extracted from B5000 digital maps. The boundaries of the district parks were obtained from maps prepared by the HKSAR Planning Department [4]. By combining the green cover distribution with the boundaries of district parks, the total areas and vegetation configuration of green spaces could be calculated.
2.2.2. Information about Population
Population data were extracted based on Tertiary Planning Units (TPUs) [24]. However, no information was available about the population in any one building. Therefore, this was represented by multiplying building height by building floor area. The values of bh × ba in the same TPU were summed and correlated with the corresponding population based on the Pearson correlation coefficient. Table 2 indicates that the relationships between bh × ba and population are strongly significant in almost all districts except CW and TW. Thus bh × ba can represent district populations except for CW and TW. Statistical software SPSS for Windows (version 16; SPSS Inc., Chicago, IL, USA) was used to perform the correlation analysis.
2.2.3. Defining Catchment Zone
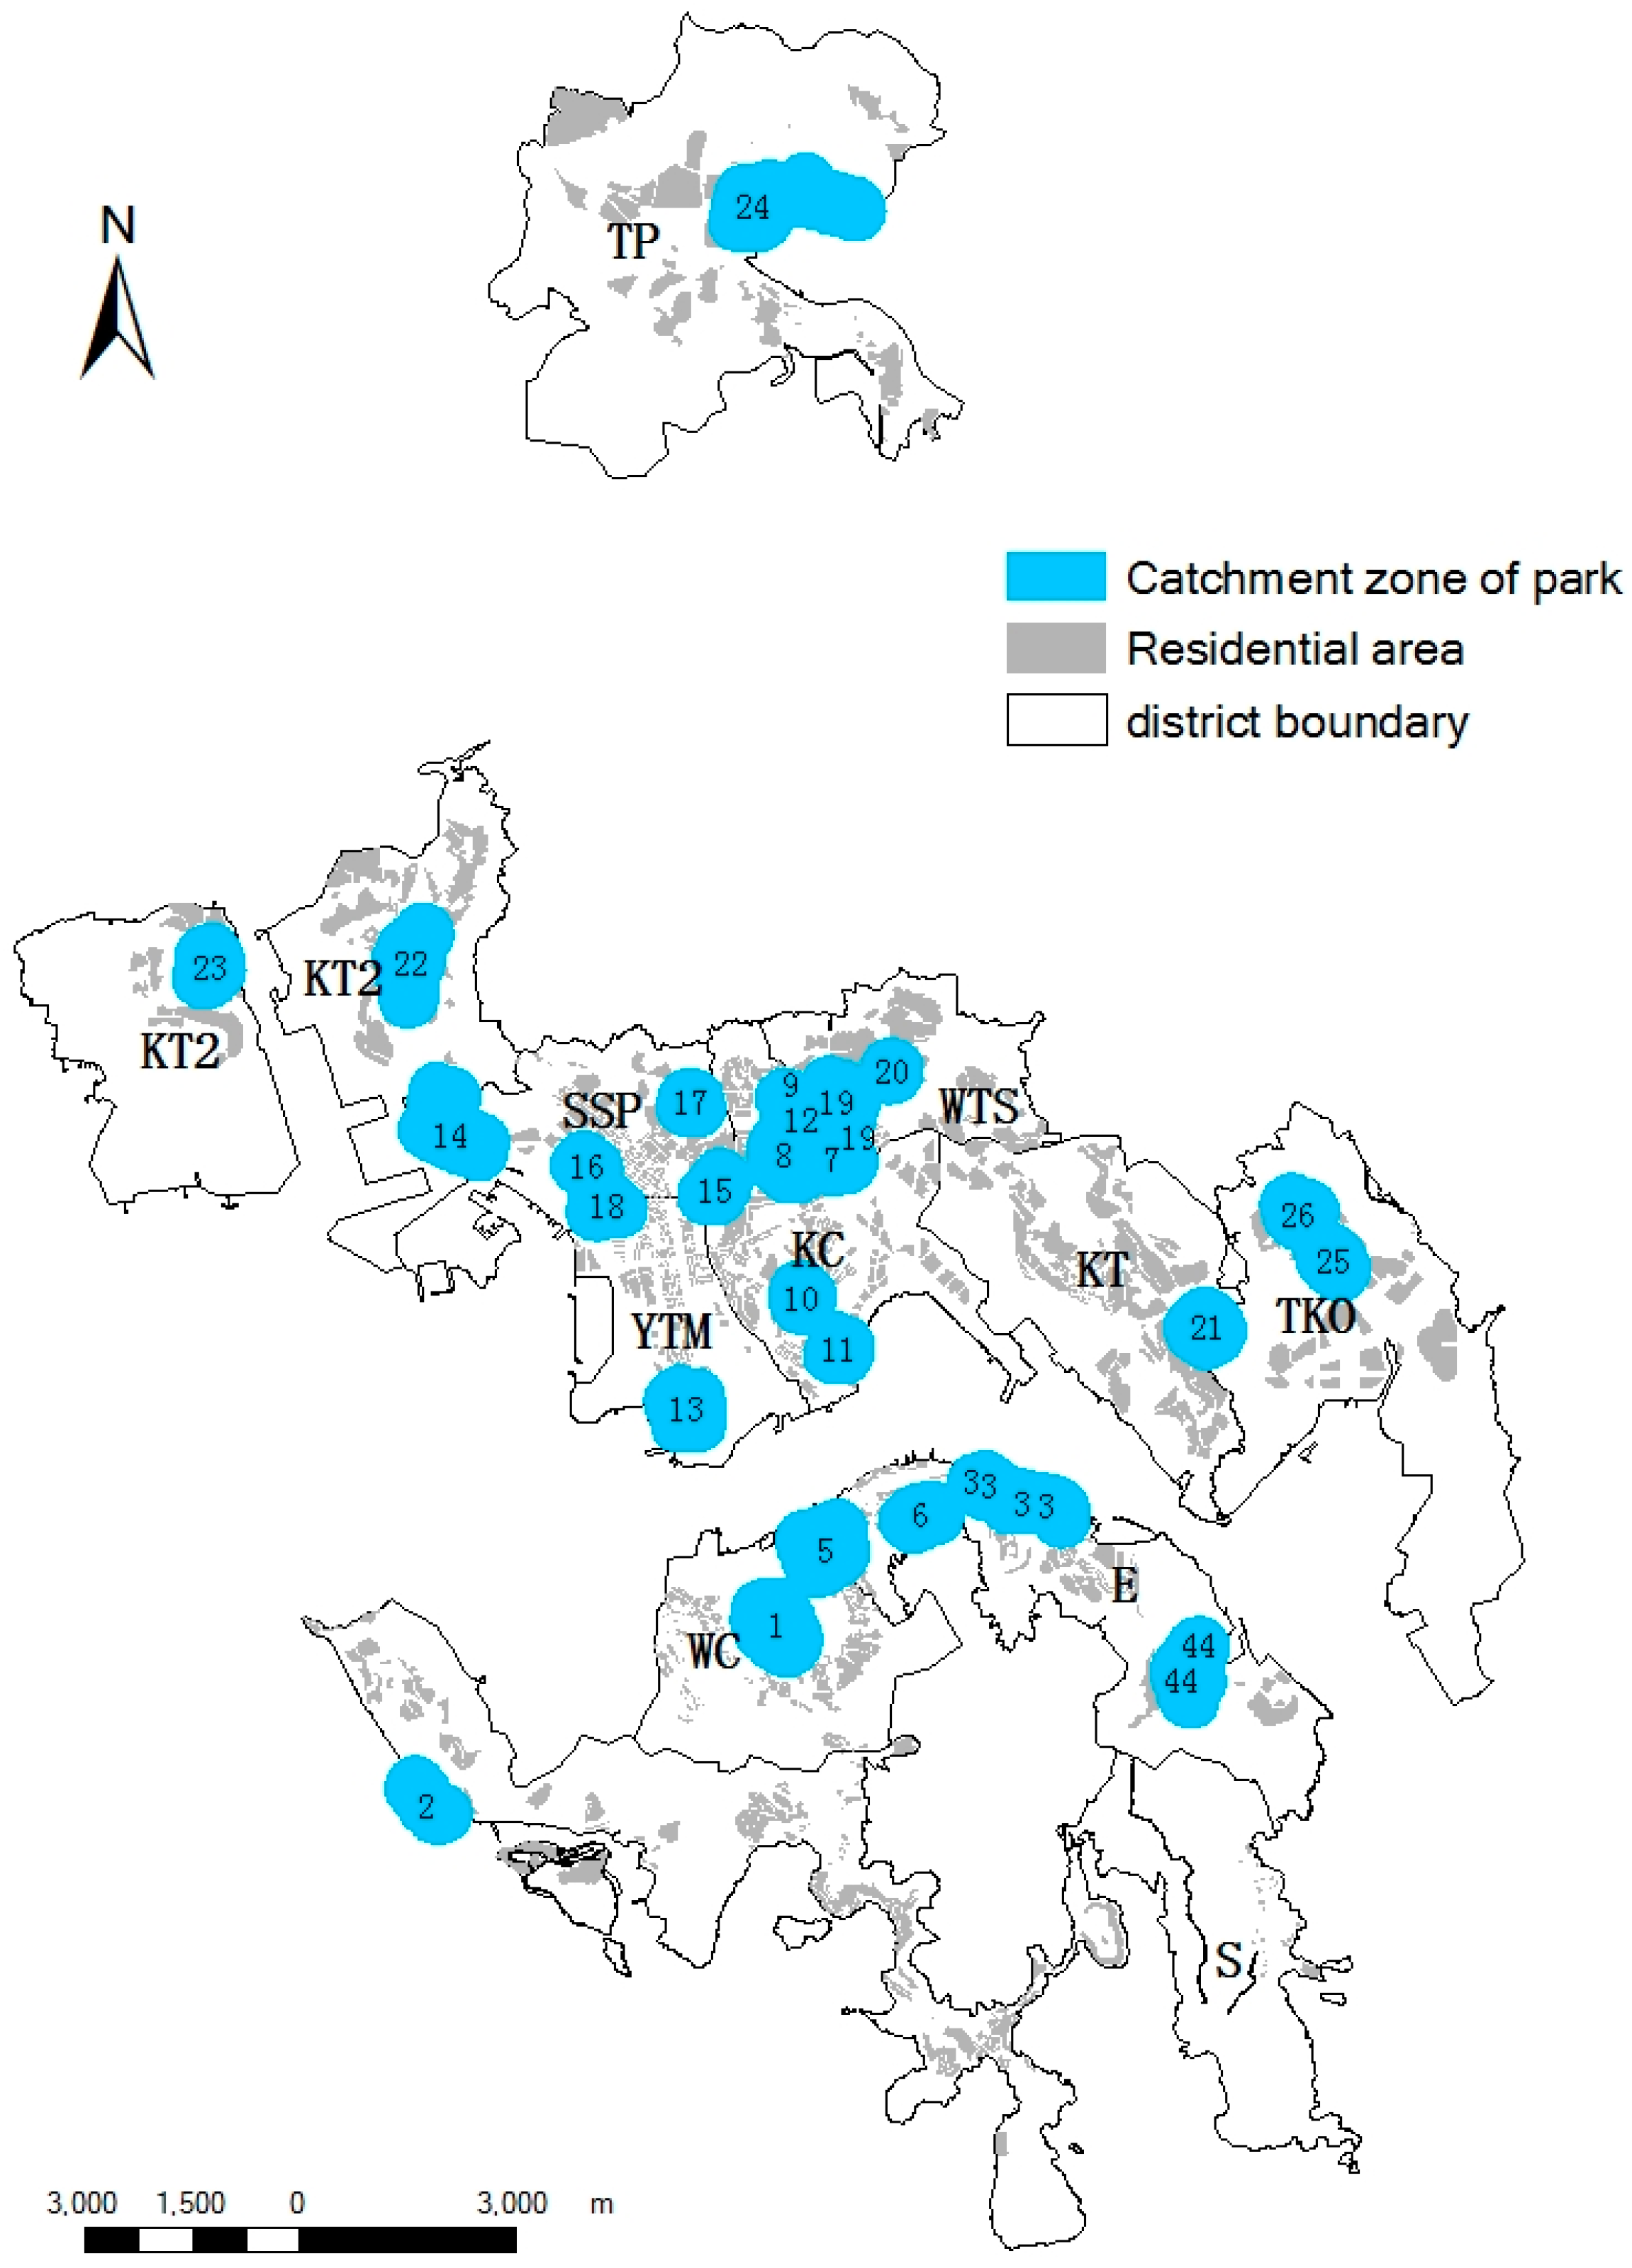
Research on park use confirms that most users come on foot and that they regularly visited urban green spaces within an accessible distance to residence or work locations [25]. The residential areas within the walking-distance buffer regions of district parks reflect the potential population that could reach the parks easily and frequently [26]. Jim and Chen [27] proposed that the demand for green spaces close to homes calls for distances to homes less than 400 m (or 10 min of walking). Hence, in this study, the accessibility of district parks was assessed considering the population within a catchment zone of 400 m as within walking distance from residential areas. Figure 2 displayed the distribution of catchment zones (within walking distance) of district parks.
2.3. Modeling Spatial Accessibility of Parks
2.3.1. Accessibility Measure
Inspired by Newton’s second law of motion, the spatial interaction model [28] can be expressed as follows:
where Tij represents a trip or interaction between Oi and Dj; K is a general constant; Oi is the strength of producers (such as residents) in zone i; Dj is the strength of attractants (such as employment, job locations, shops, etc.) in zone j; dij is the distance between Oi and Dj; and α is a distance parameter.
Tij = K × (Oi × Dj) ÷ dijα
Tij is a cumulative value and is directly proportional to the strength (size or number) of Oi and Dj. The interactions will be greatest when the locations in all the zones of O are all closest to the locations in all the zones of D. By determining the values of K and α for each prediction, the location equation can be adjusted to accommodate other influential factors such as land price and planning policies.
To analyze the interaction between a particular kind of park and the population it serves, the model can be written as Equation (2). When Li is at the maximum, the park layout is perfect to provide services for residents.
where Li represents a trip or interaction between the population and park i; K is an overall constant; Ri is the population in building j that is served by park i; Pj is the number of people from building j using park i; dij is the distance between building j and park i; and α is valued as 2 as presented by Talen and Anselin [21].
Li = K × (Ri × Pj) ÷ dijα
As assumed, the population in each building was represented by the product of building height and building floor area. Hence, the formula to assess the spatial accessibility of parks can be written as follows:
where Li is the accessibility index of district park i, or the interaction between district park i and the residential area it serves in m; Ki is an overall constant; bhj is the height of residential building j in m; baj is the area of residential building j, in m2; and dij is the Euclidean distance between the polyline layer of district park i and the centroid layer of the corresponding residential building in m. When Li reaches its maximum, the location of the point (equilibrium point) is the optimal location of the park, and the park is as accessible as possible to the residents it serves.
Li = Ki × ∑(bhj × baj) ÷ dij2
Any measure of accessibility must incorporate two elements: the distance between users and their destinations, and the facilities of the various destinations [29]. The characteristics of the facilities or services of the destination and the access characteristics of the relationship between origin and destination have been verified as the main measurements for analyzing the accessibility of a destination [21]. When a comparison is carried out among different land uses for a single purpose, K is determined by various characteristics of these land uses. Hence, K is calculated according to park areas, the facilities they provide, and the current condition of green spaces, including total area, green cover, and vegetation configuration [30].
2.3.2. Definition of the Overall Constant or Attractiveness Index K
As mentioned above, K represents the main characteristics of a park that attracts visitors [31] and can be called an attractiveness index. The expression for K is as follows:
where in park i, Ki is an overall constant or attractiveness index, which is a relative value obtained by normalizing the indices into (0, 1) using the method of range standardization; RAi is the relative value of park area; RFi is the relative value of facilities; RVCi is the relative value of the vegetation configuration of green spaces; RGTi is the relative value of the total area of green spaces; and RGCi is the relative value of green cover (all for park i).
Ki = (RAi + RFi + RVCi + RGTi + RGCi) ÷ 5
The value of facilities is determined by summing the weighted scores of courts, playgrounds or play areas, parking lots, educational facilities, trails, tracks, and other components of the park assisted by the Delphi expert consultation method. One facility is scored as 1. Special facilities such as promenades may be scored as 2 because they are more attractive to people because of their sea views. Decorative features such as cascade waterfalls and fountains may be scored as 0.5.
The value of RVCi is determined by the proportions of different categories of green space in park i. According to Costanza et al. [32], the average global value of annual ecosystem services is higher in forest ($969/(ha year)), especially in tropical forest ($2007/(ha year)), than in grassland ($232/(ha year)). Some studies indicate that forests have higher ecosystem service value than shrubbery [33]. Hence, trees are weighted with a higher value of 0.4, followed by shrubs at 0.2, and grass at 0.1. The composition of each type may strengthen the value by 0.1. The existence of bare or nearly bare open spaces in green patches decreases their value, and therefore an amount may be subtracted from the calculated value for the vegetation configuration. Hence, RVC can be calculated as follows:
where in park i, RVCi is the vegetation configuration index in relation to the ecological, aesthetic, and biodiversity values of the green patches on a scale from 0 to 1. P1 is the proportion of green space composed of trees, shrubs, and grassland; P2 is the proportion composed of shrubs and grassland only; P3 is the proportion of single trees; P4 is the proportion of shrubs; and P5 is the proportion of bare or nearly bare spaces in green patches. The results of park areas, facilities and vegetation configurations refer to Table S1 (supplementary materials).
RVCi = P1 + 0.4 × P2 + 0.4 × P3 + 0.2 × P4 − P5
3. Results
3.1. Current Supply of District Parks
Figure 2 indicates that the catchment zones of the district parks cover less than one-third of the population of the study area. Some residents, such as those at the boundary of KC and WTS (Table 2), which is located at the intersection of two or more catchment zones, could be considered to have oversupply of district parks. However, most residents, especially those in KT, TP, and S (Table 2), have few chances to reach district parks within walking distance. Although some district parks such as Quarry Bay Park, Victoria Park, and Tai Po Waterfall Park have large catchment zones, they cover limited residential areas, and therefore their service to nearby populations is limited. On the contrary, other district parks such as Ko Shan Road Park, Fa Hui Park, Morse Park, and Tsing Yi Park are located in the center of residential areas, hence they could exert a profound influence on quality of life for nearby residents with attendant sustainability impacts. Figure 1 and Figure 2 show that few district parks are distributed in residential areas in TP, SSP, S, and YTM (Table 2). To meet the needs of all residents, all districts need proper spatial planning to install new district parks.
3.2. Attractiveness Index K
Figure 3 showed the attractiveness index K (calculated by Equation (4)) in different district parks. It can be inferred from Figure 3 that most parks have values of the attractiveness index K of about 0.4, with only a few above 0.5. Compared to other district parks, Victoria Park, Lai Chi Kok Park, Central Kwai Chung Park, and Tai Po Waterfront Park have larger K because of their larger park areas and more facilities. On the contrary, Fung Tak Park, Tung Chau Park, Ko Shan Road Park, and Po Tsui Park have lower K because of smaller park areas and fewer facilities. Quarry Bay Park also has a lower K than other parks because of the poor vegetation configuration of its green spaces: its values of total area, green cover, and value of the vegetation configuration are among the lowest of the 26 district parks. The attractiveness of district parks has not increased in conjunction with new town development.
3.3. Accessibility Index
Pearson correlation analysis indicated that the relationship between the attractiveness index and the accessibility index (calculated by Equation (3)) was insignificant. This means that the accessibility of district parks is primarily determined by other factors in the model, such as the population served by parks and the distance between residential areas and parks. Figure 3 indicates that despite having the highest attractiveness index, Tai Po Waterfall Park has the lowest accessibility of the 26 district parks because of its location far away from residential areas. Other parks with low accessibility include Quarry Bay Park, Junction Road Park, and Kowloon Park, which are distributed at peripheral locations or are located far away from core residential areas (Figure 1). On the contrary, district parks such as Choi Sai Woo Park, Lam Tin Park, and Morse Park with high accessibility are well surrounded by residential areas. However, not all district parks located at the centers of residential areas (such as Po On Park and Po Tsui Park) have high accessibility index because of the low building density of residential areas in the catchment ones. Similarly, not all district parks located on the fringe of a district (such as Waterfall Bay Park and Lam Tin Park) have low accessibility.
In summary, high accessibility is found in parks located at the center of population concentrations rather than in the geographical center of built-up areas. District parks with low accessibility can be found either in old or new towns. This means that district park accessibility has not been improved in new town development.
3.4. Accessibility of District Parks
Figure 4 showed the accessibility index in buffer zones (walking distance) for different district parks. It can be inferred from Figure 4 that different district parks have different accessibilities. Of the 26 district parks, Lai Chi Kok Park has the highest accessibility, followed by Kowloon Tsai Park, Choi Sai Woo Park, and Morse Park. The accessibilities of all these parks are greater than 900 m. However, more than one-fourth of district parks, especially Shek Kip Mei Park, Kowloon Park, Tai Po Waterfall Park, and Junction Road Park, have an accessibility distance of less than 100 m, and most parks have an accessibility distance of less than 200 m. Both old and new towns have district parks with both high- and low-accessibility, further indicating that the district parks were located with little concern for increasing accessibility.
4. Discussion and Conclusions
4.1. Strengths and Limitations of the Spatial Accessibility Model
The spatial interaction model delivers many advantages in research. First, the spatial interaction model provides an initial prediction to optimize the location of special land uses such as shops [15]. It has been modified for application in this study. The model is inherently a static representation of spatial patterns [34] such as the spatial accessibility of district parks. It can provide an initial forecast of impact on the surroundings. The adjustable parameters K and α provide an opportunity for researchers to constrain the models to suit their own research purposes. In this study, the various characteristics of district parks determined the constant K when the comparisons were carried out. New perspectives could also be obtained thanks to the flexibility of the model. Former researchers concluded that cumulative opportunities indicators are more consistently positively related to health than residential proximity indicators because they take all the green space within a certain distance into account [12]. In this study, the accessibility index was calculated within a certain walking distance using spatial interaction model to make the results reliable.
However, the model has some limitations that could be modified in further studies. First, the models deal only with locations and interactions between parks and target residents; other reasons that may affect park locations, such as limited available area and poor transport links, could be considered. Second, although the model is used under static conditions, this study has tried to define suitable park locations in a dynamic urban system. It was assumed that all other parts of the urban system remained constant. On the other hand, the dynamic effects of other parts of the urban system may be insignificant in comparative location analysis or spatial accessibility analysis between different parks of the same kind.
4.2. Accessibility of District Parks and Associated Factors
The accessibility of district parks was classified based on the average distance of around 375 m (Table 3). Table 3 indicates that most district parks have accessibility below or at the middle level.
Factors determining the accessibility of district parks are diverse. For regions with less dense population, accessibility may be lower, other factors being equal. Just as demonstrated in former researches [26], long distances between parks and residential areas and the low number of residential areas contained in the catchment zones of certain district parks may also contribute to low accessibility such as Tai Po Waterfall Park. On the contrary, Morse Park serves one of the largest numbers of residential areas. Its accessibility is also among the highest of the 26 parks. However, not all district parks serving more residential areas have higher accessibilities, and vice versa. The spatial pattern of residential areas is also a dominant factor. Lai Chi Kok Park has the highest accessibility, but not the greatest number of residential areas because they are concentrated at the outer boundary of the park’s catchment zone. Tung Chau Street Park serves one of the largest numbers of residential areas in its catchment zone, but its accessibility is not high because the residential areas are widely dispersed and are situated far from the center of the park. The residential areas served by Shek Kip Mei Park and Fa Hui Park are located at the fringe of their catchment zones, and their access to nearby parks is among the lowest. The shape of district parks is another important factor influencing their accessibility. Elongated parks have larger catchment zones that contain more residential areas. Therefore, it can be concluded that elongated district parks are preferable in a compact city like Hong Kong to serve more residents while using less space.
As mentioned above, green spaces “on people’s doorsteps” encourage visits by residents [30]. Therefore, district parks surrounded by residential areas are of crucial importance. The distribution of district parks (Figure 1) is extremely uneven in TP, SSP, S, and YTM. The parks are located far from the residential concentrations. The extremely low number and uneven and inappropriate distribution of district parks and the dispersed spatial pattern of the population served by the parks are the main causes of low accessibility. More district parks should be constructed at or near the centers of residential areas in these districts.
4.3. Provision for Future Attractive and Accessible District Parks
The attractiveness index and the accessibility index are simple but applicable. They can be modified to take relevant characteristics into account. In this study, park area, facilities, and current condition of green spaces were the main concerns in attracting visitors. The UGS attractiveness indicators were aggregated into five groups [30]: “space”, “nature”, “culture and history”, “quietness” and “facilities”. In quantitative modeling of the attractiveness index of district parks, park area was used as the measure of “space”. Facilities were included to represent “culture and history” and “facilities”. The current condition of green spaces represented “nature” and “quietness”. To make district parks more attractive, all these factors should be considered.
The accessibility of district parks is closely related to their location with respect to the distribution of residential areas and the population they serve. To provide attractive and accessible district parks to improve the living environment, it is recommended that future district parks should be located in different residential centers and at different functional levels [30], with large park areas, a variety of facilities, more green open spaces, large amounts of green cover, and a diverse vegetation configuration. However, the availability of small local green spaces on people’s doorsteps is necessary, especially for less mobile people and young children.
4.4. Improving District Parks to Encourage Patronage
Table 4 shows that the attractiveness index is strongly influenced by park area, park facilities, total area of green space, and area of green cover in the park. Therefore, a relatively comprehensive assessment of the ability of district parks to encourage patronage should take into account all the factors mentioned in Equations (4) and (5). For future urban planning in cities like Hong Kong, it is suggested that district parks should be incorporated into master plans. To satisfy the needs of residents, the district parks should be located near to or at the centers of residential areas and be equipped with diverse facilities, widespread green cover, and large total areas of green space.
The public tends to be more enthusiastic about parks with the following features: creative use of brightly colored flowers together with natural, wild, and informal meadows, a wide diversity of plant species and vegetation configurations, and a mixture of different heights of plants. Failing to meet inhabitants’ needs may lower park usage [27]. Unsuitable design, poor visual quality, and inadequate facilities account for the low popularity of certain parks [27,35]. Potential parks should preferably be elongated to serve a larger nearby population. They should be evenly distributed in the study area, with their services covering most residential areas. A green connection with other green spaces, especially in congested places, can increase habitat diversity, enlarge flora and fauna carrying capacity, and enhance the amenity value to visitors [27]. More trees, wildlife, and native species should be introduced into parks to maximize their ecological functioning, revive declining species [36], and counteract domination by exotics [37]. Both natural and formal plantings play significant roles in fulfilling the demands of users [38], although some studies consider semi-natural habitats or wild areas as important factors for enhancing biodiversity and attracting more visitors to a park.
4.5. Prospective Accessibility Analyses of Green Spaces
This study has shown that the measures and methodologies of accessibility analysis in transportation can also be used to assess the accessibility of district parks. Furthermore, spatial accessibility models can be widely used in many fields to assess the attractiveness and accessibility of various objectives by adjusting the values of K and α [15].
A further study should be conducted using approaches such as questionnaire analysis to verify the results obtained from the model. The questionnaire should be related to the number of park users, time spent there, and frequency of people using the parks, preferred facilities and activities, the availability of parks, and the transportation conditions to reach parks. As in other studies [11], the Euclidean distance measure has been used in this study. However, this measure does not take into account changes in accessibility patterns through increases in road capacity or presence of hindrances to pedestrian movement. It can only be used to analyze relative accessibility [39]. Therefore, an improvement in the distance calculation is also recommended. The impediments posed by various land uses and the travel time on foot or by vehicle should be included in further studies.
4.6. Conclusions
The spatial interaction model can provide a simple and practical analytical tool to evaluate the rationality in the spatial distribution of urban amenities, including district parks. The results of accessibility assessment indicate that most of the district parks in Hong Kong have failed to permit convenient access by walking from homes. A good proportion of the population falls outside the normal catchment zones and hence is deprived of easy access to the essential urban amenities. Only a small proportion of the population is fortunate to have above-average services offered by more than one park.
Future town planning can follow a smart spatial approach by analyzing the population distribution pattern and locate district parks as far as possible at the center of population concentrations. Gaps between catchment zones of parks could be avoided to allow an equitable provision in space and by social groups. In compact cities where land for green spaces at the street level is deficient, the configuration of parks could be stretched into the linear shape to afford a notably longer interface with adjacent residential areas and hence serving a considerably expanded catchment area.
Park design could attempt to raise attractiveness to visitors. As public assets, parks could aim at a socially inclusive clientele with diverse socio-demographic backgrounds. A survey of user perception and expectation of landscape and facility features could provide objective data to optimize the provision and improve patronage. Urban parks could be considered as part and parcel of the nature-based solutions in the quest for a more sustainable and livable future. In addition to environmental ecosystem services, the social and economic benefits could be fully integrated into the mindset of the administration as well as the citizenry.
Supplementary Materials
The following are available online at www.mdpi.com/2071-1050/9/11/1924/s1. Table S1: Areas, facilities, and vegetation configuration of green spaces in selected district parks.
Acknowledgments
Special thanks are given to the Department of Geography, the University of Hong Kong, which purchased the digital data from the government. The research is supported by Key Projects of National Natural Science Foundation of China (Project Nr. 41530747) and Project supported by State Key Laboratory of Earth Surface Processes and Resources Ecology (2017-FX-01(1)).
Author Contributions
Yuhong Tian and C. Y. Jim conceived, designed, and wrote the experiments; Yiqing Liu performed the experiments.
Conflicts of Interest
The authors declare no conflict of interest.
References
- Gupta, K.; Roy, A.; Luthra, K.; Maithani, S.; Mahavir. GIS based analysis for assessing the accessibility at hierarchical levels of urban green spaces. Urban For. Urban Green. 2016, 18, 198–211. [Google Scholar] [CrossRef]
- Rigolon, A. A complex landscape of inequity in access to urban parks: A literature review. Landsc. Urban Plan. 2016, 153, 160–169. [Google Scholar] [CrossRef]
- Jim, C.Y. Impacts of intensive urbanization on trees in Hong Kong. Environ. Conserv. 1998, 25, 146–159. [Google Scholar] [CrossRef] [Green Version]
- Planning Department, HKSAR. Hong Kong Planning Standards and Guidelines. 2017. Available online: http://www.pland.gov.hk/pland_en/tech_doc/hkpsg/full/ (accessed on 24 October 2017).
- Wolch, J.R.; Byrne, J.; Newell, J.P. Urban green space, public health, and environmental justice: The challenge of making cities just green enough. Landsc. Urban Plan. 2014, 125, 234–244. [Google Scholar] [CrossRef]
- Smoyer-Tomic, K.E.; Hewko, J.N.; Hodgson, M.J. Spatial accessibility and equity of playground in Edmonton, Canada. Can. Geogr. 2004, 48, 287–302. [Google Scholar] [CrossRef]
- Tong, Z. A genetic algorithm approach to optimizing the distribution of buildings in urban green space. Autom. Constr. 2016, 72, 46–51. [Google Scholar] [CrossRef]
- Zhang, M. Exploring the relationship between urban form and nonwork travel through time use analysis. Landsc. Urban Plan. 2005, 73, 244–261. [Google Scholar] [CrossRef]
- Reyes, M.; Páez, A.; Morency, C. Walking accessibility to urban parks by children: A case study of Montreal. Landsc. Urban Plan. 2014, 125, 38–47. [Google Scholar] [CrossRef]
- Weber, J.; Kwan, M. Bringing time back in: A study on the influence of travel time variations and facility opening hours on individual accessibility. Prof. Geogr. 2002, 54, 226–240. [Google Scholar] [CrossRef]
- Bach, L. The problem of aggregation and distance for analyses of accessibility and access opportunity in location-allocation models. Environ. Plan. A 1981, 13, 955–978. [Google Scholar] [CrossRef]
- Ekkel, E.D.; de Vries, S. Nearby green space and human health: Evaluating accessibility metrics. Landsc. Urban Plan. 2017, 157, 214–220. [Google Scholar] [CrossRef]
- Cascetta, E.; Cartenì, A.; Montanino, M. A new measure of accessibility based on perceived opportunities. Proc. Soc. Behav. Sci. 2013, 87, 117–132. [Google Scholar] [CrossRef]
- Cascetta, E.; Cartenì, A.; Montanino, M. A behavioral model of accessibility based on the number of available opportunities. J. Transp. Geogr. 2016, 51, 45–58. [Google Scholar] [CrossRef]
- Foot, D. Operational Urban Models; Methuen: London, UK, 1981. [Google Scholar]
- Huff, D.L. Determination of the Intra-Urban Trade Areas; Real Estate Research Program, UCLA: Los Angeles, CA, USA, 1962. [Google Scholar]
- Huff, D.L. Defining and estimating a trade area. J. Mark. 1964, 28, 34–38. [Google Scholar] [CrossRef]
- Sun, G.Q.; Wang, C.H.; Wu, Z.Y. Pattern dynamics of a Gierer-Meinhardt model with spatial effects. Nonlinear Dyn. 2017, 88, 1385–1396. [Google Scholar] [CrossRef]
- Fotheringham, A.S. Spatial interaction models. Int. Encycl. Soc. Behav. Sci. 2001, 14794–14800. Available online: http://www.sciencedirect.com/science/article/pii/B0080430767025195 (accessed on 18 September 2017). [CrossRef]
- Bruno, G.; Improta, G. Using gravity models for the evaluation of new university site locations: A case study. Comput. Oper. Res. 2008, 35, 436–444. [Google Scholar] [CrossRef]
- Talen, E.; Anselin, L. Assessing spatial equity: An evaluation of measures of accessibility to public playgrounds. Environ. Plan. A 1998, 30, 595–613. [Google Scholar] [CrossRef]
- Leisure and Cultural Services Department. Parks. 2006. Available online: http://www.lcsd.gov.hk/en/facilities/facilitieslist/parks.html (accessed on 18 September 2017).
- Survey & Mapping Office, Lands Department, HKSAR. Hong Kong Guide 2004, photomap ed.; Government Logistics Department: Hong Kong, China, 2004.
- Census and Statistics Department. Tab on CD-ROM User Guide: 2001, Population Census; Census and Statistics Department: Hong Kong, China, 2001. [Google Scholar]
- Belinda, Y.; Wong, N.H. Resident perceptions and expectations of rooftop gardens in Singapore. Landsc. Urban Plan. 2005, 73, 263–276. [Google Scholar]
- Wang, D.; Brown, G.; Zhong, G.; Liu, Y.; Mateo-Babiano, I. Factors influencing perceived access to urban parks: A comparative study of Brisbane (Australia) and Zhongshan (China). Habitat Int. 2015, 50, 335–346. [Google Scholar] [CrossRef]
- Jim, C.Y.; Chen, S.S. Comprehensive greenspace planning based on landscape ecology principles in compact Nanjing city, China. Landsc. Urban Plan. 2003, 65, 95–116. [Google Scholar] [CrossRef]
- Mulligan, F.T.J. Functional form and spatial interaction models. Environ. Plan A 1998, 30, 1497–1507. [Google Scholar]
- Geertman, S.C.M.; Van Eck, J.R.R. GIS and models of accessibility potential: An application in planning. Intern. J. Geogr. Inf. Syst. 1995, 9, 67–80. [Google Scholar] [CrossRef]
- Van Herzele, A.; Wiedemann, T. A monitoring tool for the provision of accessible and attractive urban green spaces. Landsc. Urban Plan. 2003, 63, 109–126. [Google Scholar] [CrossRef]
- De Clercq, E.M.; De Wulf, R.; Van Herzele, A. Relating spatial pattern of forest cover to accessibility. Landsc. Urban Plan. 2007, 80, 14–22. [Google Scholar] [CrossRef]
- Costanza, R.; d’Arge, R.; de Groot, R.; Farber, S.; Grasso, M.; Hannon, B.; Limburg, K.; Naeem, S.; O’Neill, R.V.; Paruelo, J.; et al. The value of the world’s ecosystem services and natural capital. Nature 1997, 387, 253–260. [Google Scholar] [CrossRef]
- Li, S.N.; Wang, B.; Guo, H.; Qu, H.; Li, B.B.; Zhang, L.R. Assessment of forest ecosystem services value in Dagangshan. Sci. Soil Water Conserv. 2007, 5, 58–64. (In Chinese) [Google Scholar]
- Paul, B. Bottom-up simulation for evaluation of recreational boat traffic monitoring. Ph.D. Dissertation, University of Leeds, Leeds, UK, 1997. (In English). [Google Scholar]
- Joardar, S.D. Use and image of neighborhood parks: A case of limited resources. Environ. Behav. 1989, 21, 734–762. [Google Scholar] [CrossRef]
- Neuenschwander, L.F.; Byler, J.W.; Harvey, A.E.; Mcdonald, G.I.; Ortiz, D.S.; Osborne, H.L. White pine in the American west: A vanishing species—Can we save it? In General Technical Report RMRS-GTR-35; US Department of Agriculture and Forestry Service, Rocky Mountain Research Station: Ogden, UT, USA, 1999; pp. 1–20. [Google Scholar]
- Jim, C.Y. The urban forestry programme in the heavily built-up milieu of Hong Kong. Cities 2000, 17, 271–283. [Google Scholar] [CrossRef]
- García-Albarado, J.C.; Dunnett, N. The use of herbaceous vegetation to promote biodiversity in urban parks. In Proceedings of the 7th IALE World Congress—Part 1. 25 Years of Landscape Ecology: Scientific Principle in Practice; Bunce, R.G.H., Jongman, R.H.G., Hojas, L., Weel, S., Eds.; Ponsen and Looijen bv Wageningen: Wageningen, The Netherlands, 2007; pp. 244–245. [Google Scholar]
- Stanilov, K. Accessibility and land use: The case of suburban Seattle, 1960–1990. Reg. Stud. 2003, 37, 783–794. [Google Scholar] [CrossRef]
Figure 1.
Distribution of district parks and residential zones by districts in built-up areas; park IDs and corresponding park names are given in Table 1.
Figure 1.
Distribution of district parks and residential zones by districts in built-up areas; park IDs and corresponding park names are given in Table 1.
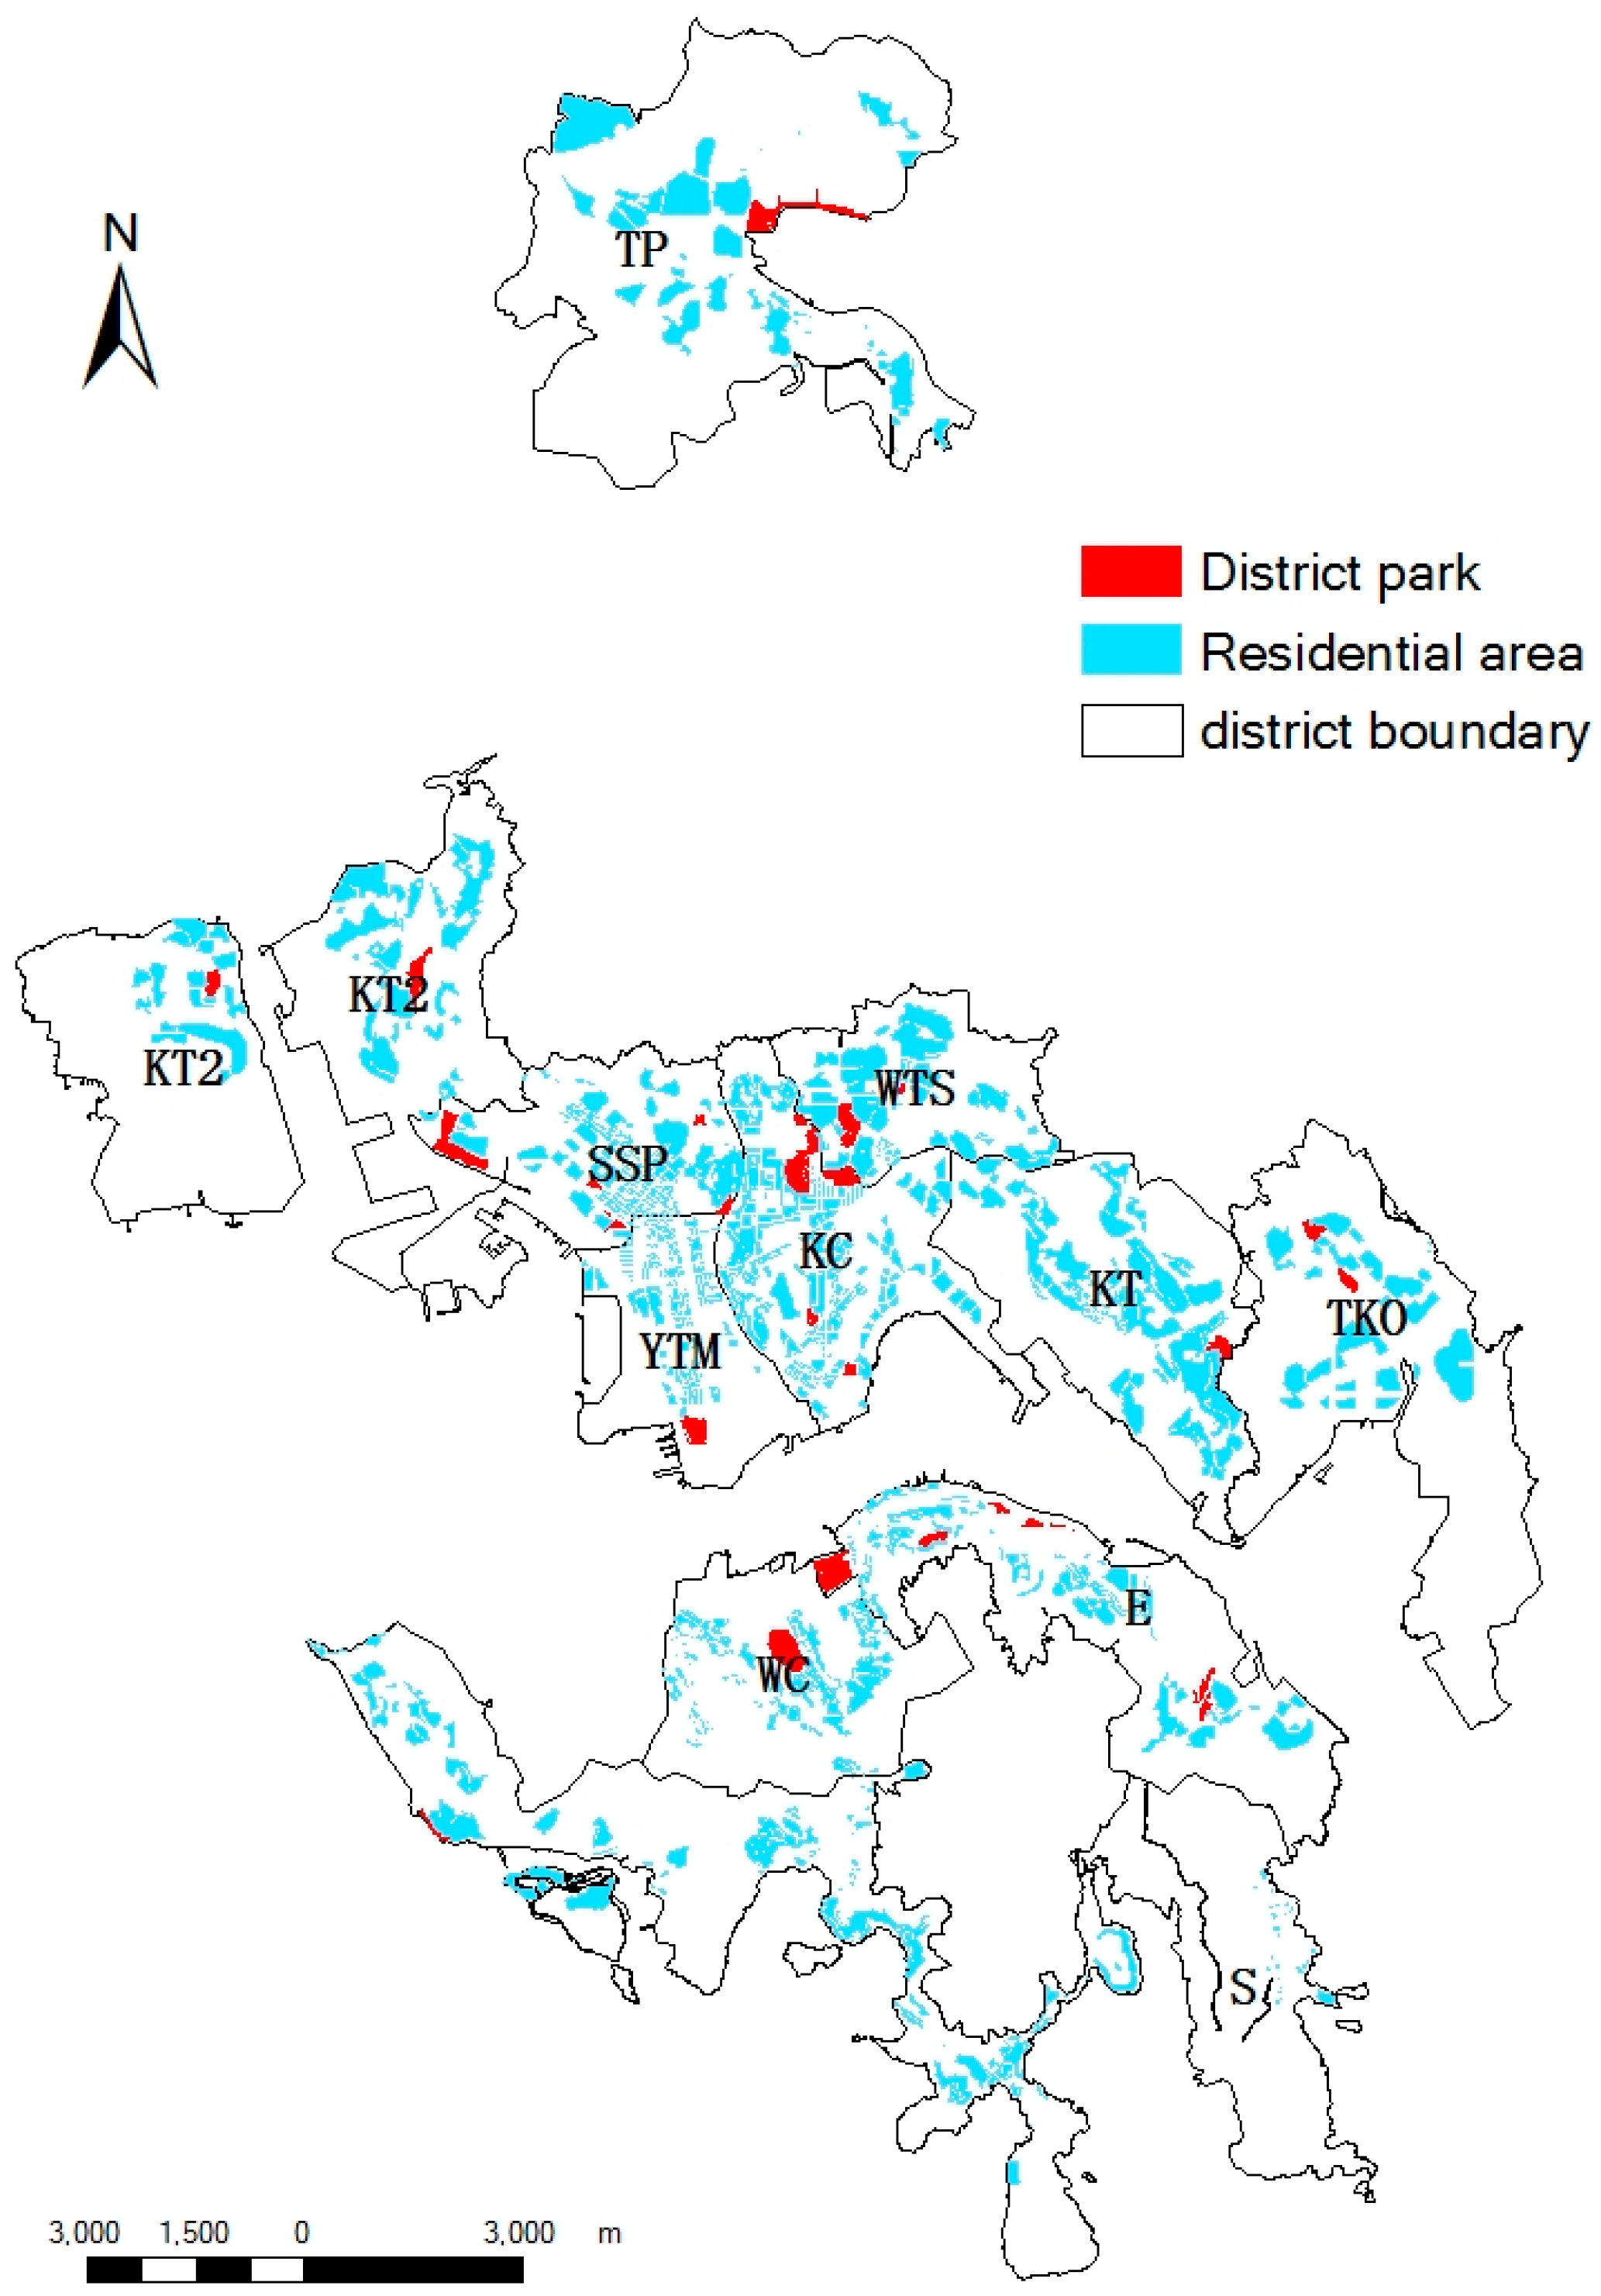
Figure 2.
Distribution of catchment zones (within walking distance) of district parks; park IDs and corresponding park names are given in Table 1.
Figure 2.
Distribution of catchment zones (within walking distance) of district parks; park IDs and corresponding park names are given in Table 1.

Figure 3.
Attractiveness index K in different district parks; park IDs and corresponding park names are given in Table 1.
Figure 3.
Attractiveness index K in different district parks; park IDs and corresponding park names are given in Table 1.
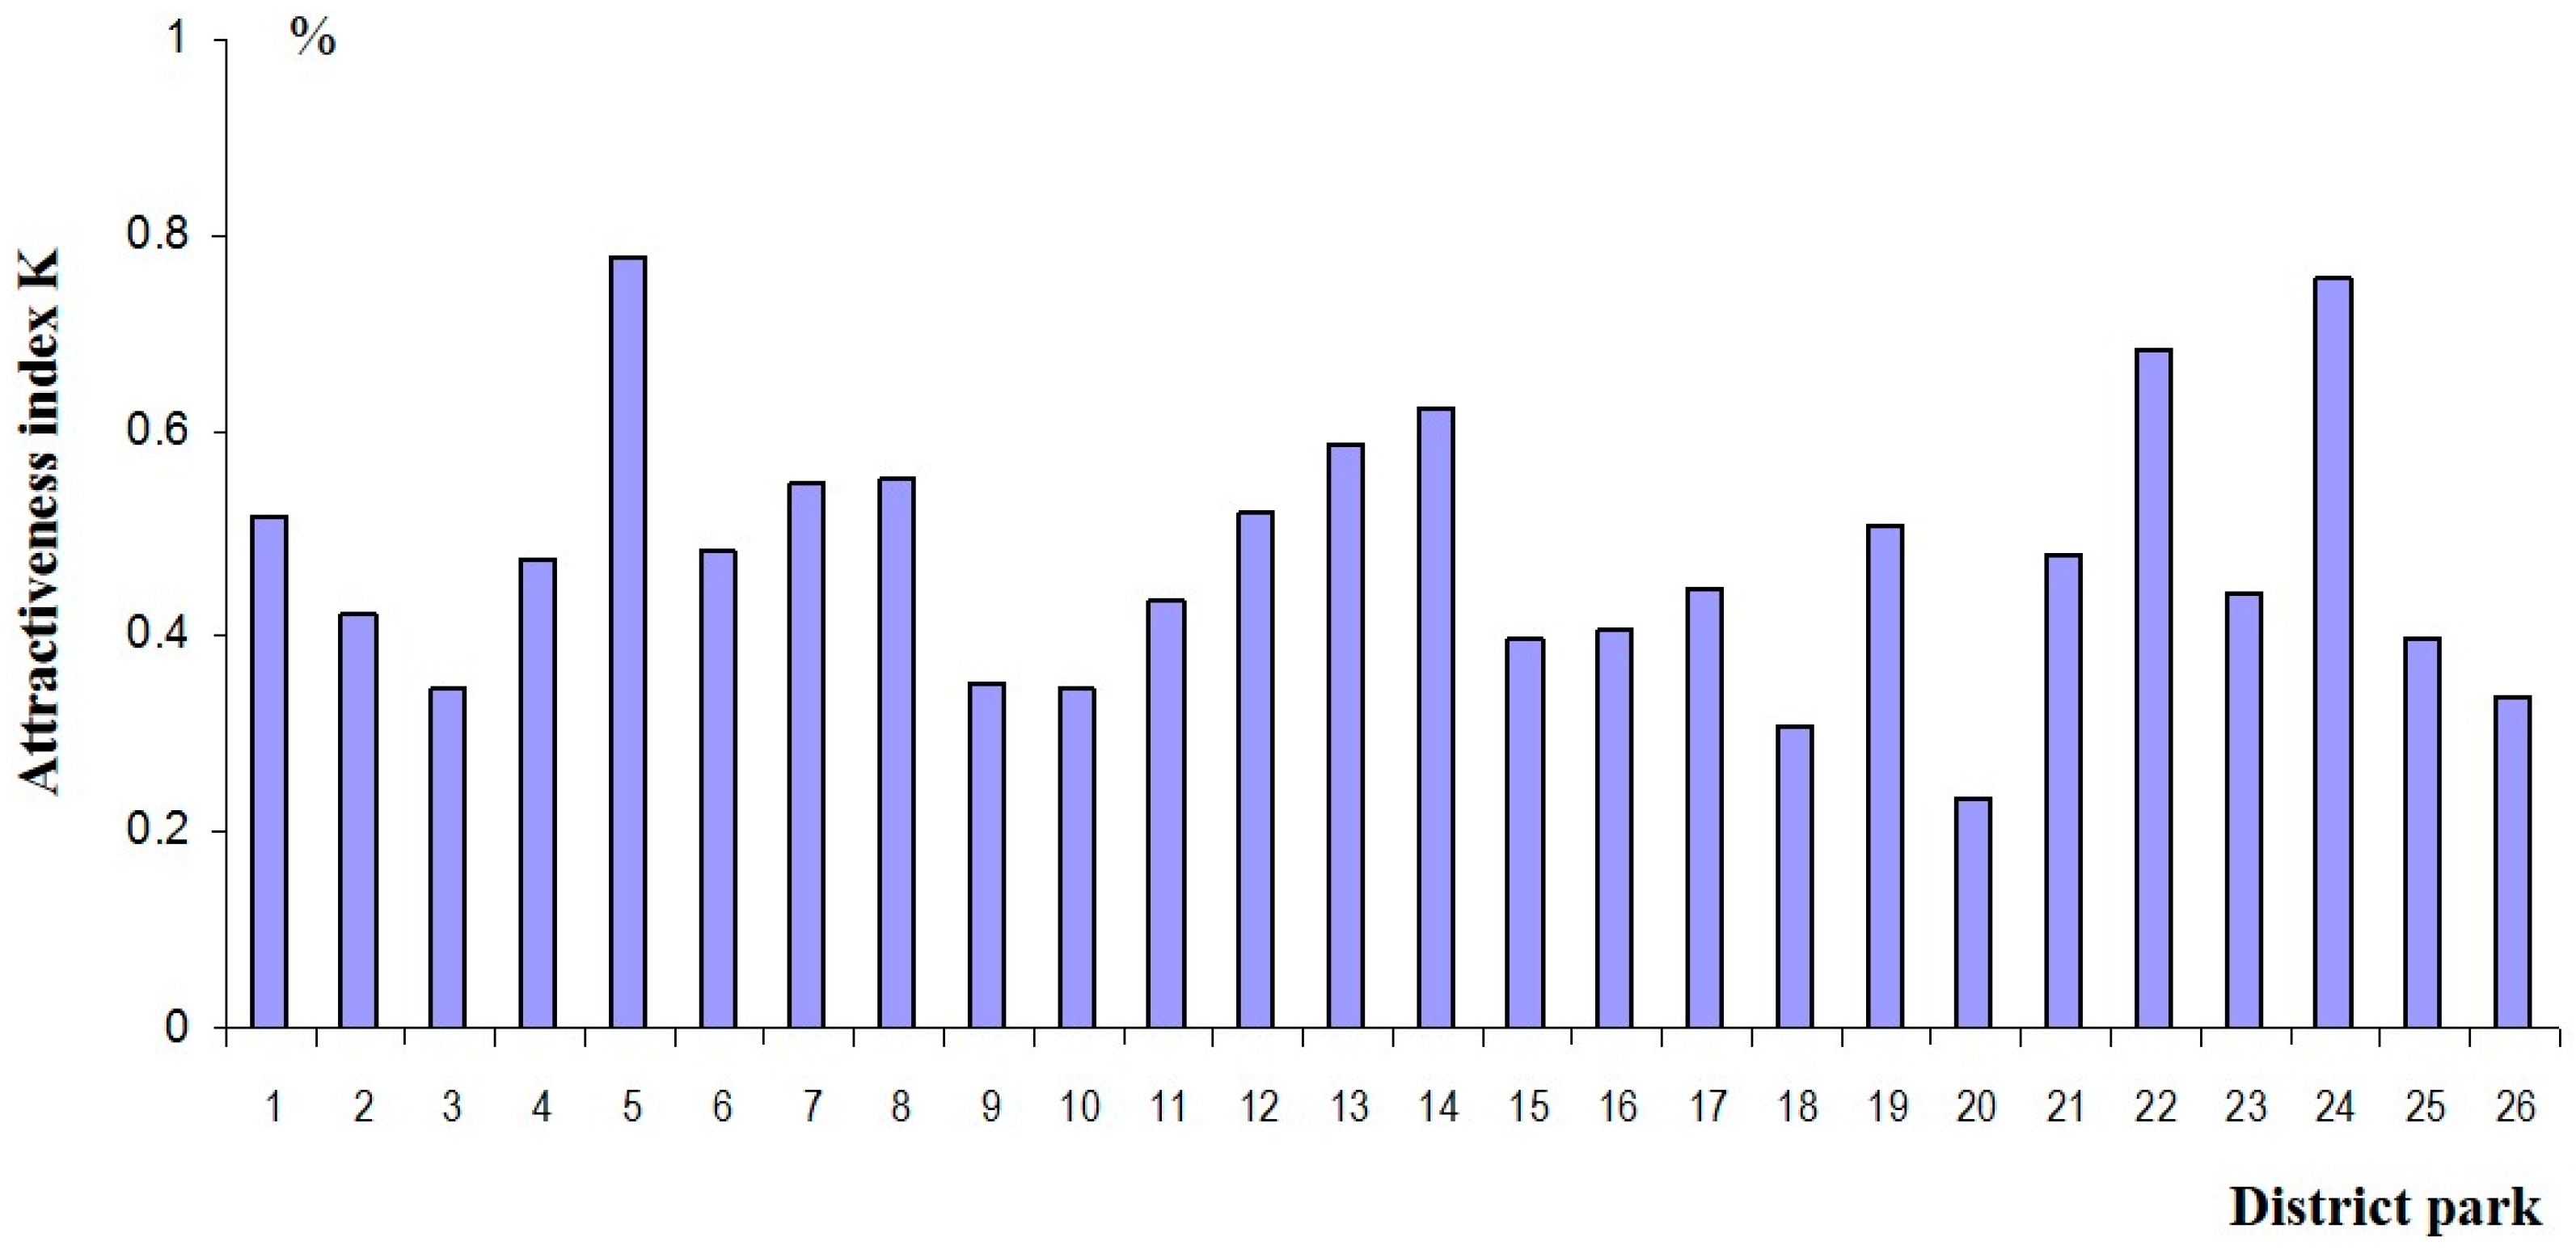
Figure 4.
Accessibility index in buffer zones (walking distance) for different district parks; park IDs and corresponding park names are given in Table 1.
Figure 4.
Accessibility index in buffer zones (walking distance) for different district parks; park IDs and corresponding park names are given in Table 1.


| District | District Park | Area (ha) | ID | ||
|---|---|---|---|---|---|
| Hong Kong Island | Central & Western | Old town | Hong Kong Park | 8 | |
| Hong Kong Zoological and Botanical Garden | 5.6 | ||||
| Belcher Bay Park | 1.85 | ||||
| Wan Chai | Old town | Happy Valley | 19.46 | 1 | |
| Southern | Old town | Waterfall Bay Park | 3.15 | 2 | |
| Eastern | Old town | Quarry Bay Park | 9.79 | 3 | |
| Chai Wan Park | 6.55 | 4 | |||
| Victoria Park | 17 | 5 | |||
| Choi Sai Woo Park | 4.41 | 6 | |||
| Kowloon | Kowloon City | Old town | Kowloon Walled City Park | 10.73 | 7 |
| Kowloon Tsai Park | 14.57 | 8 | |||
| Junction Road Park | 2.25 | 9 | |||
| Ko Shan Road Park | 2.19 | 10 | |||
| Hutchison Park | 2.88 | 11 | |||
| Lok Fu Park | 5.36 | 12 | |||
| Yau Tsim Mong | Old town | Kowloon Park | 13.47 | 13 | |
| Sham Shui Po | Old town | Lai Chi Kok Park | 17.65 | 14 | |
| Fa Hui Park | 3.24 | 15 | |||
| Sham Shui Po Park | 1.97 | 16 | |||
| Shek Kip Mei Park | 8 | 17 | |||
| Tung Chau Street Park | 3 | 18 | |||
| Wong Tai Sin | Old town | Morse Park | 11.45 | 19 | |
| Fung Tak Park | 1.06 | 20 | |||
| Kwun Tong | Old town | Lam Tin Park | 6.29 | 21 | |
| The New Territories | Kwai Chung | First-generation new town | Central Kwai Chung Park | 10.56 | 22 |
| Tsing Yi | First-generation new town | Tsing Yi Park | 6.94 | 23 | |
| Tai Po | Second-generation new town | Tai Po Waterfall Park | 22 | 24 | |
| Tseung Kwan O | Latest-generation new town | Po On Park | 4.13 | 25 | |
| Po Tsui Park | 4.24 | 26 | |||
Table 2.
Pearson correlation coefficient (CC) matrix between the sum of bh × ba and population based on Tertiary Planning Units (TPUs).
Table 2.
Pearson correlation coefficient (CC) matrix between the sum of bh × ba and population based on Tertiary Planning Units (TPUs).
| District | Abbreviation | Correlation Coefficient | Significance (Two-Tailed) | Number | ||
|---|---|---|---|---|---|---|
| Old town | Hong Kong Island | Central & Western | CW | 0.01 | 0.052 | 183 |
| Wan Chai | WC | 0.294 ** | 0 | 180 | ||
| Southern | S | 0.451 ** | 0 | 110 | ||
| Eastern | E | 0.589 ** | 0 | 207 | ||
| Kowloon | Kowloon City | KC | 0.435 ** | 0 | 234 | |
| Yau Tsim Mong | YTM | 0.124 * | 0.046 | 258 | ||
| Wong Tai Sin | WTS | 0.391 ** | 0 | 169 | ||
| Sham Shui Po | SSP | 0.605 ** | 0 | 70 | ||
| Kwun Tong | KT | 0.385 ** | 0 | 86 | ||
| First-generation new town | New Territories | Tsuen Wan | TW | 0.251 | 0.053 | 60 |
| Second-generation new town | Kwai Tsing | KT | 0.425 ** | 0 | 69 | |
| Mature new town | Tai Po | TP | 0.359 ** | 0 | 96 | |
| Latest-generation new town | Tseung Kwan O | TKO | 0.527 ** | 0.06 | 26 | |
** Correlation is significant at the 0.01 level (two-tailed); * correlation is significant at the 0.05 level (two-tailed).
Table 3.
District park classification based on accessibility index.
| Accessibility Distance (m) | Accessibility Level | District Parks * |
|---|---|---|
| 0–150 | Very low | 3, 9, 11, 13, 15, 16, 17, 18, 19, 20, 24, 25 |
| 150–300 | Low | 1, 2, 4, 5, 7, 10, 22 |
| 300–450 | Middle | 23, 26 |
| 450–600 | High | 21 |
| >600 | Very high | 6, 8, 12, 14, 19 |
* Park IDs and corresponding park names are given in Table 1.
Table 4.
Pearson correlation coefficients between attractiveness index, accessibility index, and associated factors *.
Table 4.
Pearson correlation coefficients between attractiveness index, accessibility index, and associated factors *.
| CC | RA | RF | RVC | RGT | RGC |
|---|---|---|---|---|---|
| Attractiveness index | 0.811 ** | 0.632 ** | −0.012 | 0.943 ** | 0.408 * |
| Accessibility index | 0.263 | 0.132 | −0.297 | 0.27 | 0.247 |
** Correlation is significant at the 0.01 level (two-tailed); * correlation is significant at the 0.05 level (two-tailed); RA: relative value of park area; RF: relative value of facilities; RVC: relative value of vegetation configuration; RGT: relative value of total green space; RGC: relative value of green cover.
© 2017 by the authors. Licensee MDPI, Basel, Switzerland. This article is an open access article distributed under the terms and conditions of the Creative Commons Attribution (CC BY) license (http://creativecommons.org/licenses/by/4.0/).
Share and Cite
MDPI and ACS Style
Tian, Y.; Jim, C.Y.; Liu, Y. Using a Spatial Interaction Model to Assess the Accessibility of District Parks in Hong Kong. Sustainability 2017, 9, 1924. https://doi.org/10.3390/su9111924
AMA Style
Tian Y, Jim CY, Liu Y. Using a Spatial Interaction Model to Assess the Accessibility of District Parks in Hong Kong. Sustainability. 2017; 9(11):1924. https://doi.org/10.3390/su9111924
Chicago/Turabian StyleTian, Yuhong, C. Y. Jim, and Yiqing Liu. 2017. "Using a Spatial Interaction Model to Assess the Accessibility of District Parks in Hong Kong" Sustainability 9, no. 11: 1924. https://doi.org/10.3390/su9111924
Note that from the first issue of 2016, this journal uses article numbers instead of page numbers. See further details here.