Evolution of Urban Socio-Spatial Structure in Modern Times in Xi’an, China

College of Urban and Environmental Science, Northwest University, Xi’an 710127, China
*
Author to whom correspondence should be addressed.
Sustainability 2017, 9(11), 1935; https://doi.org/10.3390/su9111935
Submission received: 7 September 2017
/
Revised: 21 October 2017
/
Accepted: 22 October 2017
/
Published: 25 October 2017
(This article belongs to the Section Sustainable Urban and Rural Development)
Abstract
:Urban socio-spatial structure has been extensively studied in the Western context but is less researched in Chinese cities, particularly those in less developed regions. To clarify its evolution and evolutionary mechanisms, the city of Xi’an is considered as an empirical case, using factor ecological analysis for modern times. Research results are concluded as follows: the types and affecting factors of social space continued to increase. Urban socio-spatial structure evolved from single-core pattern to single-core pattern with enclaves, and later showed a more mosaic tendency. The political and socio-economic backgrounds of different periods have had a great influence on the urban socio-spatial structure. The research results have theoretical significance for optimizing socio-spatial structure and understanding the urban space of Xi’an. Compared with studies of other cities in China and cities in western countries, the evolution of urban socio-spatial structure in China shows the characteristics of circle expansion and the gradual and stable transition under socialist ideology.
1. Introduction
Urban socio-spatial structure is one of the oldest and fundamental research for those who study cities. It is formed by social differentiation related to economic income, social status, lifestyle, consumption patterns and living conditions, and embodies the differentiation and combination of social groups in the geographical space [1]. It has been resurgent in recent years, and part of this resurgence is due to the development of highly advanced computational techniques, which are being applied to the analysis of massive and complex data. A further reason is the emergence of polarization and the fragmentation of labor, as well as an increasing acceptance of urban forms diversity [2,3,4], which signify the increasing socio-spatial differentiation of urban space [5]. Research has shown that the socio-spatial structure of a city is closely tied to political, economic and social transformations [6]. Given the extraordinary growth in Chinese cities and the fundamental shifts in Chinese political economy, China has attracted a substantial attention.
Our study is motivated by two aspects of concerns. Before market reform, households in China enjoyed relatively equal income, housing, education and other forms of social welfare, cities were characterized by mixed social areas based on different land use, rather than social stratification, as workers usually lived in public houses allocated by the state or units [7]. By that time, China was successful in establishing a classless urban society without significant income inequality among its members [8,9,10]. However, since the beginning of market reform and the open-door policy, the dramatic changes in the Chinese economy has created one of the most dynamic and rapidly expanding urban systems in the world [11]. Internal urban reforms, the relaxed policy on rural to urban migration, globalization processes, etc. have been shaping the transformation at an unprecedented pace [12]. Social differentiation is accompanied by enlarged disparities.
More specifically Xi’an, the largest inland city in Northwest China, provides some contrast with some larger and more developed cities in the east, like Beijing, Shanghai or Guangzhou [13,14,15]. Research in these developed cities has demonstrated a different model of socio-spatial structure from Western cities, and proved that socio-spatial differentiation is a feature of Chinese cities that is undergoing dynamic change. As a less developed city, Xi’an has its own characteristics typically associated with rapidly urban development. In addition, empirical case studies published in recent decades focus on the static analysis of a single city or a specific time [16,17,18,19], little is known about the dynamic evolution process over long periods. In this regard, the objective of this paper lies in two aspects. First, whether these is an identifiable socio-spatial structure to the city of Xi’an, and what are its unique characteristics? Second, how urban socio-spatial structure in Xi’an evolved, as compared to larger Chinese cities in more developed areas?
This paper presents an analysis of socio-spatial structure in Xi’an in different times through the use of historical documents and residential data that have been linked to a spatially rectified map of social space. This study will contribute to understanding social problems and reveal the spatio-temporal process of society’s organization and operation, thereby providing theoretical and practical frameworks for sustainable development.
2. Literature Review
Urban socio-spatial structure first developed into a research topic in geography and related disciplines during the early decades of the 20th century [20]. Studies in Western countries can be summarized in four stages. Early western scholars, represented by the Chicago School, applied human ecology to the study of residential differentiation and community studies, and proposed the classical urban socio-spatial structure model, such as single core, fan and multi core [21,22,23]. In the 1950s, Shevky put forward “social space” for the first time, and applied it to the urban spatial structure [24,25,26]. The second stage began in 1960s, and it was the stage of accumulation of empirical cases. McElrath’s analysis of Rome showed that the spatial distribution of social economic status and family status were fan shaped and circle stratified, respectively [27]. Others hold that the main factors of the urban social spatial structure in Seattle are economic status, family status, race and male population [28]. Empirical studies were concentrated in Western developed countries and regions [29,30]. The third stage, which began in 1980s, was the stage of comparison and summary, wherein the scope and depth of case studies continued to expand and attention was paid to the evolution process of urban socio-spatial structure at different times. Hunter used population data of four periods in Chicago and proposed that, while the main factor was still social economic status, the proportion of the family status factor was starting to decline and the proportion of the racial factor was gradually increasing [31]. Rowland compared the population data of two periods in Moscow, and concluded that ethnic, age, gender and education level were the main factors that lead to the spatial differentiation [32]. The fourth stage is from the late 1990s to the present, with the trend of diversified development, including the characteristics of urban socio-spatial structure in North America in a Post-Fordist movement [33], or in African and Latin American countries, a Post-Colonial movement [34], Post-Easternism in Europe and Post-Socialism in Russia [35]. In addition, technical methods of urban socio-spatial structure are widely used in social geography, such as racial segregation [36], urban poverty or crime [37] and urban gentrification [38].
Urban socio-spatial differentiation is common across many of the Western countries, with relatively few significant minority groups in the large coastal cities in China, the focus has been on other factors such as tenure [39], income [40] and migrant workers [41]. Researchers have noted that increasing levels of differentiation in the post-reform era results from an imbalance in the distribution of economic returns and social benefits and their spatial consequences during transformations [42]. Government regulated housing choices through work units and household registration, reforms of housing distribution, land use policy encouraged governments to initiate growth-led neoliberal practices in the housing market, which directly caused significant socio-spatial differentiation [41]. The relaxed policy on rural to urban migration is also influential in the transformation of urban socio-spatial structure [43]. Through institutional transition in work units, workers turned into employees and accordingly lost their privileges in housing, welfare or education. This socio-spatial complexity in Chinese cities has pushed researchers to use techniques to find interpretable patterns, such as Guangzhou, which existed as a concentric pattern with the old urban core surrounded by reform housing [44]. Kunming presents a paradoxical relationship between the rates of neo-liberalist social differentiation and urban restructuring [11], Nanjing demonstrated a concentric pattern with the lower-profiled social areas encircling the areas of the provincial-government cadre housing, which in turn surrounds the high-status cluster in the city center [15]. In addition, some culture-based or education-based gentrification of artists or “jiaoyufiers” appeared in inner cities [45,46].
Research methods of urban socio-spatial structure first appeared in the school of Human Ecology, where researchers applied the concepts of competition, dominance, symbiosis and invasion in natural ecology to the analysis of urban social space [47]. On this basis, the Chicago School made a preliminary study of urban community, ethnic agglomeration, urban crime, residential differentiation, and proposed three classical models [21,22,23]. The prosperity of urban socio-spatial structure appeared in 1960s, quantitative factor ecological analysis and hierarchical cluster analysis were carried out. Emergence of philosophical trends, such as positivism, humanism and structuralism, has expanded the research perspective of urban socio-spatial structure [48]. In 1970s, the Ecology School, Neo Classicism School and Behavior School became the mainstream of the study of urban socio-spatial structure, and then the Neo Marx School and Neo Weber School became the mainstream theory [49]. Since 1980s, the trend of Cultural Regression had led to the introduction of non-material analysis methods [50], such as Cultural Value Analysis, Ethical Analysis and Emotional Analysis, into the interpretation of urban socio-spatial structure [51]. In the late 20th Century, under the influence of humanism, different scholars began to use the method of time geography to study social space. Among all these methods, Factor Ecological Analysis is an effective method for describing the distribution of urban social phenomenon within a regional space [52]. It uses demographic data, social data and housing indicators in census data to extract main factors that influence the urban socio-spatial structure, and determines social space according to the main factor score cluster, and provides a useful tool for identifying social space. In this paper, we use this method to do research.
The study of the evolutionary mechanisms of urban socio-spatial structure began in 1950s. Three major mechanisms (social and economic status, family status and racial status) are concluded in the study of highly industrialized immigrant cities, such as the United States and Canada [53,54]. European cities are less obvious because the unitary national structure, national structure, social and economic status and life cycle are considered the main mechanisms [55]. Analysis of cities such as Calcutta and Cairo showed that conflict between traditional culture and modern civilization was the greatest influence on evolution [56], while analysis of Post-Socialist cities indicated that the main evolutionary mechanisms were social status and housing migration [57]. These studies are related to the political, economic and social background, and reflect the important influence of different times, different political, economic and social backgrounds on the evolution of urban socio-spatial structure. Compared with other countries, China has its unique aspects in political, economic system, ethnic and cultural background. In this paper, we give a hypothesis, that these differences determine the urban socio-spatial structure and evolutionary mechanisms of its own characteristics.
3. Methodologies, Case Study and Data
3.1. Methodologies
3.1.1. Factor Ecological Analysis
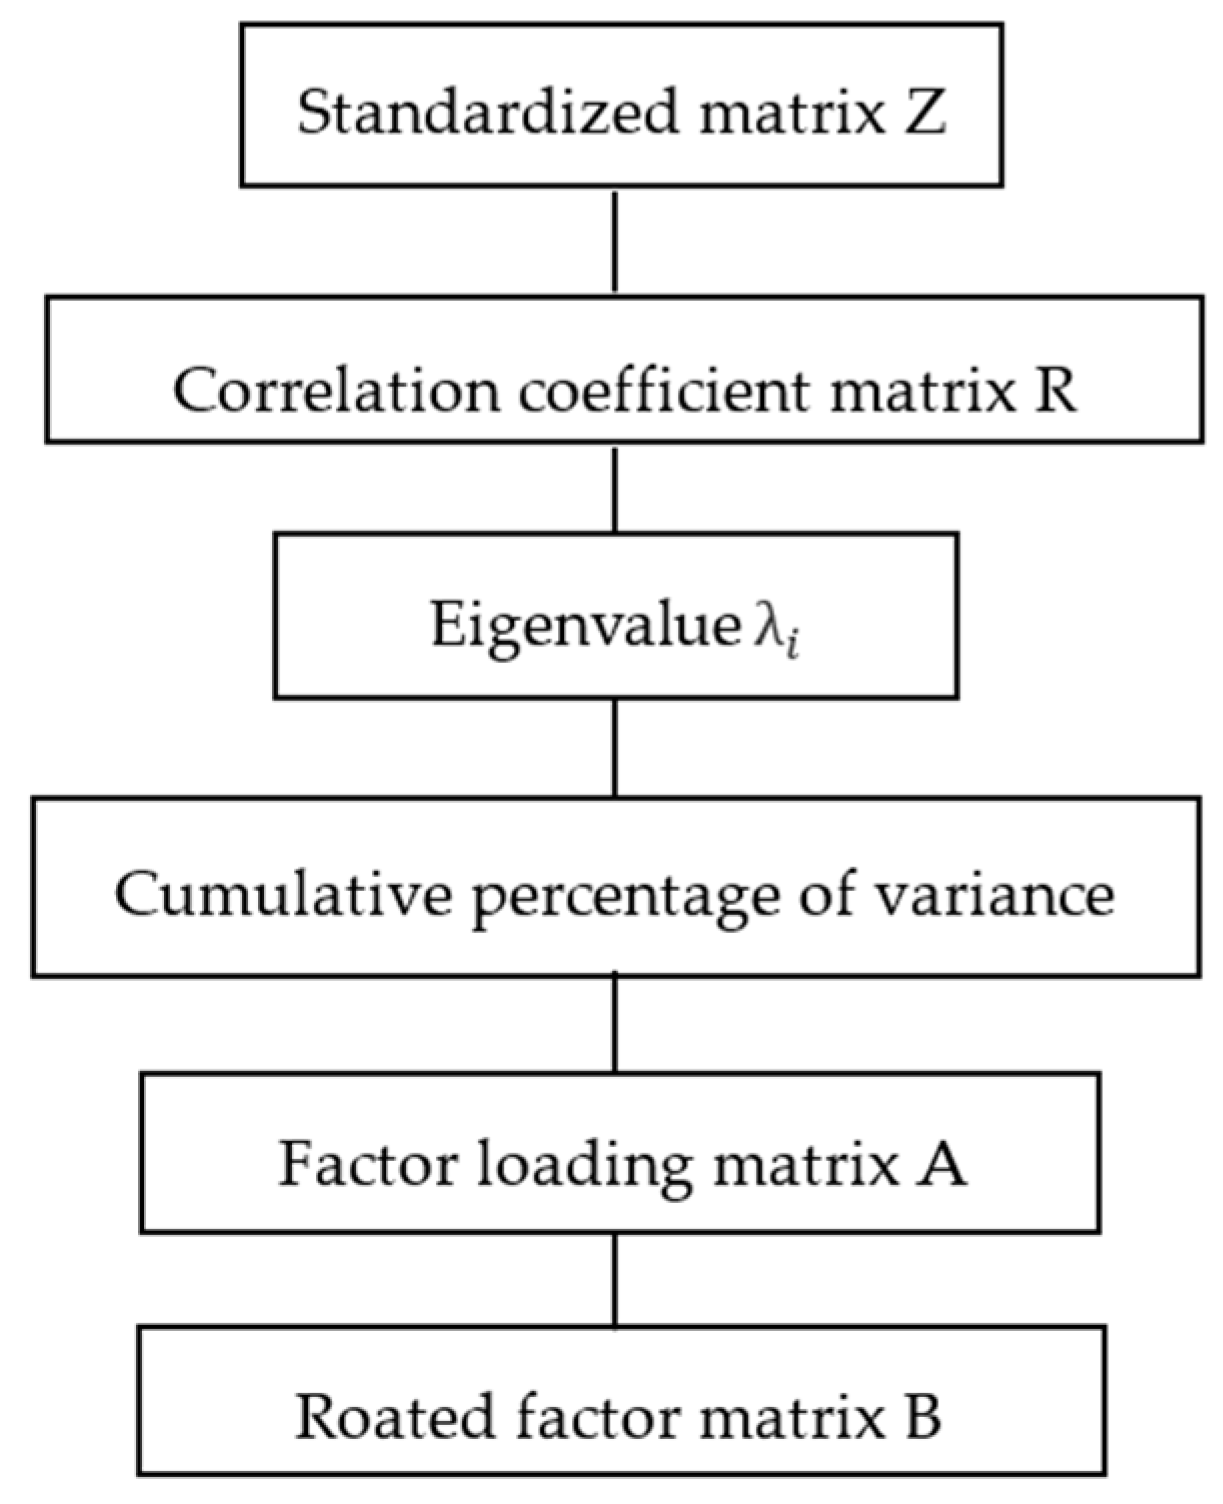
Factor ecological analysis is a mathematical method to reduce the dimension of data. The precondition of factor ecological analysis is the data processing of computer, the development of multivariate statistical analysis and the arrangement of statistical data [58]. The basic principle of this method is to sum up the original variables into a few comprehensive indexes. Determining the main factors is to examine the load of the original variable on the main factors, that is, the eigenvector corresponding to these larger eigenvalues. In this paper, we use this method to identify the impact factors of social space. It consists of these steps (see Appendix A Figure A1):
- (1)
- n samples with p variables make up the data matrix X.
- (2)
- Standardized transformation of data matrix X to obtain standardized matrx Z.
- (3)
- Use matrix Z to obtain correlation coefficient matrix R.
- (4)
- According to characteristic equation of = 0, we get eigenvalue , ≥ ≥ … ≥ ≥ 0. Eigenvector is coefficient of main factor Fi.
- (5)
- If cumulative percentage of variance ≥ 80%, the value m will be these main factors.
- (6)
- Factor loading matrix is calculated.
- (7)
- In order to better explain the common factor, the matrix A is rotated by maximum variance to obtain matrix B.
The following social space indicators are considered in Table 1. The assumption is that these indicators best reflect changes in different phases and that the greatest deviations between individual population categories would be precisely reflected by these indicators:
“Population scale” includes total population, mean family size and sex ratio (Male/Female). The increasing population scale is the basic reason for the gradual increase of social stratification and population heterogeneity. Family is the basic unit of social space, traditional society advocates the large family of many generations, but the urban family tends to be smaller. Mapping sex ratio on a micro-scale provides a starting point to assess its geographic patterning, followed by a geo-statistical analysis of spatial dependence [59].
“Household registration types” includes percent urban and rural population. The household registration (hukou) registers all citizens as rural or urban. Chinese nation is highly segregated when it comes to wages, social services and welfare benefits, access to education and employment. These unequal conditions to a great extent are affected by types of household registration [60].
“Age distribution” includes percent of ≤14 years old, 15–59 years old and ≥60 years old. Generally speaking, the proportion of elderly is larger in the old urban areas and the proportion of young people is larger in the urban fringe areas; age structure is often used as an analysis variable to reflect the difference in the residential location among different age groups [61].
“Educational background” includes percent of illiterate or semiliterate, primary education, junior education, senior education, university education and postgraduate education. People with higher educational background have higher requirements for the educational environment [62], and most people want to live with intellectual or population with higher cultural level, so that the next generation could have a positive growth environment.
“Industry distribution” includes percent agricultural and fishery, percent mining and timber transport industry, percent manufacturing, percent construction, and so on. Industry plays an important role in shaping urban social space [63]. The division of labor, the change of system, the expansion of space of industrial space have a direct impact on the social space, at the same time, the structure form and human environment of social space provide space support for industrial space, or sometimes restrain the development of industrial space.
“Occupation distribution” includes percent government, institution, managers/officers, and enterprise managers, percent clerical and related workers, percent frontline workers in commerce, and so on. What kind of occupation a person has directly affects his income and social status. Occupations of the same population tend to live in the same area to facilitate the transfer of job information [64]. For example, most factory workers live in the staff dormitories near the factory to reduce commuting time.
“Housing environment” includes mean number per household and mean building area per household. Diversification of housing supply has been resulting in increasing socio-spatial differentiation. Housing space and social space show more significant relationship [65]. The better the quality of housing, the bigger the residential area, the social characteristics of residents tend to be higher.
3.1.2. Hierarchical Cluster Analysis
This paper uses the ward method of hierarchical cluster for analysis. Each sample is defined as one group, and two groups of the smallest sum of the squares of deviations are combined into a new group until all the samples are classified into one group. In this paper, we use this method to divide social space. The mathematical model is as follows (see Appendix A Figure A2):
- (1)
- n samples with k variables make up the data matrix X. represents the i sample in Gt, represents the number of samples in , and is the center of gravity of . Then we calculate sum of squares of deviations () of and sum of squares within Group K (S).
- (2)
- Then we calculate the distance between group and group .Dpq2 = Sr − Sq − SqGr = GpYGq
- (3)
- Then we calculate the distance between merge group (Dkr2).
- (4)
- The nearest group will be merged until all the groups are merged into one.
3.2. Case Study and Data
The study area, Xi’an, is located at 34°16′ N latitude and 108°54′ E longitude, and has an average elevation of 1027 m above sea level. It is the administrative center of the Shaanxi Province and lies in the central-northwest of China, resident population was 8.83 million at the end of 2016 [66]. Xi’an contains the Eastern terminal of the Silk Road [67]; along with profound culture and favorable development conditions, it has long been an important national base of scientific research, education and industry, both historically and presently. From the Western Zhou Dynasty in the 1046 BC to Qing Dynasty in the 1912, 13 dynasties established their capitals here, including the Western Zhou Dynasty, Qin Dynasty, Sui Dynasty and Tang Dynasty and so on [68]. At the end of the 19th Century, the victory of Xinhai Revolution ended Xi’an’s position as a military fortress in the northwest region during the feudal dynasty [69], Xi’an entered Modern times, the repair of the Longhai railway and the migration of national industry promoted the development of modern industry in Xi’an, and therefore, the resident population in this period increased from 111.62 thousand in 1912 to 2.27 million in 1949 [70,71]. After the founding of the People’s Republic of China in 1949, China implemented a planned economic system and vigorously developed industries. Since then, Xi’an has been transformed into an industrial city in the interior region, and a large number of factories have been built in the western and eastern suburbs, universities and research institutions concentrated in the southern suburbs, and northern suburbs have become a storage area, due to their proximity to the Longhai Railway [72]; urban function layout of Xi’an had taken shape preliminarily. In 1992, China’s economic restructuring goal was changed into the establishment of a socialist market economic system, which promoted the political, economic and social diversification, and the gap between residents of different social classes gradually widened.
It can be seen that modern times are crucial to the rise and development of Xi’an’s socio-spatial structure. It is of theoretical and practical significance to understand the evolution of urban socio-spatial structure for solving social problems and decision-making of urban planning and government departments, and it can provide a dynamic analysis of the results of the study on the socio-spatial structure of China’s cities. According to the repartition method from the literature review, modern times are divided into the modern society period (1840–1949), the planned economy period (1949–1992) and the transitional period (after 1992) [73]. Considering these long time series and the continuous adjustment of the division of administrative regions in the micro unit, the current research mainly focuses on the municipal district of each period. The spatial analysis pertains to the administrative and territorial unit of the city. The analysis is conducted at the level of the jiedao, which are the smallest spatial units for which there is orderly and published statistical documentation.
Data in this article come from national population census in each period, namely, statistical yearbooks of each city published by the cities’ Statistical Bureaus. Population census is a scientific method used to collect population information all over the world, and is the main source of basic population data. The census data reflects specific situation of national population and population structure, and it is a large-scale national condition information base for the formulation of the national economic and social development plan, the rational allocation and effective use of labor resources. It is also an indispensable material for the study of demography, sociology, economics and medicine. In the modern society period, Xi’an consisted of Xianning county and Chang’an county, and the municipal district was concentrated inside the city walls. Due to the lack of statistical data, historical documents are mainly used for qualitative descriptions of urban social space, and the comparisons cannot be made with the other two at the same level. For the planned economy period, the municipal district includes 61 jiedao in Xicheng District, Beilin District, Lianhu District, Weiyang District, Yanta District and Baqiao District are used, as well as the third population census data of 1982, which is used for quantitative descriptions of urban social space [74]. For the transitional period, the research scope includes 53 jiedao (some jiedao were merged) in Xicheng District, Beilin District, Lianhu District, Weiyang District, Yanta District, Baqiao District and Xi’an High-tech Development Zone, Xi’an Economic and Technological Development Zone, and Qujiang New Zone. The sixth population census data of 2010 is used for quantitative descriptions of urban social space [75].
4. Evolution of Urban Social Space in Modern Times in Xi’an
4.1. Types of Urban Social Space in the Modern Society Period
The modern society period refers to the time from the end of the Opium War to the founding of the People’s Republic of China. The victory of Xinhai Revolution in 1912 ended Xi’an’s position as a military fortress during the feudal dynasty. New policy implementation changed the spatial structure of Xi’an, including the collapse of Mancheng. Before the Opium War, the Qing Dynasty ruled China, it was a feudal dynasty established by Manchu people, they were concentrated in the town in the northeast corner of Xi’an city, which was called Mancheng. With the end of the Qing Dynasty, the houses in Mancheng were almost destroyed [69]. These factors extended the Longhai Railway, and facilitated the construction of Xi’an airport [76]. The Counter-Japanese War in 1931 made the eastern provinces suffer first. Senior government officers, war refugees and other migrants were forced to move to Xi’an, which led to a rapid increase in population during the period [77]. At the same time, a large number of factories and enterprise workers moved into Xi’an, together with the convenient traffic of Longhai Railway and Xi’an airport, which stimulated the development of modern industry. Hui Fengxiang, Wen Shengxiang and other foreign goods shop had been founded with the Machine Bureau, Daxing textile factory and other new industrial enterprises [78,79]. Social strata were separated into industrial, military, commercial, and agricultural sectors [80]. In general, in the modern society period, military functions of Xi’an gradually declined, and the new functions and functional departments were gradually emerging. According to the differences of residents’ social status, occupation, living conditions, etc., social space in the modern society period can be divided into 4 types (Figure 1) [81]. The base of this figure was land use map of Xi’an in 1934. Our analysis focused the area within the city wall, as it can be seen from the figure that out of the city wall, more than 90% was still agricultural land.
Next we consider the area of migrants. After Xinhai Revolution in 1912, the northeast of Xi’an became a decline area, which provided the development land for the increase of population scale [78]. The repair of Longhai railway and the outbreak of Counter-Japanese War brought a large number of migrants from Henan, Shanxi and other eastern provinces, the population density increases rapidly, the northeast area gradually become the distribution area of migrants [82].
The area of government officers and new enterprise workers: a group of high-ranking bureaucrats and warlords gathered in the southeast corner of the city, such as Kim Lane, named by Xi’an police station, with 90% of living residents being Kuomintang senior officials and rich people. Zhang Xueliang (Kuomintang senior general) mansion, Gao Guizi (Kuomintang lieutenant general) mansion, and Bank of Shaanxi province and their families were also here [83]. This area developed into distribution area of government officers. In addition, about 40 national enterprises moved to Xi’an in order to plunder against Japanese [84], mainly near the North gate and East gate [76]. Some skilled workers also moved with the factory, as the limited traffic conditions, they lived nearby in the dormitory near the factory and forming distribution area of new enterprise workers.
The area of business and guild halls. Xi’an planning in 1932 recorded “the commercial tenants are mostly concentrated in the central and south” [78], buildings in this area had same layout of shop in front and housing at the back or shop in lower layer and housing in upper layer, which make the commercial population coupled with the commercial distribution [78]. In addition, the guild hall was a feudal community composed of countrymen and has the function of organizing commerce in accordance with region or industry, such as Shandong Guild Hall, Sichuan Guild Hall, Medicinal Guild Hall and Cloth Guild Hall [85,86]. The commercial agglomeration brought by guild halls also made the area a commercial center.
The area of traditional handicraft and modern machine industry. At the early stage of modern society period, the handicraft industry was the main type of industry, including umbrella making, jewelry making, wood species and other species, mainly distributed in the west gate [87]. After the repair of Longhai Railway and Counter-Japanese War, modern machine industry flooded into Xi’an, such as leather industry, printing industry and chemical industry, mainly located in the northwest near the railway [77].
4.2. Types of Urban Social Space in the Planned Economy Period
After the founding of the People’s Republic of China, the country vigorously carried out the planned economy and developed industry [88]. The function of Xi’an changed from a political city into an industrial city, a large number of chemical or manufacturing factories were built in the suburbs, and formed the functional layout of industrial areas in the western and eastern suburbs, the educational areas in the southern suburbs and the storage areas in northern suburbs [72]. Social space has been formed and developed on the basis of functional layout. The welfare distribution system in this period had formed the unit communities, workers belonged to different work units, based on their length of employment, age, position and educational background, and so on, to obtain housing [89,90]. Unit communities integrated working space and residential space, and became a basic unit of urban social space [91]. Socialist China was successful in establishing a classless social space without significant income inequality. Taking the differentiation of occupation and units as the symbol, it constitutes the main characteristics of social space in Xi’an during the planned economy period.
According to the eigenvalue obtained by factor analysis, the following 4 main factors were extracted to explain the variance, and the cumulative contribution rate was 82.14% (Table 2). The principal factor of the matrix is extracted by the sum of squares of deviations. After 25 iterations, the factor load matrix was obtained (the detailed statistics can be found in Appendix A Table A1).
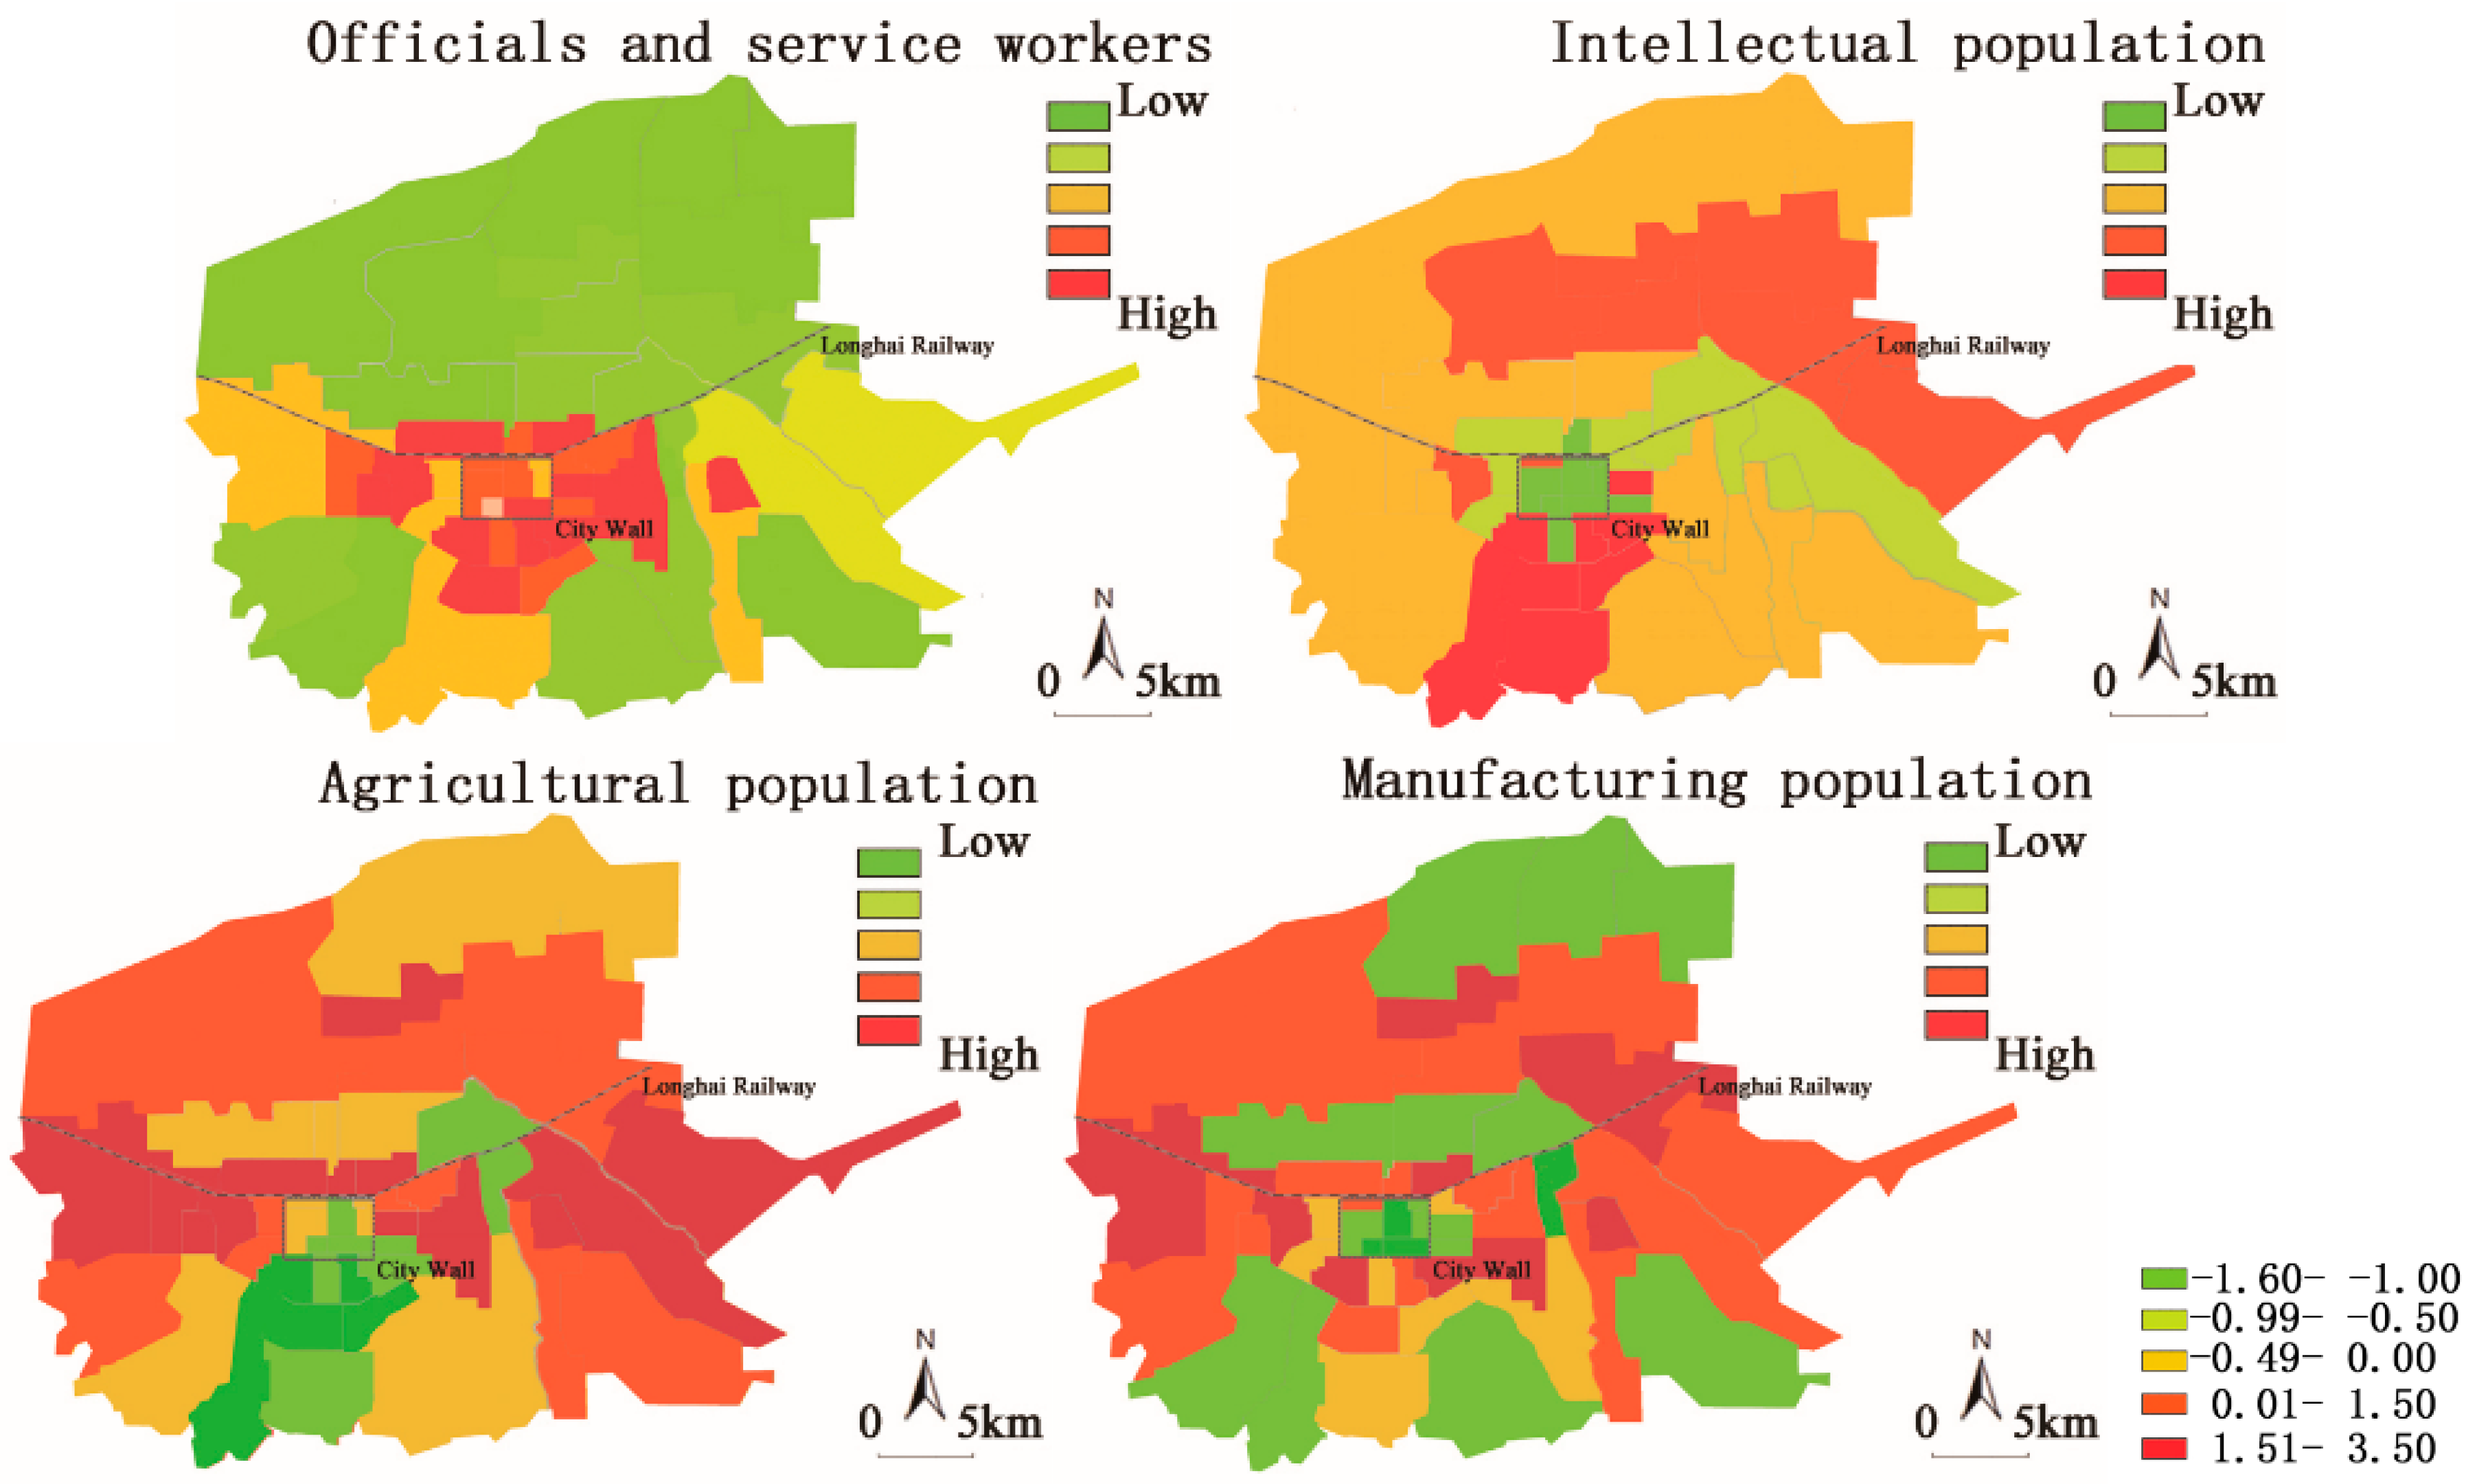
The first main factor was the officials and service workers, it had an obvious positive correlation with the total population, percent state, party, and community organizations, and percent frontline workers in services and so on, which reflected the proportion of the population with higher political and social status. The second main factor was the intellectual population, it had an obvious positive correlation with percent university or postgraduate education, percent scientific research and comprehensive technical service and so on. The high value was due to the universities and scientific research units concentrated in the south. The third main factor was the agricultural population, it had an obvious positive correlation with percent agricultural population and percent agricultural and fishery and so on. Its high value was due to the western and eastern industrial districts. The fourth main factor was the manufacturing population, it had an obvious positive correlation with percent transport and communications and percent production workers, transport workers and so on. Its high value indicated a point pattern outside the city (Figure 2).
The data matrix was created using the four main factor scores based on each jiedao, and the social space was divided using hierarchical cluster method. First, we analyzed the basic data matrix with fast classification to divide them into 5 categories. Then we calculated the square sum mean of the scores of 4 main factors in different social space (Table 3), and judged the characteristics of the social space, then named the 5 types of social space accordingly (Figure 3).
The area for officers and commercial service population. The typical characteristics of this area were people engaged in business, public utilities and enterprises and institutions. The spatial distribution was concentrated in the center of the city, which was commercial center and the seat of the original city government.
The area for the intellectual population. The typical characteristics of this population were generally higher education level, mainly engaged in education, culture and scientific research. It was located in the southern suburbs of Educational City, the southern suburbs had the largest number of universities and research institutes in Xi’an [92].
The area for industrial workers. The population of this region was typically characterized by occupations such as industrial production and textile processing, and was spread over industrial and storage areas, like the western suburbs of Electrical City, where concentrated electrical equipment and machinery manufacturing factories, and the eastern suburbs of Textile City, where concentrated cotton processing factories and textile and dyeing factories [92].
The area for the agricultural population. The typical characteristics of this area were people engaged in agricultural production, and their family scale was relatively large. This area was located on the outer edge of the city, such as the southern suburbs, southeast suburbs and southwest suburbs.
Finally, the area considered as mixed residential areas. Residents’ occupational structure was diverse, including education, manufacturing, and social services. This area was located around the central city, outside the area of officers and commercial service population.
4.3. Types of Urban Social Space in the Transitional Period
Since the 1990s, China has entered the transitional period in which the planned economy has changed to the market economy. On the one hand, the relaxed policy on the household registration system has attracted a large number of migrants to urban areas, the reform of land use system and housing market have promoted the unit disintegration compound, which was originally organized by housing, work and social services, and urban social space now show the differentiation, polarization and fragmentation that are gradually becoming more prominent [93]. On the other hand, the urban function of Xi’an has developed from single industrial production to a diversified economic function [72]. The changes of employment structure and income structure have important influence on social diversity, which led to a widening gap among residents with different social statuses, economic incomes, occupations or educational backgrounds. Urban social space in this period is in the process of continuous reconstruction and integration.
According to the eigenvalue obtained by factor analysis, the following 5 main factors were extracted to explain the variance, and the cumulative contribution rate was 80.08% (Table 4). The principal factor of the matrix is extracted by the sum of squares of deviations. After 25 iterations, the factor load matrix could be obtained (the detailed statistics can be found in Appendix A Table A2).
The first main factor was officials and service workers, it had a positive correlation with some variables including percent state, party, and community organizations and percent frontline workers in services. Its high value was in the southern and southwest of the city, occupations were mainly business services. The second main factor was housing quality, it had an obvious positive correlation with the average housing area and number of rooms, and its high value was due to the southern suburbs. The third main factor was the manufacturing population, it had a positive correlation with percent manufacturing and percent junior or senior education. Its high value was due to relatively well-developed manufacturing areas on the east and west of the city. The fourth main factor was the intellectual population, it had a high correlation with variables including percent non-agricultural population, and percent university or postgraduate education. Its high value was due to the south of the city, which was concentrated with universities and research institutions. The fifth factor was the agricultural population, it had a high correlation with percent agricultural population and percent agricultural and fishery (Figure 4).
The data matrix was created using the 5 main factor scores based on each jiedao, and social space was divided using hierarchical cluster method. First, we analyzed the basic data matrix with fast classification to divide them into 7 categories. Then we calculated the square sum mean of the scores of 5 main factors in different social space (Table 5), and judged the characteristics of the social space, then named the 7 types of social space accordingly (Figure 5).
The area for officers and the commercial service population. The typical characteristic of this region was mainly engaged in wholesale, business services, the government agency party and others. The population was crowded and the living conditions were poor. The spatial distribution mainly concentrated in the old city, it faced with outstanding problems such as laid-off workers, declining living environment and so on.
The area for the intellectual population. The fourth main factor is outstanding. The educational level of residents in this area was generally high. The spatial distribution mainly concentrated in the south, where universities and research institutions were concentrated.
The area for industrial workers. The third main factor is outstanding. The population in this area was mainly engaged in the construction, machinery manufacturing, textile production and transportation, and so on. It was located in the eastern suburbs, the western suburbs and the urban fringe.
The area for the agricultural population. The spatial distribution was concentrated in the suburbs far away from the centre. Most of the towns here were mainly agriculture based, residents mainly engaged in agricultural production, and their family scale was relatively large.
The area for the emerging class. The population was mainly engaged in new kind of industries, such as innovative service industry, high-tech industry or biological industry, and so on. The spatial distribution was concentrated in these Developed Zone, such as Xi’an High-tech Development Zone, Xi’an Economic and Technological Development Zone, Qujiang New Zone [94].
Urban villages and shanty towns. The population was mainly engaged in wholesale and retail trade, catering and business services, and so on. This area was mainly located in the north of Longhai railway, such as Ziqiang Road, Jingshang Village, Gangjia Village, etc. Houses in the area were mainly built on the basis of illegally built houses or villagers’ illegal buildings, quality of these house was generally poor.
The area for migrant population. Scores of the manufacturing population and agricultural population were high in this area, and these populations were mainly engaged in wholesale, retailing and catering, production and transport, geological survey, construction and other labor based industries. In order to separate it from the area of industrial workers, we conducted a social survey and found that 40–60% was migrant population from other provinces like Henan or Shanxi. Education level is mainly junior middle school level, accounting for about 30–50% of the total population. This area was located in the outskirts of the city.
5. Analyses of Evolution of Urban Socio-Spatial Structure of Xi’an
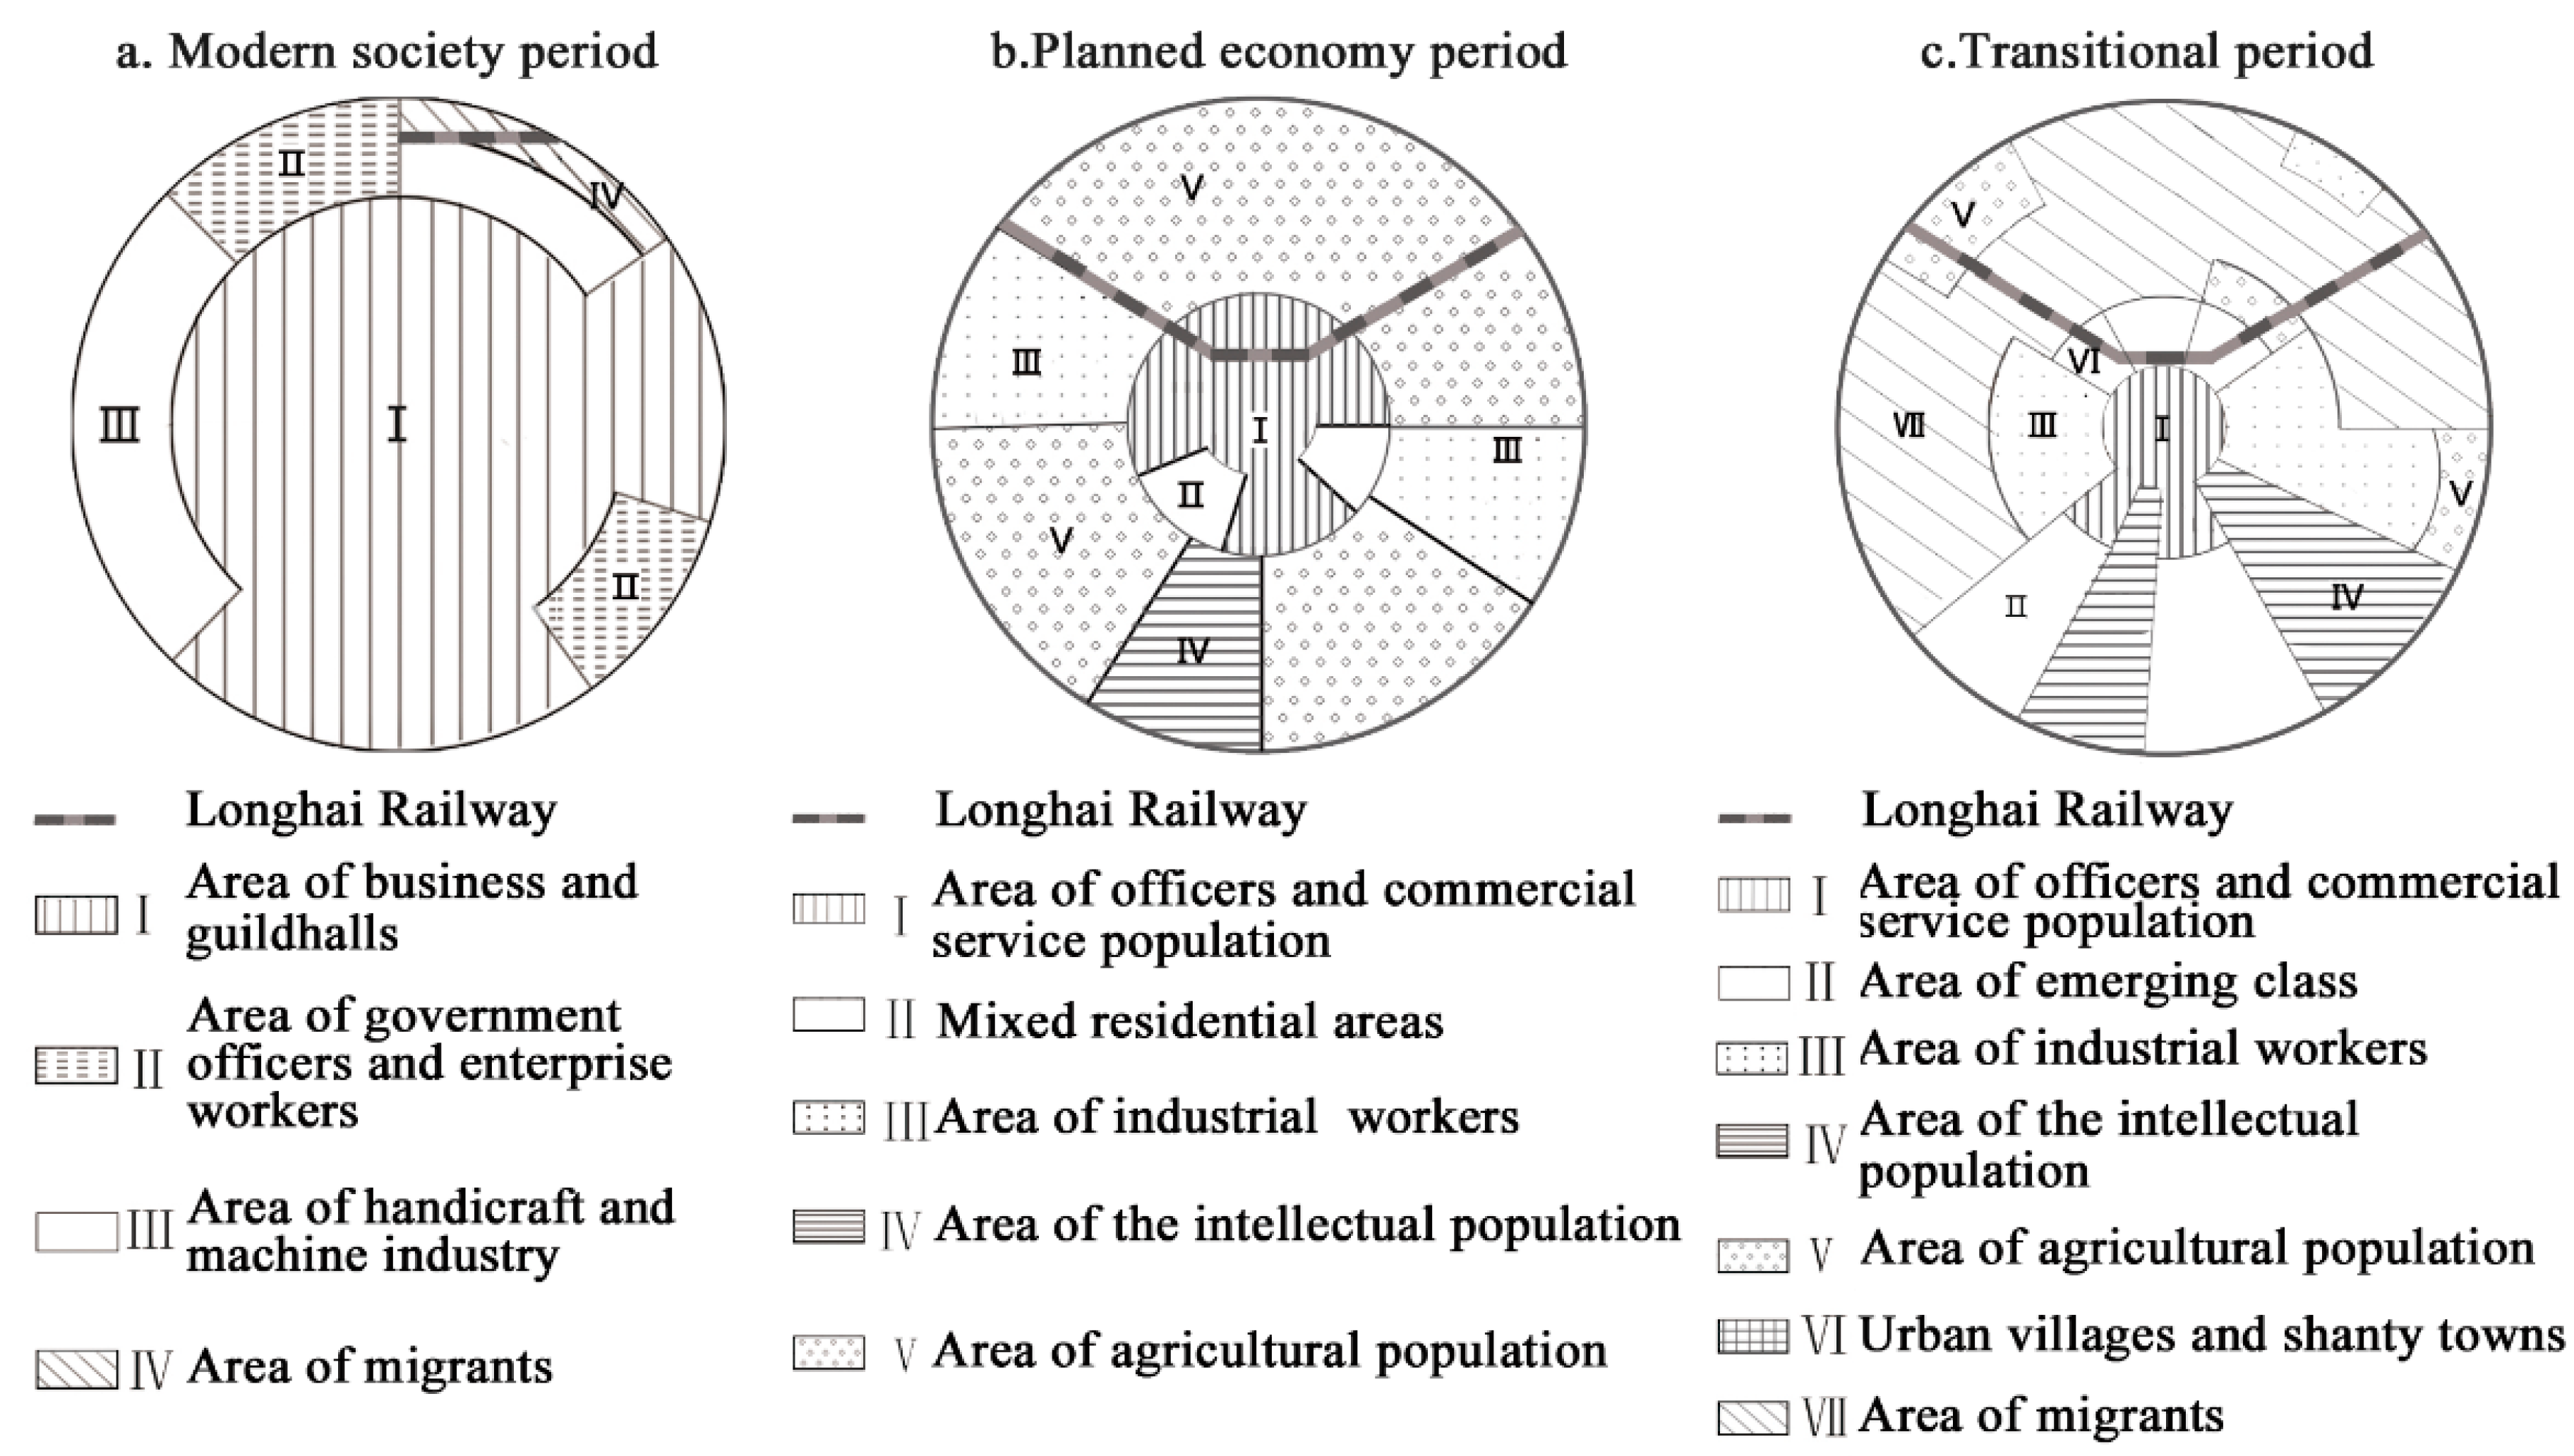
According to the distribution of social space in different periods, combining with the urban spatial structure, we can get the socio-spatial structure model of these three periods (Figure 6).
In the modern society period, the urban space was based on the development of old central city, where the space exhibited a single-core pattern. There were three types of differentiation inside the city: the geographical and cultural differences between the migrants brought by the Longhai Railway and the local residents; the economic disparities between high social status populations and refugees, and the residential form differences between the new communities built by new enterprises and the traditional communities (Figure 6a) [95]. Note that because the limits of the city in this period are within the boundaries of the city walls, Figure 6a deals with a clearly smaller area than Figure 6b,c.
In the planned economy period, the urban space was based on the development of enclaves [96]. and it generally exhibited a single-core pattern with the synthesis of sectors and enclaves. Industrial enclaves about machinery manufacturing, textile producing, and more were mainly located in the eastern and western areas. Scientific and educational enclaves were in the southern areas, and large enterprises and commercial services were gathered in the southeast and southwest (Figure 6b).
In the transitional period, the urban space is based on the development of the rural community [96], and it presents a more mosaic tendency with a single-core pattern. The rural community is an important part of urban modernization and it houses a large number of migrants and low-income residents. Rural communities in the north are gradually becoming city villages and shantytowns due to the expansion of the city, and eastern and western rural communities are evolving into the distribution area for factory workers. The suburban rural communities are developing into the distribution area for migrants (Figure 6c).
These modes suggest that the evolution of urban socio-spatial structure in Xi’an follows the models proposed by the Chicago School [21,22,23]. In summary, this empirical case study enables us to conclude the following: first, factors causing socio-spatial differentiation and types of social space have increased in modern times. Factors increased from “government officers’’, “migrant population” in the modern society period, to “officials and service workers”, “intellectual population”, “agricultural population” and “manufacturing population” in the planned economy period, “housing quality” is increased in the transitional period. It can be seen that “population scale”, “occupation composition”, and “educational background” have always played a leading role in this evolution. The influence of new factors such as “migrant population” and “housing quality” is becoming increasingly obvious. There were four types of social space featured by social status in the modern society period, which developed into five types featured by the combination of urban functional areas and unit communities in the planned economy period, and then evolved to seven types of social space featured by community diversity in the transitional period. Second, urban socio-spatial structure of Xi’an shows a certain inheritance. The residential form of unit communities in the planned economy period has always existed, and distribution area of intellectual population in the southern suburbs and distribution area of industrial workers in the eastern and western suburbs have been further strengthened during the transitional period. Third, the external behavior of social differentiation is the alternation of the location of the industrial area and the formation of the marginal area. During the planned economy period, commercial services dominated the central city and the industrial and agricultural areas were concentrated in the outskirts. While the industrial lies mainly to the east and west, the agricultural area moved to the north during the transitional period. The industrial population, agricultural population and migrant population lived in the marginal area of the city.
6. Evolutionary Mechanisms of Urban Socio-Spatial Structure in Xi’an
Through the analysis of the evolution process of social space in Xi’an in modern times, we find that the political and socio-economic backgrounds of different periods have a great influence on the urban socio-spatial structure, which satisfied our hypothesis before. We analyzed the evolution from the view of historical development, economic development, policy system and change of social classes.
6.1. History of Urban Development
The evolution of urban socio-spatial structure reflects the city’s historical development. In the modern society period, the outbreak of the war and urban construction activities prompted the Kuomintang officials, war refugees and modern factory workers to move into Xi’an. Kuomintang officials and modern factory workers gather together to form senior residential area, and war refugees were gathering in shanty towns. During the planned economy period, urban function layout of Xi’an had taken shape, affecting the distribution of social space. For example, unit communities of factories gathered in the eastern or western industrial areas, and unit communities of universities and research institutions gathered in the southern suburbs. During the transitional period, the suburbs have developed gradually into shantytowns, area for factory workers or area for migrants, residential forms in these areas are mostly newly built houses. The historical basis of urban development affected the choice of residents’ behavior, thus affecting the distribution of social space. The urban space used the central city as a core and developed outward in the shape of “pie”, causing the structure of social space to demonstrate a concentric pattern. This “pie” includes central areas with officer housing surrounded by unit communities and newly built communities.
6.2. Economic Development
Distribution of industrial area affects the distribution of urban social space. Industrial agglomeration promotes the formation of urban social space, and the disappearance of the advantages of the industrial saturation leads to the deconstruction of urban social space [97,98]. In the modern society period, the modern machine industry and the traditional handicraft industry constituted the commercial area. In the planned economy period, the industrial area of the western electrical industrial area, the eastern textile industrial area and the southern educational industrial area led to the outward expansion of residential land, warehouse land, and more, thus attracting industrial workers or intellectual population who gathered in the city’s periphery. In the transitional period, the industrial function has shown a tendency toward diversification, with areas of new kind of industry like high-tech industry or biological industry evolving into a distribution area for emerging class.
6.3. Changes in Social Classes
Residents are divided into different social classes based on social status, including political status, economic income, educational background, and so on [99]. Similar social classes have a tendency of habitation and result in the isolation of different social classes [100,101]. In the modern society period, social class differentiation was based on political status and consisted of bureaucrats, soldiers, workers and farmers; during the planned economy period, social stratification mechanism changed from political stratification to occupation stratification. Officers, intellectuals, and industrial workers were concentrated in different unit communities; during the transitional period, continuous refinement of the social division of labor has caused a widening gap between different social strata.
6.4. Macro Policy System
Due to the overarching role of the government in regulating housing choices through work units and household registration, macro policy should be considered as an integral factor, perhaps the most crucial, in understanding the evolution of urban socio-spatial structure [42], such as the relaxed policy on household registration, the reform of the land use system, and the monetization of housing. The reform of household registration system has attracted a large number of migrants to urban areas. High living expenses have led them to gather outside the city and form a poor, unskilled and low-income migrant class. According to the reform of land use, the local government invests a large amount of money to rebuild urban centers. Old factories and residential blocks are forced to relocate to the marginal area using the compensation policy. Meanwhile, the rent from land replacement has sped up the progress of urban renewal, leading to the formation of urban villages or shanty towns in the areas left during the reconstruction. The welfare distribution system in the planned economy period has formed the unit communities, and socialist China was successful in establishing a classless urban society without significant income inequality among its members [8,9,10]. After housing monetization reform, residents chose housing according to their preference and financial ability, and different social strata with different incomes or social position have gradually appeared in the residential space.
7. Conclusions and Discussion
This study analyzes the socio-spatial structure of modern society period, the planned economy period and transition period of Xi’an, we can see obvious changes in the social space of Xi’an in modern times. In the modern society period, the urban social space was based on the development of the central city, which can be summarized into four types according to social classes: the distribution area of migrants, the distribution area of government officers and new enterprise workers, areas of business and guildhalls, and areas of traditional handicraft and modern machine industry. In the planned economy period, based on the development of enclaves [96], the urban social space was characterized by the combination of the urban functional area and unit communities and can be summarized into 5 types: the distribution area of officers and the commercial service population, the distribution area of the intellectuals, the distribution area of industrial workers, and the distribution area of the agricultural population and mixed residential areas. In the transitional period, based on the development of the rural community [96], the urban social space is now characterized by the diversity of the community and can be summarized into 7 types: the distribution area of officers and the commercial service population, the distribution area of the intellectuals, the distribution area of industrial workers, the distribution area of the agricultural population, the distribution area of the emerging class, urban villages and shanty towns, and the distribution area of migrants.
The political and socio-economic backgrounds of different periods have a great influence on the urban socio-spatial structure, which is consistent with the evolution mechanism of other countries in the world. In modern times, the demolishment of Mancheng and the compliment of the Longhai railway and the movement of national industry caused by Anti-Japanese War promoted the development of modern industry [69,78]. The rise of modern industry is the main cause of social spatial differentiation. In the planned economy period, Xi’an as an important industrial city in inland areas, had gradually presented the function layout with the industrial areas in the western and eastern suburbs, the educational areas in the southern suburbs and the storage areas in northern suburbs [72]. Under the influence of functional area and unit community, the pattern of social spatial differentiation is gradually formed. In the transition period, urban functions are more diversified, driven by the free market economy and the housing market [93], the gap between different social classes has been widening, and the phenomenon of social space differentiation has become more prominent.
Compared with the studies of Beijing, Shanghai and other cities, the evolution of urban socio-spatial structure in China shows the characteristics of circle expansion. The socio-spatial structure of Beijing has evolved from “circle” to “multi core + fan” [102], socio-spatial structure of the central city of Shanghai changes from “circle + group” to “circle + fan + group” [103], socio-spatial structure of Guangzhou presents multi-core fusion development with “circle + fan” [104], evolution of socio-spatial structure of Changchun present circle model with a single core centered [105].It can be seen that, most of the urban socio-spatial structure in China the characteristics of circle expansion, and appear other fragmentation patterns like “group” or “fan” because of the difference of each development conditions, and types of social space tend to be diversified.
In these socialist transitional countries, common grounds can be found in the evolution of urban social space between the central-east Europe and China, such as suburbanization, residential segregation etc. Countries in central-east Europe experienced the rapid transition from Socialist to Capitalist, which generated serious social instability and social inequality [106]. China was the gradual and stable transition under the socialist ideology [57,107]. As for Western developed capitalist countries, the globalization of capital exacerbated the polarization of economic income, thus result in decentralization and slums phenomenon [108,109].
Acknowledgments
This research is supported by National Science and Technology Support Program (2015BAL01B04) and Natural Science Foundation of Shaanxi Province (2015JM5171).
Author Contributions
Yanjun Wang and Kewei Liu designed the research. Yanjun Wang contributed to data analysis, data processing, and drafting the manuscript; Kewei Liu contributed to paper revision.
Conflicts of Interest
The authors declare no conflict of interest.
Appendix A

Table A1.
Rotated factor matrix of Xi’an in 1982.
| Variable Type | Variable Name | Principal Factor Loading | |||
|---|---|---|---|---|---|
| 1 | 2 | 3 | 4 | ||
| Population scale | Total population | 0.74 | −0.02 | 0.52 | 0.35 |
| Mean family size | 0.55 | −0.01 | 0.64 | −0.28 | |
| Sex ratio(Male/Female) | −0.71 | 0.10 | 0.48 | 0.31 | |
| Household registration types | Percent urban population | 0.72 | 0.23 | 0.08 | 0.31 |
| Percent rural population | 0.81 | −0.08 | 0.08 | −0.2 | |
| Age distribution | Percent ≤14 years old | 0.82 | 0.11 | 0.02 | 0.02 |
| Percent 14–59 years old | 0.93 | 0.15 | 0.16 | 0.09 | |
| Percent ≥60 years old or above | 0.12 | 0.1 | 0.06 | 0.16 | |
| Educational background | Percent illiterate or semiliterate | 0.02 | 0.04 | 0.14 | 0.52 |
| Percent primary education | 0.02 | 0.13 | 0.15 | 0.40 | |
| Percent junior education | 0.16 | 0.81 | −0.343 | 0.4 | |
| Percent senior education | 0.29 | 0.77 | −0.38 | 0.36 | |
| Percent underground education | 0.49 | 0.83 | −0.15 | 0.04 | |
| Percent university education | 0.52 | 0.57 | 0.32 | −0.37 | |
| Percent postgraduate education | 0.495 | 0.83 | −0.15 | 0.04 | |
| Industry distribution | Percent agricultural and fishery | −0.33 | 0.28 | 0.41 | 0.15 |
| Percent mining and timber transport industry | −0.19 | 0.07 | 0.08 | 0.05 | |
| Percent electricity, gas, tap water production and supply | 0.03 | −0.05 | −0.10 | 0.13 | |
| Percent manufacturing | 0.46 | −0.39 | 0.24 | 0.54 | |
| Percent geological survey | 0.40 | 0.25 | 0.30 | −0.19 | |
| Percent construction | 0.10 | 0.10 | 0.20 | −0.16 | |
| Percent transport and communications | 0.23 | −0.24 | −0.21 | 0.24 | |
| Percent wholesale, retailing and catering | 0.71 | −0.20 | −0.53 | 0.01 | |
| Percent social services | 0.62 | −0.17 | −0.61 | −0.19 | |
| Percent health, sports and social welfare | 0.66 | 0.10 | −0.02 | −0.33 | |
| Percent education, culture and arts | 0.65 | 0.72 | 0.31 | −0.47 | |
| Percent scientific research and comprehensive technical service | 0.49 | 0.59 | 0.35 | −0.39 | |
| Percent finance, insurance | 0.43 | −0.17 | −0.39 | −0.15 | |
| Percent state, political parties, organizations | 0.34 | −0.08 | −0.33 | −0.14 | |
| Percent estate | 0.13 | 0.07 | 0.24 | 0.229 | |
| Occupation distribution | Percent government, institution, managers/officers, and enterprise managers | 0.94 | −0.06 | 0.11 | 0.03 |
| Percent professional and technical | 0.33 | 0.63 | 0.52 | −0.122 | |
| Percent clerical and related | 0.55 | −0.14 | −0.08 | 0.206 | |
| Percent commercial | 0.92 | −0.22 | −0.10 | 0.115 | |
| Percent farming, forestry, herding and fishery | −0.32 | 0.29 | 0.40 | 0.143 | |
| Percent production and transport | 0.352 | −0.31 | 0.21 | 0.46 | |
| Housing environment | Mean number per household | −0.2 | 0.29 | 0.14 | −0.29 |
| Mean building area per household | −0.23 | 0.32 | 0.15 | −0.31 | |
Figure A1.
Factor ecological analysis flow chart.

Figure A2.
Hierarchical cluster analysis flow chart.
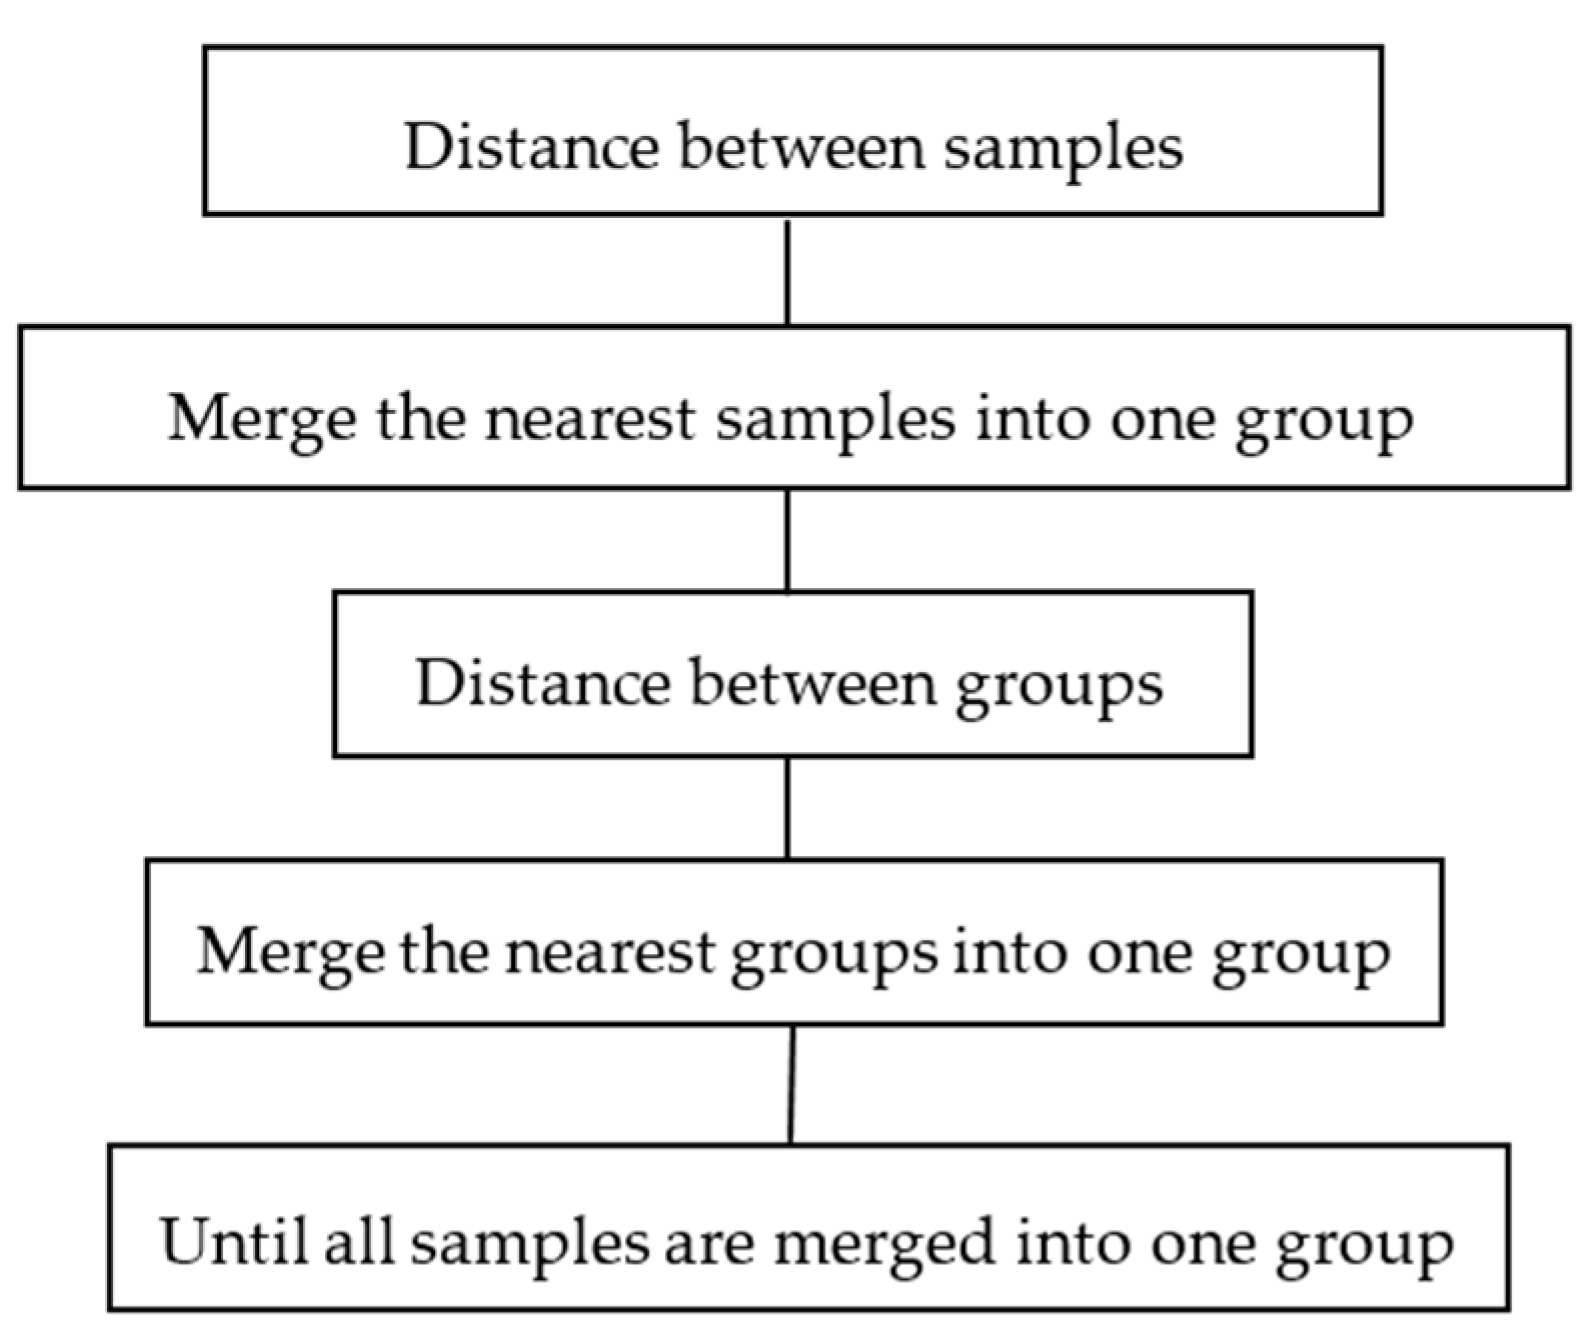
Table A2.
Rotated factor matrix of Xi’an in 2010.
| Variable Type | Variable Name | Principal Factor Loading | ||||
|---|---|---|---|---|---|---|
| 1 | 2 | 3 | 4 | 5 | ||
| Population scale | Total population | 0.98 | 0.01 | 0.05 | 0.09 | 0.13 |
| Mean family size | −0.6 | −0.29 | 0.56 | 0.28 | 0.11 | |
| sex ratio | 0.02 | −0.45 | −0.02 | 0.06 | 0.34 | |
| Household registration types | Percent urban population | 0.82 | 0.31 | 0.3 | 0.07 | 0.16 |
| Percent rural population | 0.13 | −0.27 | −0.2 | −0.06 | 0.07 | |
| Age distribution | Percent ≤14 years old | 0.92 | −0.16 | 0.03 | 0.26 | 0.03 |
| Percent 14–59 years old | 0.97 | −0.04 | 0.04 | 0.06 | 0.15 | |
| Percent ≥60 years old or above | 0.17 | −0.74 | 0.21 | 0.1 | 0.06 | |
| Educational background | Percent illiterate or semiliterate | 0.09 | 0.25 | 0.3 | −0.16 | 0.25 |
| Percent primary education | 0.85 | −0.02 | 0.45 | 0.09 | −0.11 | |
| Percent junior education | 0.67 | −0.45 | 0.49 | 0.05 | 0.03 | |
| Percent senior education | 0.88 | 0.37 | −0.02 | 0.13 | 0.01 | |
| Percent underground education | 0.61 | 0.05 | −0.05 | −0.08 | 0.08 | |
| Percent university education | 0.59 | 0.09 | 0.11 | −0.28 | 0.62 | |
| Percent postgraduate education | 0.67 | 0.20 | −0.35 | 0.33 | 0.04 | |
| Industry distribution | Percent agricultural and fishery | −0.31 | −0.43 | 0.16 | 0.07 | 0.13 |
| Percent mining and timber transport industry | 0.1 | −0.17 | 0.26 | −0.12 | −0.11 | |
| Percent electricity, gas, tap water production and supply | 0.42 | 0.07 | 0.03 | 0.11 | −0.26 | |
| Percent manufacturing | 0.67 | 0.02 | −0.16 | 0.52 | 0.12 | |
| Percent geological survey | 0.16 | 0.09 | 0.32 | −0.51 | 0.17 | |
| Percent construction | 0.75 | −0.5 | −0.03 | 0.14 | 0.13 | |
| Percent transport and communications | 0.15 | −0.19 | 0.55 | −0.06 | 0.36 | |
| Percent wholesale, retailing and catering | 0.36 | −0.07 | −0.17 | 0 | −0.1 | |
| Percent social services | 0.82 | −0.19 | −0.15 | −0.06 | −0.08 | |
| Percent health, sports and social welfare | 0.84 | 0.26 | 0.14 | −0.19 | 0.06 | |
| Percent education, culture and arts | 0.81 | −0.03 | 0.01 | −0.24 | 0.26 | |
| Percent scientific research and comprehensive technical service | 0.33 | 0.58 | −0.27 | 0.33 | 0.26 | |
| Percent finance, insurance | 0.78 | 0.13 | −0.04 | −0.27 | −0.17 | |
| Percent State, political parties, organizations | 0.8 | 0.22 | −0.15 | 0.33 | −0.1 | |
| Percent estate | 0.71 | −0.13 | −0.08 | −0.14 | −0.05 | |
| Occupation distribution | Percent government, institution, managers/officers, and enterprise managers | 0.75 | 0.31 | −0.28 | 0.02 | −0.11 |
| Percent professional and technical | 0.93 | 0.14 | −0.1 | 0.2 | −0.02 | |
| Percent clerical and related | 0.92 | 0.05 | −0.01 | 0.26 | −0.06 | |
| Percent commercial | 0.9 | 0.21 | −0.22 | 0.23 | −0.01 | |
| Percent farming, forestry, herding and fishery | 0.13 | −0.46 | 0.15 | 0.09 | 0.39 | |
| Percent production and transport | −0.32 | −0.48 | 0.74 | −0.13 | 0.12 | |
| Housing environment | Mean number per household | −0.33 | 0.76 | −0.36 | 0.18 | 0.13 |
| Mean building area per household | −0.2 | 0.77 | −0.38 | 0.2 | 0.12 | |
References
- Yi, Z.; Yan, X.P.; Zhou, C.S. Urban social spatial structure research in China: Review and prospect. Urban Plan. Forum 2003, 149, 21–24. (In Chinese) [Google Scholar]
- Logan, J.R. The persistence of segregation in the 21st century metropolis. City Community 2013, 12, 160–168. [Google Scholar] [CrossRef] [PubMed]
- Massey, D.S. Reflections on the dimensions of segregation. City Community 2012, 1, 72–93. [Google Scholar] [CrossRef] [PubMed]
- Friedmann, J. Place and place-making in cities: A global perspective. Plan. Theory Pract. 2010, 11, 149–165. [Google Scholar] [CrossRef]
- Walks, R.A. The social ecology of the post-Fordist/global city? Economic restructuring and socio-spatial polarisation in the Toronto urban region. Urban Stud. 2001, 38, 407–447. [Google Scholar] [CrossRef]
- Vresk, M. Neki pokazatelji funkcionalno-prostorne strukture Zagreba. Radovi 1986, 21, 45–53. [Google Scholar]
- Yeh, A.G.O.; Wu, F.L. Internal structure of Chinese cities in the midst of economic reform. Urban Geogr. 1995, 16, 521–554. [Google Scholar]
- Sit, V.F.S. A window on Beijing: The social geography of urban housing in a period of transition, 1985–1990. Third World Plan. Rev. 1995, 22, 237–259. [Google Scholar] [CrossRef]
- French, R.A.; Hamilton, F.E. The Socialist City; Wiley: New York, NY, USA, 1979; pp. 25–27. [Google Scholar]
- Chan, K. Cities with Invisible Walls: Reinterpreting Urbanization in Post–1949 China; Oxford University Press: Hong Kong, China, 1994; pp. 48–53. [Google Scholar]
- Wu, Q.Y.; Cheng, J.Q.; Young, C. Social differentiation and spatial mixture in a transitional city—Kunming in southwest China. Habitat Int. 2017, 64, 11–21. [Google Scholar] [CrossRef]
- Shen, J.; Wong, K.Y.; Chu, K.Y. Regional economic growth and factor contributions in the Zhujiang delta region of south China. Asian Geogr. 2001, 20, 125–151. [Google Scholar] [CrossRef]
- Gu, C.L.; Wang, F.H.; Liu, G.L. The structure of social space in Beijing in 1998: A socialist city in transition. Urban Geogr. 2005, 26, 167–192. [Google Scholar] [CrossRef]
- Li, Z.; Wu, F.L. Tenure-based residential segregation in post-reform Chinese cities: A case study of Shanghai. Trans. Inst. Br. Geogr. 2008, 33, 404–419. [Google Scholar] [CrossRef]
- Wu, Q.Y.; Cheng, J.; Chen, G.; Hammel, D.; Wu, X. Socio-spatial differentiation and residential segregation in the Chinese city: Based on the 2000 community-level census data: A case study of the inner city of Nanjing. Cities 2014, 39, 109–119. [Google Scholar] [CrossRef]
- Yeh, A.; Xu, X.; Hu, H. The Social space in Guangzhou city, China. Urban Geogr. 1995, 16, 595–621. [Google Scholar] [CrossRef]
- Zhou, C.S.; Liu, Y.; Zhu, H. Analysis on social areas of Guangzhou city during the economic system transformation. Acta Geogr. Sin. 2006, 61, 1046–1056. [Google Scholar]
- Huang, X.J.; Li, C.G.; Pang, R.Q.; Huang, X. The Social Spatial Structure of Changchun in the Puppet Manchuria Period. Acta Geogr. Sin. 2010, 65, 1198–1208. [Google Scholar]
- Song, W.X.; Xu, D.; Wang, L.Y.; Zhu, X.G. Urban socio–spatial structure of Nanjing during the modern era: Analysis based on the data of urban population investigation in 1936. Acta Geogr. Sin. 2011, 66, 771–784. [Google Scholar]
- Pacione, M. Urban Geography: A Global Perspective; Routledge: London, UK, 2009. [Google Scholar]
- Burgess, E.W. The Growth of the City: An Introduction to a Research Project; Chicago University Press: Chicago, IL, USA, 1925; pp. 89–97. [Google Scholar]
- Hoyt, H. The Structure and Growth of Residential Neighborhoods in American Cities; Federal Housing Administration: Washington, DC, USA, 1939; pp. 36–42.
- Harris, C.D.; Ullman, E.L. The nature of cities. Ann. Am. Acade. Political Soc. Sci. 1945, 242, 7–17. [Google Scholar] [CrossRef]
- Shevky, E.; Williams, M. The Social Areas of Los Angeles; University of California Press: Oakland, CA, USA, 1949; pp. 26–30. [Google Scholar]
- Shevky, E.; Bell, W. Social Area Analysis: Theory, Illustrative Application, and Computational Procedures; Stanford University Press: Palo Alto, CA, USA, 1955; pp. 92–95. [Google Scholar]
- Herbert, D.T. Social area analysis: A British study. Urban Stud. 1967, 6, 41–60. [Google Scholar] [CrossRef]
- McElrath, D.C. The social areas of Rome: A comparative. Am. Sociol. Rev. 1962, 27, 376–391. [Google Scholar] [CrossRef]
- Schmid, C.F.; Tagashira, K. Ecological and demo-graphic indices: A methodological analysis. Demography 1964, 1, 194–211. [Google Scholar] [CrossRef]
- Carey, G.W. The regional interpretation of Manhattan population and housing patterns through factor analysis. Geogr. Rev. 1966, 56, 551–569. [Google Scholar] [CrossRef]
- Jones, F.L. A social profile of Canberra 1961. Aust. N. Z. J. Sociol. 1965, 1, 107–120. [Google Scholar] [CrossRef]
- Hunter, A. Symbolic Communities: The Persistence and Change of Chicago’s Local Communities; The University of Chicago Press: Chicago, IL, USA; London, UK, 1982; pp. 22–25. [Google Scholar]
- Rowland, R.H. Selected urban population characteristics of Moscow. Post-Sov. Geogr. 1992, 33, 569–590. [Google Scholar] [PubMed]
- Elvin, K.W. Continuity and change in the restless urban landscape. Econ. Geogr. 1999, 75, 309–338. [Google Scholar]
- Brenda, S.A. Postcolonial cities. Prog. Hum. Geogr. 2001, 25, 456–468. [Google Scholar]
- Thomas, O. From concentration to deconcentration: Migration patterns in the Post-Socialist city. Cities 2001, 18, 403–412. [Google Scholar]
- Gordon, I.; Monastiriotis, V. Urban size, spatial segregation and inequality in educational outcomes. Urban Stud. 2006, 43, 213–236. [Google Scholar] [CrossRef]
- Ceccato, V.; Haining, R.; Kahn, T. The geography of homicide in San Paulo, Brazil. Environ. Plan. A 2007, 39, 1632–1653. [Google Scholar] [CrossRef]
- Preteceille, E. Is gentrification a useful paradigm to analysis social changes in the Paris Metropolis? Environ. Plan. A 2007, 39, 10–31. [Google Scholar] [CrossRef]
- Tian, G.; Wu, J.; Yang, Z. Spatial pattern of urban functions in the Beijing metropolitan region. Habitat Int. 2010, 34, 249–255. [Google Scholar] [CrossRef]
- Zhao, P. The impact of urban sprawl on social segregation in Beijing and a limited role for spatial planning. Tijdschr. Voor Econ. Soc. Geogr. 2013, 104, 571–587. [Google Scholar] [CrossRef]
- Liu, Y.; Dijst, M.; Geertman, S. Residential segregation and well-being inequality between local and migrant elderly in Shanghai. Habitat Int. 2014, 42, 175–185. [Google Scholar] [CrossRef]
- Wu, F.L. Socio-spatial differentiation in urban China: Evidence from Shanghai’s real estate markets. Environ. Plan. A 2002, 34, 591–616. [Google Scholar] [CrossRef]
- Shen, J. A Study of the temporary population in Chinese cities. Habitat Int. 2002, 26, 363–377. [Google Scholar] [CrossRef]
- Li, S.; Hou, Q.; Chen, S.; Zhou, C. Work, home, and market: The social transformation of housing space in Guangzhou, China. Urban Geogr. 2010, 31, 434–452. [Google Scholar] [CrossRef]
- Harris, A. Art and gentrification: Pursuing the urban pastoral in Hoxton, London. Trans. Inst. Br. Geogr. 2012, 37, 226–241. [Google Scholar] [CrossRef]
- Wu, Q.Y.; Waley, P. Configuring growth coalitions among the projects of urban aggrandizement in Kunming, southwest China. Urban Geogr. 2017, 4, 1–17. [Google Scholar] [CrossRef]
- Park, R.E.; Burgess, E.W.; McKenzie, R.D. The City; University of Chicago Press: Chicago, IL, USA, 1967; pp. 15–20. [Google Scholar]
- Johnston, R.J. Human Geography; Commercial Press: Beijing, China, 2010; pp. 55–59. [Google Scholar]
- Jackson, P. Social geography: Convergence and compromise. Prog. Hum. Geogr. 1983, 7, 116–121. [Google Scholar] [CrossRef]
- Clark, G.L.; Feldman, M.P.; Gertler, M.S. The Oxford Handbook of Economic Geography; Oxford University Press: Oxford, MS, USA, 2003; pp. 89–92. [Google Scholar]
- Gregson, N. The initiative: Delimiting or deconstructing social geography? Prog. Hum. Geogr. 1993, 7, 79–91. [Google Scholar] [CrossRef]
- Yalcin, I.; Amemiya, Y. Nonlinear factor analysis as a statistical method. Stat. Sci. 2001, 16, 275–294. [Google Scholar]
- Le, B.C. The Changing Residential Structure of Montreal 1971–81. Can. Geogr. 1988, 32, 98–113. [Google Scholar]
- Davies, W.; Herbert, D. Communities within Cities: An Urban Geography; Belhaven Press: London, UK, 1993; pp. 55–57. [Google Scholar]
- Berry, B.J.L.; Ress, P.H. The facorial ecology of Calcutta. Am. J. Sociol. 1969, 74, 445–491. [Google Scholar]
- Abu-Lughod, J. Testing the theory of social area analysis: The ecology of Cairo, Egypt. Am. Sociol. Rev. 1969, 34, 198–212. [Google Scholar] [CrossRef]
- Sykora, L. Processes of socio-spatial differentiation in post-communist Prague. Hous. Stud. 1999, 14, 679–701. [Google Scholar] [CrossRef]
- Kaiser, H.F. The varimax criterion for analytic rotation in factor analysis. Psychometrika 1958, 23, 187–200. [Google Scholar] [CrossRef]
- Guilmoto, C.Z. Spatial Patterning of Gender Discrimination in India: Impact of Social and Geographic Distances. L’Espace Géogr. 2008, 37, 1–15. [Google Scholar] [CrossRef]
- Wallen, M.; Wallen, M. State Policy and Internal Migration—A Study of the Household Registration (hukou) System in China. J. Relig. Stud. 2011, 82, 1016–1017. [Google Scholar]
- Marcum, C.S. Age Differences in Daily Social Activities. Res. Aging 2013, 35, 612–640. [Google Scholar] [CrossRef] [PubMed]
- Kondo, H. Social Space and Inequality in Educational Performance. J. Educ. Sociol. 2002, 90, 101–121. [Google Scholar] [CrossRef]
- Coiacetto, E. The role of the development industry in Shaping urban social space: A conceptual model. Geogr. Res. 2007, 45, 340–347. [Google Scholar] [CrossRef]
- Angell, A.M. Occupation-centered analysis of social difference: Contributions to a socially responsive occupational science. J. Occup. Sci. 2014, 21, 104–116. [Google Scholar] [CrossRef]
- Yeates, M. The congruence between housing space, social space, and community space, and some experiments concerning its implications. Environ. Plan. A 1972, 4, 395–414. [Google Scholar] [CrossRef]
- Xi’an Municipal Bureau of Statistics. Statistical Communique on National Economic and Social Development of Xi’an in 2016; Xi’an Press: Xi’an, China, 2016; pp. 5–6.
- Bonavia, J.; Christoph, B. The Silk Road: Xi’an to Kashgar; Odyssey: Hong Kong, China, 1992; pp. 15–20. [Google Scholar]
- Ng, M.K.; Zhai, B.; Zhao, Y.; Li, J. Valuing Xi’an: A Chinese capital city for 13 Dynasties. disP 2016, 52, 8–15. [Google Scholar] [CrossRef]
- Weng, C.X.; Song, L.K. Local Records Compilation of Xianning and Chang’an; The Republic of China Press: Xi’an, China, 1936; pp. 35–41. [Google Scholar]
- Song, B.L.; Song, L.K.; Wu, T.X. The Continuation of General Records of Shaanxi; Annals of Shaanxi Museum: Xi’an, China, 1934; pp. 11–12. [Google Scholar]
- Shaanxi Preparation Committee. The Evolution of Administrative Institutions in Shaanxi Province during the Republic of China; Shaanxi People’s Education Press: Xi’an, China, 1991; pp. 25–26. [Google Scholar]
- Cheng, Z. From Planned to Market Economy: The rise and fall of the city of textiles, Xi’an. Local Econ. 2011, 26, 348–362. [Google Scholar] [CrossRef]
- Compiling Group. Outline of Modern Chinese History; Higher Education Press: Beijing, China, 2013; pp. 26–27. [Google Scholar]
- Xi’an Municipal Bureau of Statistics. Compilation of Population Data of Xi’an; Xi’an Municipal Bureau of Statistics: Xi’an, China, 1986; pp. 1–46.
- Xi’an Municipal Bureau of Statistics. Compilation of Population Data of Xi’an; Xi’an Municipal Bureau of Statistics: Xi’an, China, 2012; pp. 1–57.
- Editorial Committee of Xi’an Local Chronicles. First Volume and Total Class of Xi’an; Xi’an Press: Xi’an, China, 1996; pp. 67–74. [Google Scholar]
- Cao, H.T.; Liu, J.S. The Development of Modern Chinese Cities; Chinese City Press: Beijing, China, 1998; pp. 32–34. [Google Scholar]
- Xi’an Archives Bureau. Preparation of Xi’an Selected Records; Northwest University Press: Xi’an, China, 1994; p. 56. [Google Scholar]
- Huang, Y.X. Past and present Jianguo Road. Xi’an Beilin Dist. Lit. 1996, 11, 69–91. [Google Scholar]
- Li, W.B. The ghost city of Xi’an and the people’s livelihood market. Xi’an Lit. 1982, 12, 158–162. [Google Scholar]
- Xi’an Organizing Committee. Chengguan Map of Xi’an; Xi’an Press: Xi’an, China, 1934; pp. 8–10. [Google Scholar]
- Tian, K.L. Jianguo Road. Xi’an Lit. 1986, 12, 149–160. [Google Scholar]
- Xi’an Geographical Name Committee. Jinjia Village. Beilin District Historical Data; Xi’an Press: Xi’an, China, 1992; pp. 106–113. [Google Scholar]
- Yu, Z.Z. Shi Y.C. Beilin Cultural and Historical Data; Xi’an Press: Xi’an, China, 1992; Volume 10, pp. 106–107. [Google Scholar]
- You, B.J. The geographical distribution of the guildhalls after the period of Late Qing Dynasty—A research based on the survey data compiled by Toa Dobun Shoin. Collect. Essays Chin. Hist. Geogr. 2008, 18, 80–92. [Google Scholar]
- Compilation Committee of Local Chronicles of Shaanxi Province. Shaanxi Province: Industry and Commerce; Xi’an Press: Xi’an, China, 2000; pp. 69–70. [Google Scholar]
- First Department of Construction Department of Shaanxi Province. Statistical Report on Construction of Shaanxi; Printing Bureau of Shaanxi Provincial Government: Xi’an, China, 1930; pp. 6–8.
- Lin, H.F. Formation and historical characteristics of China’s planned economic system. Party Lit. 1995, 1, 38–43. [Google Scholar]
- James, L. From welfare housing to home ownership: The dilemma of China’s housing reform. Hous. Stud. 2000, 15, 61–76. [Google Scholar]
- Zhang, X.Q. Chinese housing policy 1949–1978: The development of a welfare system. Plan. Perspect. 1997, 12, 433–455. [Google Scholar] [CrossRef]
- Wang, Y.; Shao, L.; Wang, Y.P. Pre-reform socialist welfare housing estates in China: Physical conditions and social profiles. J. Asian Archit. Build. Eng. 2015, 14, 609–616. [Google Scholar] [CrossRef]
- State Council. Xi’an Master Plan for the First Edition (1953–1972); Xinhua News Agency: Beijing, China, 1952; pp. 18–20.
- Shen, Q.P.; Zhang, Z.H. Housing industry in China: The transition from planned economy to market economy. Int. J. Hous. Sci. Its Appl. 1997, 21, 233–240. [Google Scholar]
- Cui, Z.; Zhang, Y. Structure model and developing rules of space form evolution of Xi’an High-Tech Industries Development Zone. Appl. Mech. Mater. 2013, 360, 1953–1957. [Google Scholar] [CrossRef]
- Shi, H.S. Study on Urban Geography of Xi’an in the Ming and Qing Dynasties; China Social Science Press: Beijing, China, 2008; pp. 225–226. [Google Scholar]
- Feng, J.; Zhou, Y. Restructuring of socio-spatial differentiation in Beijing in the transition period. Acta Geogr. Sin. 2008, 63, 829–844. [Google Scholar]
- Lai, O.K. Transformative urbanization and social segregation in a transitional economy: Chinese dual urbanism under globalizing forces. J. Policy Stud. 2005, 18, 79–97. [Google Scholar]
- Huang, Q.S. Society-economic polarization and segregation in current China. J. Shaanxi Norm. Univ. 2008, 36, 177–179. [Google Scholar]
- Li, Q. Chinese Social Stratification Structure in the Transitional Period; Heilongjiang People’s Publishing House: Harbin, China, 2001; pp. 52–54. [Google Scholar]
- Wortzel, L.M. Class in China: Stratification in a Classless Society; Greenwood Press: New York, NY, USA, 1987. [Google Scholar]
- Guo, Y. Farewell to Class, except the Middle Class: The Politics of Class Analysis in Contemporary China. Asia-Pac. J. Jpn Focus 2009, 7, 2. [Google Scholar]
- Li, Y.; Tang, Z.L. Transformation of social space structure in the suburban areas of Shanghai from 1980 to 2000. Urban Planning Forum. 2005, 6, 27–36. (In Chinese) [Google Scholar]
- Feng, J.; Zhou, Y.X. The social spatial structure of Beijing Metropolitan Area and its evolution: 1982–2000. Geogr. Res. 2003, 22, 465–483. [Google Scholar]
- Liao, B.G.; Xu, J.G.; Xuan, G.F. Evolution of residential space structure in Shanghai central city based on land use: 1947–2000. Acta Geogr. Sin. 2008, 63, 195–206. [Google Scholar]
- Zhou, C.S.; Luo, R.Z.; Dai, D.D. Evolution and mechanism of the residential spatial structure from 2000 to 2010 in Guangzhou. Geogr. Res. 2015, 34, 1109–1124. (In Chinese) [Google Scholar]
- Huang, X.J.; Huang, X. Evolution of Changchun’s social spatial structure in the 20th century. Prog. Geogr. 2013, 32, 1629–1638. (In Chinese) [Google Scholar]
- Davis, D.S. The Consumer Revolution in Urban China; University of California Press: Berkeley, CA, USA, 2000; pp. 56–58. [Google Scholar]
- Wu, F. Intraurban residential relocation in Shanghai: Modes and stratification. Environ. Plan. A 2004, 36, 7–25. [Google Scholar] [CrossRef]
- Zhu, J. An analysis of the social space structure of population in the Shanghai municipality. Chin. J. Popul. 1996, 8, 87–102. [Google Scholar]
Figure 1.
Spatial distribution of social space of Xi’an in the modern society period.
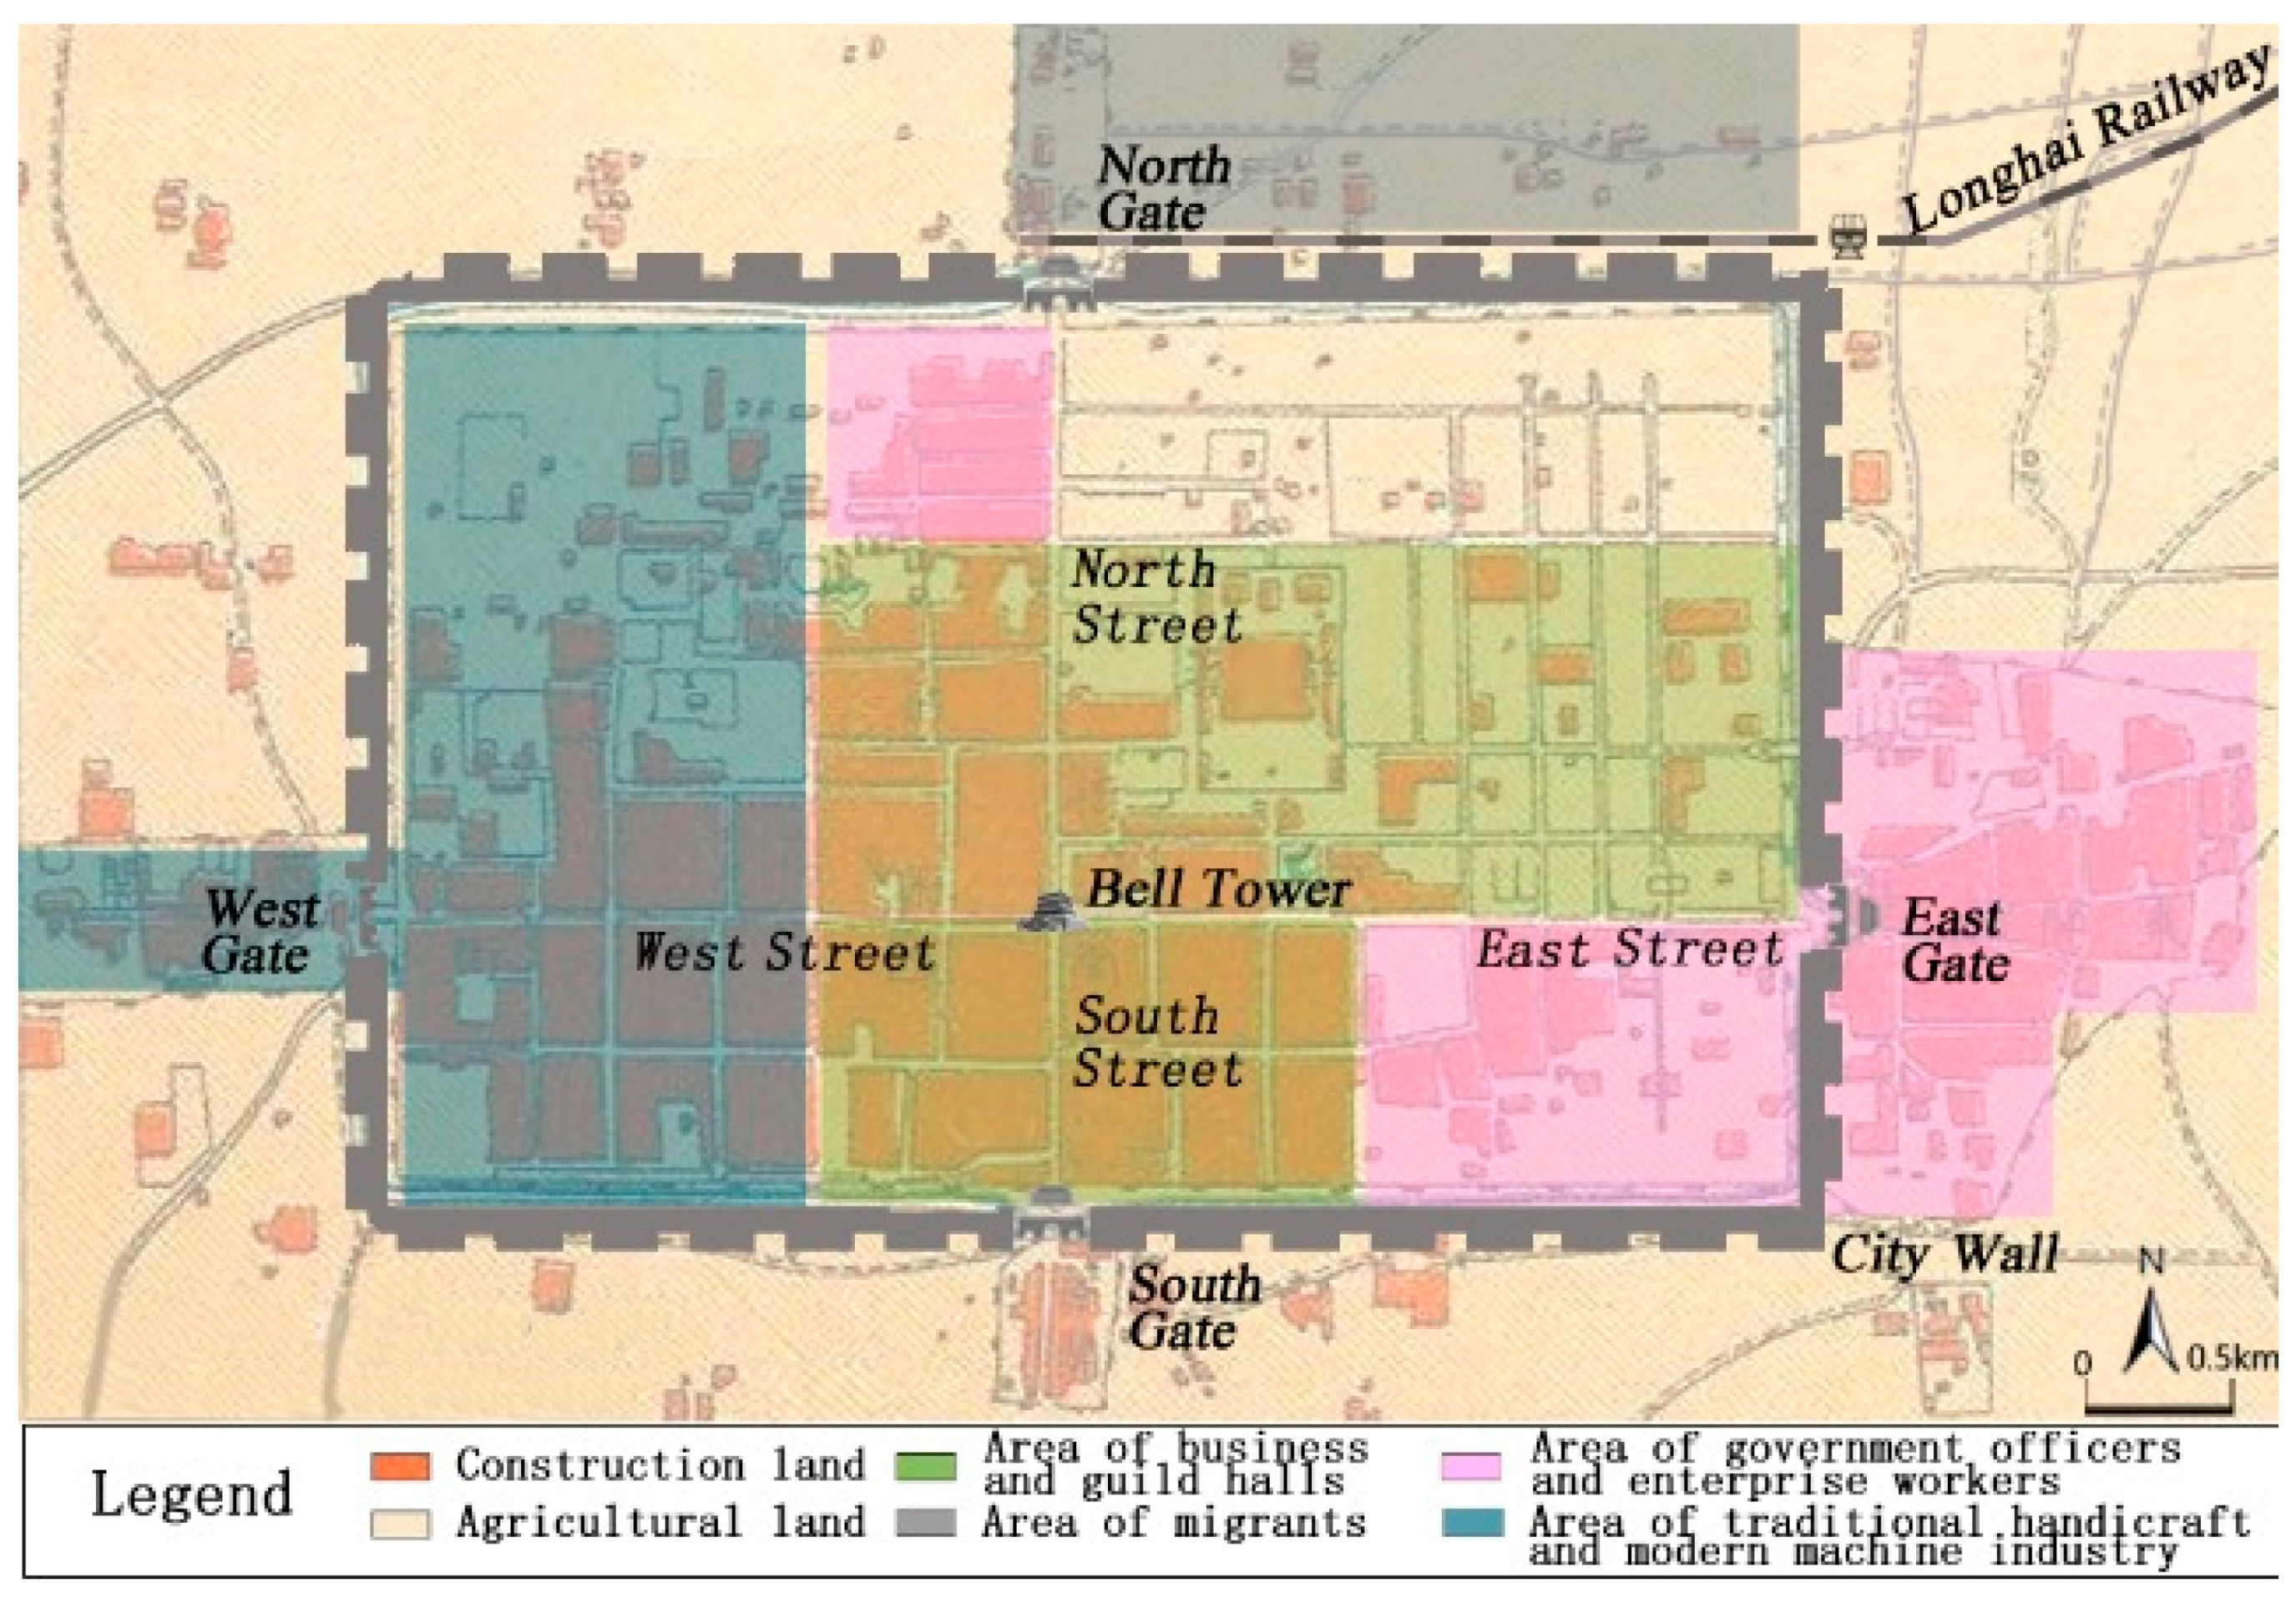
Figure 2.
Distribution of factors of social space of Xi’an in 1982.

Figure 3.
Spatial distribution of social space of Xi’an in 1982.
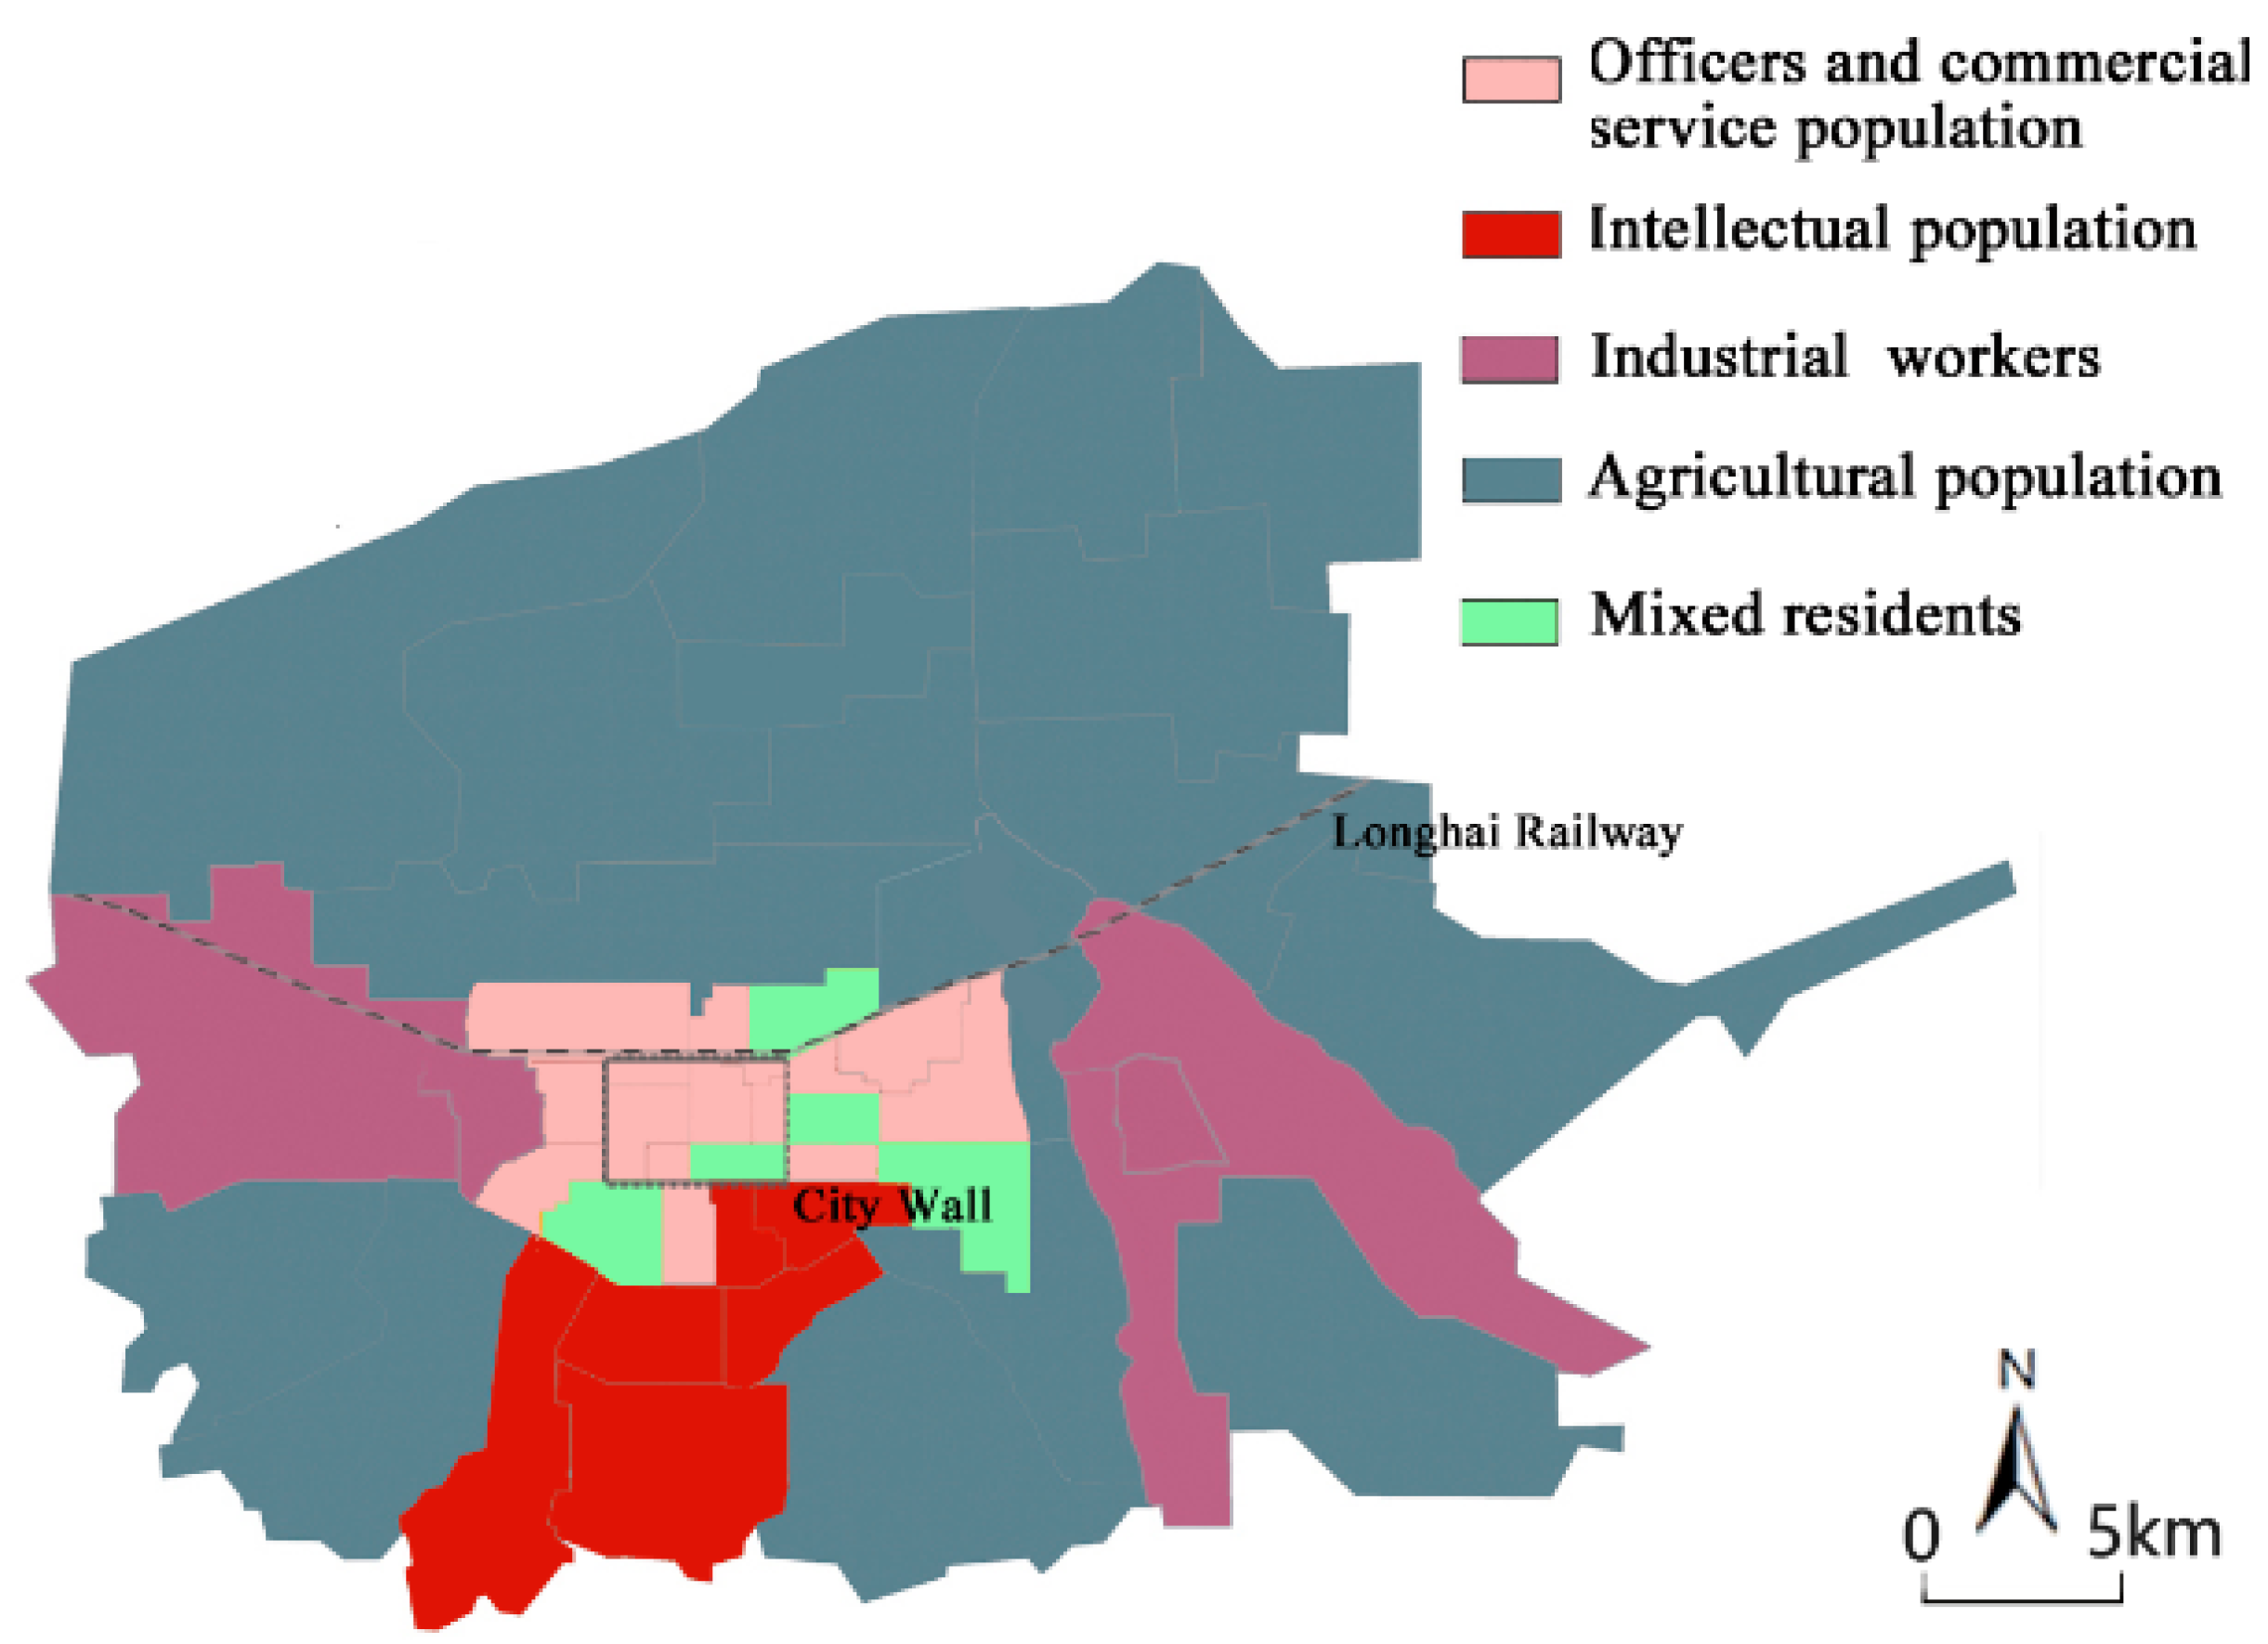
Figure 4.
Distribution of factors of social space of Xi’an in 2010.
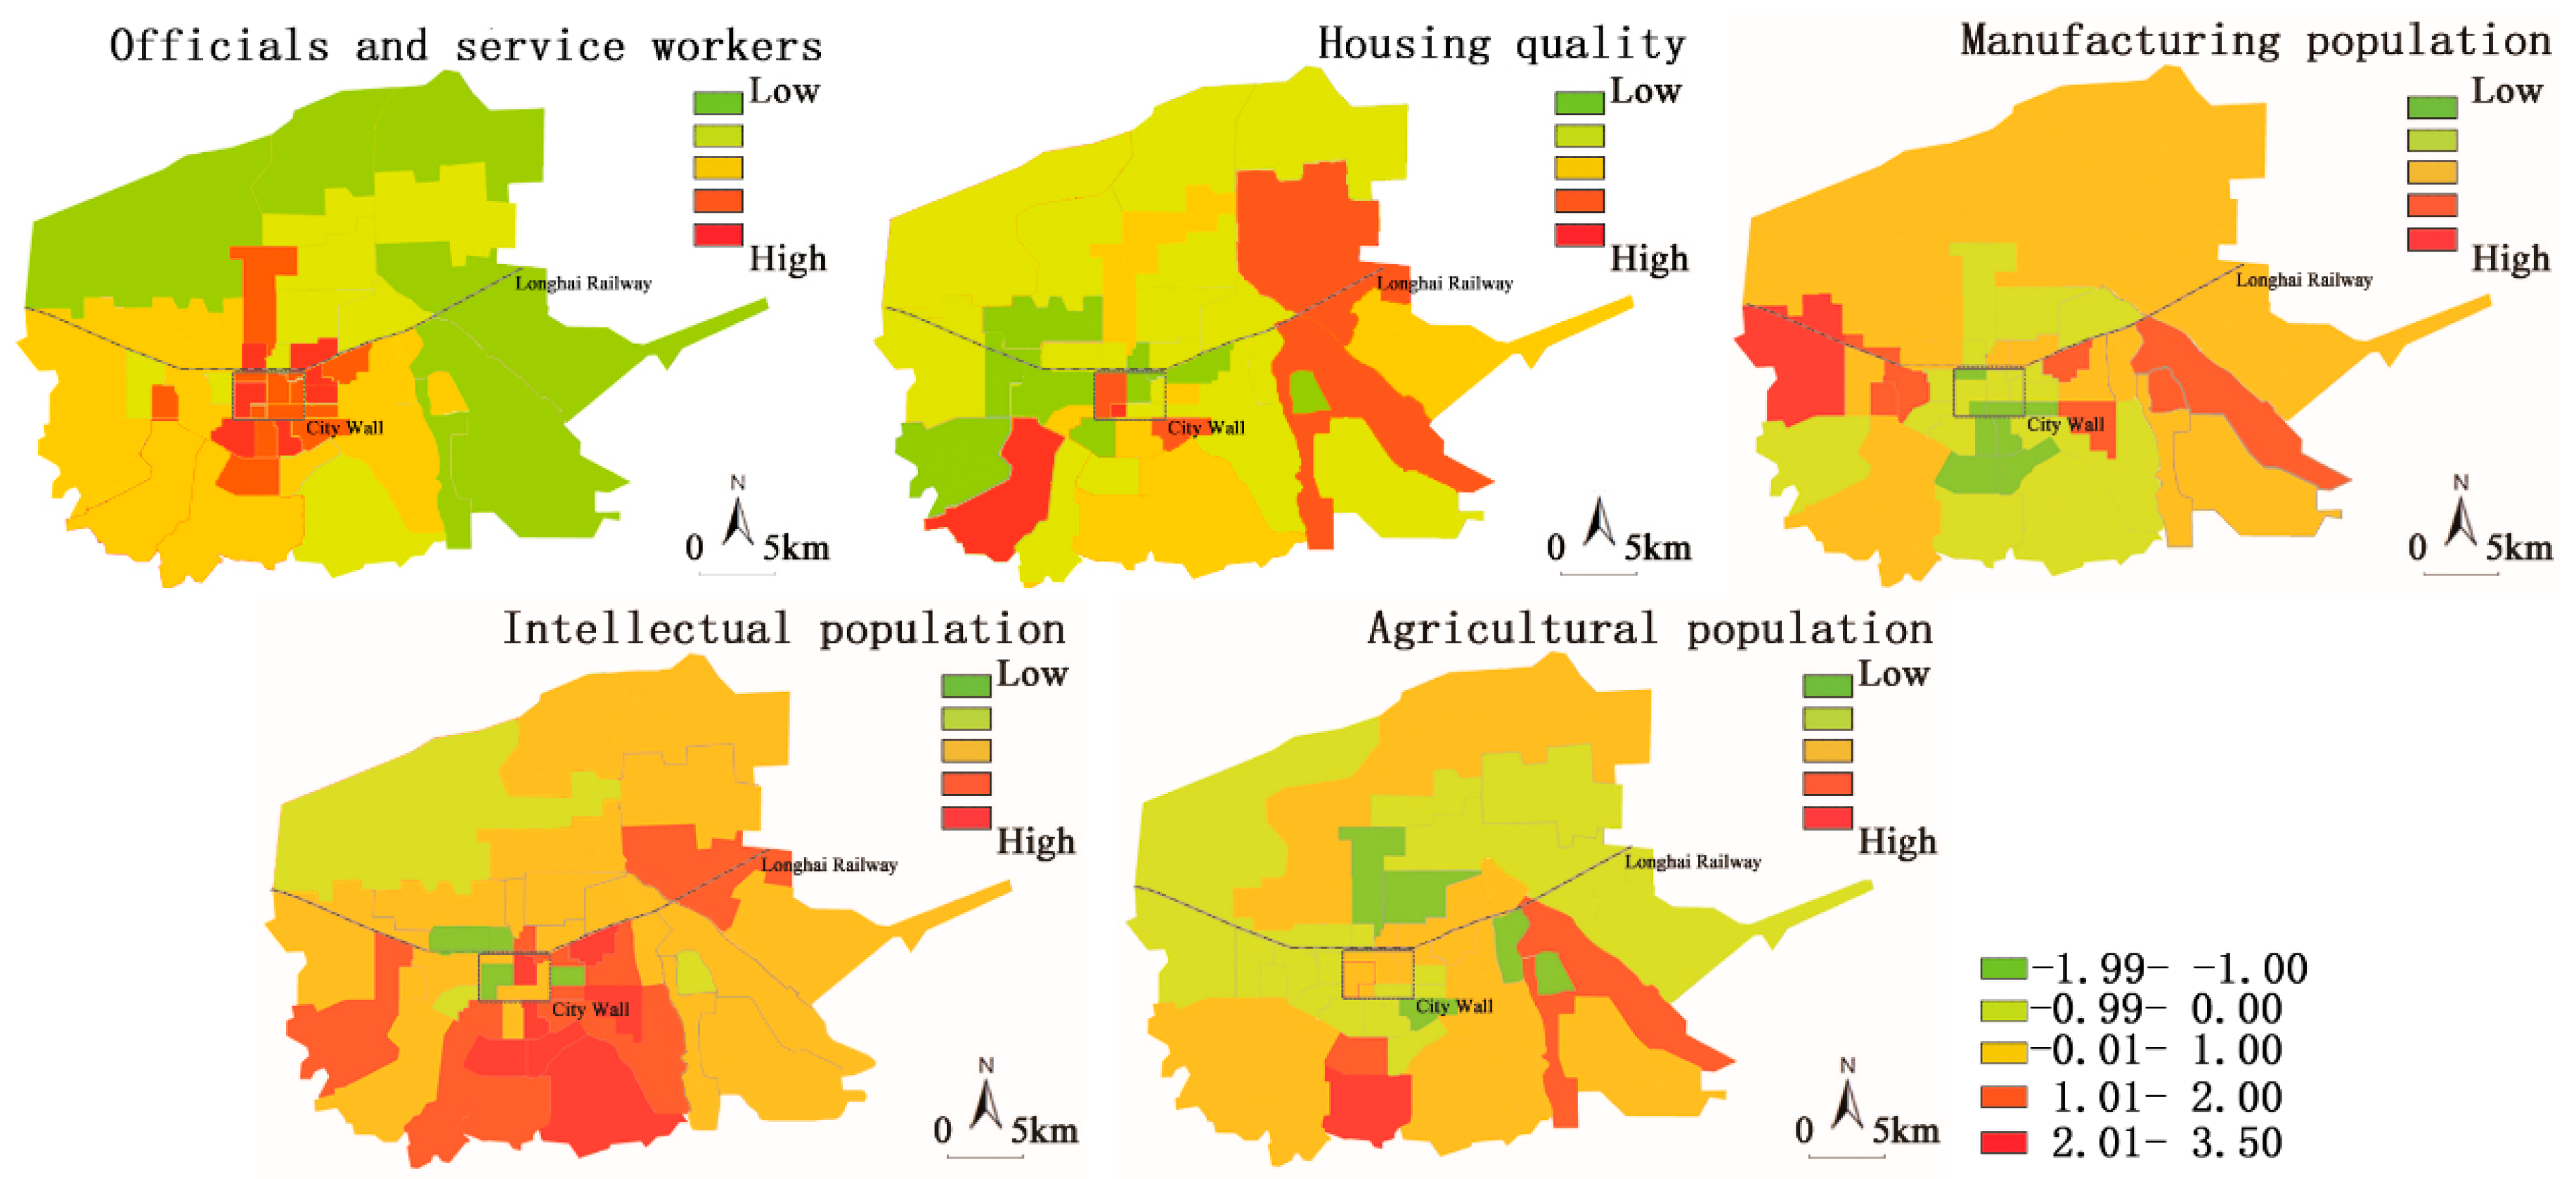
Figure 5.
Spatial distribution of social space of Xi’an in 2010.

Figure 6.
Evolution of urban socio-spatial structure of Xi’an in modern times.

Table 1.
Factors and indicators of urban social space.
| Factors | Indicator Name |
|---|---|
| Population scale | Total population; Mean family size; Sex ratio |
| Household registration types | Percent urban population; Percent rural population |
| Age distribution | Percent ≤ 14 years old; Percent 14–59 years old; Percent ≥ 60 years old |
| Educational background | Percent illiterate or semiliterate; Percent primary education; Percent junior education; Percent senior education; Percent undergraduate education; Percent university education; Percent postgraduate education |
| Industry distribution | Percent agricultural and fishery; Percent mining and timber transport industry; Percent electricity, gas, tap water production and supply; Percent manufacturing; Percent geological survey; Percent construction; Percent transport and communications; Percent wholesale, retailing and catering; Percent social services; Percent health, sports and social welfare; Percent education, culture and arts; Percent scientific research and comprehensive technical service; Percent finance, insurance; Percent state, political parties, organizations; Percent estate |
| Occupation distribution | Percent government, institution, managers/officers, and enterprise managers; Percent professional and technical; Percent clerical and related; Percent commercial; Percent farming, forestry, herding and fishery; Percent production and transport |
| Housing environment | Mean number per household |
| Mean building area per household |
Table 2.
Eigenvalues and contributions of social space of Xi’an in 1982.
| Factor | Extraction Sums of Squared Loadings | Rotation Sums of Squared Loadings | ||
|---|---|---|---|---|
| Eigenvalues | Cumulative Percentage of Variance (%) | Eigenvalues | Cumulative Percentage of Variance (%) | |
| officials and service workers | 25.56 | 59.35 | 12.38 | 40.89 |
| intellectual population | 8.56 | 61.89 | 4.44 | 58.77 |
| agricultural population | 2.96 | 77.97 | 3.38 | 72.72 |
| manufacturing population | 1.89 | 82.14 | 2.83 | 82.14 |
Table 3.
Eigenvalues of social space of Xi’an in 1982.
| Social Space | Officials and Service Workers | Intellectual Population | Agricultural Population | Manufacturing Population |
|---|---|---|---|---|
| 1 | 1.598 | 0.863 | −0.068 | −0.136 |
| 2 | 0.216 | 0.461 | −0.230 | 0.087 |
| 3 | −0.023 | −0.126 | 0.532 | 1.905 |
| 4 | 0.013 | −0.046 | 3.025 | 2.130 |
| 5 | 1.953 | 2.136 | 0.203 | 2.089 |
Table 4.
Eigenvalues and contributions of social space of Xi’an in 2010.
| Factor | Extraction Sums of Squared Loadings | Rotation Sums of Squared Loadings | ||
|---|---|---|---|---|
| Eigenvalues | Cumulative Percentage of Variance (%) | Eigenvalues | Cumulative Percentage of Variance (%) | |
| officials and service workers | 35.06 | 49.35 | 24.07 | 42.98 |
| housing quality | 13.90 | 61.89 | 8.08 | 58.42 |
| manufacturing population | 5.09 | 73.97 | 3.68 | 71.11 |
| intellectual population | 2.40 | 77.79 | 2.43 | 76.46 |
| agricultural population | 2.09 | 80.09 | 2.04 | 80.09 |
Table 5.
Eigenvalues of social space of Xi’an in 2010.
| Social Space | Officials and Service Population | Housing Quality | Manufacturing Population | Intellectual Population | Agricultural Population |
|---|---|---|---|---|---|
| 1 | 0.266 | −0.379 | −0.183 | −0.057 | −0.096 |
| 2 | −1.058 | 0.028 | −0.358 | 0.533 | 0.032 |
| 3 | 0.099 | 0.077 | 1.293 | 0.036 | −0.376 |
| 4 | −1.046 | −0.092 | 0.414 | 0.072 | 1.378 |
| 5 | 1.577 | 1.041 | 0.150 | 1.090 | −1.432 |
| 6 | −0.022 | −1.859 | 1.030 | −0.231 | 0.334 |
| 7 | −0.013 | −0.256 | 0.568 | −0.023 | 0.432 |
© 2017 by the author. Licensee MDPI, Basel, Switzerland. This article is an open access article distributed under the terms and conditions of the Creative Commons Attribution (CC BY) license (http://creativecommons.org/licenses/by/4.0/).
Share and Cite
MDPI and ACS Style
Wang, Y.; Liu, K. Evolution of Urban Socio-Spatial Structure in Modern Times in Xi’an, China. Sustainability 2017, 9, 1935. https://doi.org/10.3390/su9111935
AMA Style
Wang Y, Liu K. Evolution of Urban Socio-Spatial Structure in Modern Times in Xi’an, China. Sustainability. 2017; 9(11):1935. https://doi.org/10.3390/su9111935
Chicago/Turabian StyleWang, Yanjun, and Kewei Liu. 2017. "Evolution of Urban Socio-Spatial Structure in Modern Times in Xi’an, China" Sustainability 9, no. 11: 1935. https://doi.org/10.3390/su9111935
Note that from the first issue of 2016, this journal uses article numbers instead of page numbers. See further details here.