Article

Measuring Corporate Social Responsibility in Gambling Industry: Multi-Items Stakeholder Based Scales

1
Faculty of International Tourism and Management, City University of Macau, Macau, China
2
Department of Finance, The Chinese University of Hong Kong, Hong Kong, China
*
Author to whom correspondence should be addressed.
Sustainability 2017, 9(11), 2012; https://doi.org/10.3390/su9112012
Submission received: 29 September 2017 / Revised: 30 October 2017 / Accepted: 31 October 2017 / Published: 2 November 2017
(This article belongs to the Section Economic and Business Aspects of Sustainability)

Abstract

:
Macau gambling companies included Corporate Social Responsibility (CSR) information in their annual reports and websites as a marketing tool. Responsible Gambling (RG) had been a recurring issue in Macau’s chief executive report since 2007 and in many of the major gambling operators’ annual report. The purpose of this study was to develop a measurement scale on CSR activities in Macau. Items on the measurement scale were based on qualitative research with data collected from employees in Macau’s gambling industry and academic literature. First and Second Order confirmatory factor analysis (CFA) were used to verify the reliability and validity of the measurement scale. The results of this study were satisfactory and were supported by empirical evidence. This study provided recommendations to gambling stakeholders, including practitioners, government officers, customers and shareholders, and implications to promote CSR practice in Macau gambling industry.

1. Introduction

After three centuries of development in the gaming industry, Macau was now referred to as “Monte Carlo of the Orient” and “Las Vegas of the East”. By the end of 2015, there were 23 casinos in the Macau Peninsula and 13 on the Taipa Island. The market shares, based on the number of casinos, were as follows: 55.6% for SJM, 16.7% for Galaxy, 11.1% for Venetian and Melco Crown, and 2.7% for Wynn and MGM [
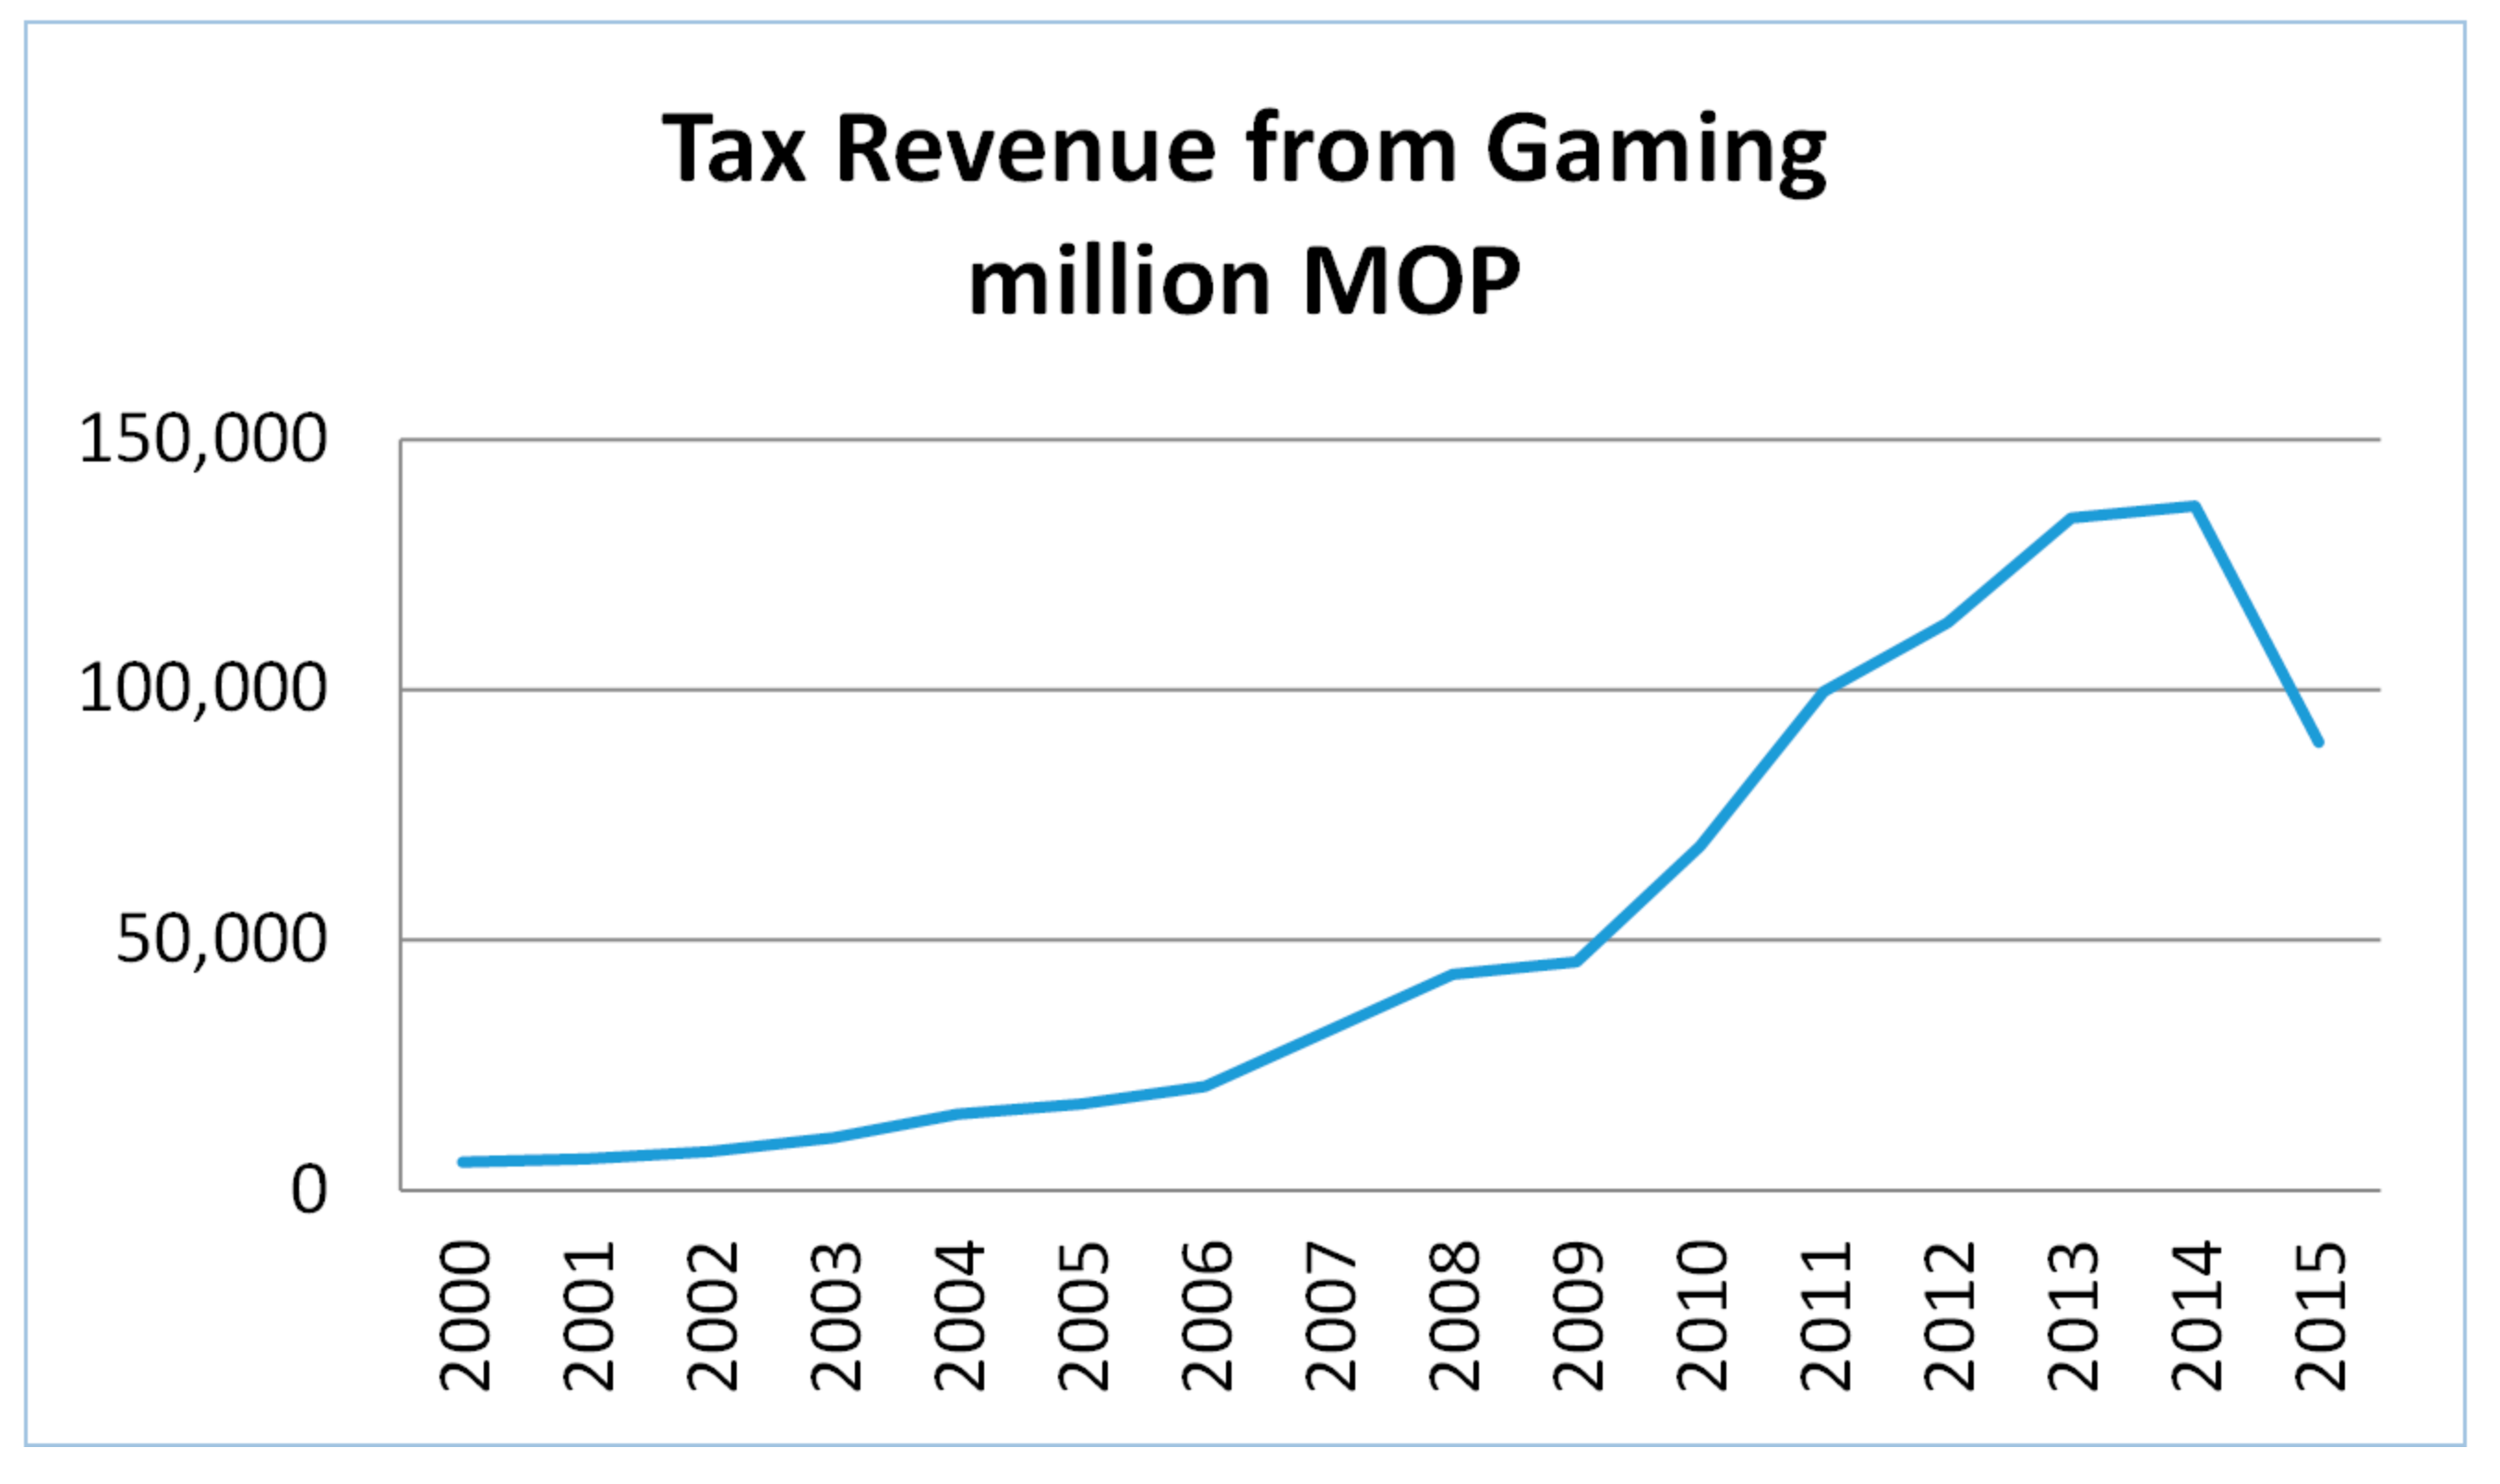
1]. Tax from gaming represented over 70 percent of the government revenue in 2009. With an average of 6 percent growth per year since 2000, the gaming revenue in Macau exceeded Las Vegas occasionally and this made Macau the largest gaming city in the world [1] (see Figure 1).
Gambling companies included Corporate Social Responsibility (CSR) information in their annual reports and websites as a societal marketing tool [3]. Responsible Gambling (RG) had been a recurring issue in Macau’s chief executive report since 2007 and in many of the major gambling operators’ annual report. Throughout the development of the gaming industry in Macau and the increasing amount of gaming facilities, people increased their concerns on the issues created by gambling. The major concern from the opposing parties was problem gambling or addictive gambling Problem gambling, characterized by difficulties limiting time and money spent gambling [4]. Problem gambling had increased by 1.7% percentage point from 2003 to 2007 [5] and had been expanding across the communities. Problem gambling was not the only issues created by the over concentration on the gambling industry. Casinos usually offered a more lucrative employment package, such as wages, working environment, meals, and health insurance. This made other businesses difficult to recruit or retain talents. Fong, Fong and Li (2011) [6] estimated the social cost of gambling increased over twofold from 2003 to 2007 and expected the cost continue to increase.
To reduce the adverse impacts of the gambling industry, Macau government provided assistance to problem gamblers and their associated relatives to resolve their problems. For example, the DICJ and other institutions, such as the University of Macau, held “Responsible Gambling Awareness Week” each year to provide information regarding the adverse effect of addictive gambling to the public and the employees from casino with the objective to help these parties develop a positive attitude toward gambling. Furthermore, Macau government formed “Responsible Gaming Work Preparation Unit” with other concerned institutes to construct responsible gaming policies and the corresponding administrative procedures [7].
Researchers in the tourism and hospitality industry began to research in CSR in recent years [8]. While many researches focused on the benefits of CSR activities [9], Hancock (2011) [10] showed that in some circumstances, such as a bar within a casino, businesses would perform irresponsibly because the liquor served in the casino was directly linked to bar revenue and more importantly, the liquor kept people gambling and spending, and hence the businesses would have a very loose enforcement on liquor regulations and requirements. The measurement and dimensionality of the CSR were important issues in this study. Because of the CSR and RG in gambling industry was still a recent issue, few studies had endeavored to develop sound measurement items to investigate the CSR activities in Macau. This study offered a review of the CSR issues being addressed in the Macau gaming industry. In order to attain the above objectives, there were two main research questions of this study. The first question was what are the CSR dimensions that have been used in Macau gambling industry? The second question was how important are CSR dimensions which have been implemented in Macau gambling industry? In particular, the specific objectives of this study are as follows:
1.
Evaluate the CSR performance of the gambling operators in Macau
2.
Create a measurement scale of CSR practices of Macau gambling companies
3.
Provide recommendations and suggestions to gaming industry.

2. Literature Review

2.1. CSR in Hospitality and Tourism

Researchers in the tourism and hospitality showed an increasing concern in CSR [8]. A broad range of potential benefits of CSR were identified, such as the enhancement of profit, reputation, risk and crisis management, customer services, and brand value, decrease of cost and, long term sustainability for the companies and the workers [9,11]. The environmental context, such as eco-tourism [12], heritage tourism [13], mass tourism [14], tourism operators and airline [15,16], sport and leisure [17], and destination [18], was being studied by various scholars. Jamrozy (2007) [19] further studied the relationship the marketing of tourism with respect to CSR. However, similar to the research on CSR in other businesses, the results were inconclusive [8]. Other forms of CSR, aiming to achieve sustainable competitive advantage, such as responsible environmental marketing and community based tourism [20] and sustainable design and green building practices [21], were gaining attention from various entities. Nevertheless, the hospitality sector is the largest sector in tourism industry.
Due to various social problems and negative impacts associated with gambling, casinos were more likely to face social issues and hence CSR was important to the gambling industry [8]. First, when the gaming operators performed CSR activities, people could develop a positive attitude; second, CSR could project a positive image of the casino; third, CSR could increase workers’ loyalty and retention and hence lower workforce loss; and forth, CSR could improve the surrounding community of the casino [22]. However, Porter and Kramer (2007) [23] asserted the scope of CSR changes rapidly according to the specific characteristics of the industry. In the case of casinos, gaming control board, government, and RG regulations and guidelines could be initiated as a unique CSR activity to operate socially responsible businesses. However, due to complexity and conceptual difficulties of the definition of CSR, measuring CSR was difficult [23]. The measurement difficulties enhanced when the scope of CSR activities changes accordingly with industries and companies specifics [24]. For example, some casinos implemented self-exclusion policies, and self-limit policies for problem gamblers and their corresponding relatives. Some casinos provided training programs in long-term sustainable business for employees [25].
In contrast to the empirical results from the general business and the tourism and hospitality industry, there was no significant relationship between CSR and financial performance in the gaming industry. One possible reason is that CSR was not easy to gain attention from the management team due to its narrow perspective, lack of focus and difficulties to quantify. Furthermore, CSR could be manipulated easily by opportunists [26]. Welford (2008) [27] pointed out the gambling industry was similar many others industry in various aspects. Industry players should understand that it was a moral thing to act socially responsible. The author further pointed out there were many similarities between gaming industries and the others, so it was necessary to convince the gaming operators to act responsibly. At the same time, the tools to practice CSR could be borrowed from other industries, such as code of codes of conduct, broader social and environmental initiatives, partnerships with NGOs and charities, strategies for climate change, community investment initiatives and a good degree of accountability and reporting. Unfortunately, these practices were seldom observed in the gaming industry.

2.2. Responsible Gambling

Massachusetts Gaming Commission (2010) [28] defined Responsible gaming (RG) as the services to minimize the adverse effects, regardless to the individuals or to the society, associated with gaming. The purpose of gaming interventions was to prevent gaming-related problems, to provide information, balanced attitudes and choices, and to protect vulnerable groups. Thus, the guiding principle was to prevent the social problems to arise, to promote health, to reduce harm and to encourage personal and social responsibilities [29]. Alternatively, research scholars included additional requirements for responsible gaming. They defined RG as a policy for the gaming operators to reduce the adverse effects [25,30,31], providing economic benefits to the society [31], and a distinct strategies to implement CSR [25] with features such as public education, employee training, resources for help and treatment, legalizing minimum age and self-exclusion programs [32]. In this study, RG is defined as a strategy or policy that could minimize negative social and/or community impacts associated with gambling activities.
Responsible gambling implemented by the casinos could not only increase publicity and brand image of the casinos, but also become a necessarity [33]. One particular RG strategy was to prohibit local residents to enter the casino. This might reduce the spread of problem gambling in local communities and hence sustain the development of the gaming industry [34]. Furthermore, casino employees might expect the casino to have a moral code. In this context, this would mean implementing responsible gambling strategies [25]. This practice would not only increase employee’s pride toward the casino [34], but also enhance their orientation toward customers and hence increase service quality [25].
Casinos were now on the edge that if they do not perform responsibly, the company will not survive [35]. It was no doubt that CSR would become one of the priorities of casino management in the 21st century. Despite the importance of RG or CSR practices, some casinos did not perform RG strategies. For example, one casino in Korean, the Kangwon Land Casino, allowed not only foreigners to enter the casino, but also the locals, while the rest of the casinos in the country prohibits local people to gamble [22].

2.3. Conceptual Framework

2.3.1. Dimensions of CSR in Hospitality and Tourism

A reliable and accurate measurement of CSR was a critical issue because of its importance to not only business but also to the society [36]. Numerous methods, such as forced-choice survey instruments, reputation indices and scales, content analysis of document, behavioural and perceptional measures, and case study, ref [37] was introduced by academic researchers and practitioners [37,38] but there was no unified consensus of measurements [39]. Content analysis was by far the most common way to measure CSR [40], due to its ability to derive a new measure for social responsible activities [41]. For example, using the CSR definitions proposed by Carroll (2000), Garcia de los Salmones, Crespo, and del Bosque (2005) [42] and Maignan (2001) [43] adopted four dimensions of CSR from the management perspectives, economic, legal, philanthropic, and ethical. The authors found the economic dimension of CSR was not an apparent dimension from the consumers’ perspective when evaluating CSR activities [43]. Furthermore, the authors also argued that the legal and ethical dimensions should be combined to create a single factor [43]. Golob, Lah, & Jančič (2008) [44] took this into further extend for which they combined all four dimensions into one single factor for the consumers. Moreover, due to the recent attentions and focuses on CSR activities, information from companies became more easily accessible [45]. Luo, Lam, Li, & Shen (2016) [46] studied the process of CSR in Macau gambling industry. The authors compared different types of CSR currently employed by Macau’s gambling operators and identified the most popular CSR practice areas. Despite the popularity of content analysis, the limitation was the difference between the reported action and the actual company behavior [47]. Therefore, the reliability of company reports would represent a significant limitation [46].
Scale development was also another useful method to study CSR. Aupperle (1984) [48] was the first study that employs this methodology to develop a multidimensional scale of CSR from the managers’ perspectives. This scale was constructed using the framework created by Carroll’s (1979) [49] and was considered as the most widely recognized [42,43,50]. In additions, Pérez and Del Bosque (2013) [51] argued that the four dimensions CSR framework proposed by Carroll (1979) [12] were inter-related and hence researchers would not find the framework useful if they assess the four dimensions separately. Peterson (2004) [52] argued that the necessary condition to assess the four dimensions separately was employees must recognize the CSR performed by their companies.

2.3.2. Stakeholder Theory

As the Stakeholder theory was gaining attention, researchers began to apply this theory as an alternative approach. According to this theory, the CSR was based on the corresponding stakeholders. A stakeholder was “any group or individual who can affect or was affected by the actions or performance of the objectives of the firm” [53]. Stakeholders included employees, customers, suppliers, stockholders, banks, environmentalists, government and other groups who could help or hurt the corporation. There were numerous ways to classify stakeholders. Savage, Nix, Whitehead, & Blair (1991) [54] classified stakeholders into primary and secondary. Primary stakeholders were those who were directly or economically related to the organization while secondary stakeholders were those who were not but could be possibly affected by the organizations’ actions. Consumers, producers, workers, and shareholders were common examples of primary stakeholders due to their interests in the performance of the company and the impacts they received regardless of the success or failure of the company. Secondary stakeholders included governments (especially through regulatory agencies), unions, nongovernmental organizations (NGOs), activities, political action groups, and the media were important because they could potentially harm or benefit the corporations. Atkinson, Waterhouse, & Wells (1997) [55] defined environmental stakeholders as those who were included within the external environmental of the operations. Other authors classified stakeholders as claimants, influencers or even a combination of both [56].
Other methods of defining stakeholders were also suggested. Mitchell, Agle and Wood (1997) [57] classified stakeholders into “narrow definition” and “widely defined”. The “narrow definition” stakeholders were those who were directly related to the economic interest of the company and these stakeholders were the primary concern of the management team. The “widely defined” stakeholders were currently less relevant, but with the potential to gain influence and hence become the “narrow definition” stakeholders. In this regards, the classification by Mitchell et al. (1997) [57] was very similar to the primary and secondary stakeholders proposed by Savage et al. (1991) [54] but Mitchell et al. (1997) [57] included a transition process of stakeholders from “widely defined” to “narrow definition”. Clarkson (1995) [58] proposed a similar classification of stakeholders as Savage et al. (1991) [54]. The primary stakeholders, to Clarkson (1995) [58], were those who were necessary for the survival of the company; and the secondary stakeholders are those who could or could be affected by the company. On one hand, this definition of primary stakeholders, while similar to the definition by Savage et al. (1991) [54], was not related to the “narrow definition” proposed by Mitchell et al. (1997) [57] or Freeman (1984) [53]. Clarkson’s (1995) [58] definition focused on the actual survival of the company whereas Freeman more moderately focused on the ability to affect. On the other hand, Clarkson’s definition on secondary stakeholders was very similar to Freeman (1984) [53] definitions. In this regards, Clarkson (1995) [58] connected the original theory proposed by Freeman (1984) [53] and the various classifications of stakeholders proposed by numerous researchers afterwards.
As the stakeholder perspective was receiving more attention in the literature [38,59,60], numerous researchers attempted to identify the dimensions of CSR [38]. Gambling industry was no different from other industries ([61]), such as banking [60]. In sum, CSR was a term without much consensus in its definition. Researchers should consider the specific characteristics of the industry while applying CSR [62]. In conclusion, despite the popularity and significance of CSR, numerous researches show it was industry specific [62] and hence a measurement scale from the stakeholder perspective for CSR in the gambling industry was necessary.

2.3.3. Proposed CSR Dimensions

This study tried to develop a measurement model of CSR in gaming industry from the stakeholder’s point of view. Based on the above findings, the existing research on CSR, RG as part of CSR, and the features of the gaming industry in Macau, CSR in this study was operationalized by six dimensions, including customers, employees, shareholders, environment, government, community [38,46,51] (see Figure 2).

Customer

Customers were the most common class of stakeholders since customers were the revenue sources for the company and hence they were important to the survival of the company. Furthermore, numerous researches showed the impact of this class of stakeholders to the company [63,64]. Providing customers with excellent services, high quality and safe product was the foundation to a successful business [65] regardless it was from stakeholder theory or traditional theories.

Shareholder

According to many theories, such as the agency theory, owners and management team had different interests. However, the two groups could have many similarities. Instead, owners were an important stakeholder group among the company since they provided financial supports and they delegated the rights to run the company to the management team and hence they should be entitled to return of their investments. No stakeholder theory was possible to neglect this group without severe consequences. The rights of the shareholders included, but not limited to the receipt of financial information, to sell shares, and to vote on major company decisions and the board members. Despite the importance of this group of stakeholders, numerous researches ignored them [63,66,67]. One naïve reason was that the authors implicitly included the shareholders due to its inevitable importance. The other reason was that the authors believe that the interest of the shareholders and the stakeholders are fundamentally contradictory and hence they could not be studied at the same level. In addition, once the shareholders or owners were aware of other stakeholders, the effects could be long lasting. However, regardless of the underlying reasons, any theory that did not match common sense should not be applied [57].

Environment

The third stakeholder group was the environment. Although the focus here was on natural environment, but one should not disregard the relevance of the local community. Environment, despite its importance, was ignored by many management teams due to its legitimacy questioned by managers. On one hand, although Berman et al. (1999) [63] did not find any evidence on the impacts of environment toward financial performance, they still include the environment as a stakeholder. On the other hand, Tiras et al. (1998) [64] found the contrary results on the impact of environment toward financial performance. The source of power from the environment was in fact coming from concern groups and the government. Although both groups could have significant effects on the management team, they were the only aspect of the environment in this regard.

Employee

The fourth stakeholder group was employees for which will have an immediate impact on various aspects, such as profit and revenue [63,64]. This group appeared in almost every definition of stakeholders due to its impact to the company, such as their working hours and expert knowledge, and the impact the company could affect them, especially wage and financial security. In return for specializing their skills to fit a specific job, employees also expected meaningful and diverse jobs as well as respect from management and colleagues. Despite wages and other benefits, whether the job was meaningful to the employee and the respect of management and co-workers were important determinants of loyalty. When the employees were treated with respect, both financially and non-financially, the less likely the employee was going to manipulate the bargaining power (e.g., Strikes). A good human resource policy could enhance the competitiveness in attracting and retaining talents while a poor one could hurt the company.

Government

Government was an important stakeholder in a sense that many of the rights of the stakeholders were protected by policies and regulations. In modern market economies, the dictate of “maximize profits while obeying the law” would no doubt involve fulfilling numerous obligations to suppliers, workers, consumers, societies, and so on. The main function of the government was acting as an umpire and at the same time providing minimum involvement and allowing the market to regulate itself. Hence, it was logically deducted to an advocate of minimum taxation, pension fund, etc. However, for social problems such as tobacco, alcohol and of course gambling, government involvement was important to reduce the potential or actual harm to the society, taking in consideration healthcare and environmental sustainability. Indeed today, is impossible to elude the relationship man-environment in market consideration [68,69]. Therefore, the Gaming Inspection and Coordination Bureau (DICJ) provided guidance and assistances to the definition and execution of the economic policies for the operations of the casino games of fortune or other ways of gaming, and gaming activities offered to the public in Macau.

Community

The local community was an important stakeholder. For example, the firm could not expose the community to unreasonable hazards in the form of pollution, toxic waste, and so on; or when the firm was exiting the community, people expected the transition should be smooth; when the firm was mismanaged, it was similar to a person who commits a crime. Furthermore, it was considered as violating the social contract that the firm had with the community and should be expected to be distrusted and ostracized.

Excluded Stakeholder

Stakeholder groups could be very diverse and industry specific. Hence, the number of potential stakeholders could be far more than the one mentioned above. However, the purpose of this study was to develop a measurement scale for CSR activities in Macau, so only those who were with the most importance should be considered. Therefore, groups or stakeholders that did not possess sufficient legitimacy and, or power were not included in this study. For example, casino suppliers should be an important internal stakeholder. However, in the gambling industry, those suppliers were approved by Macau government. Therefore, they are the excluded stakeholder.

3. Methodology

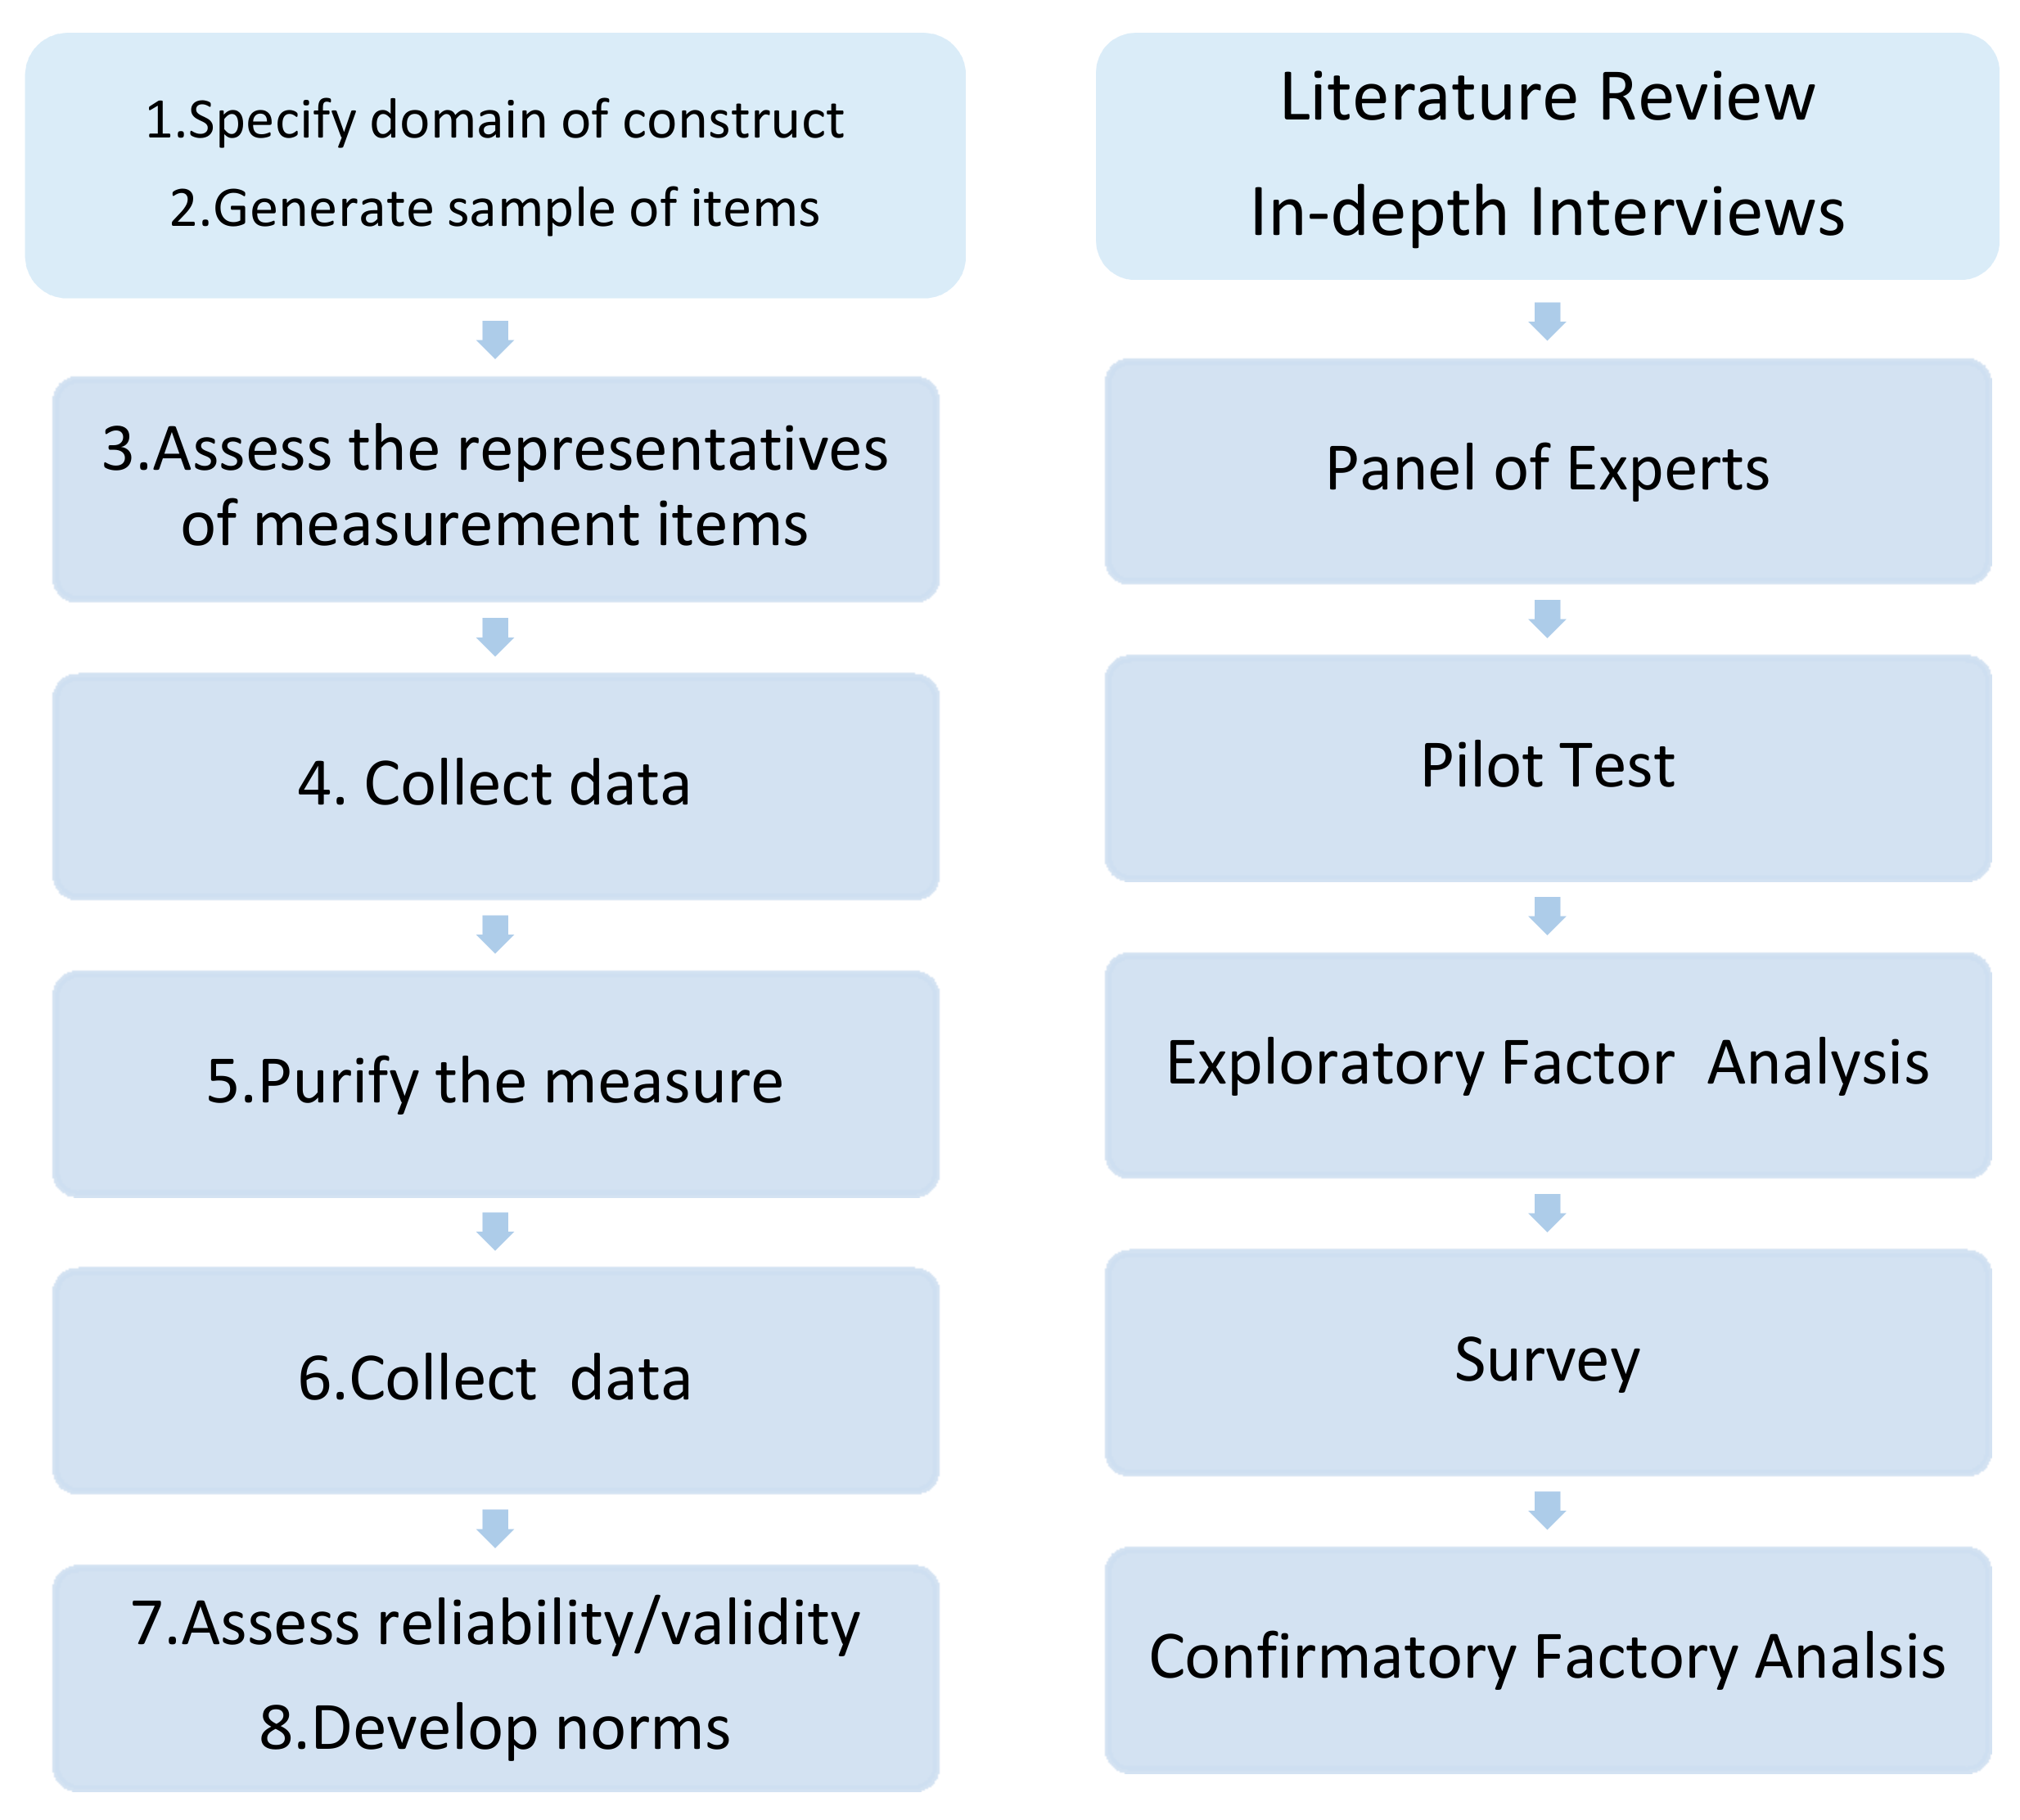
This study followed Churchill’s (1979) [70] methodological proposal, which was based on a standard procedure for developing measurement instrument, to design a new multi-item measurement scale that included items previously used in stakeholder theory regarding tourist experience. An eight-step approach, which included quantitative and qualitative research methods, was adopted in this study [70]. This study employed qualitative methods to review tourism and leisure research regarding participants’ experiences to generate a set of items and constructs domains of CSR practice. The researchers interviewed three panel experts using open-ended questions and conducted a content analysis of the responses. The panel experts were from Senior Vice President of Galaxy Entertainment Group, academia for tourism study of City University of Macau and senior manager of SJM Holdings Limited. The questionnaire contained two sections and was generated from the characteristics of the gambling industry in Macau. Section 1 involved the respondents’ demographic information. Section 2 assessed the CSR dimensions in Macau gambling industry. Data analysis was applied using the constant comparison technique [71], which was a systematic method for recording, coding, and analyzing data. By combining the items generated from two sources (the open-ended survey and literature review), CSR in this study was operationalized by six dimensions, including customers, employees, shareholders, environment, government and community [38,46,51]. Bases of measurement 38 items were developed. The content validity of the scale was analyzed through pilot testing which was collected through a convenience sample of 59 respondents who were part-time students and working in gambling industry for efficacy and clarity. As a result of this process, 32 item were included in the scale and used for the main survey which respondents were asked to evaluate all items on a 5-point Likert-type scale in which a score of 1 indicated strongly disagree with the statement, and a score of 5 signified total agreement with the statement. The sample size was 60 employees for each gambling operator. Finally, a total of 360 questionnaires were distributed to employees of 6 gambling operators, and 306 usable questionnaires were collected.
This study employed an exploratory factor analysis (EFA) to identify the dimensionality of CSR practice in the gaming industry. Kaiser-Myer-Olki (KMO) and the Barlett’s Test of Sphericity were conducted to check the validity of the factor analysis. The validity of the factor analysis consisted of two parts. The first part was the correlation matrix, which was tested by the Barlett’s Test. The rule of thumb is when then inter-item correlation is above 0.30, the correlations were considered as substantial. The second part was the sample adequacy, which was tested by the KMO test. The factor reliability was analyzed through Cronbach’s alpha and item to total correlation. In this analysis process, 9 items were deleted due to high cross loadings. The Cronbach’s alpha was 0.945. The KMO test and the Barlett’s test suggested that the final model should include 23 items (significance level 0.0001). Based on the results from the screen plot and eigenvalue (both greater than 1), the factors and the items explained over 92% of all variance. As a result, 23 items were included in the scale and used for order confirmatory factor analysis (see Table 1).
Confirmatory factor analysis (CFA) used the covariance matrix to verify the factor structure identified from the results from EFA. The meaning of validity was whether accurate information can be extracted from the analysis. The validity analysis for this study included both content and construct validity. Content validity tested the representativeness of the questionnaire items. There were no reports of misunderstanding during the pilot test. The interviewees stated that the items were easily understood, which indicated good content validity [76]. The CFA was one of the most effective tools for testing construct validity. According to Campbell and Fiske (1959) [77], construct validity typically tested the extent to which the data provide; (a) convergent validity, the extent to which different assessment methods show similar measurements of the same trait; ideally, these values should be moderately high; and (b) discriminant validity, the extent to which independent assessment methods showed divergent measurements of different traits; ideally, these values should demonstrate minimal convergence. The next step assessed the convergent validity and discriminant validity. Convergent validity was evaluated by checking all factor loadings and the values of the average variance extracted. The second-order factor model was used to find measurement errors and modifying coefficient paths. The final items will be developed (see Figure 3).

4. Data Analysis and Results

4.1. Profile of Respondents

A total of 360 questionnaires were distributed to respondents, and 306 usable questionnaires were collected, a response rate 85%. The demographic profile of the respondents was presented in Table 2. There were 147 (48%) female and 159 (52%) male among the respondents. The main age group was 21–29 (47.1%), followed by 30–39 (36.3%), 40–49 (11.1%), 50–59 (3.9%), and 60 or above (1.6%). There were 51.3% respondents who had university education, 32.4% with high school or below, 10.8% with diploma, and 5.6% with master or above education. There were 18% respondents from SJM, Melco, 17.3% from Galaxy, 16% from Sands, 15.7% from Wynn, and 15% from MGM. The composition of respondent’s position were 59.5% from General staffs, 22.5% from Supervisors, 8.22% from Assistant Managers, 7% from Managers, and 2.3% from Senior Managers. Furthermore, 39.9% of the respondents have 4–9 years of experience, 35% have 3 or below 19.6% have 10–19 years and 5.6% have more than 20 years (see Table 2).

4.2. CFA Results of the Dimensions of CSR in Gaming Industry

The next step was to evaluate the psychometric properties of reliability and validity for the proposed measurement scale. In this study, first and second order confirmatory factor analysis (CFA) was performed using AMOS22 as per the maximum likelihood estimation (MLE) procedure.

4.2.1. Validation of the Measurement Scale

CFA measured the reliability and validity of the scale [70]. A six factor model was proposed. This study followed the procedures suggested by Anderson and Gerbing (1988) [78] to reduce the number of measurement scales, i.e., an iterative process with theoretical consideration. Table 3 showed the results of first order CFA. The root mean square error of approximation (RMSEA) felt between the acceptable arrange of 0.5 to 0.8 [79]. The analysis of the goodness of fit was verified with Satorr-Bentler χ2 (p < 0.05). Other indices such as the GFI [80] and CFI [81] were 0.880 and 0.919. The comparative fit indices, NFI, NNFI and IFI [82], were the most common measures for confirmatory tests. All values were greater than 0.9, indicating that the model met the criteria of a good model fit.
The reliability of the measurement scale was evaluated by Cronbach’s α coefficients [83] and by an average variance extracted (AVE) [79]. For a measurement to be reliable, Cronbach’s α coefficient should be above 0.7 [79]. Since AVE measures the explanatory power of the random measurement error, therefore, to ensure the reliability, the AVE should be above 0.5 [79,84]. The AVE for each factor confirmed the internal reliability of the proposed construct (see Table 3).
To verify the representativeness of the measurement items to their corresponding factors, a convergent validity test was employed [85]. The findings showed that all measurement scale items were with high loading factors and standardized lambda coefficient were above 0.5. In addition, all items were significant at a confidence level of 95%, confirming the convergent validity of the model [86]. Finally, according to Kline (2015) [87], the factor correlation should be examined to verify the discriminate validity. Factory correlation among all six dimensions was less than 0.5, confirming the discriminate validity of the value. The results showed that a good fit among the factor structure of the variables and provided for the discriminate validity (see Table 4).
Finally, a second order CFA was conducted to examine the six dimensions of CSR. According to Anderson and Gerbing (1988) [78], this procedure was important to examine the inter-correlation among different dimensions. In Table 5, all factors loaded significantly and accurately representing the underlying concept. The value of χ2 and the other fit indices was significantly (χ2 = 623.112, CFI = 0.882, GFI = 0.835, NFI = 0.828, NNFI = 0.883, RMSEA = 0.076, p = 0.000) confirming the validity of the scale. Therefore, the adjustment of the second order model was acceptable.

4.2.2. Descriptive Statistics

Table 6 showed that most highly rated aspects were the following: Our company keeps a strict control over its cost (SHAR2 mean = 3.79), Our company promotes the responsible gambling with the regulation (GOV4 mean = 3.71), and Our company tries to ensure its survival and long term success (SHAR1 mean = 3.67). In turn, the aspects rated the lowest by the respondents were the following: Our company targets sustainable development and creation of a better life for future generations (COM2 mean = 3.11) and Our company cares about public psychological problems (COM3 mean = 3.09).
Comparing the ratings for each of the dimensions, the perception of corporate performance with regard to employee (mean = 3.22) and community (mean = 3.15) was significantly lower. The dimensions of CSR with the highest ratings were the shareholder (mean = 3.69), government (mean = 3.57) and customer (mean = 3.54) (see Table 7).

5. Discussion and Implications

Apart from a substantial amount of literature on CSR, there was a lack of empirical research testing and measuring of CSR activities in the gambling industry. There were many researches in the literature with application of CSR in different industries. Therefore, the understanding of the industrial specific factors toward CSR was necessary for appropriate adjustments in measurement scale [62]. Considering the limitation of previously used scales, a strong current trend was the use of stakeholder theory to propose a new dimensioning of CSR composed of the particular activities in gaming industry, which is Responsible Gambling. According to Churchill’s (1979) [70] methodological approach, this study followed both the qualitative and quantitative approach to develop a measurement scale. Based on the review of literature and discussions with gambling managers and experts, six CSR domains, including employee, customer, shareholder, environment, community and government, were identified. In order to test the adequacy of this new CSR measurement scale, a quantitative study based on personal surveys with gambling employees was designed. A total of 306 usable questionnaires were collected.
The first interesting result of this study was the confirmation of the multidimensional nature of CSR, which was consistent with the findings of previous research in stakeholder theory [38,46,51]. Within the framework, Responsible Gambling included employee, customer, community and government. However, the coefficient on customer was insignificant and therefore, this measurement item was deleted. From the employee’s perspective, the Responsible Gambling was insignificant toward customers. Specifically, the two questions measuring Responsible Gambling toward customers, “Our company cares about customers’ psychological problems” and “Our company should provide family with prevention programs for gamblers who could not control their gambling behavior”, were not important from the employees’ perspective. This result was contrary to Song, Lee, Lee, and Song (2015) [88], which the authors included RG toward customers in their measurement model. On one hand, their results showed that the company should have a responsibility toward the customers. On the other hand, our results showed the contrary. One possible reason for such a difference was history of gambling and culture. The sample in Song et al (2015) [88] was from Korea while the sample of this study was from Macau. Macau had a much longer history of gambling. This meant that gambling has been part of many Macau people’s life since the day they born. Furthermore, Responsible Gambling has become a growing concern in Macau since 2010. Employees’ understanding of the responsible of the company could be very different.
Second, from employee’s perspective, this study showed that the attributes of CSR consists of employee, customer, shareholder, environment, community and government. However, the factor loading across these six attributes were different. According to Table 6, since shareholders, government and customers dominated the top 10 of mean test. Therefore, the most important dimensions were shareholders, government and customer. The government dimension was important because it was related to licenses renewal and regulations [46]. One of the reasons why the shareholder dimension was important was, since these six gaming corporation were publicly listed, the filing of CSR report would attract CSR concerning investors. The least important were environment and community. The questions concerning community were “Our company targets sustainable development and creation of a better life for future generations” and “Our company cares about public psychological problems”. Therefore, the employees did not believe that the gaming corporations were concerned about the sustainable development Macau. The question concerning environment was “Our company tries minimize its unfavourable and damaging effects on the natural environment”. This coincided with the pattern of development in Macau (or China), which was based on destruction of the environment. Many of the land used to build casino/hotels were from land reclamation.
Finally, the coexistence of customer being the most important concern in CSR and customer being the least important concern in RG showed that from the employees’ perspective, given the fact RG should be a part of CSR activities, the gaming corporations have been exerting a huge effort in promoting CSR to customers. This meant that the gaming corporations were not incapable of promoting socially responsible activities, given its success in promoting CSR but the concern was whether they were willing to promote responsible gambling. Given that most of the revenue of these gaming corporations came from casino or VIP rooms, and the purpose of RG was to reduce the amount of money people gamble, one would be very difficult to convince the shareholders or profit concerning parties to implement RG effectively.
This study contributed to the advancement of knowledge in the field of CSR. First, this study contributed to literature by developing measurement for the constructs of CSR in gambling industry in Macau. This study conducted holistic and comprehensive empirical research to investigate the measurement scale of CSR in gambling industry. This study contributed to the advancement of knowledge in the field of CSR through its practical application of stakeholder theory. Although there were several ways of measuring CSR in the literature, this study added to the literature by providing an extra measurement of CSR. Specifically, this study focuses on internal stakeholder perception. The perception of employees concerning the responsibility of stakeholder groups was captured through this instrument. Furthermore, from hospitality and tourism perspective, based on the industry specific, this study included RG as a factor of CSR. The results showed that this adjustment was significant and valuable in gambling industry.
This study also contributed to several practical applications. The first practical contribution of this study was the implications for government. The results showed that the government was a very important factor of both CSR and RG from the employees’ perspective and the government possessed the tools of rule, regulations and licenses renewal to encourage gaming corporations to focus on areas of weakness, such as environment and community. Furthermore, during the process of designing CSR or RG policies, the increase of promotion within the industry on the concerned areas might be beneficial.
Second, as the results of this study showed, customer groups was a very important and influential group to the gaming corporations. Hence, customers possessed the power to force the company to implement certain CSR practices. As customers increased their awareness in certain areas of weakness in CSR practices, companies would increase their awareness.
Third, from the industry’s perspective, this study was a reference for the implementation of CSR activities. The definition of CSR among the six gaming corporations in Macau could be significantly different [50]. The measurement scale of this study provided CSR implementation from the employees’ perspective. As a management team of the gaming corporation, they could evaluate the performance of the current CSR by understanding the perception of employees. This would improve how the employees feel about the company. The bottom line was, regardless how good the CSR program could be, employees were the ultimate people to execute the program. Substantial improvement could be achieved when the philosophy between the management team and employees matched.
In conclusion, this study intended to study CSR activities and RG in gambling industry in Macau. A conceptual model was developed to measure scales including employee, customer, shareholder, environment, community and government. The results of this study were satisfactory and were supported by empirical evidence. The implications of the research findings were provided to hospitality and tourism industry. It was recommended that future research could be conducted in order to consolidate the knowledge and form rigorous theories in hospitality and tourism researches.

6. Limitations and Future Research

There are several limitations of this study, which also encourage further researchers. First, although researchers attempted to include various factors in all dimensions and provided a significant tool for measuring CSR, some items described in the literature were not included in this study. Furthermore, some stakeholders mentioned in the literature were not included in this study. It was important to highlight that not all the possible stakeholders were included. Additional stakeholders, such as supplier, could be included for the further research. Second, certain flexibilities and recommended techniques as an alternative to current study could be found in Churchill (1979) [70]. The methods used in the current study included incorporating a panel of experts and the assessment of criterion validity with convergent validity and discriminate validity. Therefore, future studies could use alternative procedures to explore other possible methods and to enhance the measurement scale of CSR. Third, this study focused on the perception of employees. Despite the effort to minimize this limitation during sampling, the sample could be biased. The respondents were endured of the confidentially of their response and all the information was kept anonymous. One should expect that they provide right information. This study did not incorporate longitudinal information so the across time variation was not involved and the variations of consumer perception could not be captured. Future research could be expanded into a longitudinal study.

Acknowledgments

This project was partly supported by a research grant funded by the Macau Foundation.

Author Contributions

The outline of the study was led by Jian Ming Luo. Jian Ming Luo and Chi Fung Lam designed and completed the paper. Ka Yin Chau reviewed the manuscript. Hua Wen Shen and Xin Wang provided research advices.

Conflicts of Interest

The authors declare no conflict of interest.

References

  1. Gaming Inspection and Coordination Bureau (DICJ). Macau Gaming History. 2016. Available online: http://www.dicj.gov.mo/web/en/history/index.html (accessed on 20 May 2016).
  2. Macao Statistics and Census Bureau (DSEC) Tourism and Gaming. 2016. Available online: http://www.dsec.gov.mo/default.aspx (accessed on 1 July 2016).
  3. Kim, J.S.; Song, H.J.; Lee, C.K.; Lee, J.Y. The impact of four CSR dimensions on a gaming company’s image and customers’ revisit intentions. Int. J. Hosp. Manag. 2017, 61, 73–81. [Google Scholar] [CrossRef]
  4. Markham, F.; Young, M.; Doran, B. Improving spatial microsimulation estimates of health outcomes by including geographic indicators of health behaviour: The example of problem gambling. Health Place 2017, 46, 29–36. [Google Scholar] [CrossRef] [PubMed]
  5. Wong, W.K.; Chan, K.M.; Tai, P.K.; Tao, V.Y.K. Problem gambling among university students in Macau. J. Psychol. Chin. Soc. 2008, 9, 47–66. [Google Scholar]
  6. Fong, D.K.; Fong, H.N.; Li, S.Z. The social cost of gambling in Macao: Before and after the liberalisation of the gaming industry. Int. Gambl. Stud. 2011, 11, 43–56. [Google Scholar] [CrossRef]
  7. Gaming Inspection and Coordination Bureau (DICJ). Responsible Gambling. 2016. Available online: http://www.dicj.gov.mo/web/en/responsible/responsible01/content.html#1 (accessed on 20 May 2016).
  8. Inoue, Y.; Lee, S. Effects of different dimensions of corporate social responsibility on corporate financial performance in tourism-related industries. Tour. Manag. 2011, 32, 790–804. [Google Scholar] [CrossRef]
  9. Bevan, S.; Isles, N.; Emery, P.; Hoskins, T. Achieving High Performance: CSR at the Heart of Business; The Work Foundation: London, UK, 2004. [Google Scholar]
  10. Hancock, L. Regulatory Failure? The Case of Crown Casino; Australian Scholarly Publishing: North Melbourne, Australia, 2011. [Google Scholar]
  11. Aquilani, B.; Silvestri, C.; Ioppolo, G.; Ruggieri, A. The challenging transition to bioeconomies: Towards a new framework integrating corporate sustainability and value co-creation. J. Clean. Prod. 2017. Available online: http://www.sciencedirect.com/science/article/pii/S0959652617306066 (accessed on 1 November 2017).
  12. Chiu, Y.T.H.; Lee, W.I.; Chen, T.H. Environmentally responsible behavior in ecotourism: Antecedents and implications. Tour. Manag. 2014, 40, 321–329. [Google Scholar] [CrossRef]
  13. Edwards, D. Corporate social responsibility of large urban museums: The contribution of volunteer programs. Tour. Rev. Int. 2007, 11, 167–174. [Google Scholar] [CrossRef]
  14. Weaver, D. The Sustainable Development of Tourism. In The Wiley Blackwell Companion to Tourism; John Wiley & Sons: Hoboken, NJ, USA, 2014; pp. 524–534. [Google Scholar]
  15. Coles, T.; Fenclova, E.; Dinan, C. Responsibilities, recession and the tourism sector: Perspectives on CSR among low-fares airlines during the economic downturn in the UK. Curr. Issues Tour. 2011, 14, 519–536. [Google Scholar] [CrossRef] [Green Version]
  16. Dodds, R.; Kuehnel, J. CSR among Canadian mass tour operators: Good awareness but little action. Int. J. Contemp. Hosp. Manag. 2010, 22, 221–244. [Google Scholar] [CrossRef]
  17. Salome, L.R.; van Bottenburg, M.; van den Heuvel, M. ‘We are as green as possible’: Environmental responsibility in commercial artificial settings for lifestyle sports. Leis. Stud. 2013, 32, 173–190. [Google Scholar] [CrossRef]
  18. Frey, N.; George, R. Responsible tourism management: The missing link between business owners’ attitudes and behaviour in the Cape Town tourism industry. Tour. Manag. 2010, 31, 621–628. [Google Scholar] [CrossRef]
  19. Jamrozy, U. Marketing of tourism: A paradigm shift toward sustainability. Int. J. Cult. Tour. Hosp. Res. 2007, 1, 117–130. [Google Scholar] [CrossRef]
  20. Lee, T.H.; Jan, F.H.; Yang, C.C. Conceptualizing and measuring environmentally responsible behaviors from the perspective of community-based tourists. Tour. Manag. 2013, 36, 454–468. [Google Scholar] [CrossRef]
  21. Erkuş-Öztürk, H.; Eraydın, A. Environmental governance for sustainable tourism development: Collaborative networks and organisation building in the Antalya tourism region. Tour. Manag. 2010, 31, 113–124. [Google Scholar] [CrossRef]
  22. Lee, C.K.; Song, H.J.; Lee, H.M.; Lee, S.; Bernhard, B.J. The impact of CSR on casino employees’ organizational trust, job satisfaction, and customer orientation: An empirical examination of responsible gambling strategies. Int. J. Hosp. Manag. 2013, 33, 406–415. [Google Scholar] [CrossRef]
  23. Porter, M.; Kramer, M.R. Strategy & Society: The link between competitive advantage and corporate social responsibility. Har. Bus. Rev. 2006, 84, 78–92. [Google Scholar]
  24. Kim, J.S.; Song, H.J.; Lee, C.K. Effects of corporate social responsibility and internal marketing on organizational commitment and turnover intentions. Int. J. Hosp. Manag. 2016, 55, 25–32. [Google Scholar] [CrossRef]
  25. Song, H.J.; Lee, H.M.; Lee, C.K. Investigating the role of responsible gambling strategy in perspective of employees. Int. J. Tour. Sci. 2012, 12, 107–126. [Google Scholar] [CrossRef]
  26. Kitchin, T. Corporate social responsibility: A brand explanation. J. Brand Manag. 2003, 10, 312–326. [Google Scholar] [CrossRef]
  27. Welford, R. Can CSR Help Rescue the Gambling Industry? 2008. Available online: http://www.csr-asia.com/weekly_news_detail.php?id=11471 (accessed on 30 June 2016).
  28. Massachusetts Gaming Commission. Responsible Gaming Framework. 2010. Available online: http://massgaming.com/wp-content/uploads/Responsible-Gaming-Framework-v1-10-31-14.pdf (accessed on 30 June 2016).
  29. Griffiths, M.; Hayer, T.; Meyer, G. Problem gambling: A European perspective. In Problem Gambling in Europe: Challenges, Prevention, and Interventions; Springer: New York, NY, USA, 2009. [Google Scholar]
  30. Hing, N. The efficacy of responsible gambling measures in NSW clubs: The gamblers’ perspective. Gambl. Res. 2004, 16, 32–46. [Google Scholar]
  31. Monaghan, S. Responsible gambling strategies for Internet gambling: The theoretical and empirical base of using pop-up messages to encourage self-awareness. Comput. Hum. Behav. 2009, 25, 202–207. [Google Scholar] [CrossRef]
  32. Blaszczynski, A.; Collins, P.; Fong, D.; Ladouceur, R.; Nower, L.; Shaffer, H.J.; Tavares, H.; Venisse, J.L. Responsible gambling: General principles and minimal requirements. J. Gambl. Stud. 2011, 27, 565–573. [Google Scholar] [CrossRef] [PubMed]
  33. Lee, S.; Park, S.Y. Do socially responsible activities help hotels and casinos achieve their financial goals? Int. J. Hosp. Manag. 2009, 28, 105–112. [Google Scholar] [CrossRef]
  34. Lee, C.K.; Kang, S.K.; Long, P.; Reisinger, Y. Residents’ perceptions of casino impacts: A comparative study. Tour. Manag. 2010, 31, 189–201. [Google Scholar] [CrossRef]
  35. Wan, Y.K.P. Exploratory assessment of the Macao casino dealers’ job perceptions. Int. J. Hosp. Manag. 2010, 29, 62–71. [Google Scholar] [CrossRef]
  36. Carroll, A.B. Ethical challenges for business in the new millennium: Corporate social responsibility and models of management morality. Bus. Ethics Q. 2000, 10, 33–42. [Google Scholar] [CrossRef]
  37. Waddock, S.A.; Graves, S.B. The corporate social performance-financial performance link. Strateg. Manag. J. 1997, 18, 303–319. [Google Scholar] [CrossRef]
  38. Turker, D. Measuring corporate social responsibility: A scale development study. J. Bus. Ethics 2009, 85, 411–427. [Google Scholar] [CrossRef]
  39. Wolfe, R.; Aupperle, K. Introduction to Corporate Social Performance: Methods for Evaluating an Elusive Construct. In Research in Corporate Social Performance and Policy; Post, J.E., Ed.; Elsevier Science & Technology Books: Amsterdam, The Netherlands, 1991; pp. 265–268. [Google Scholar]
  40. Tewari, R. Communicating corporate social responsibility in annual reports: A comparative study of Indian companies & multi-national corporations. J. Manag. Public Policy 2011, 2, 22. [Google Scholar]
  41. Abbott, W.F.; Monsen, R.J. On the measurement of corporate social responsibility: Self-reported disclosures as a method of measuring corporate social involvement. Acad. Manag. J. 1979, 22, 501–515. [Google Scholar] [CrossRef]
  42. De los Salmones, M.D.M.G.; Crespo, A.H.; del Bosque, I.R. Influence of corporate social responsibility on loyalty and valuation of services. J. Bus. Ethics 2005, 61, 369–385. [Google Scholar] [CrossRef]
  43. Maignan, I. Consumers’ perceptions of corporate social responsibilities: A cross-cultural comparison. J. Bus. Ethics 2001, 30, 57–72. [Google Scholar] [CrossRef]
  44. Golob, U.; Lah, M.; Jančič, Z. Value orientations and consumer expectations of corporate social responsibility. J. Mark. Commun. 2008, 14, 83–96. [Google Scholar] [CrossRef]
  45. Gray, R.; Kouhy, R.; Lavers, S. Corporate social and environmental reporting: A review of the literature and a longitudinal study of UK disclosure. Acc. Audit. Account. J. 1995, 8, 47–77. [Google Scholar] [CrossRef]
  46. Luo, J.M.; Lam, C.F.; Li, X.; Shen, H.W. Corporate Social Responsibility in Macau’s Gambling Industry. J. Qual. Assur. Hosp. Tour. 2016, 17, 237–256. [Google Scholar] [CrossRef]
  47. McGuire, J.B.; Sundgren, A.; Schneeweis, T. Corporate social responsibility and firm financial performance. Acad. Manag. J. 1988, 31, 854–872. [Google Scholar] [CrossRef]
  48. Aupperle, K.E. An empirical measure of corporate social orientation. Res. Corp. Soc. Perform. Policy 1984, 6, 27–54. [Google Scholar]
  49. Carroll, A.B. A three-dimensional conceptual model of corporate performance. Acad. Manag. Rev. 1979, 4, 497–505. [Google Scholar]
  50. Maignan, I.; Ferrell, O.C. Measuring Corporate Citizenship in Two Countries: The Case of the United States and France. J. Bus. Ethics 2000, 23, 283–297. [Google Scholar] [CrossRef]
  51. Pérez, A.; Del Bosque, I.R. Measuring CSR image: Three studies to develop and to validate a reliable measurement tool. J. Bus. Ethics 2013, 118, 265–286. [Google Scholar] [CrossRef]
  52. Peterson, D.K. The relationship between perceptions of corporate citizenship and organizational commitment. Bus. Soc. 2004, 43, 296–319. [Google Scholar] [CrossRef]
  53. Freeman, R.E. Strategic Management: A Stakeholder Perspective; Pitman: Boston, MA, USA, 1984. [Google Scholar]
  54. Savage, G.T.; Nix, T.W.; Whitehead, C.J.; Blair, J.D. Strategies for assessing and managing organizational stakeholders. Executive 1991, 5, 61–75. [Google Scholar] [CrossRef]
  55. Atkinson, A.A.; Waterhouse, J.H.; Wells, R.B. A stakeholder approach to strategic performance measurement. MIT Sloan Manag. Rev. 1997. Available online: https://search.proquest.com/openview/6938632d1a8049e1bb07bc5534ffde20/1?pq origsite=gscholar&cbl=1817083 (accessed on 20 May 2016).
  56. Kaler, J. Morality and strategy in stakeholder identification. J. Bus. Ethics 2002, 39, 91–100. [Google Scholar] [CrossRef]
  57. Mitchell, R.K.; Agle, B.R.; Wood, D.J. Toward a theory of stakeholder identification and salience: Defining the principle of who and what really counts. Acad. Manag. Rev. 1997, 22, 853–886. [Google Scholar]
  58. Clarkson, M.E. A stakeholder framework for analyzing and evaluating corporate social performance. Acad. Manag. Rev. 1995, 20, 92–117. [Google Scholar]
  59. Boal, K.B.; Peery, N. The cognitive structure of corporate social responsibility. J. Manag. 1985, 11, 71–82. [Google Scholar] [CrossRef]
  60. Fatma, M.; Rahman, Z.; Khan, I. Multi-item stakeholder based scale to measure CSR in the banking industry. Int. Strateg. Manag. Rev. 2014, 2, 9–20. [Google Scholar] [CrossRef]
  61. Coupland, C. Corporate social and environmental responsibility in web-based reports: Currency in the banking sector? Crit. Perspect. Acc. 2006, 17, 865–881. [Google Scholar] [CrossRef]
  62. Sallyanne Decker, O. Corporate social responsibility and structural change in financial services. Manag. Audit. J. 2004, 19, 712–728. [Google Scholar] [CrossRef]
  63. Berman, S.L.; Wicks, A.C.; Kotha, S.; Jones, T.M. Does stakeholder orientation matter? The relationship between stakeholder management models and firm financial performance. Acad. Manag. J. 1999, 42, 488–506. [Google Scholar] [CrossRef]
  64. Tiras, S.; Ruf, B.; Brown, R. The Relation between Stakeholders’ Implicit Claims and Firm Value. 1998. Available online: https://papers.ssrn.com/sol3/papers.cfm?abstract_id=141342 (accessed on 1 November 2017).
  65. Porter, M.E. Competitive Strategy: Techniques for Analyzing Industries and Competitors; Free Press: New York, NY, USA, 1980. [Google Scholar]
  66. Svendsen, A. The Stakeholder Strategy: Profiting from Collaborative Business Relationships; Berrett-Koehler Publishers: Oakland, CA, USA, 1998. [Google Scholar]
  67. Tirole, J. Corporate Governance. Econometrics 2001, 69, 1–35. [Google Scholar] [CrossRef]
  68. Szopik-Depczyńska, K.; Cheba, K.; Bąk, I.; Kiba-Janiak, M.; Saniuk, S.; Dembińska, I.; Ioppolo, G. The application of relative taxonomy to the study ofdisproportions in the area of sustainable development of the European Union. Land Use Policy. 2017, 68, 481–491. [Google Scholar] [CrossRef]
  69. Arbolino, R.; Carlucci, F.; Cirà, A.; Ioppolo, G.; Yigitcanlar, T. Efficiency of the EU regulationon greenhouse gas emissions in Italy: The hierarchical cluster analysis approach. Ecol. Indicat. 2017, 81, 115–123. [Google Scholar] [CrossRef]
  70. Churchill, G.A., Jr. A paradigm for developing better measures of marketing constructs. J. Mark. Res. 1979, 16, 64–73. [Google Scholar] [CrossRef]
  71. Glaser, B.G.; Strauss, A.L. The Discovery of Grounded Theory: Strategies for Qualitative Research; Transaction Publishers: Piscataway, NJ, USA, 2009. [Google Scholar]
  72. Mercer, J.J. Corporate Social Responsibility and Its Importance to Consumers; Claremont Graduate University: Claremont, CA, USA, 2003. [Google Scholar]
  73. Pomering, A.; Dolnicar, S. Assessing the prerequisite of successful CSR implementation: Are consumers aware of CSR initiatives? J. Bus. Ethics 2009, 85, 285–301. [Google Scholar] [CrossRef]
  74. Maignan, I.; Ferrell, O.C. Corporate citizenship as a marketing instrument-Concepts, evidence and research directions. Eur. J. Mark. 2001, 35, 457–484. [Google Scholar] [CrossRef]
  75. Martínez, P.; Pérez, A.; Del Bosque, I.R. Exploring the role of CSR in the organizational identity of hospitality companies: A case from the Spanish tourism industry. J. Bus. Ethics 2014, 124, 47–66. [Google Scholar] [CrossRef]
  76. Zeng, S.X.; Meng, X.H.; Yin, H.T.; Tam, C.M.; Sun, L. Impact of cleaner production on business performance. J. Clean. Prod. 2010, 18, 975–983. [Google Scholar] [CrossRef]
  77. Campbell, D.T.; Fiske, D.W. Convergent and discriminant validation by the multitrait-multimethod matrix. Psychol. Bull. 1959. Available online: http://psycnet.apa.org/record/1960-00103-001 (accessed on 30 June 2016).
  78. Anderson, J.C.; Gerbing, D.W. Structural equation modeling in practice: A review and recommended two-step approach. Psychol. Bull. 1988. Available online: http://psycnet.apa.org/record/1989-14190-001 (accessed on 30 June 2016).
  79. Hair, J.F.; Black, W.C.; Babin, B.J.; Anderson, R.E. Multivariate Data Analysis, 7th ed.; Pearson Prentice Hall: Upper Saddle River, NJ, USA, 2010. [Google Scholar]
  80. Marcoulides, G.A.; Schumacker, R.E. Advanced Structural Equation Modeling: Issues and Techniques; Psychology Press: New York, NY, USA, 2013. [Google Scholar]
  81. Bentler, P.M. EQS 6 Structural Equations Program Manual; BMDP Statistic Software: Los Angeles, CA, USA, 1989; pp. 86–102. [Google Scholar]
  82. Bentler, P.M.; Bonett, D.G. Significance tests and goodness of fit in the analysis of covariance structures. Psychol. Bull. 1980. Available online: http://psycnet.apa.org/record/1981-06898-001 (accessed on 30 June 2016).
  83. Cronbach, L.J. Coefficient alpha and the internal structure of tests. Psychometrika 1951, 16, 297–334. [Google Scholar] [CrossRef]
  84. Fornell, C.; Larcker, D.F. Structural equation models with unobservable variables and measurement error: Algebra and statistics. J. Mark. Res. 1981, 18, 382–388. [Google Scholar] [CrossRef]
  85. Chau, P.Y. Reexamining a model for evaluating information center success using a structural equation modeling approach. Decis. Sci. 1997, 28, 309–334. [Google Scholar] [CrossRef]
  86. Steenkamp, J.B.E.; Van Trijp, H.C. The use of LISREL in validating marketing constructs. Int. J. Res. Mark. 1991, 8, 283–299. [Google Scholar] [CrossRef]
  87. Kline, R.B. Principles and Practice of Structural Equation Modeling; Guilford Publications: New York, NY, USA, 2015. [Google Scholar]
  88. Song, H.J.; Lee, H.M.; Lee, C.K.; Song, S.J. The Role of CSR and Responsible Gambling in Casino Employees’ Organizational Commitment, Job Satisfaction, and Customer Orientation. Asia Pac. J. Tour. Res. 2015, 20, 455–471. [Google Scholar] [CrossRef]
Figure 1. Tax Revenue from Gaming in Macau. (Sources: Macao Statistics and Census Bureau (DSEC), 2016) [2].
Sustainability 09 02012 g001
Figure 2. Proposed CSR Dimensions in Gaming Industry.
Sustainability 09 02012 g002
Figure 3. Churchill’s (1979) [70] measurement scale development procedures.
Sustainability 09 02012 g003
Table 1. Corporate social responsibility measurement scale.
Ident.DimensionItemReferences
EMPL1EmployeeOur company provides good conditions for personal development of employees in many aspects.[38]
EMPL2EmployeeOur company managers consider employees’ needs and wants in their decision making[38]
EMPL3EmployeeOur company tries to make fair decisions about and for the employees[59,72]
EMPL4EmployeeOur company tries to provide a work and life condition for its employees better than before.[38]
EMPL5EmployeeOur company offers training and carrier opportunities to its employees[59,72]
EMPL6EmployeeOur company cares about employees’ psychological problems[46]
CUST1CustomerOur company establishes procedures to comply with customers complains[60,62,72]
CUST2CustomerOur company treats its customers honestly[60,72]
CUST3CustomerOur company makes an effort to know the customer needs[60,72]
CUST4CustomerOur company structures policies for customer safety and confidentiality[60,73]
SHAR1ShareholderOur company tries to ensure its survival and long term success[72,74]
SHAR2ShareholderOur company keeps a strict control over its cost[72,74]
SHAR3ShareholderOur company concerns to fulfill its obligation via a visit of our shareholders[60,72,74]
ENV1EnvironmentOur company reduces its consumption of natural resources[75]
ENV2EnvironmentOur company tries to minimize its unfavorable and damaging effects on the natural environment.[75]
ENV3EnvironmentOur company exploits renewable energy in a productive process compatible with the environment[75]
COM1CommunityOur company plays a role in society that goes mere beyond profit generation[60,74]
COM2CommunityOur company targets sustainable development and creation of a better life for future generations[38]
COM3CommunityOur company cares about public psychological problems[46]
GOV1GovernmentOur company complies with legal regulations completely and promptly[38]
GOV2GovernmentOur company always pays its taxes and other duties regularly and completely[38]
GOV3GovernmentOur company tries to act on the basis of local and global legal regulations.[38]
GOV4GovernmentOur company promotes the responsible gambling with the regulation[46]
Table 2. The demographic profile of respondents.
Frequency (N = 306)%
GenderMale15952.0
Female14748.0
Age21–2914447.1
30–3911136.3
40–493411.1
50–59123.9
60 or above51.6
EducationSecondary/high school or below9932.4
Diploma3310.8
Degree15751.3
Master or above175.6
Gambling OperatorWynn4815.7
SJM5518.0
Galaxy5317.3
Sands4916.0
MGM4615.0
Melco5518.0
PositionGeneral staff18259.5
Supervisor6922.5
Assistant Manager258.2
Manager237.5
Senior Manager72.3
Working Experience3 or below10735.0
4–912239.9
10–196019.6
20 or above175.6
Table 3. First order CFA results for CSR dimensions in gaming industry.
Latent VariableMeasured VariableStandardized LambdaR2Cronbach’s aAVEGoodness of Fit
EmployeeEMPL10.7160.5130.8550.495X2 = 487.419 (p = 0.000)
EMPL20.7070.500
EMPL30.710.504
EMPL40.6980.487
EMPL50.6980.487
EMPL60.6940.482
GovernmentGOV10.7540.5690.8690.624GFI = 0.880
GOV20.830.689CFI = 0.919
GOV30.8570.734
GOV40.7110.506
CustomerCUST10.6170.3810.7970.498NFI = 0.863
CUST20.6670.445
CUST30.8040.646
CUST40.7220.521
ShareholderSHAR10.7780.6050.7850.591IFI = 0.920
SHAR20.7290.531
SHAR30.6120.375NNFI = 0.905
EnvironmentENV10.6890.4750.8280.619
ENV20.8830.780
ENV30.7760.602
CommunityCOM10.6420.4120.7920.562RMSEA = 0.064
COM20.8290.687
COM30.7660.587
Table 4. Discriminate validity for first order CFA in gaming industry.
Number of ItemsEmployeeCustomerShareholderEnvironmentCommunityGovernment
Employee60.415
Customer40.2060.279
Shareholder30.1740.2550.477
Environment30.2410.1600.1480.401
Community30.2450.0950.0440.2010.313
Government40.2110.2430.3180.1890.1150.433
Table 5. Second order CFA results for CSR dimensions.
Factor LoadingsGoodness of Fit
Employee(0.684–0.711)X2 = 623.112 (p = 0.000)
Customer(0.622–0.795)GFI = 0.835
Shareholder(0.633–0.781)CFI = 0.882
Environment(0.690–0.882)NFI = 0.828
Community(0.667–0.818)NNFI = 0.866
Government(0.717–0.856)RMSEA = 0.076
Table 6. Mean test of the ratings of each factor of the CSR measurement scale.
Ident.MeanSDRank
SHAR23.790.931
GOV43.710.882
SHAR13.670.893
CUST43.640.864
CUST33.620.885
SHAR33.590.776
GOV23.560.917
GOV33.540.878
CUST23.520.849
GOV13.460.8810
CUST13.400.8611
ENV23.390.9112
ENV13.340.9213
EMPL53.340.8914
ENV33.280.8915
EMPL43.270.8716
COM13.240.8717
EMPL13.230.9018
EMPL33.170.8219
EMPL63.160.9120
EMPL23.140.8421
COM23.110.9222
COM33.090.9423
Table 7. Mean test of the ratings of the CSR dimensions.
DimensionMeanSDRank
Shareholder3.690.711
Government3.570.752
Customer3.540.683
Environment3.340.784
Employee3.220.665
Community3.150.766

