Binary Component Sorption of Cadmium, and Copper Ions onto Yangtze River Sediments with Different Particle Sizes

1
Chongqing Engineering Laboratory of Environmental Hydraulic Engineering, Chongqing Municipal Development and Reform Commission, Chongqing Jiaotong University, Chongqing 400074, China
2
College of Resources and Environment, Southwest University, Chongqing 400715, China
*
Author to whom correspondence should be addressed.
Sustainability 2017, 9(11), 2089; https://doi.org/10.3390/su9112089
Submission received: 3 October 2017
/
Revised: 8 November 2017
/
Accepted: 10 November 2017
/
Published: 14 November 2017
(This article belongs to the Section Environmental Sustainability and Applications)
Abstract
:Sorption is a crucial process that influences immobilization and migration of heavy metals in an aqueous environment. Sediments represent one of the ultimate sinks for heavy metals discharged into water body. Moreover, the particle size of sediments plays an extremely important role in the immobilization of heavy metals. In this study, the sorption and desorption of cadmium (Cd) and copper (Cu) onto sediments with different particle sizes were investigated to predict the rate and capacity of sorption, to understand their environmental behaviors in an aqueous environment. Batch sorption and kinetic experiments were conducted to obtain the retained amount and rate of Cd and Cu in a binary system. Experimental data were simulated using sorption models to ascertain the sorption capacity and the kinetic rate. Results of European Communities Bureau of Reference (BCR) sequential extraction showed the highest concentration of Cd (0.344 mg kg−1), and its distribution varied with sediment particle size and site. Furthermore, most of Cu (approximately 57% to 84%) existed as a residual fraction. The sorption of Cu onto six sediments followed a pseudo-first order reaction, whereas that of Cd followed a pseudo-second order reaction. Additionally, the competitive Langmuir model fitted the batch sorption experimental data extremely well. The highest sorption capacities of Cd and Cu reach 0.641 mmol kg−1 and 62.3 mmol kg−1, respectively, on the smallest submerged sediment particles. The amounts of Cu and Cd desorbed (mmol kg−1) increased linearly with the initial concentration increasing. Thus, sediment texture is an important factor that influences the sorption of heavy metal onto sediments.
1. Introduction
The pollution of aquatic and terrestrial environments by heavy metals has become a matter of great concern in recent years. Mining, smelting, industrial activities and traffic activities are primary sources of heavy metal pollution [1,2,3]. Series of physical, chemical and biological reactions, such as sorption–desorption [4], ion exchanges, complexation [5], oxidation–reduction [6], precipitation [7], and bioaccumulation [8], will occur, once heavy metal enters water bodies. The sorption of heavy metals onto suspended and riverbed sediments can reduce their concentration in aquatic systems, whereas desorption can lead to secondary heavy metal pollution [9,10]. Thus, sorption and desorption of heavy metals on sediments play extremely important roles in influencing water quality to a considerable extent [11]. Some studies indicate that most Cd and Cu discharged into water bodies are fixed onto sediments [12,13]. Sediments are typically mixtures of silt, clay, hydrous iron and manganese oxides and organic matters (OMs) [14,15]. Sediments represent one of the ultimate sinks for heavy metals discharged into water bodies [13]. To determine the concentrations of Cd and Cu in sediments and to protect aquatic life communities, many researchers have conducted significant works that have identified and assessed the severity of sediment contamination. Meanwhile, Cu can be deposited into the brain, skin, liver, pancreas and myocardium, thereby causing serious toxicological effects in humans and animals [16,17]. Turki [18] investigated the risk of heavy metals in sediments from the Red Sea coast, and found that approximately 30% to 45% of Cd existed as exchangeable and carbonate bound fractions and classified under the high risk category, which could easily enter the food chain. Loska and Wiechula [19] analyzed the bottom sediments from the Rybnik reservoir (in southwestern Poland), and found the concentrations of Cd and Cu in the sediments reached 25.8 mg kg−1 and 451 mg kg−1, respectively. BCR-sequential extraction technique was used to determine the distribution of heavy metals in the sediments and the forms of heavy metals were found to vary with sample sites [20]. Jiao et al. [21] studied metal pollution based on sediment quality guidelines (SQGs), the potential eco-logical risk index (PERI) and the geoaccumulation index (Igeo) of metals (mercury (Hg), chromium (Cr), Cd, arsenic (As), lead (Pb) and Cu) in the sediments of Xiaoqing River in Jinan, China from 1996 to 2014, and found that Cd was the second contributor in PERI. Zhang et al. [22] analyzed heavy metals (Cd, Cr, Cu, manganese (Mn), nickel (Ni), Pb and zinc (Zn)) in the sediments from the intertidal zone of Yangtze River. Their research indicated that metal concentrations exhibit significant spatial variations, and the concentrations of Cd, Cr and Ni are above the background values of the study area. In general, Cd and Cu contamination have attracted attention in the environmental field.
In addition, the sorption characteristics of Cd and Cu on sediments should be investigated, because sorption–desorption is extremely important process in the heavy metal geochemical cycle. Nevertheless, existing research on sorption of Cd and Cu has focused on wastewater treatment, and several mineral and biomass materials have been used to fix and reduce the concentrations of Cd and Cu in water [23,24,25,26,27]. Only a few studies have been conducted on sorption of Cd and Cu onto sediments. Jain and Sharma [13] examined the adsorption characteristics of Cd on the bed sediments of Hindon River in western Uttar Pradesh (India), and pH was determined as the most important factor in Cd adsorption. Moreover, iron (Fe) and manganese oxide also played important roles in the adsorption process. Oh et al. [28] investigated the single-solute and bi-solute competitive sorption of Pb and Cd onto sediments and found that modified Langmuir model favorably predicted Pb sorption in bi-solute competitive sorption but not Cd sorption. In general, studies on Cd and Cu sorption properties have focused on sediment component and environmental factors. However, the particle size of sediments can significantly influence the sorption process.
In this paper, BCR-SEP was used to understand the distribution of heavy metals in sediments with different particle sizes. Batch and kinetic sorption experiments of Cu and Cd were conducted to explore the sorption characteristics of sediments and determine the influence of particle size. Moreover, the competitive Langmuir sorption model is used to describe the sorption characteristics of Cd and Cu in binary sorption system. This information will be useful in understanding the environmental behavior of Cd and Cu and supporting strategies to control water pollution.
2. Materials and Methods
2.1. Sediment Samples and Characterization
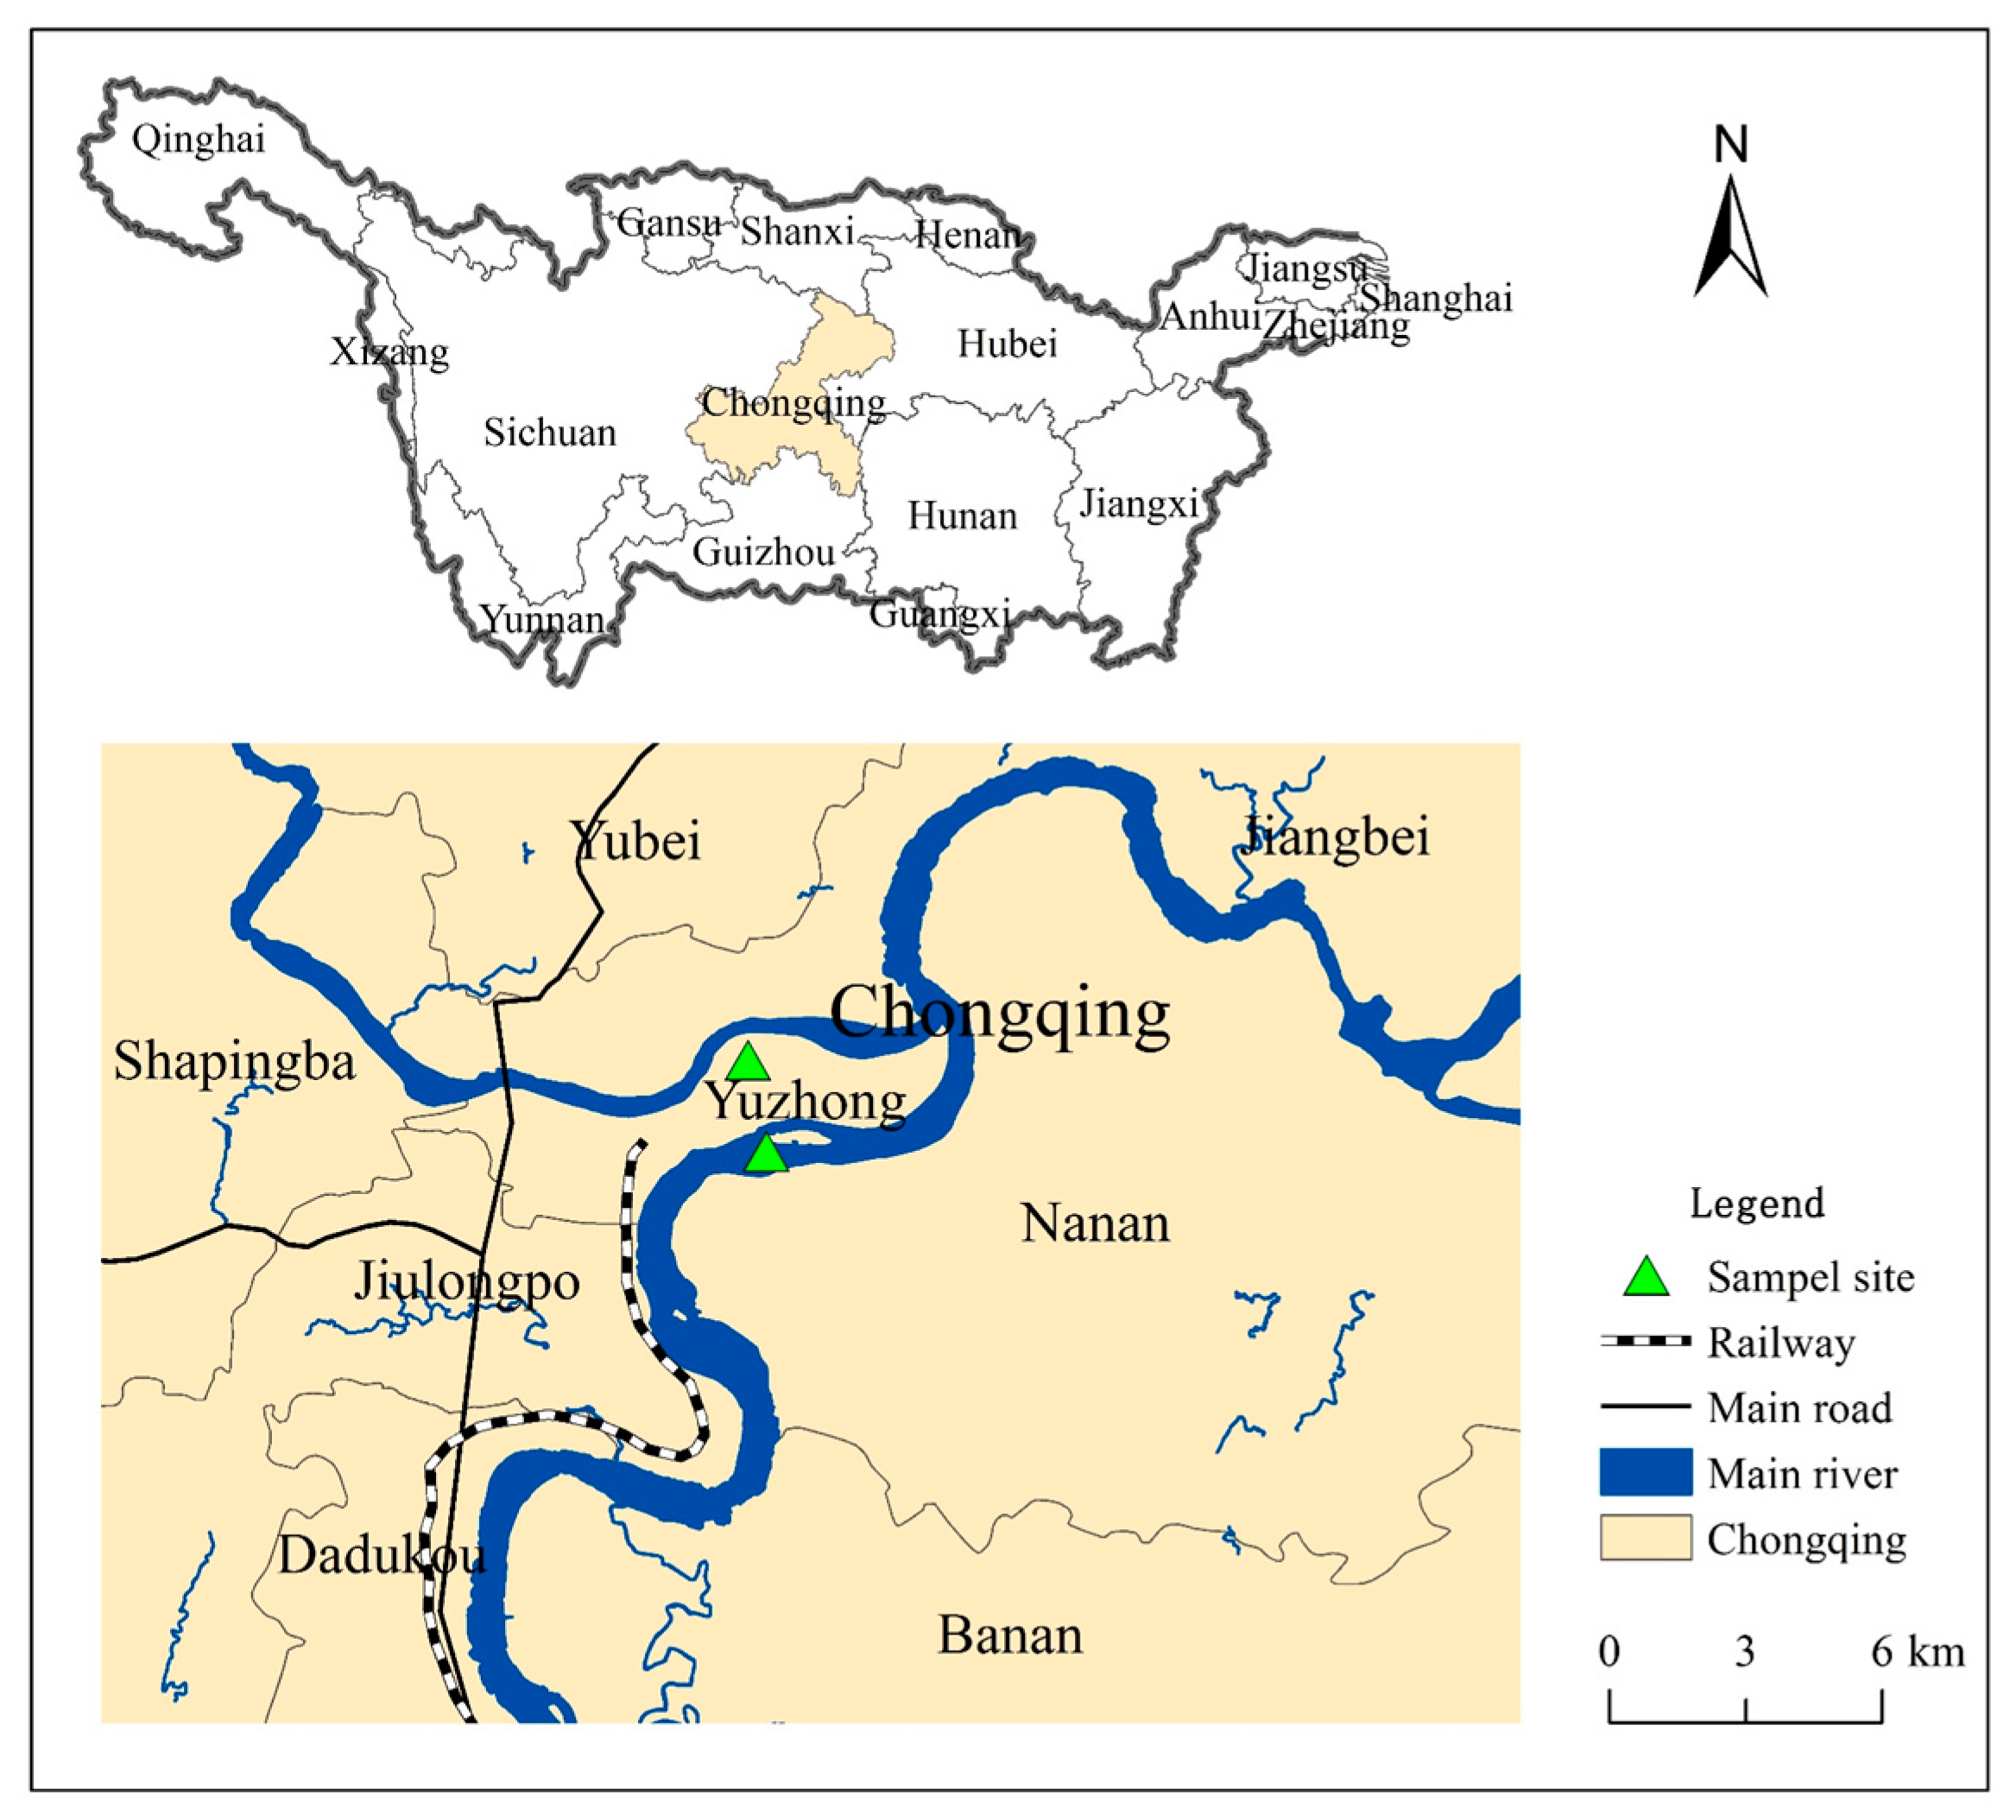
The sediment samples were collected from Yangtze River (China), and located in Chongqing urban area (106°32′E, 29°32′N), as shown in Figure 1. Yangtze River is the longest river in Asia and the third longest in the world. The weather in Chongqing is mainly controlled by a humid subtropical monsoon climate, and annual average temperature, precipitation and ambient relative humidity are 16–18 °C, 1000–1350 mm, and 70–80%, respectively. In October 2016, the riparian and submerged surface sediments were collected from two sites. At each riparian site, three repeated samples were collected using a plastic shovel. At each submerged site, three sediment samples are collected using a gravity sediment core sampler (length: 100 cm; diameter: 6 cm), and samples were saved in plastic sheets directly after extruded. All the samples were kept at 4 °C over night before being air-dried.
Some physicochemical characteristics were determined after sediment samples were air-dried, homogenized and ground to pass through a 0.850 mm nylon fiber sieve. The pH values were measured with a commercial glass electrode (REX, pHS-3B) under the condition that the ratio of water (deionized water with CO2 removed) and sediments was 2.5. OM content was determined via potassium dichromate oxidation method [29]. All the sediment samples were ground to pass through 0.850, 0.150, 0.0750 mm nylon fiber sieves to determine heavy metals contents and conduct sorption–desorption experiments. Meanwhile, sediment particle size and specific surface area were analyzed using an LS 230 laser diffraction particle analyzer (Hydro 2000 MU). Table 1 lists the characteristics of sediment.
2.2. Sample Extraction and Analysis
The chemical speciation of Cu and Cd in the sediment samples was determined using BCR–SEP [30]. The detailed extraction steps are as follows: (1) Exchangeable: Sediment sample (2.0 g) was weighted into 100 mL polyethylene centrifuge tubes, mixed with 40 mL 0.11 M ammonium acetate, and continuously agitated for 16 h at room temperature, to obtain the acid-soluble heavy metal fractions. (2) Fe/Mn oxides: The residue from the previous extraction step was subjected to further leaching with 40 mL 0.5 M hydroxylammonium chloride (pH 2) at 25 °C with continuous agitation to receive the metals present in the samples in reducible forms. (3) OM/sulfides: The residue from the second extraction phase reacted with 5 mL 30% H2O2 at 25 °C for 1 h, and then another 5 mL 30% H2O2 was added and digested in a temperature-controlled water bath at 85 °C evaporation. Subsequently, 50 mL of 1 M ammonium acetate (pH 2, adjusted by HNO3) was added and extracted at room temperature for 16 h with continuous agitation. The heavy metals in oxidizable forms were separated in this step. (4) Residual metal forms: The residual fraction was analyzed by digesting the sediments using a mixture of HCl, HClO4, and HNO3 at a ratio of 3:1:1 at 240 °C.
Samples were washed with 10 mL Milli-Q water between wash SEP phase. After continuous agitation, the samples were centrifuged at 6000 rpm. The supernatant liquid was filtered using 0.22 μm cellulose filters before analysis. All the filtrates were decanted into acid washed polyethylene containers and refrigerated prior to analysis. The concentrations of Cu and Cd were determined using atomic absorption spectrometer (AAS, Z-5000, Shimadzu Corporation, Tokyo, Japan). All measurements were repeated in triplicate.
2.3. Sorption and Desorption Experiments
In this study, the submerged and riparian sediment samples from one site (Site 1) were used to study the binary of Cu and Cd sorption characteristics. CuCl2·2H2O and CdCl2·H2O (analytic reagent grade, Sigma) were dissolved to form Cu2+ and Cd2+ stock solutions, which were stored in 250 mL volumetric flasks for the posterior metal adsorption experiments. NaOH (1 M) and HCl (1 M) solution were also used for pH adjustment. All the working standards and initial solutions for the sorption isotherms and kinetic experiments were prepared via serial dilution with deionized water. A batch equilibration method was conducted to study the binary sorption isotherms of Cu2+ and Cd2+. Ionic strength was kept constant at 10 mmol L−1 in all the experiments by adding KCl. For sorption, 1.0 g of each sediment sample was weighted into polyethylene centrifuge tubes and then suspended in 25 mL aqueous solution, which contained the following doses of Cu2+ (0, 10, 20, 40, 60, 80 and 100 mg L−1) and Cd2+ (0, 1, 2, 4, 6, 8 and 10 mg L−1). After conducting shaking reciprocation for 24 h (25 ± 1 °C) and centrifugation at 6000 rpm, the supernatant liquid was filtered using 0.22 μm cellulose filters before analysis. The concentrations of Cu and Cd in the supernatant were determined using AAS. The equilibrium sorption capacity, Qe (mmol kg−1), was calculated using Equation (1):
where C0 and Ce are the initial liquid phase concentrations of Cu/Cd, and at equilibrium (mmol L−1), respectively; Qe is the equilibrium sorption capacity (mmol kg−1); V is the volume of the solution (L); and W is the mass of the adsorbent (g).
Sorption kinetic experiments were conducted to obtain sorption as a function of time. Dynamic contacts were performed in polyethylene centrifuge tubes. For a given reaction time (0–48 h), each sample was collected from one of the tubes, which would not be used again. The initial Cu and Cd concentration in the experiments were 50 mg L−1 and 5 mg L−1, respectively. The amounts of Cu and Cd sorption in the sediments at different times were calculated using Equation (2):
where C0 and Ct are the initial liquid-phase concentrations of Cu and Cd, and equilibrium concentration at time t (mmol L−1), respectively; Qt is the equilibrium sorption capacity at time t (mmol kg−1); V is the volume of the solution (L); and W is the mass of the adsorbent (g).
Desorption experiments were conducted immediately after the adsorption test. Moreover, 20 mL 10 mmol L−1 KCl was added into the centrifuge tubes. Subsequently, shaking reciprocation was performed for 2 h (25 ± 1 °C) and centrifugation at 6000 rpm. The supernatant liquid was filtered using 0.22 μm cellulose filters before analysis. The Cu and Cd in the supernatant were determined as the desorbed Cu and Cd.
2.4. Sorption Models
2.4.1. Sorption Isotherm
Firstly, the interaction between Cu and Cd was disregarded, and the Langmuir equation was used to describe the sorption isotherms. The Langmuir equation is given by Equation (3):
where Ce is the equilibrium concentration of Cu or Cd in the bulk solution (mmol L−1); Q is the equilibrium content in solid phase (mmol kg−1); QM (mmol kg−1) and K (L mmol−1) are the maximum sorption capacity and sorption energy, respectively; QM represents the complete monolayer coverage of the adsorbent with heavy metal; and K represents the enthalpy of sorption, which varies with temperature.
Secondly, the interaction between Cu and Cd was considered, and the binary component isotherm models based on the Langmuir assumption could be used to simultaneously describe Cu and Cd sorption onto sediments. In case of binary component sorption, the sorption reaction can be expressed using two chemical reaction equations, and the total binding sites are the sum of the vacant and occupied sites. Thus, the sorption capacity can be derived as [17,23] Equations (4) and (5):
where QM,Cu and QM,Cd are the maximum sorption capacities; bCu and bCd are the affinity constants of extended Langmuir model; Ce,Cu and Ce,Cd are the equilibrium concentrations; and QCu and QCd are the sorption capacities.
2.4.2. Sorption Kinetics
In sorption kinetics section, pseudo-first order equation, pseudo-second order equation, the Elovich equation and double-constant equation, were used to simulate kinetic data. The kinetic equations can be expressed as follows.
Pseudo-first order:
Pseudo-second order:
The initial adsorption rate, h, is obtained from the intercept in Equation as follows:
Elovich equation:
Double-constant rate:
where Qt is the amount of heavy metal adsorbed (mmol kg−1) at time t (h); Qe is the amount adsorbed (mmol kg−1) at equilibrium time; and a, b, K1, K2, α and K are the sorption constants.
In this study, the fitting of the sorption isotherms and sorption kinetic data, and the calculation of the parameters in all the equations were undertaken via nonlinear regression using Sigmaplot 12.0 (SYSTAT SOFTWARE, San Jose, CA, USA).
2.5. Heavy Metal Distribution Coefficient (Kd)
Kd was used to evaluate Cu and Cd behavior and to measure the affinity with sediments. Higher Kd values mean greater adsorption capacity. In this context, Kd was calculated using Equation (11):
where Kd is the distribution coefficient (L kg−1); Qe is the adsorbed amount (mmol kg−1); and Ce is the equilibrium concentration (mmol L−1) for all initial Cu or Cd concentrations added in the adsorption experiment.
3. Results and Discussion
3.1. Concentration and Distribution of Cu and Cd in Sediments
As shown in Table 1 and Figure 2, the total concentrations of Cu and Cd in sediment particles with different sizes vary with sample sites and sediment properties. The highest concentration of Cd (0.344 mg kg−1) was found in Sample 2-S-S (submerged sediments with the smallest particles), and the lowest content (0.044 mg kg−1) was observed in Sample 1-S-L. The average concentrations of Cd in three particle size sediment from same site ranges from 0.148 to 0.200 mg kg−1, and were lower than the background value (0.25 mg kg−1) [31]. By contrast, Sample 1-S-L exhibited the lowest Cu content (12.5 mg kg−1), and the highest values (27.4 mg kg−1) are found in Sample 1-R-M. All the Cu concentration in the different particle size sediments did not exceed the background value of 35 mg kg−1 in the upstream of Yangtze River [31]. The figure also shows that the content of Cu and Cd are higher in smaller particles than in larger particles. Although the common belief that heavy metals are majorly accumulate in very fine sediment size fractions, Vosoogh et al. [32] investigated several heavy metals content in five different particle size, and their results indicated that the concentration of some metals such as cobalt, vanadium and chromium was greater in the sediments with particle sizes larger than 63 μm. Heavy metal content in sediments with particle sizes could be affected by the characteristic of the sediment.
The distribution of Cd among the four fractions of sediments varied with different sizes (Figure 2). Firstly, the acid-soluble and residual Cd fractions were higher with a smaller particle size in submerged sediments, whereas the reducible Cd fraction was lower with a smaller particle size. In the Sample 1-S (submerged sediments), approximately 11% of the total Cd is found in the acid-soluble fraction in the smallest sediment particles, whereas approximately 26% is found in the largest sediment particles. Secondly, most of the Cd existed as reducible and oxidizable in the largest sediment particles. However, most of the Cd in the acid-soluble and residual fraction was found in the smallest particles. That is, the mobility of Cd in small sediment particles was higher than that in large particles. Meanwhile, small sediment particles are easy to transfer with water when the bodies of water are turbulent. Cd will be released into the water, and the water bodies will be polluted secondarily. By contrast, the residual Cu fraction was found with the greatest proportion (approximately 57% to 84%) in all the samples. The oxidizable Cu fraction (which coincides with organic and sulfur compounds) was higher with smaller sediment particles because of the high contents of organic and sulfur compounds. Cu is easy to complex with OM for the high stability constant of organic Cu compounds. In addition, several studies have stated that a high proportion of Cu in sediments may form part of OMs [20,33].
3.2. Kinetic Sorption of Cu and Cd on Sediments
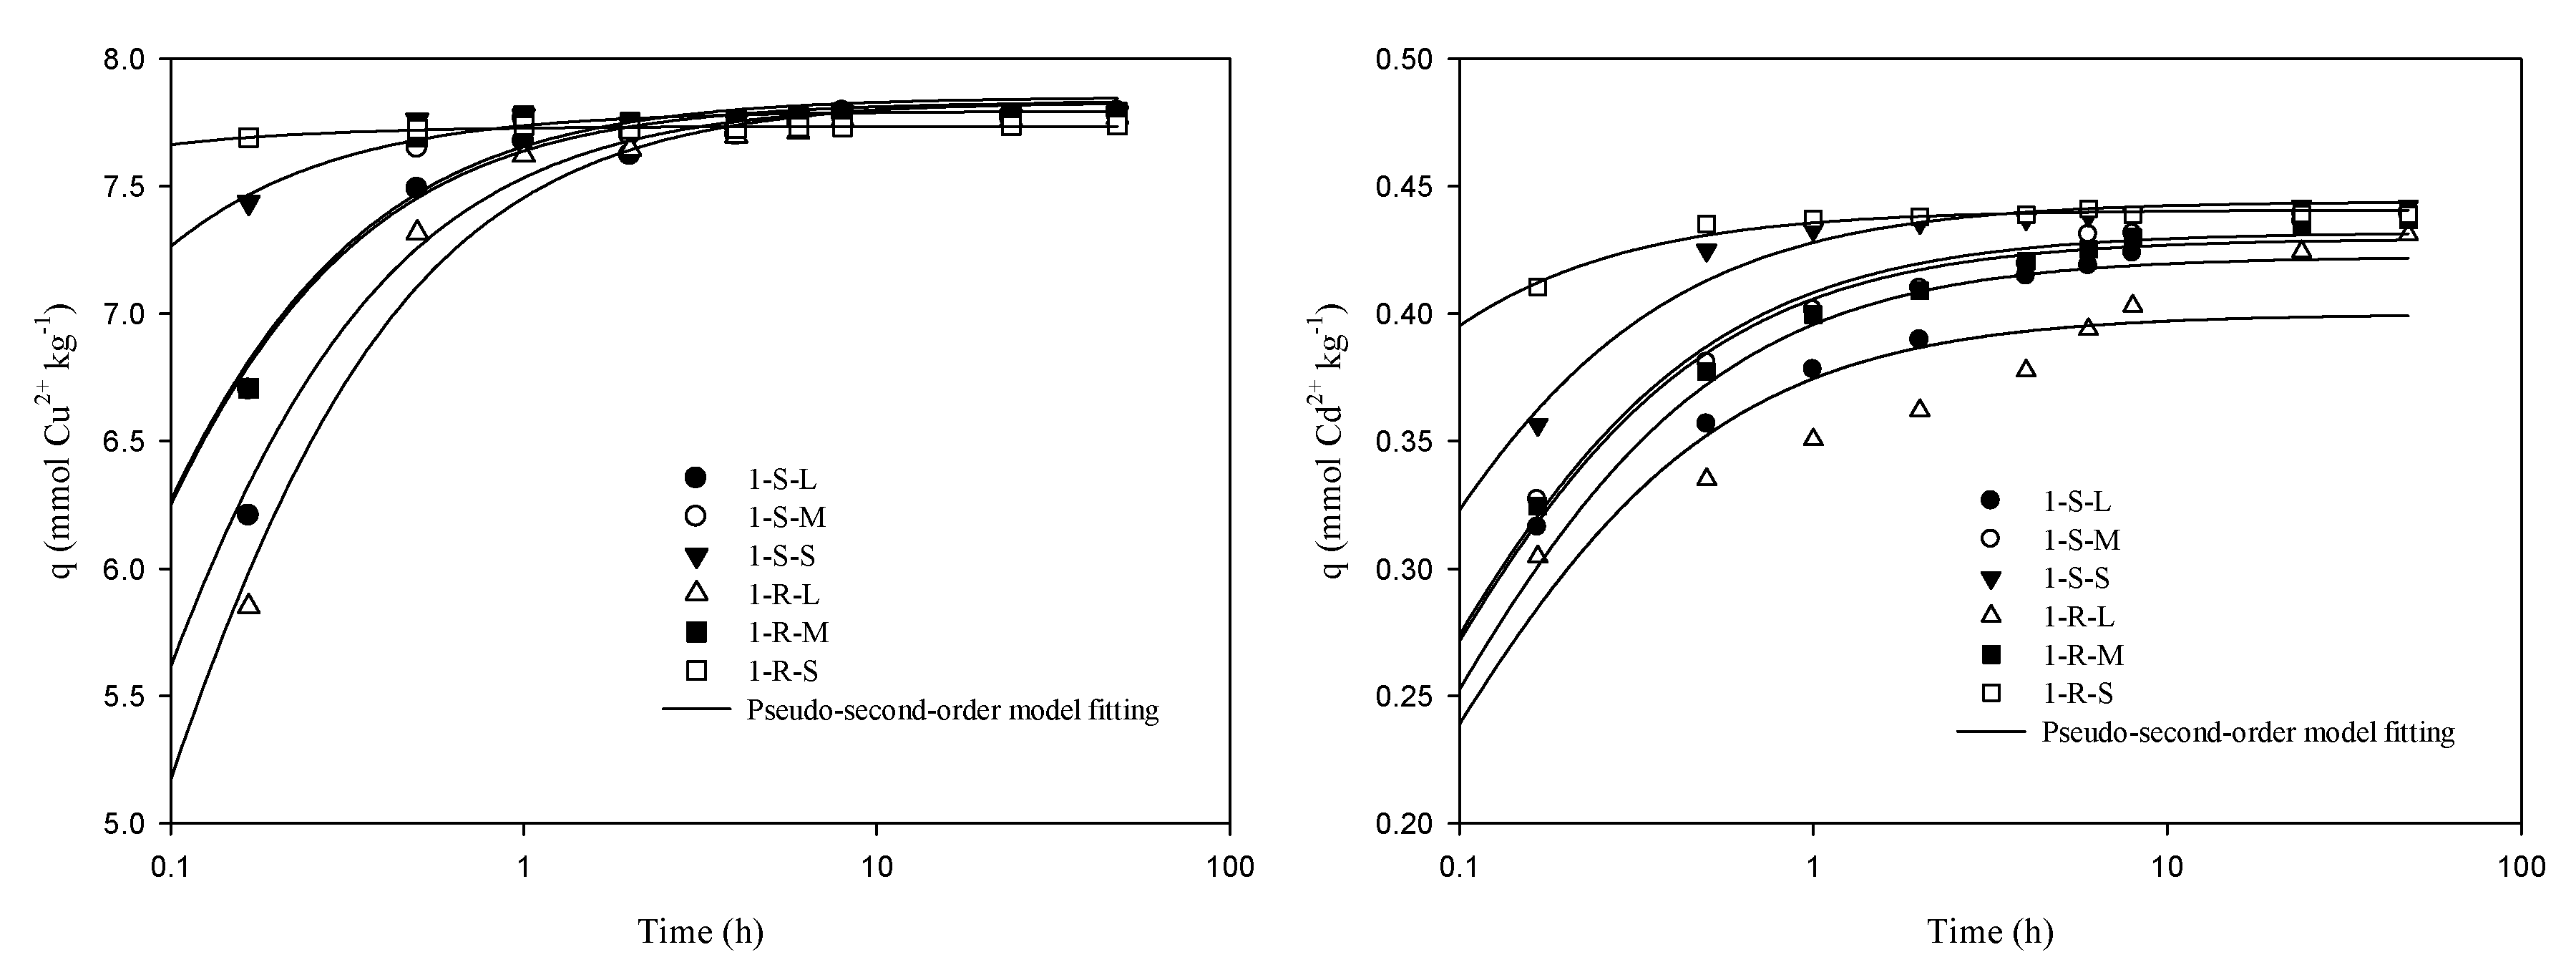
Sorption kinetic experiments and data fitting were conducted to predict the sorption rates of Cu and Cd on sediments with different particle sizes. Figure 3 shows the results of the variation in Cu or Cd sorption onto the sediments with time. The Cu sorption amounts markedly varied among sediments at the Cu2+ initial concentration of 50 mg L−1. The riparian sediment particles with the smallest size (1-R-S) exhibited a higher sorption amount than the others and reached the sorption equilibrium in 1 h. Most of the Cu sorption reaction can reach the sorption equilibrium in 4 h, and submerged and riparian sediments with a smaller particle size have larger sorption capacities. This phenomenon can be due to the different properties of sediments, such as high contents of OM and sulfur compounds in small sediment particles, and Cu can easily combine with these compounds [12]. In addition, smaller particle have a larger special surface and more sorption sites. By contrast, the kinetics of Cd sorption (with 5 mg L−1 Cd initial concentration) is relatively slow, and most of the Cd can reach sorption equilibrium within 10 h. Furthermore, the 1-R-S sediment exhibited the highest sorption amounts and the fastest sorption process among the six sediments.
In this work, four kinetic models, including the pseudo-first order rate equation, the pseudo-second order rate equation, the Elovich equation, and the double-constant rate equation, were applied to fit Cu and Cd kinetic sorption data. The regressed kinetic parameters are given in Table 2. When the double constant rate and Elovich equations were used to describe the Cu sorption process, the determination coefficients (R2) changed within the range of 0.973–0.999 and 0.942–0.974, respectively (Table 2). The pseudo-first order rate and the pseudo-second order rate equation fitted well and properly described the sorption process, and the determination coefficients ranged 0.998–0.999 and 0.998–0.999, respectively (Table 2). Furthermore, the initial sorption rates (h) for Cu obtained from the pseudo-second order rate model differed among the sediments, varying from 152 (Sample 1-R-L) to 8.25 × 10³ (Sample 1-R-S). In addition, the data in Table 2 show that the pseudo-second order rate equation can be used to describe Cd sorption on sediments (R2 range 0.973–0.999), and the initial sorption rates (h) for Cd varied from 5.93 (Sample 1-R-L) to 38.3 (Sample 1-R-S).
In general, model fitting to the experimental data points indicated that the sorption of Cu onto six sediments followed a pseudo-first-order reaction, whereas that of Cd followed a pseudo-second order reaction. The initial Cu and Cd sorption rate of 1-R-S was the fastest among all the sediments because of its higher pH and OM content. Moreover, particle size plays an important role in the sorption of Cu and Cd onto sediments.
3.3. Sorption Isotherms of Cu and Cd on Sediments
Results of the binary sorption of Cu and Cd are shown in Figure 4. The amount of Cu sorption onto sediments increased with Cu equilibrium concentration, except for Sample 1-S-L and Sample 1-R-M. The amount of Cd sorption on Sample 1-S-S and Sample 1-R-S, which are the smallest sediment particles, exhibited an increasing to decreasing trend, thereby reaching the lowest point at the maximum Cd and Cu dosages, and the amount of Cd sorption fluctuated. In addition, the total sorption capacity of Cd and Cu increased with total equilibrium concentration. Moreover, the sorption capacity of Cu or Cd on the sediments with the smallest particle size was greater than that in larger sediment particles.
In addition, the sorption amount of Cd was influenced by Cu equilibrium concentration, which increased with the initial Cd concentration when Cu concentration was low. Nevertheless, the sorption amount of Cd began to decline when the initial Cu concentration reached 40 mg L−1 and 20 mg L−1 for small/middle (Sample 1-S-S, 1-S-M, 1-R-S and 1-R-M) and large (Sample 1-S-L and 1-R-L) sediment particles, respectively. However, the Cd sorption amount increased secondly when the initial Cu concentration reached 100 mg L−1, and the Cu sorption amount dropped for large/middle sediment particles (Figure 4). With regard to the change in the sorption sequence for the lowest and highest added metal concentrations added, some studies have indicated that the maximum adsorption capacities are in the order of Cd > Cu in a mono-metal non-competitive experiment and Cu > Cd in a multi-metal competitive trial [34]. This sequence is coincidental with the reverse order of the hydrated ionic radii of two heavy metal species (Cu2+ and Cd2+), and, thus, space limitations to sorption will be less important when the added metal concentrations are low, because many adsorption sites are still available, whereas the opposite will occur when the added metal concentrations are high.
The Langmuir models were used to fit the experimental data. Table 3 shows several parameters on sorption energy and capacity. The experimental data of Cu sorption fitted well with the Langmuir isotherms, and the determination coefficients exceeded 0.931 for all sediment sorption data. However, Cd sorption data exhibited worse fit with the Langmuir isotherms compared with Cu, and the determination coefficients ranged 0.629 to 0.947 (Table 3). Meanwhile, the relationships with the amount of Cd and Cu sorption and equilibrium concentration agree with the Langmuir mode. The maximum Cu sorption capacity (QM) of the six sediments predicted by the Langmuir equation varied widely ranging from a low value of 17.1 mmol kg−1 on Sample 1-R-L to a high value of 48.2 mmol kg−1 on Sample 1-S-S.
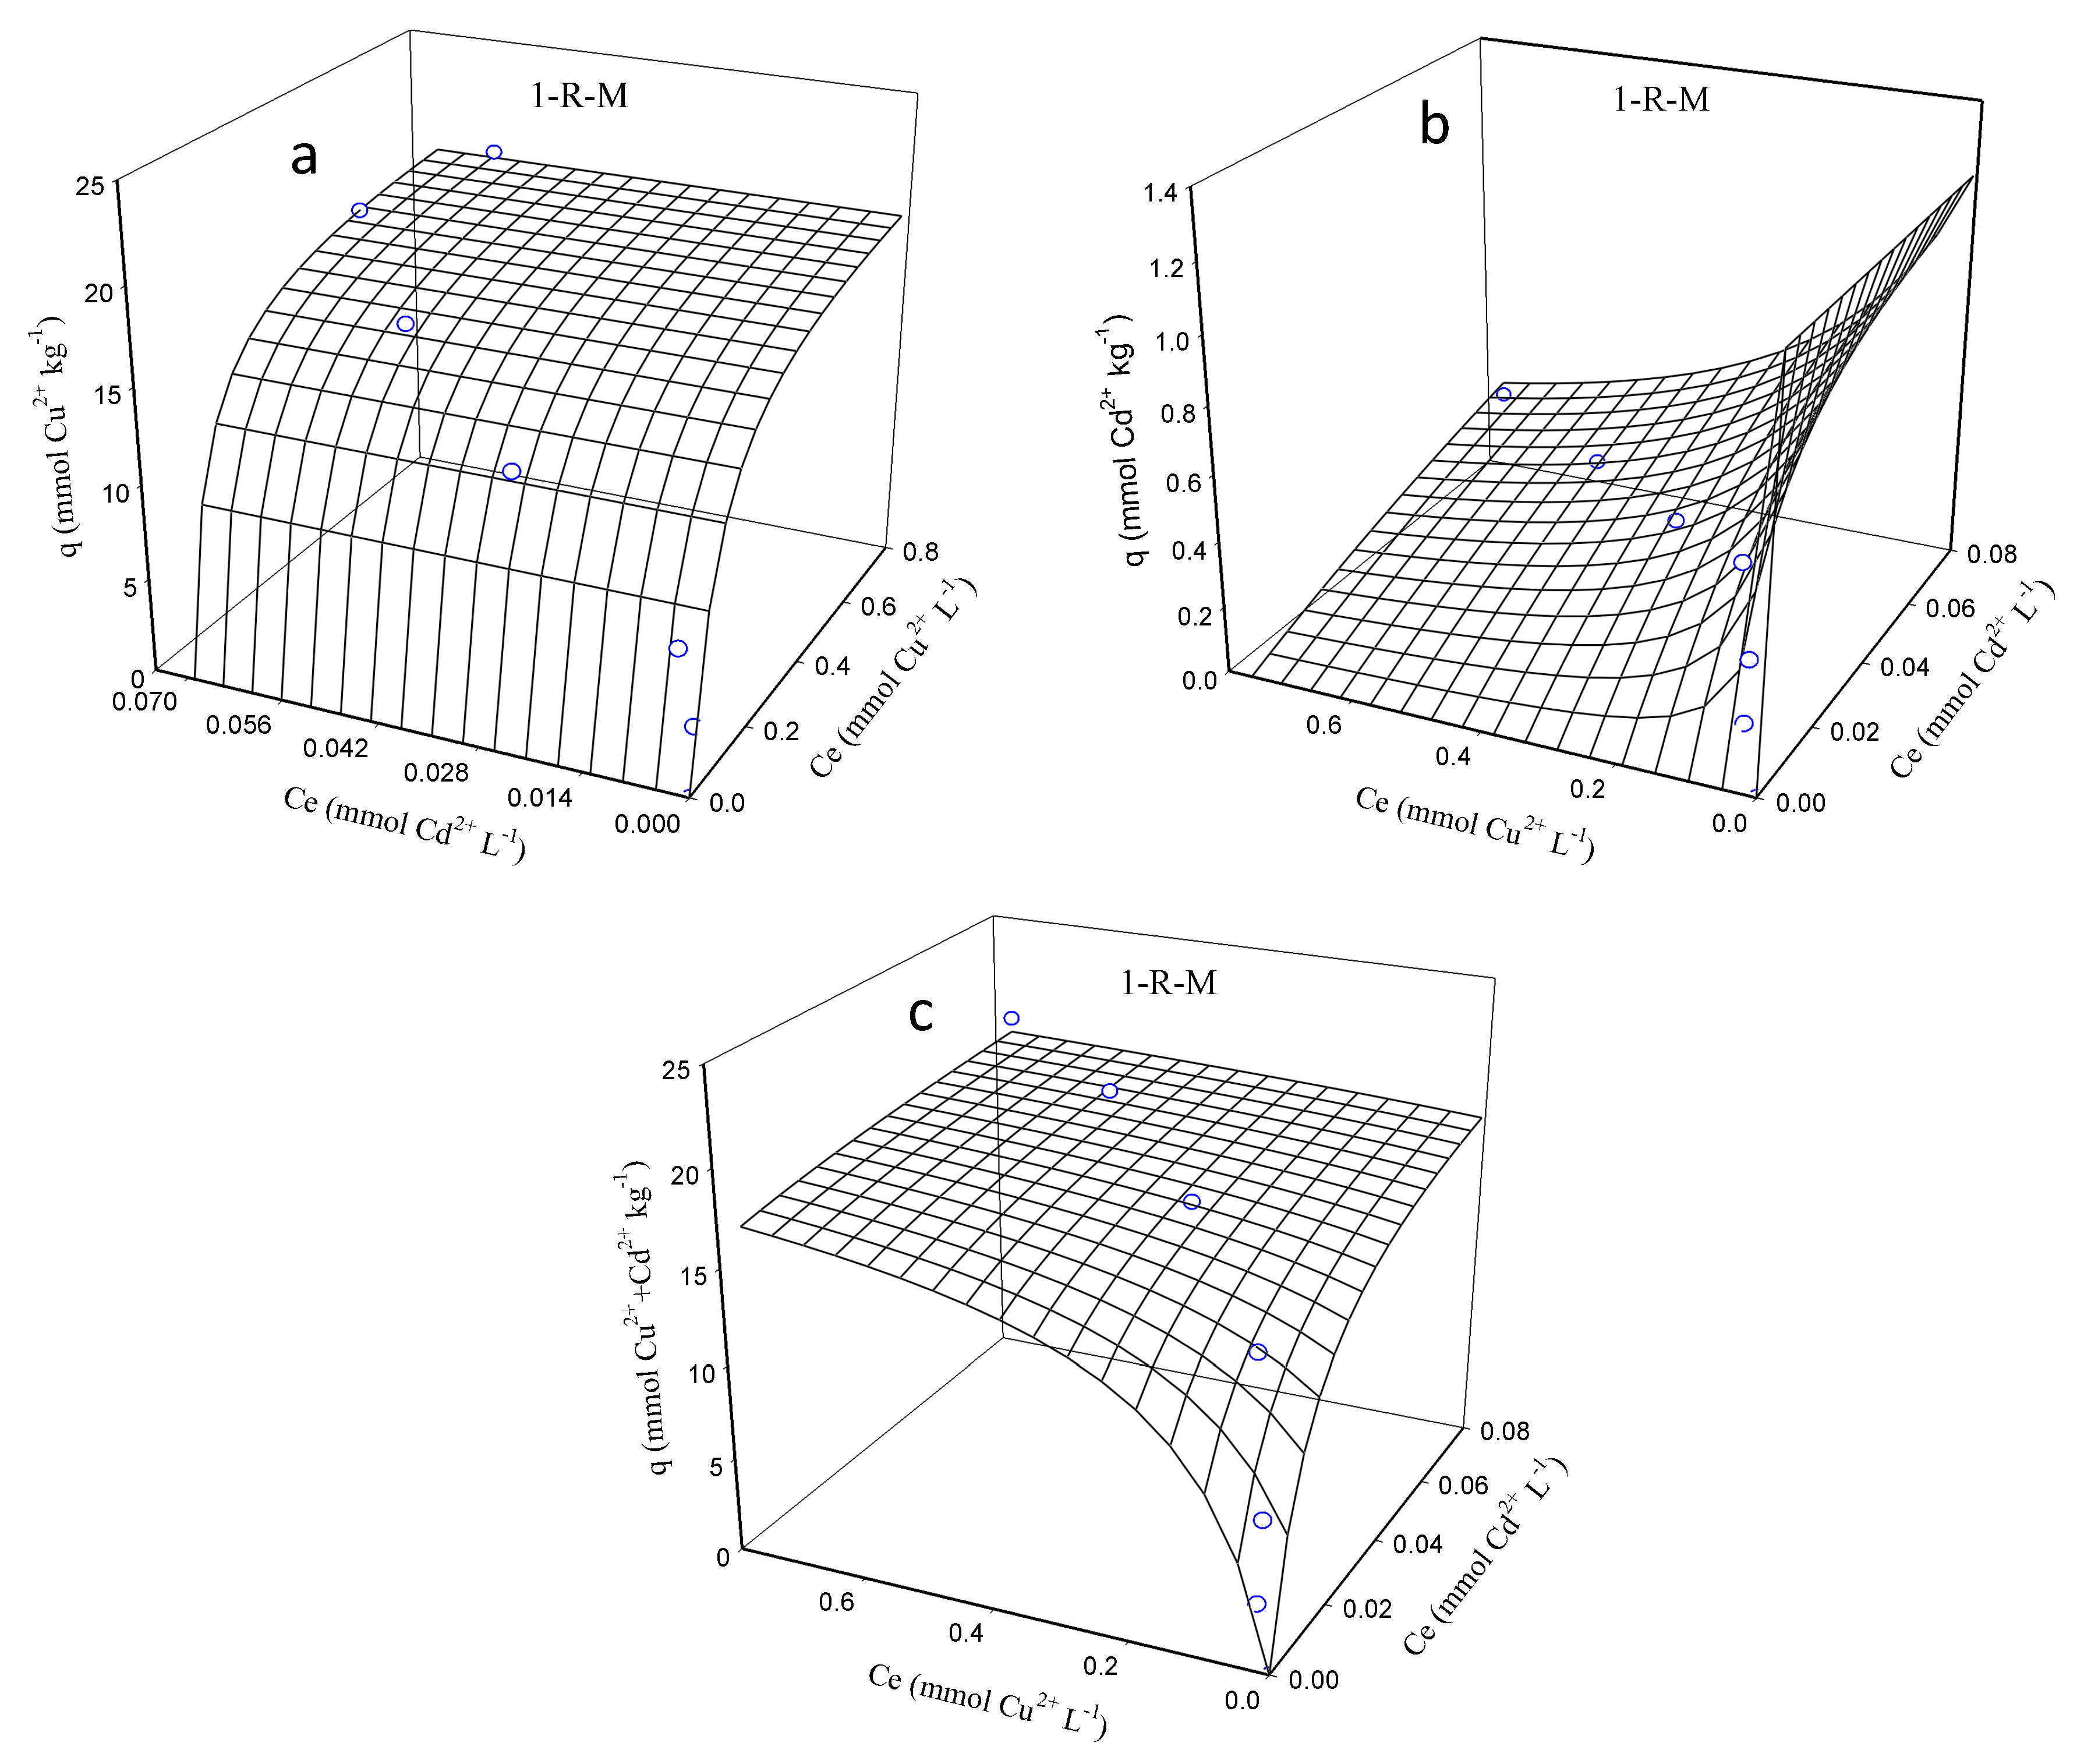
In this context, the modified Langmuir model was used to describe the Cu and Cd sorption onto sediments, and the results are presented in Figure 5 and Table 4. Figure 5 illustrates the 3D sorption isotherm surfaces of the Cu and Cd mixture system. The constant presence of Cd in the system resulted in a decrease in the sorption capacity of Cu, thereby indicating that a competitive sorption occurred between the two metals on the surface of sediments. Table 4 shows that the total sorption capacities are approximately 20.3, 25.6, 47.8, 17.2, 20.3, and 33.8 mmol kg−1 for Cu2+–Cd2+ binary mixtures onto Sample 1-S-L, 1-S-M, 1-S-S, 1-R-L, 1-R-M and 1-R-S, respectively, which indicate that maximum sorption capacity increases with a decrease in sediment particle size. In addition, Cu sorption data exhibited better fit with the modified Langmuir isotherm compared with Cd sorption data, and the determination coefficients ranged from 0.979 to 0.990 (Table 4). Based on the model assumptions, this finding can lead to a potential supposition that metal ions exhibit higher sorption affinity in bonding with a free binding site than with binding sites occupied by another metal ion.
3.4. Distribution Coefficient of Cu and Cd on Sediments
Kd is the ratio of the amount of heavy metal adsorbed to that in the equilibrium solution. In our study, the Kd values of Cu sorption (Table 5) varied within the ranges of 21.3–610, 39.4–413, 703–1.93 × 10³, 21.0–283, 25.4–147, and 86.6–919 for Sample 1-S-L, 1-S-M, 1-S-S, 1-R-L, 1-R-M, and 1-R-S sediments, respectively. The value of Kd decreased with increasing initial Cu concentration. Higher Kd values were found in the lower initial Cu concentration added to the solution because sediments contain sufficient available sorption sites and higher affinity to fix Cu when the initial Cu concentration is low. In addition, marked differences were observed when the Kd values among the studied sediments were compared. Among the investigated samples, results demonstrated that 1-S-S was the most effective in retaining Cu in solids, by achieving the highest Kd values. Meanwhile, the variation characteristics of the Kd values for Cd sorption onto six types of sediments were similar to those of Cu, that is, Kd increased with smaller particles. Thus, sediment texture is an important factor that influences the heavy metals sorption onto sediments.
3.5. Desorption of Cu and Cd
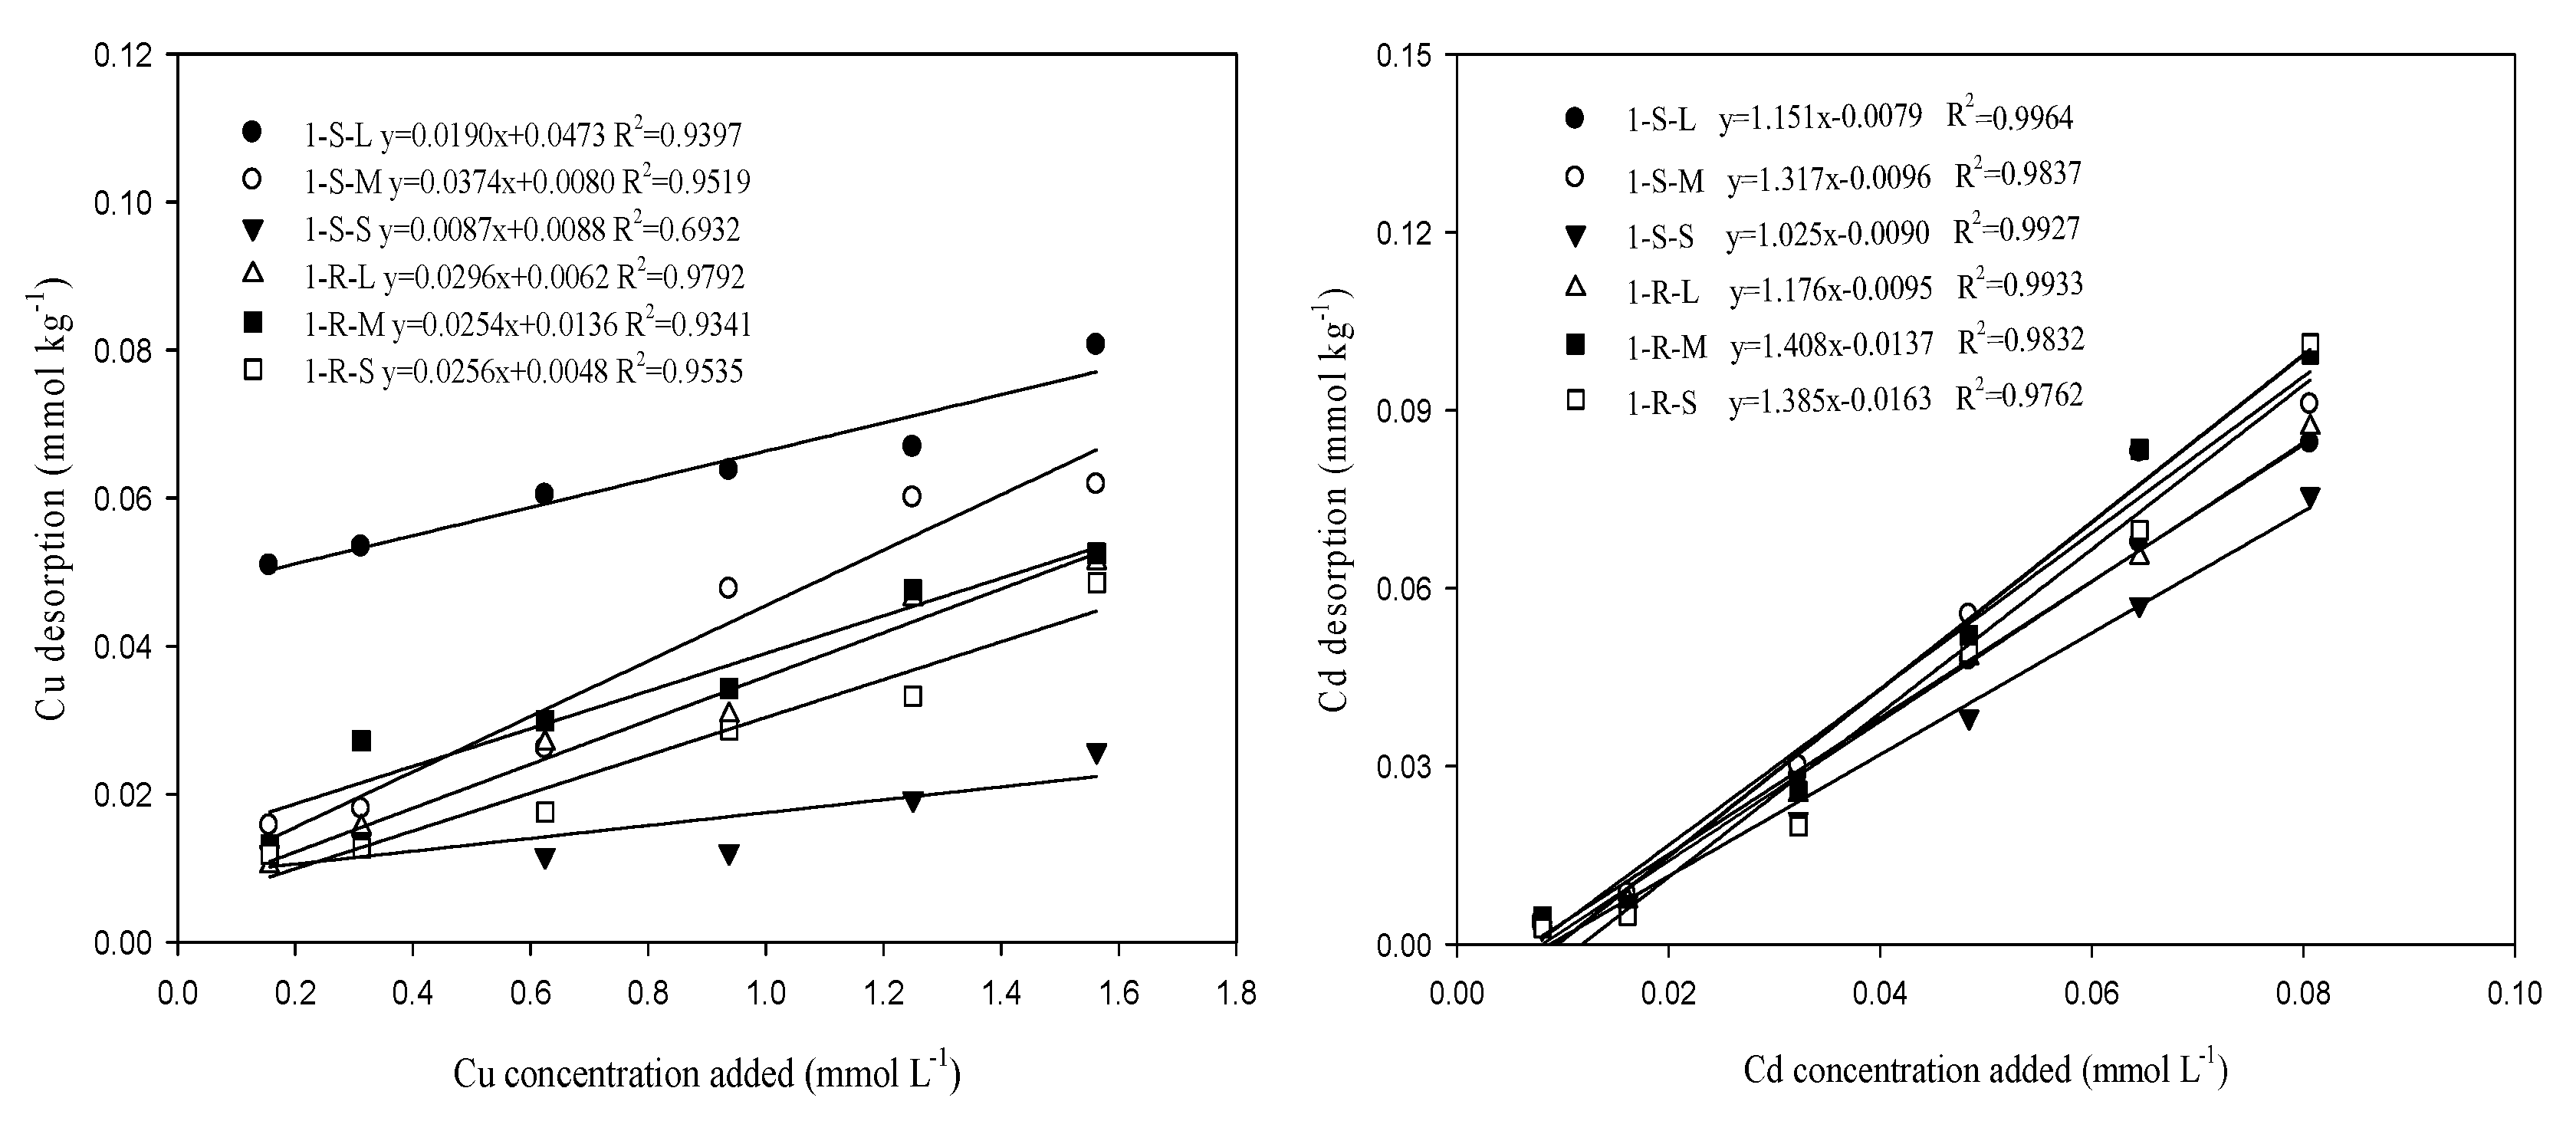
Desorbed amounts of Cu and Cd are presented in Figure 6. The desorption of Cu by potassium chloride across six sediments varied from 0.0103 mmol kg−1 (1-S-S at initial concentration was 10 mg L−1) to 0.0807 mmol kg−1 (1-S-L at initial concentration was 100 mg L−1). The desorption of Cd across six sediments varied from 0.00269 mmol kg−1 (1-S-S at initial concentration was 1 mg L−1) to 0.101 mmol kg−1 (1-R-S at initial concentration was 10 mg L−1). Moreover, the rates of Cu desorption were extremely low, and the desorption amounts from smaller sediment particles were lower than that from larger particles, because of the strong sorption capability onto smaller particles. In addition, compared with Cu, Cd desorbs more easily from sediments, and its desorption rates are higher. In this context, the amounts of Cu desorbed (mmol kg−1) linearly increased with the amount of Cu added to the solution (mmol L−1) (Figure 6). Among the studied sediment samples, Cu desorbed amounts were lower than that of Cd, because most of the Cu exists as oxidizable and residual phase. Moreover, a higher adsorption capacity of Cu was found in the studied sediments. This result can explain the low concentration of the desorbed Cu. By contrast, Cd is more mobile in the sediments, and adsorbed Cd is easy to desorb. However, in this study, the concentration Cu was one magnitude higher than that of Cd, which could significantly influence Cd sorption and desorption. In addition, Lair et al. [35] demonstrated that Strong competition was observed between Cu2+ and Cd2+ for the sorption and retention sites in soil and sediment, and the sorption capacity of Cu2+ ions on the organic material are twice as high as that for Cd2+, which resulted in Cd2+ migration from soil. Cerqueira et al. [36] demonstrated the majority of soils have a high affinity for Cu2+, more than for Cd2+. Meanwhile, they found that the Cu2+ could make sorption amount of Cd on soil (compared to the individual one) decrease 72 ± 21% (always more than 43%), and desorption amount decline 80 ± 18% (always more than 54%). For Cu, the difference between individual and competitive sorption is 11 ± 24%. Therefore, in the binary sorption system, the desorption amount of Cu and Cd would be effected each other.
4. Conclusions
The results of this study suggest that sediment particles demonstrate a significant capacity to absorb Cu(II) and Cd(II) ions in a binary sorption system. Batch tests have shown that the smallest particles (1-S-S), which present the highest specific surface area, exhibit the strongest sorption affinity and the lowest desorption rate for Cu(II) and Cd(II) ions, whereas the largest sediment particles present the lowest sorption capacity. The initial sorption rate of 1-R-S (h value), which was obtained from the pseudo-second order rate equation, was approximately 50 times higher than that of Sample 1-R-L. Moreover, Kd of 1-S-S was approximately 3 or 2 times higher than that of 1-S-L with the addition of 100 mg L−1 Cu(II) and 10 mg L−1 Cd(II) initial concentration, respectively. However, the rates of Cu desorption were extremely low, and the desorption amounts from smaller sediment particles were lower than that from larger particles. Therefore, sediment texture plays a significant role on metal sorption capacity of sediments. The equilibrium data of a mixture of Cd (II) and Cu(II) ions were graphically represented by a 3D adsorption surface and modeled by a modified extended multi-component Langmuir-type isotherm, and good fit was obtained. Under binary solutions, the predicted maximum capacity of Cu(II) was estimated to be 62.3 mmol kg−1, whereas the predicted QM for Cd(II) was estimated to be 0.6412 mmol kg−1. Finally, the results show that the affinity of each metal ion onto the surface of the sediments is influenced by sediment particle size.
Acknowledgments
This work was financially supported by the National Natural Science Foundation of China (Nos. 41401255 and 51508057), the Natural Science Foundation of Chongqing of China (No. cstc2015jcyjA20018), China Postdoctoral Science Foundation (2016M602633), and Postdoctoral Special Foundation of Chongqing (Xm2017048).
Author Contributions
Jianxin Fan and Guoliang Zhao conceived and designed the experiments; Jianxin Fan and Guoliang Zhao performed the experiments; Jianxin Fan analyzed the data; Jiaoxia Sun contributed reagents/materials/analysis tools; Jianxin Fan wrote the paper.
Conflicts of Interest
The authors declare no conflict of interest.
References
- Ndiba, P.; Axe, L.; Boonfueng, T. Heavy Metal Immobilization through Phosphate and Thermal Treatment of Dredged Sediments. Environ. Sci. Technol. 2008, 42, 920–926. [Google Scholar] [CrossRef] [PubMed]
- Nobi, E.P.; Dilipan, E.; Thangaradjou, T.; Sivakumar, K.; Kannan, L. Geochemical and geo-statistical assessment of heavy metal concentration in the sediments of different coastal ecosystems of Andaman Islands, India. Estuar. Coast. Shelf Sci. 2010, 87, 253–264. [Google Scholar] [CrossRef]
- Zhang, C.; Yu, Z.-G.; Zeng, G.-M.; Jiang, M.; Yang, Z.-Z.; Cui, F.; Zhu, M.-Y.; Shen, L.-Q.; Hu, L. Effects of sediment geochemical properties on heavy metal bioavailability. Environ. Int. 2014, 73, 270–281. [Google Scholar] [CrossRef] [PubMed]
- Jain, C.K.; Singhal, D.C.; Sharma, M.K. Adsorption of zinc on bed sediment of River Hindon: Adsorption models and kinetics. J. Hazard. Mater. 2004, 114, 231–239. [Google Scholar] [CrossRef] [PubMed]
- Wen, X.; Du, Q.; Tang, H. Surface Complexation Model for the Heavy Metal Adsorption on Natural Sediment. Environ. Sci. Technol. 1998, 32, 870–875. [Google Scholar] [CrossRef]
- Apte, A.D.; Tare, V.; Bose, P. Extent of oxidation of Cr(III) to Cr(VI) under various conditions pertaining to natural environment. J. Hazard. Mater. 2006, 128, 164–174. [Google Scholar] [CrossRef] [PubMed]
- Gu, B.; Liang, L.; Dickey, M.J.; Yin, X.; Dai, S. Reductive Precipitation of Uranium(VI) by Zero-Valent Iron. Environ. Sci. Technol. 1998, 32, 3366–3373. [Google Scholar] [CrossRef]
- Ajima, M.N.O.; Nnodi, P.C.; Ogo, O.A.; Adaka, G.S.; Osuigwe, D.I.; Njoku, D.C. Bioaccumulation of heavy metals in Mbaa River and the impact on aquatic ecosystem. Environ. Monit. Assess. 2015, 187, 768. [Google Scholar] [CrossRef] [PubMed]
- Murakami, M.; Fujita, M.; Furumai, H.; Kasuga, I.; Kurisu, F. Sorption behavior of heavy metal species by soakaway sediment receiving urban road runoff from residential and heavily trafficked areas. J. Hazard. Mater. 2009, 164, 707–712. [Google Scholar] [CrossRef] [PubMed]
- Simpson, S.L.; Apte, S.C.; Batley, G.E. Effect of Short-Term Resuspension Events on the Oxidation of Cadmium, Lead, and Zinc Sulfide Phases in Anoxic Estuarine Sediments. Environ. Sci. Technol. 2000, 34, 4533–4537. [Google Scholar] [CrossRef]
- Cabral, M.; Toure, A.; Garçon, G.; Diop, C.; Bouhsina, S.; Dewaele, D.; Cazier, F.; Courcot, D.; Tall-Dia, A.; Shirali, P.; et al. Effects of environmental cadmium and lead exposure on adults neighboring a discharge: Evidences of adverse health effects. Environ. Pollut. 2015, 206, 247–255. [Google Scholar] [CrossRef] [PubMed]
- Ghrefat, H.; Yusuf, N. Assessing Mn, Fe, Cu, Zn, and Cd pollution in bottom sediments of Wadi Al-Arab Dam, Jordan. Chemosphere 2006, 65, 2114–2121. [Google Scholar] [CrossRef] [PubMed]
- Jain, C.K.; Sharma, M.K. Adsorption of Cadmium on Bed Sediments of River Hindon: Adsorption Models and Kinetics. Water Air Soil Pollut. 2002, 137, 1–19. [Google Scholar] [CrossRef]
- Bettinetti, R.; Giarei, C.; Provini, A. Chemical Analysis and Sediment Toxicity Bioassays to Assess the Contamination of the River Lambro (Northern Italy). Arch. Environ. Contam. Toxicol. 2003, 45, 72–78. [Google Scholar] [CrossRef] [PubMed]
- Gibbs, R.J. Transport phases of transition metals in the Amazon and Yukon Rivers. Geol. Soc. Am. Bull. 1977, 88, 829–843. [Google Scholar] [CrossRef]
- Hussein, H.; Farag, S.; Kandil, K.; Moawad, H. Tolerance and uptake of heavy metals by Pseudomonads. Process Biochem. 2005, 40, 955–961. [Google Scholar] [CrossRef]
- Wang, S.; Terdkiatburana, T.; Tadé, M.O. Adsorption of Cu(II), Pb(II) and humic acid on natural zeolite tuff in single and binary systems. Sep. Purif. Technol. 2008, 62, 64–70. [Google Scholar] [CrossRef]
- Turki, A. Metal Speciation (Cd, Cu, Pb and Zn) in Sediments from Al Shabab Lagoon, Jeddah, Saudi Arabia. JKAU Mar. Sci. 2007, 18, 191–210. [Google Scholar] [CrossRef]
- Loska, K.; Wiechula, D. Application of principal component analysis for the estimation of source of heavy metal contamination in surface sediments from the Rybnik Reservoir. Chemosphere 2003, 51, 723–733. [Google Scholar] [CrossRef]
- Morillo, J.; Usero, J.; Gracia, I. Heavy metal distribution in marine sediments from the southwest coast of Spain. Chemosphere 2004, 55, 431–442. [Google Scholar] [CrossRef] [PubMed]
- Jiao, F.; Ren, L.; Wang, X.; Liu, W. Pollution characteristics and potential ecological risk assessment of metals in the sediments of Xiaoqing River, Jinan. Environ. Sci. Pollut. Res. 2017, 24, 15001–15011. [Google Scholar] [CrossRef] [PubMed]
- Zhang, W.; Feng, H.; Chang, J.; Qu, J.; Xie, H.; Yu, L. Heavy metal contamination in surface sediments of Yangtze River intertidal zone: An assessment from different indexes. Environ. Pollut. 2009, 157, 1533–1543. [Google Scholar] [CrossRef] [PubMed]
- Ansari Dezfoli, A.R.; Mehrabian, M.A.; Hashemipour, H. Comparative study of Zn(II) and Cd(II) ions adsorption on charged carbon nano tubes: Molecular dynamics approach. Adsorption 2013, 19, 1253–1261. [Google Scholar] [CrossRef]
- Ding, C.; Cheng, W.; Wang, X.; Wu, Z.-Y.; Sun, Y.; Chen, C.; Wang, X.; Yu, S.-H. Competitive sorption of Pb(II), Cu(II) and Ni(II) on carbonaceous nanofibers: A spectroscopic and modeling approach. J. Hazard. Mater. 2016, 313, 253–261. [Google Scholar] [CrossRef] [PubMed]
- Escudero, C.; Poch, J.; Villaescusa, I. Modelling of breakthrough curves of single and binary mixtures of Cu(II), Cd(II), Ni(II) and Pb(II) sorption onto grape stalks waste. Chem. Eng. J. 2013, 217, 129–138. [Google Scholar] [CrossRef]
- Kongsuwan, A.; Patnukao, P.; Pavasant, P. Binary component sorption of Cu(II) and Pb(II) with activated carbon from Eucalyptus camaldulensisDehn bark. J. Ind. Eng. Chem. 2009, 15, 465–470. [Google Scholar] [CrossRef]
- Zang, F.; Wang, S.; Nan, Z.; Ma, J.; Li, Y.; Zhang, Q.; Chen, Y. Immobilization of Cu, Zn, Cd and Pb in mine drainage stream sediment using Chinese loess. Chemosphere 2017, 181, 83–91. [Google Scholar] [CrossRef] [PubMed]
- Oh, S.; Kwak, M.Y.; Shin, W.S. Competitive sorption of lead and cadmium onto sediments. Chem. Eng. J. 2009, 152, 376–388. [Google Scholar] [CrossRef]
- Allison, L.E. Wet combustion apparatus and procedure for organic and inorganic carbon in soil. Soil Sci. Soc. Am. Proc. 1960, 24, 36–40. [Google Scholar] [CrossRef]
- Nemati, K.; Bakar, N.K.A.; Abas, M.R.; Sobhanzadeh, E. Speciation of heavy metals by modified BCR sequential extraction procedure in different depths of sediments from Sungai Buloh, Selangor, Malaysia. J. Hazard. Mater. 2011, 192, 402–410. [Google Scholar] [CrossRef] [PubMed]
- Chi, Q.; Yan, M. Handbook of Elemental Abundance for Applied Geochemistry; Geological Publishing House: Beijing, China, 2007; pp. 140–142. [Google Scholar]
- Vosoogh, A.; Saeedi, M.; Lak, R. Metal fractionation and pollution risk assessment of different sediment sizes in three major southwestern rivers of Caspian Sea. Environ. Earth Sci. 2017, 76, 292. [Google Scholar] [CrossRef]
- Ramos, L.; González, M.J.; Hernández, L.M. Sequential Extraction of Copper, Lead, Cadmium, and Zinc in Sediments from Ebro River (Spain): Relationship with Levels Detected in Earthworms. Bull. Environ. Contam. Toxicol. 1999, 62, 301–308. [Google Scholar] [CrossRef] [PubMed]
- Park, J.-H.; Ok, Y.S.; Kim, S.-H.; Cho, J.-S.; Heo, J.-S.; Delaune, R.D.; Seo, D.-C. Competitive adsorption of heavy metals onto sesame straw biochar in aqueous solutions. Chemosphere 2016, 142, 77–83. [Google Scholar] [CrossRef] [PubMed]
- Lair, G.J.; Gerzabek, M.H.; Haberhauer, G. Sorption of heavy metals on organic and inorganic soil constituents. Environ. Chem. Lett. 2007, 5, 23–27. [Google Scholar] [CrossRef]
- Cerqueira, B.; Covelo, F.E.; Andrade, L.; Vega, A.F. The influence of soil properties on the individual and competitive sorption and desorption of Cu and Cd. Geoderma 2011, 162, 20–26. [Google Scholar] [CrossRef]
Figure 1.
Map of the Yangtze River drainage basin and the sampling locations.

Figure 2.
Spatial distribution of Cd and Cu concentrations in sediments (mg/kg, dry mass).
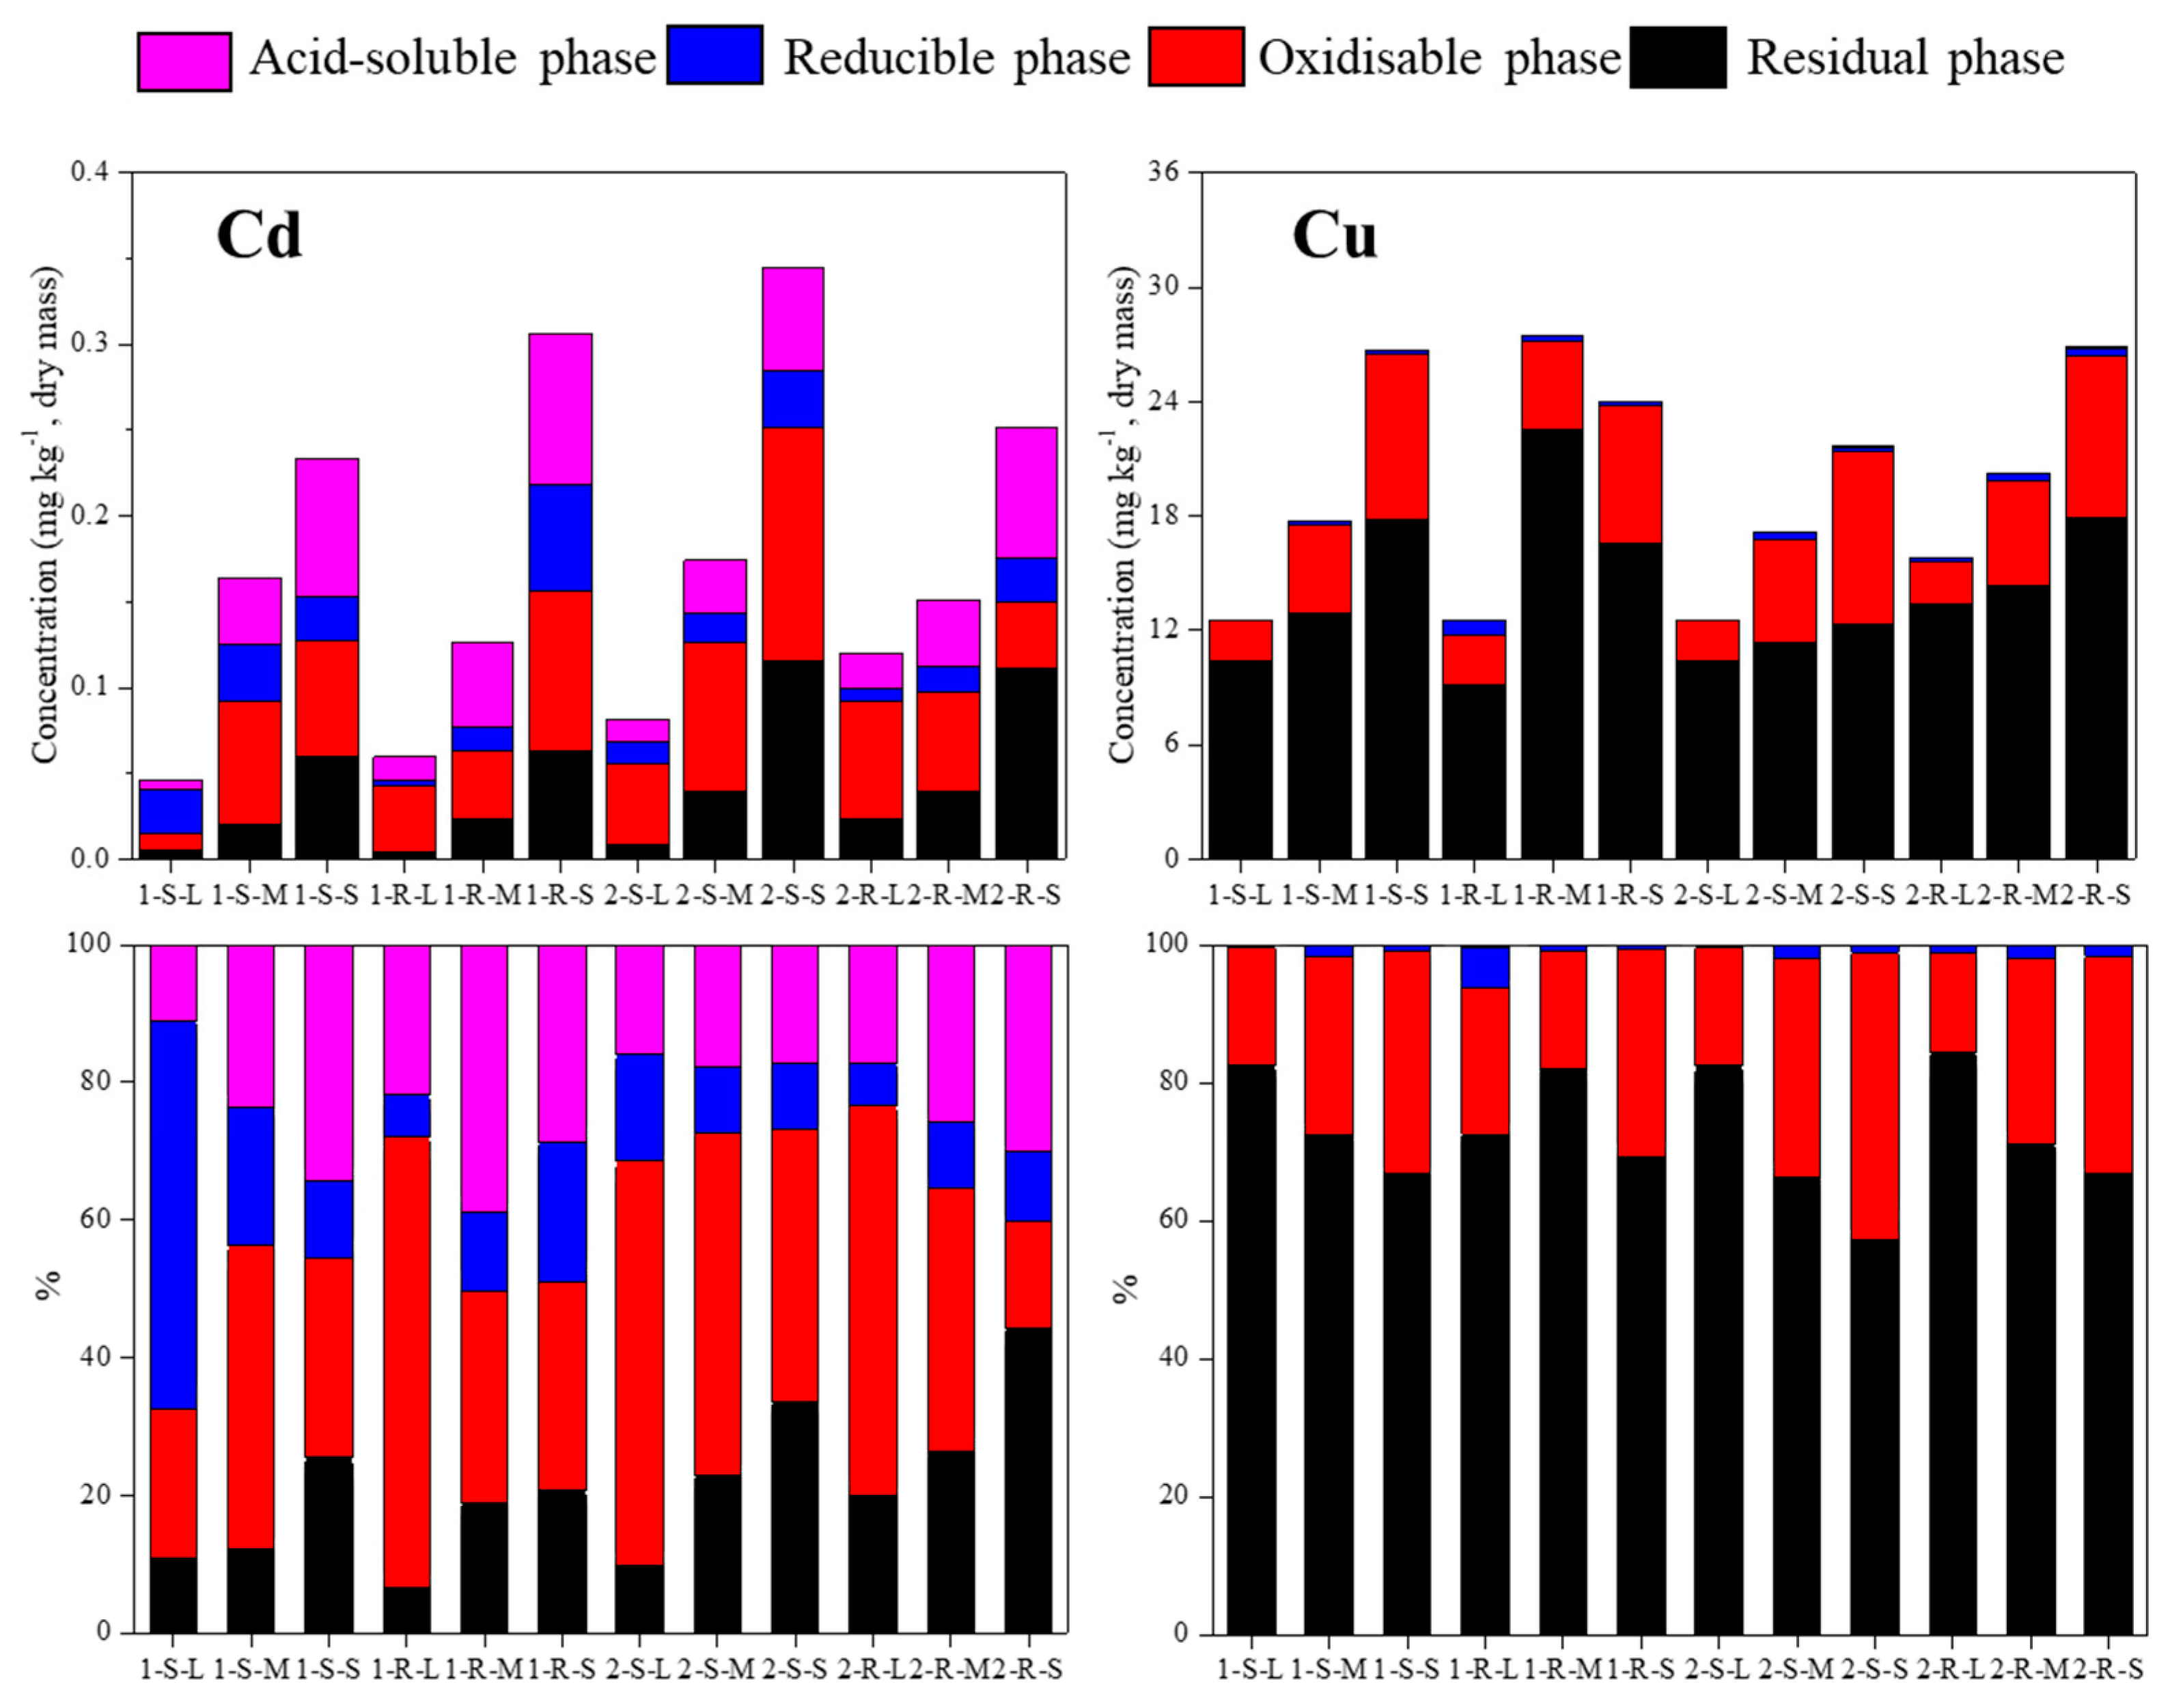
Figure 3.
Sorption of Cu and Cd onto sediments as a function of contact time.

Figure 4.
Sorption isotherms of Cu and Cd onto sediments.
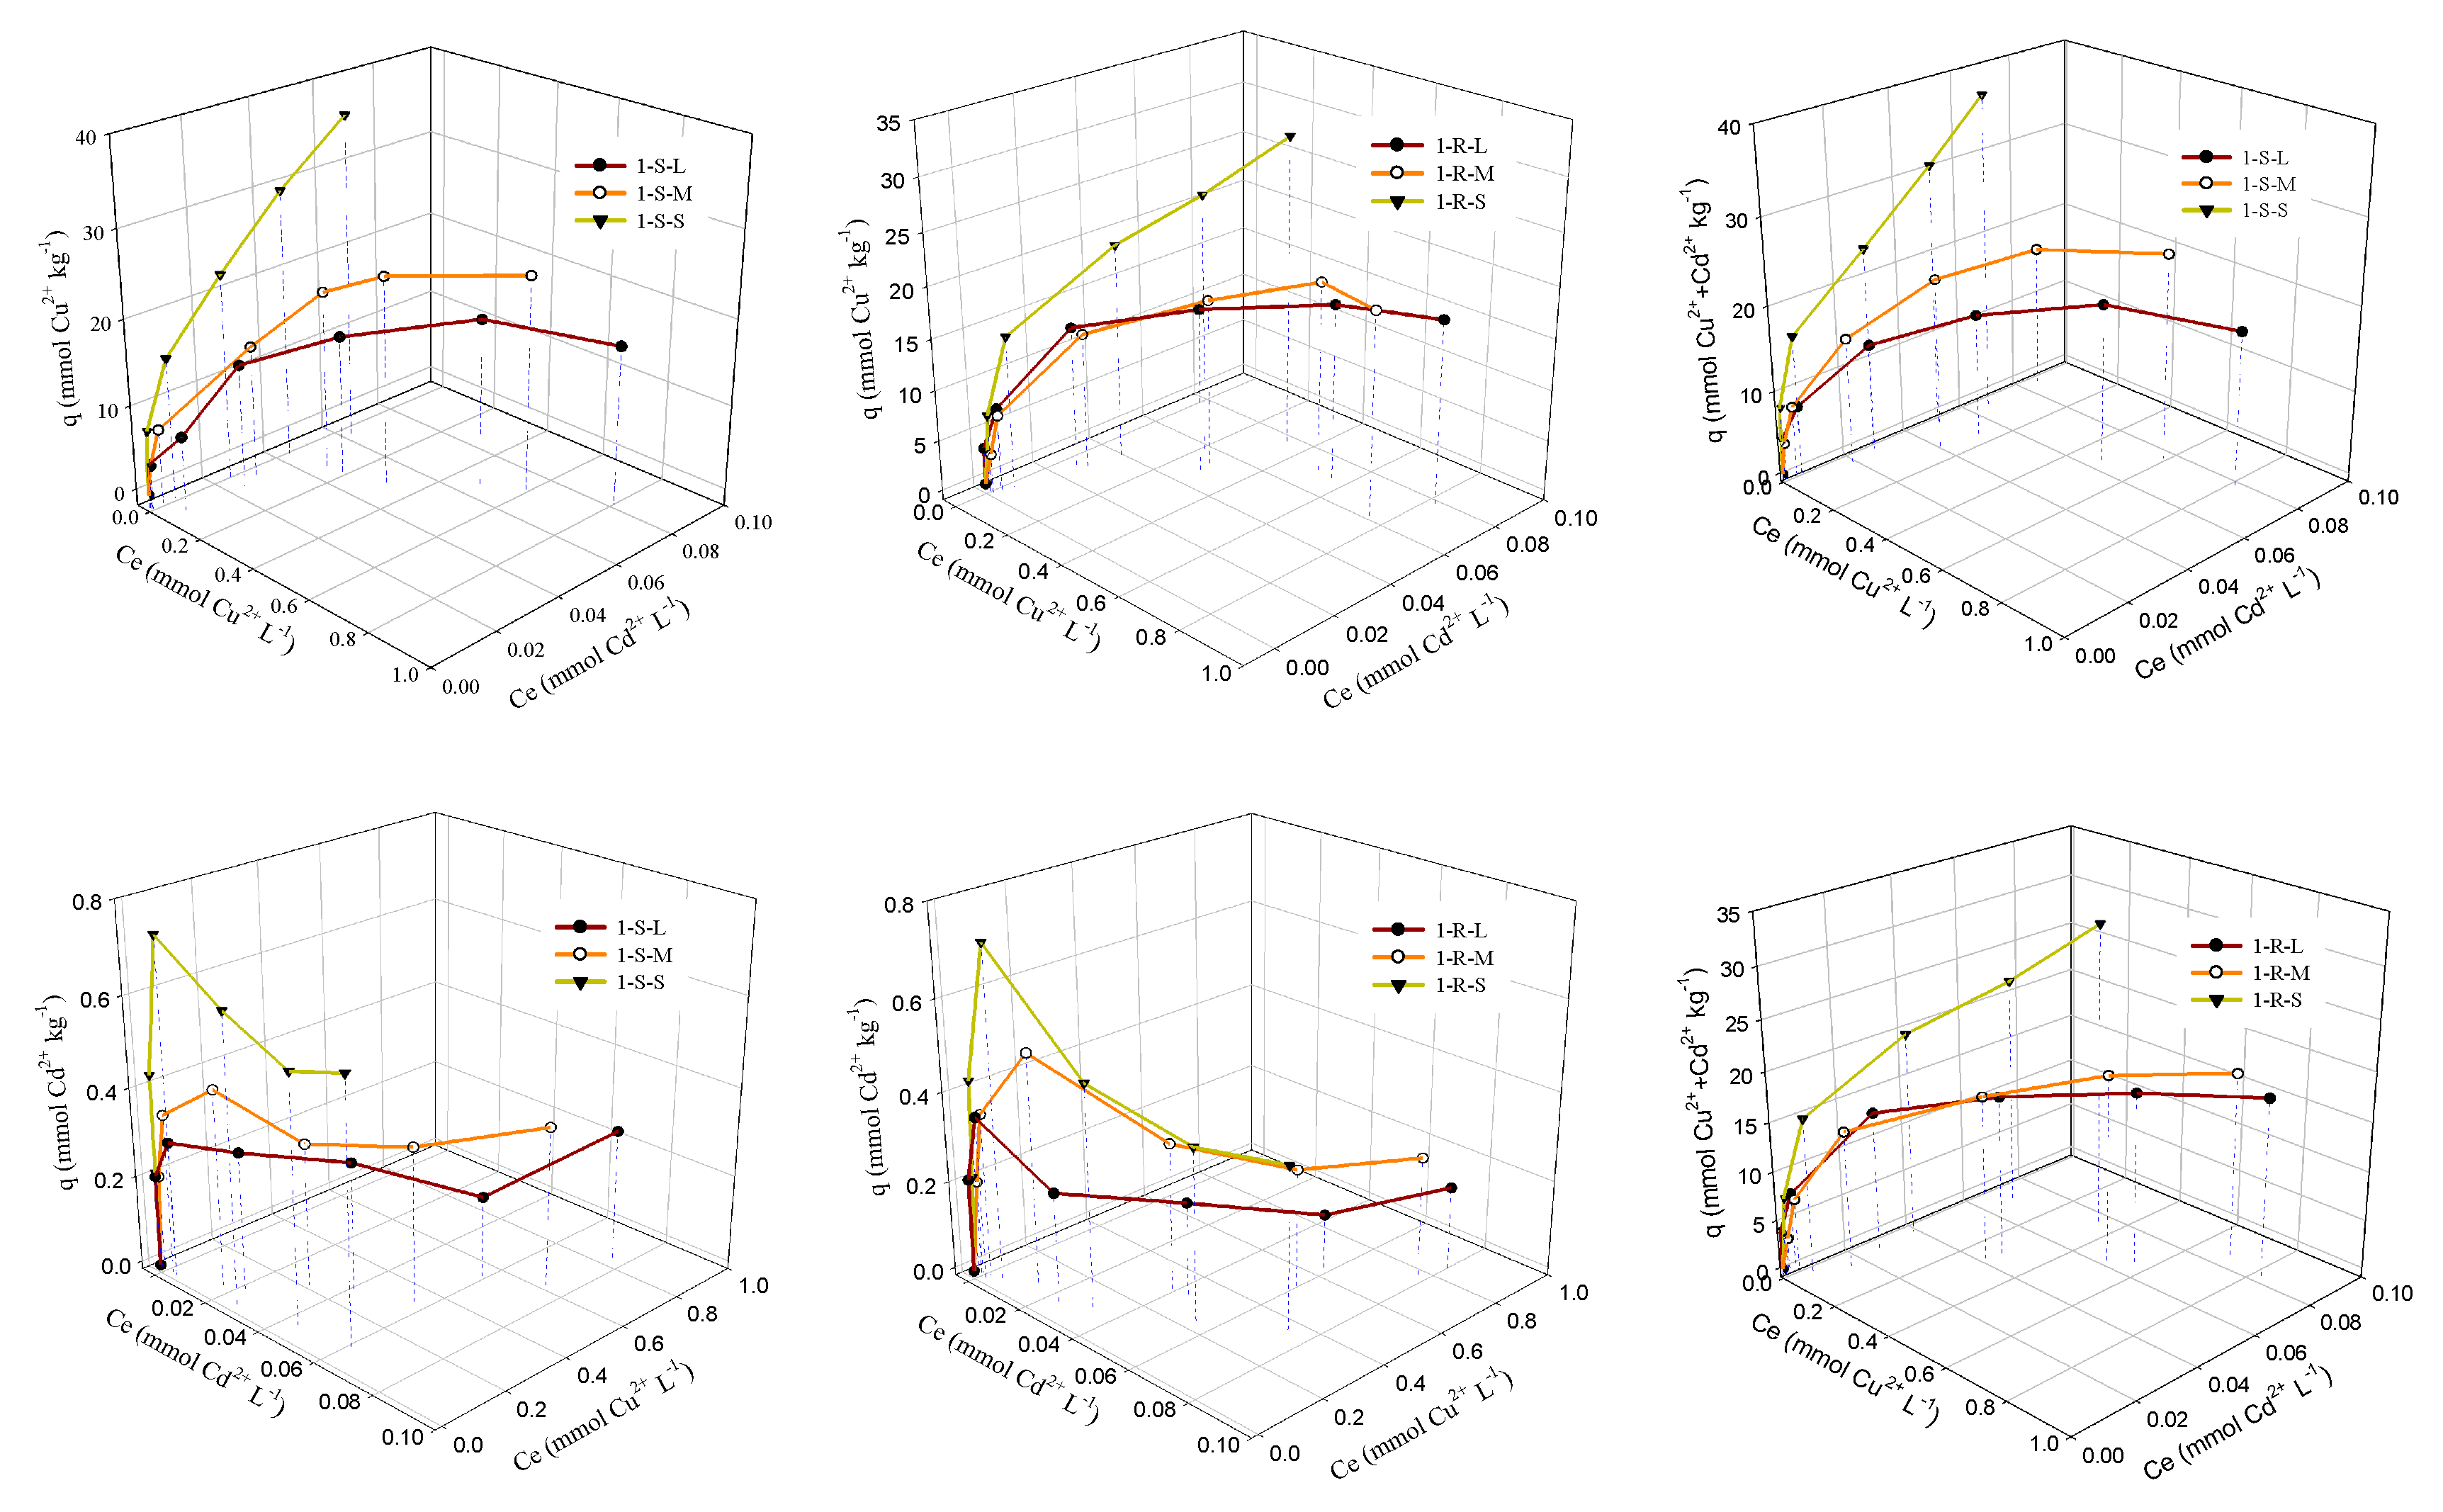
Figure 5.
Sorption surfaces of extend Langmuir-type isotherm fitted to the experimental equilibrium data of Cu2+–Cd2+ system: (a) sorption capacity of Cu2+; (b) sorption capacity of Cd2+; and (c) total sorption capacity (Cu2+ + Cd2+).
Figure 5.
Sorption surfaces of extend Langmuir-type isotherm fitted to the experimental equilibrium data of Cu2+–Cd2+ system: (a) sorption capacity of Cu2+; (b) sorption capacity of Cd2+; and (c) total sorption capacity (Cu2+ + Cd2+).

Figure 6.
Desorption of Cu and Cd by 0.01 M KCl in different sediments.


Table 1.
Sediments sample sites and properties.
| Sample | site | pH | OM (%) | Cu Content (mg kg−1) | Cd Content (mg kg−1) | Particle Size (d0.5) (μm) | Specific Surface Area (m3 g−1) | Sample Number | |
|---|---|---|---|---|---|---|---|---|---|
| 1 | 106°32′59″E, 29°32′46″N | Submerged sediment | 7.3 | 3.44 | 19.0 | 0.148 | 319 | 0.0872 | 1-S-L |
| 156 | 0.133 | 1-S-M | |||||||
| 72.9 | 0.436 | 1-S-S | |||||||
| Riparian sediment | 7.4 | 3.41 | 21.3 | 0.164 | 322 | 0.0627 | 1-R-L | ||
| 165 | 0.124 | 1-R-M | |||||||
| 67.9 | 0.406 | 1-R-S | |||||||
| 2 | 106°32′46″E, 29°33′51″N | Submerged sediment | 7.2 | 3.88 | 17.1 | 0.200 | 317 | 0.0941 | 2-S-L |
| 151 | 0.123 | 2-S-M | |||||||
| 71.2 | 0.379 | 2-S-S | |||||||
| Riparian sediment | 7.6 | 3.55 | 21.0 | 0.174 | 316 | 0.0742 | 2-R-L | ||
| 163 | 0.130 | 2-R-M | |||||||
| 69.3 | 0.353 | 2-R-S |
Table 2.
Regressed kinetic parameters for Cu and Cd adsorption on the sediments.
| Sediment | Double Constant | Pseudo-First-Order | Pseudo-Second-Order | Elovich | ||||||||||
|---|---|---|---|---|---|---|---|---|---|---|---|---|---|---|
| a | b | R2 | Qe | K1 | R2 | Qe | K2 | h | R2 | K | α | R2 | ||
| Cu | 1-S-L | 7.30 | 2.58 × 10⁻² | 0.981 | 7.70 | 9.76 | 0.999 | 7.83 | 3.23 | 198 | 0.998 | 2.67 × 10⁸ | 2.88 | 0.971 |
| 1-S-M | 7.48 | 1.69 × 10⁻² | 0.990 | 7.75 | 12.0 | 0.999 | 7.83 | 5.04 | 308 | 0.999 | 3.58 × 10⁸ | 2.89 | 0.974 | |
| 1-S-S | 7.68 | 5.25 × 10⁻³ | 0.999 | 7.77 | 18.9 | 0.999 | 7.79 | 17.5 | 1.07 × 10³ | 0.999 | 4.21 × 10⁸ | 2.87 | 0.952 | |
| 1-R-L | 7.17 | 3.25 × 10⁻² | 0.973 | 7.68 | 8.46 | 0.998 | 7.84 | 2.47 | 152 | 0.998 | 1.83 × 10⁸ | 2.85 | 0.969 | |
| 1-R-M | 7.50 | 1.64 × 10⁻² | 0.989 | 7.77 | 11.9 | 0.999 | 7.85 | 5.04 | 310 | 0.998 | 3.57 × 10⁸ | 2.89 | 0.966 | |
| 1-R-S | 7.72 | 7.99 × 10⁻⁴ | 0.999 | 7.73 | 31.3 | 0.999 | 77.4 | 1.38 | 8.25 × 10³ | 0.999 | 4.24 × 10⁸ | 2.88 | 0.942 | |
| Cd | 1-S-L | 0.371 | 5.35 × 10⁻² | 0.992 | 0.409 | 8.38 | 0.964 | 0.422 | 35.2 | 6.27 | 0.989 | 5.84 × 10⁵ | 46.0 | 0.997 |
| 1-S-M | 0.388 | 4.35 × 10⁻² | 0.988 | 0.421 | 8.66 | 0.984 | 0.432 | 40.1 | 7.48 | 0.997 | 5.63 × 10⁶ | 50.5 | 0.988 | |
| 1-S-S | 0.415 | 2.52 × 10⁻² | 0.984 | 0.437 | 10.1 | 0.999 | 0.444 | 59.9 | 11.8 | 0.999 | 1.61 × 10⁷ | 50.9 | 0.973 | |
| 1-R-L | 0.348 | 6.08 × 10⁻² | 0.998 | 0.386 | 8.81 | 0.944 | 0.400 | 37.1 | 5.93 | 0.973 | 9.30 × 10⁴ | 43.6 | 0.953 | |
| 1-R-M | 0.385 | 4.33 × 10⁻² | 0.987 | 0.418 | 8.61 | 0.984 | 0.429 | 40.0 | 7.37 | 0.998 | 5.61 × 10⁵ | 50.8 | 0.988 | |
| 1-R-S | 0.431 | 8.18 × 10⁻³ | 0.998 | 0.438 | 16.5 | 0.999 | 0.441 | 197 | 38.3 | 0.999 | 2.34 × 10⁶ | 60.0 | 0.981 | |
Table 3.
Langmuir equation parameters calculated using Nonlinear-Curve-Fitting for sediments with different particle size.
Table 3.
Langmuir equation parameters calculated using Nonlinear-Curve-Fitting for sediments with different particle size.
| Sediment | Cu2+ | Cd2+ | Cu2+ + Cd2+ | ||||||
|---|---|---|---|---|---|---|---|---|---|
| K (L mmol−1) | QMAX (mmol kg−1) | R2 | K (L mmol−1) | QMAX (mmol kg−1) | R2 | K (L mmol−1) | QMAX (mmol kg−1) | R2 | |
| 1-S-L | 15.3 | 19.9 | 0.931 | 1.16 × 10⁴ | 0.274 | 0.884 | 49.4 | 18.1 | 0.946 |
| 1-S-M | 26.3 | 25.2 | 0.988 | 2.59 × 10³ | 0.376 | 0.947 | 21.8 | 25.6 | 0.990 |
| 1-S-S | 57.3 | 48.2 | 0.990 | 5.26 × 10³ | 0.638 | 0.922 | 47.2 | 40.4 | 0.971 |
| 1-R-L | 70.6 | 17.1 | 0.986 | 4.15 × 10⁵ | 0.226 | 0.628 | 59.6 | 17.2 | 0.975 |
| 1-R-M | 15.2 | 20.7 | 0.980 | 3.57 × 10³ | 0.345 | 0.686 | 14.7 | 20.8 | 0.983 |
| 1-R-S | 14.6 | 34.7 | 0.9856 | 7.80 × 10³ | 0.490 | 0.661 | 14.6 | 35.5 | 0.985 |
Table 4.
Parameters of binary sorption isotherms for sediments with different particle size.
| Sediment | Cu2+ | Cd2+ | Cu2+ + Cd2+ | |||||||||
|---|---|---|---|---|---|---|---|---|---|---|---|---|
| q | BCu | BCd | R2 | q | BCd | BCu | R2 | q | BCd | BCu | R2 | |
| 1-S-L | 19.9 | 25.3 | 0.106 | 0.986 | 0.315 | 6.91 × 10³ | 173 | 0.986 | 20.3 | 109 | 23.0 | 0.960 |
| 1-S-M | 26.4 | 28.1 | 1.40 | 0.990 | 0.432 | 3.52 × 10³ | 117 | 0.967 | 25.6 | 31.9 | 19.1 | 0.990 |
| 1-S-S | 62.3 | 44.5 | 10.6 | 0.990 | 0.641 | 2.54 × 10³ | 89.2 | 0.922 | 47.8 | 0.00240 | 61.7 | 0.988 |
| 1-R-L | 17.9 | 78.7 | 28.8 | 0.989 | 0.240 | 6.26 × 10³ | 39.5 | 0.646 | 17.2 | 0.00310 | 76.5 | 0.985 |
| 1-R-M | 20.7 | 15.2 | 0.0902 | 0.979 | 0.302 | 5.32 × 10³ | 40.5 | 0.753 | 20.3 | 94.3 | 7.64 | 0.994 |
| 1-R-S | 36.1 | 14.2 | 2.30 | 0.986 | 0.490 | 3.41 × 10³ | 23.0 | 0.661 | 33.8 | 11.4 | 14.8 | 0.986 |
q: mmol kg−1; BCd, BCu: L mmol−1.
Table 5.
Kd (L kg−1) of following adsorption from solution with various initial concentrations.
| Cu | Cd | |||||||||||
|---|---|---|---|---|---|---|---|---|---|---|---|---|
| 10 | 20 | 40 | 60 | 80 | 100 | 1 | 2 | 4 | 6 | 8 | 10 | |
| 1-S-L | 610 | 416 | 164 | 62.6 | 36.7 | 21.3 | 724 | 55.4 | 13.2 | 6.69 | 3.09 | 3.76 |
| 1-S-M | 413 | 318 | 263 | 133 | 71.4 | 39.4 | 400 | 98.8 | 24.3 | 8.87 | 5.96 | 4.74 |
| 1-S-S | 1.93 × 10³ | 2.04 × 10³ | 2.51 × 10³ | 1.32 × 10³ | 976 | 703 | 1.42 × 10³ | 1.54 × 10³ | 137 | 22.9 | 11.5 | 9.08 |
| 1-R-L | 283 | 362 | 227 | 52.2 | 29.8 | 21.0 | 514 | 116 | 9.35 | 4.47 | 2.34 | 2.22 |
| 1-R-M | 147 | 2542 | 152 | 54.9 | 35.8 | 25.4 | 371 | 120 | 35.0 | 7.98 | 4.24 | 3.34 |
| 1-R-S | 919 | 620 | 373 | 211 | 111 | 86.6 | 1.11 × 10³ | 1.28 × 10³ | 118 | 14.5 | 6.74 | 4.76 |
© 2017 by the authors. Licensee MDPI, Basel, Switzerland. This article is an open access article distributed under the terms and conditions of the Creative Commons Attribution (CC BY) license (http://creativecommons.org/licenses/by/4.0/).
Share and Cite
MDPI and ACS Style
Fan, J.; Zhao, G.; Sun, J. Binary Component Sorption of Cadmium, and Copper Ions onto Yangtze River Sediments with Different Particle Sizes. Sustainability 2017, 9, 2089. https://doi.org/10.3390/su9112089
AMA Style
Fan J, Zhao G, Sun J. Binary Component Sorption of Cadmium, and Copper Ions onto Yangtze River Sediments with Different Particle Sizes. Sustainability. 2017; 9(11):2089. https://doi.org/10.3390/su9112089
Chicago/Turabian StyleFan, Jianxin, Guoliang Zhao, and Jiaoxia Sun. 2017. "Binary Component Sorption of Cadmium, and Copper Ions onto Yangtze River Sediments with Different Particle Sizes" Sustainability 9, no. 11: 2089. https://doi.org/10.3390/su9112089
Note that from the first issue of 2016, this journal uses article numbers instead of page numbers. See further details here.