Regional Economic Resilience: Resistance and Recoverability of Resource-Based Cities during Economic Crises in Northeast China


Abstract
1. Introduction
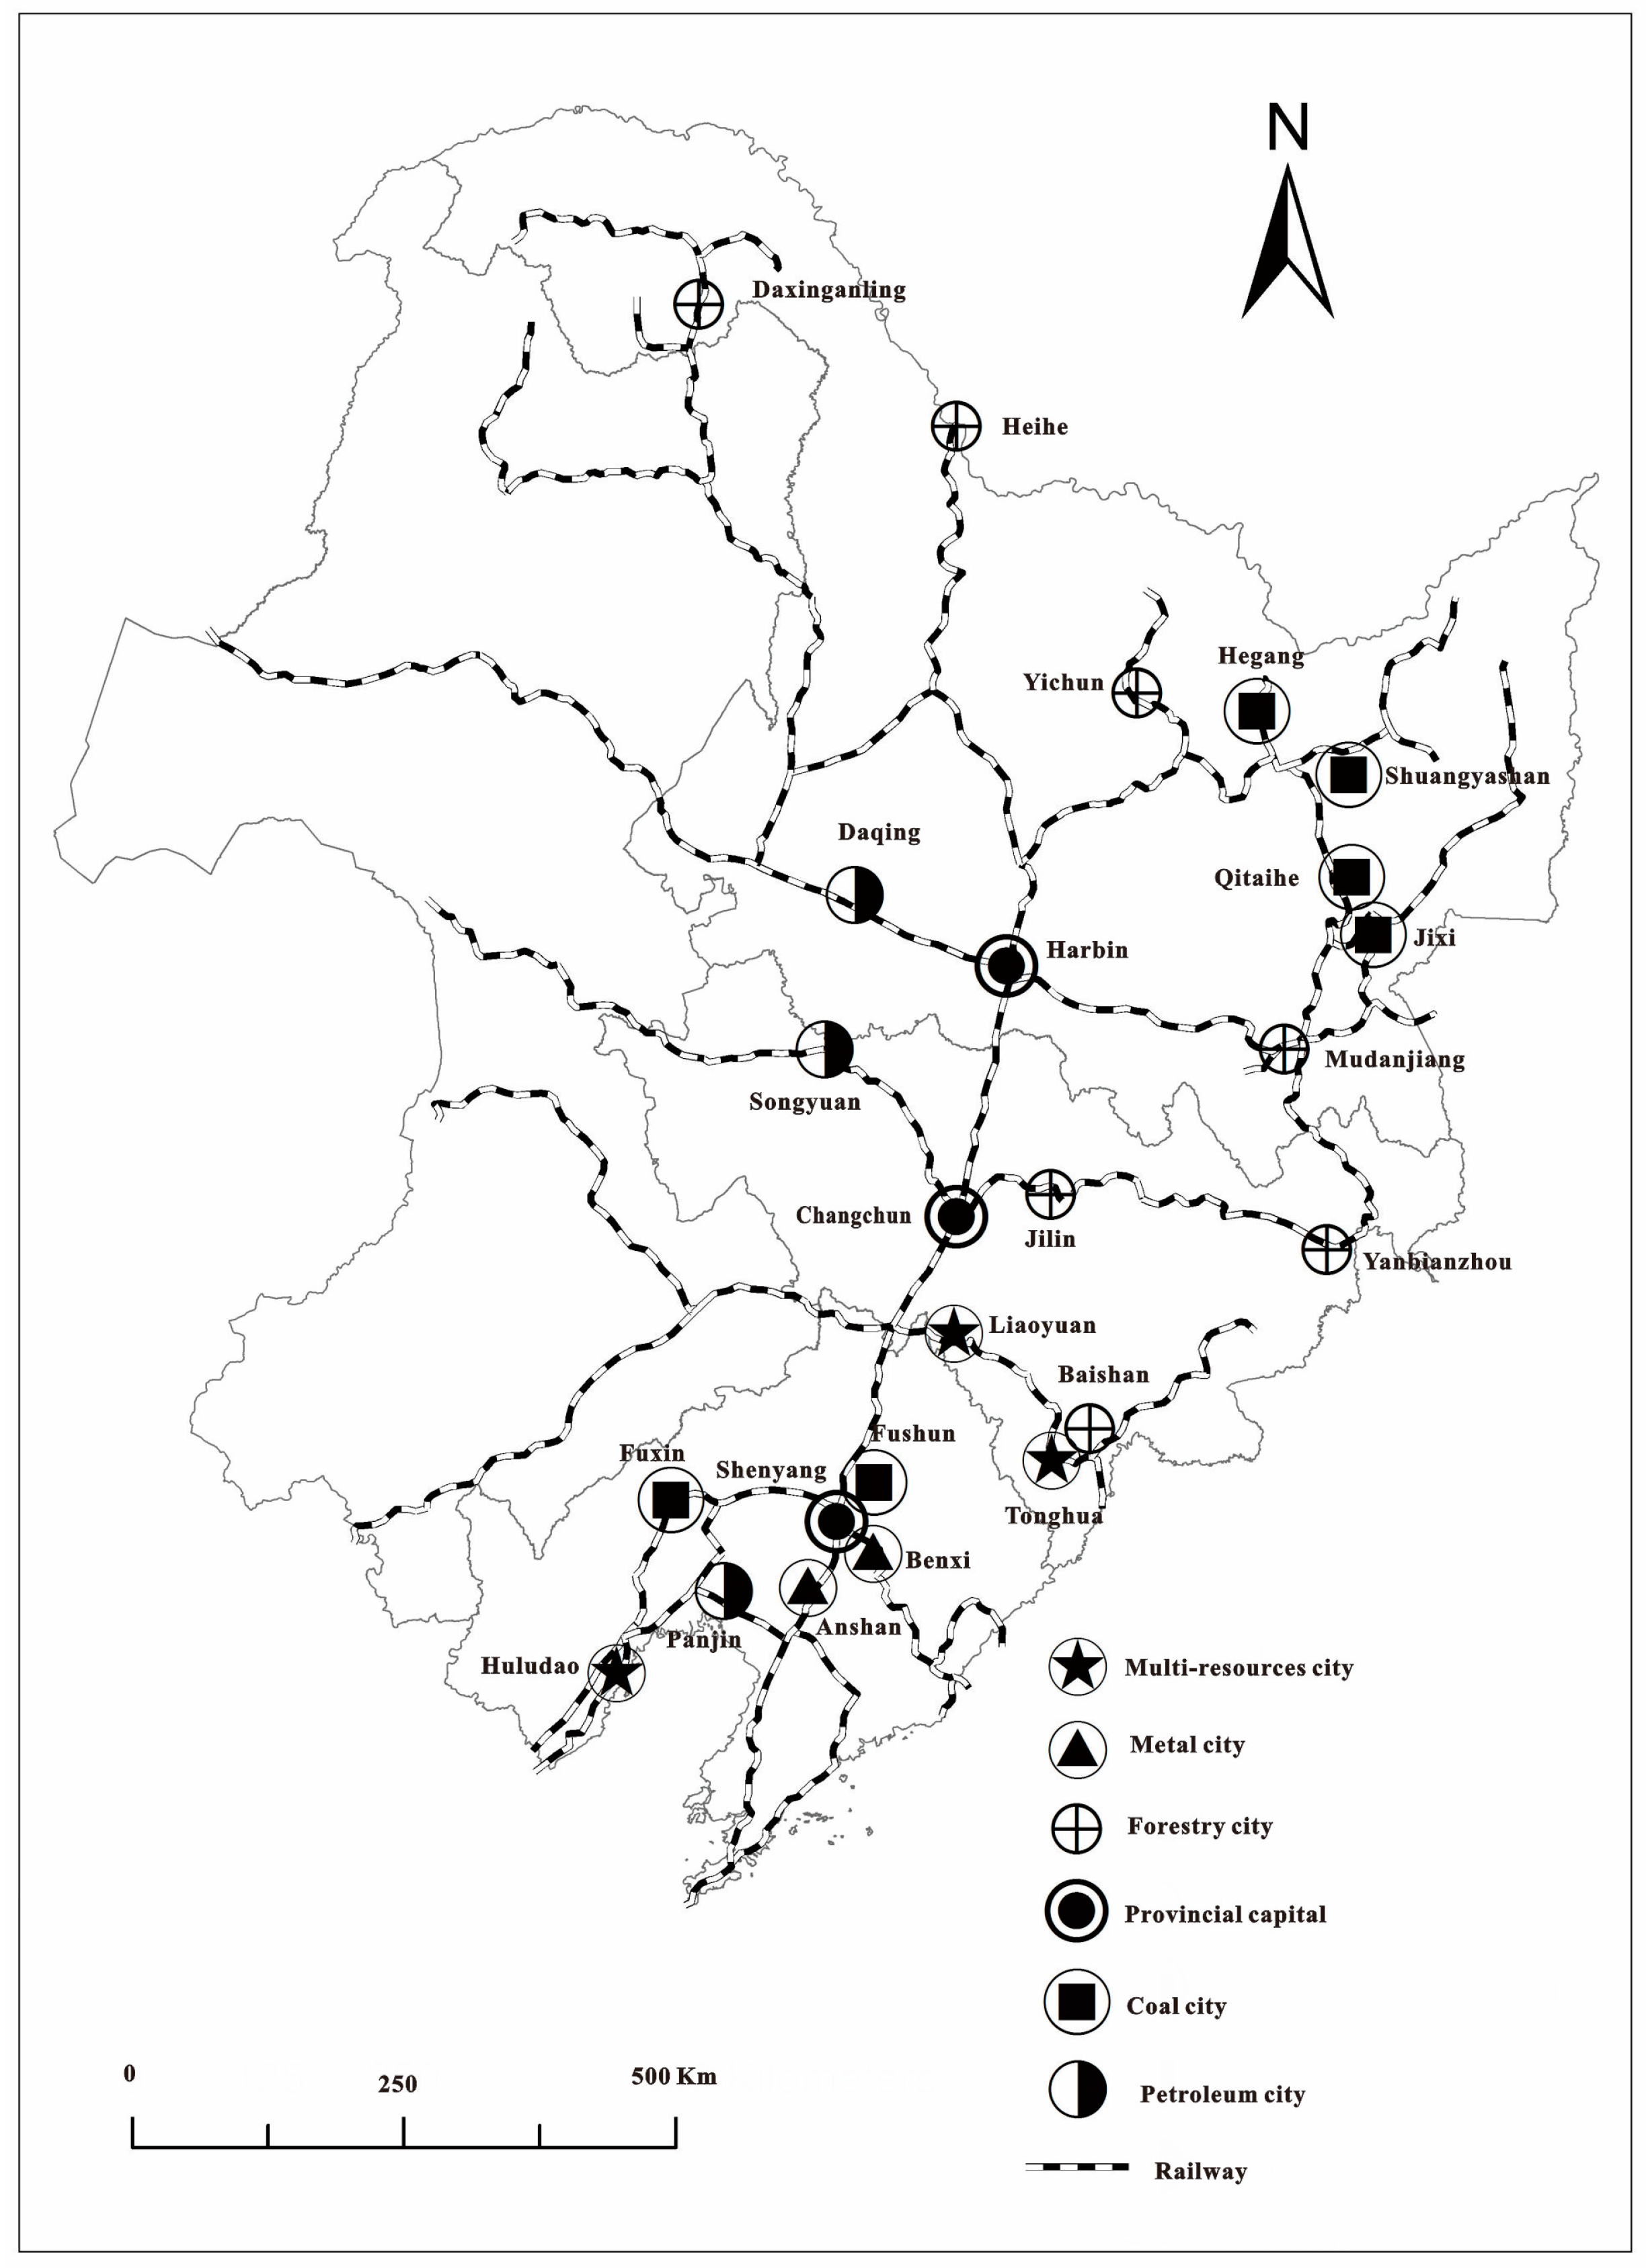
2. Study Area
3. The Resilience of RBCs to Major Recessions
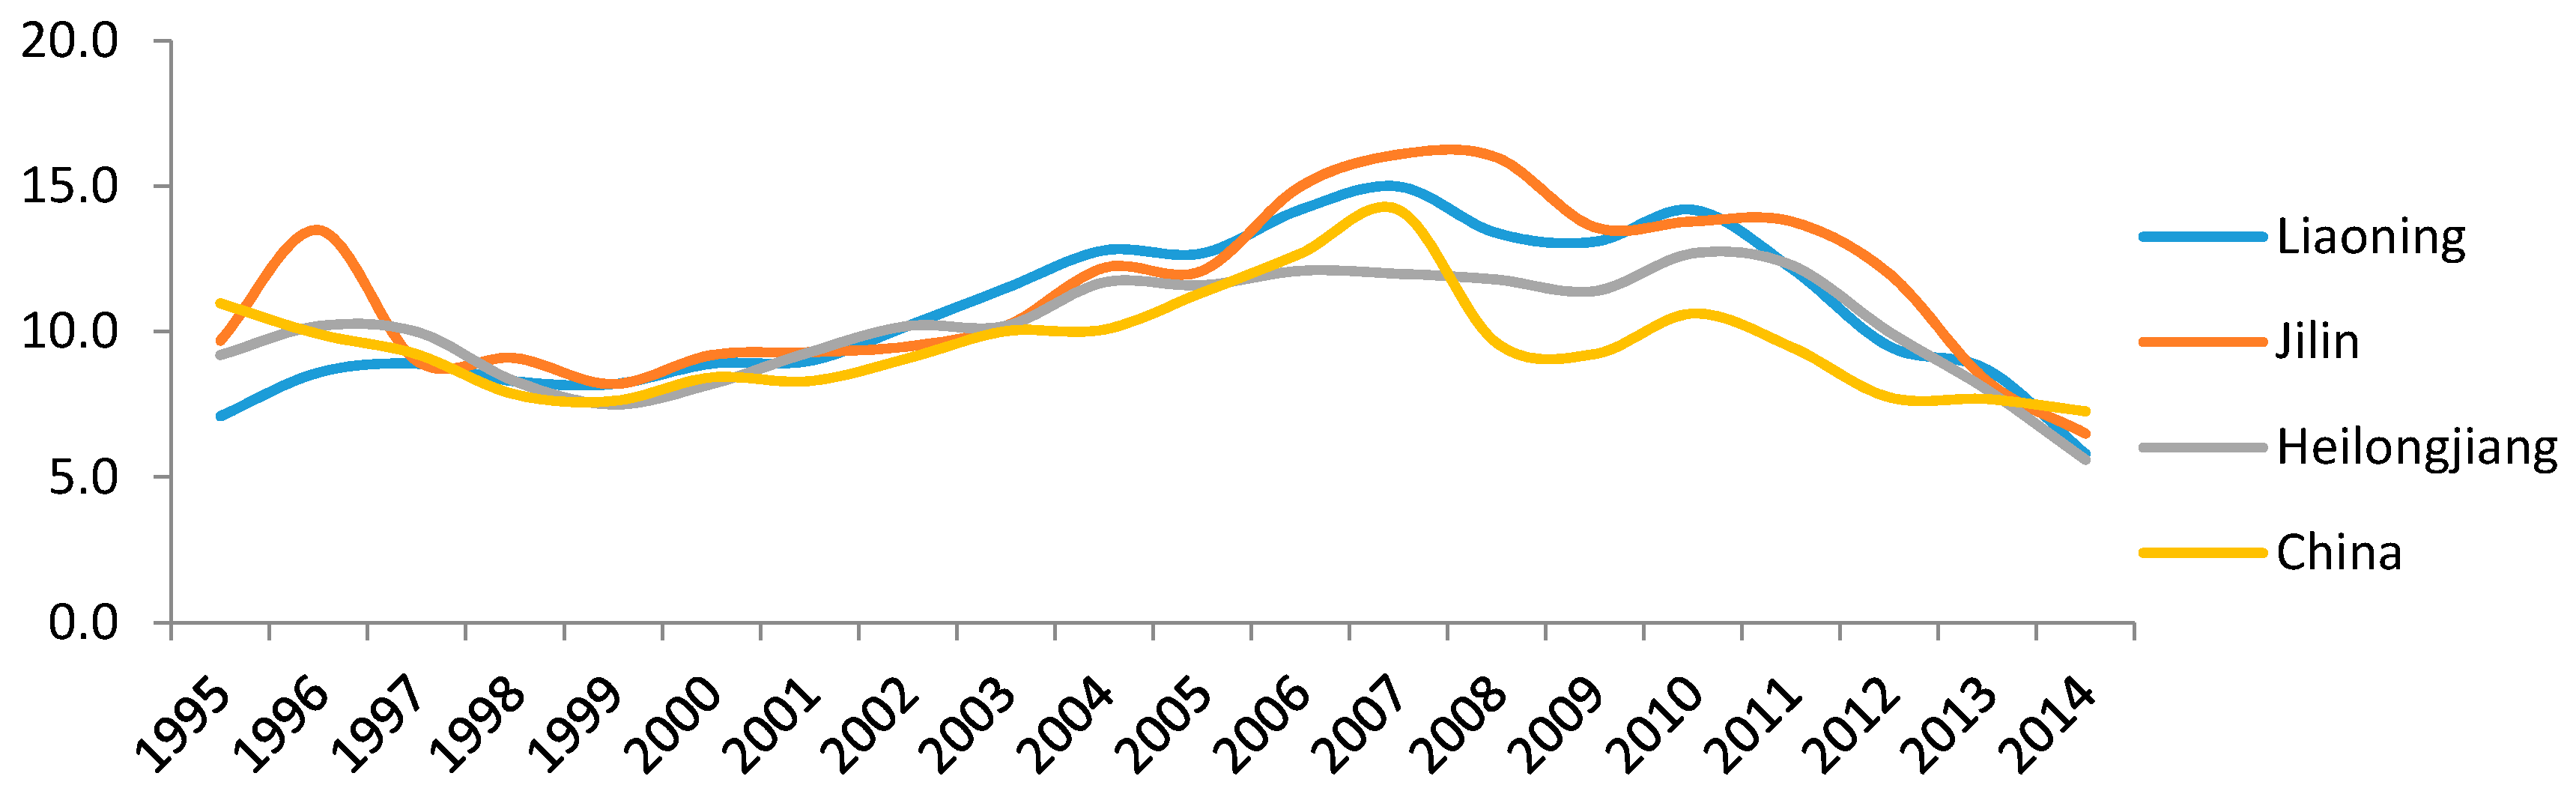
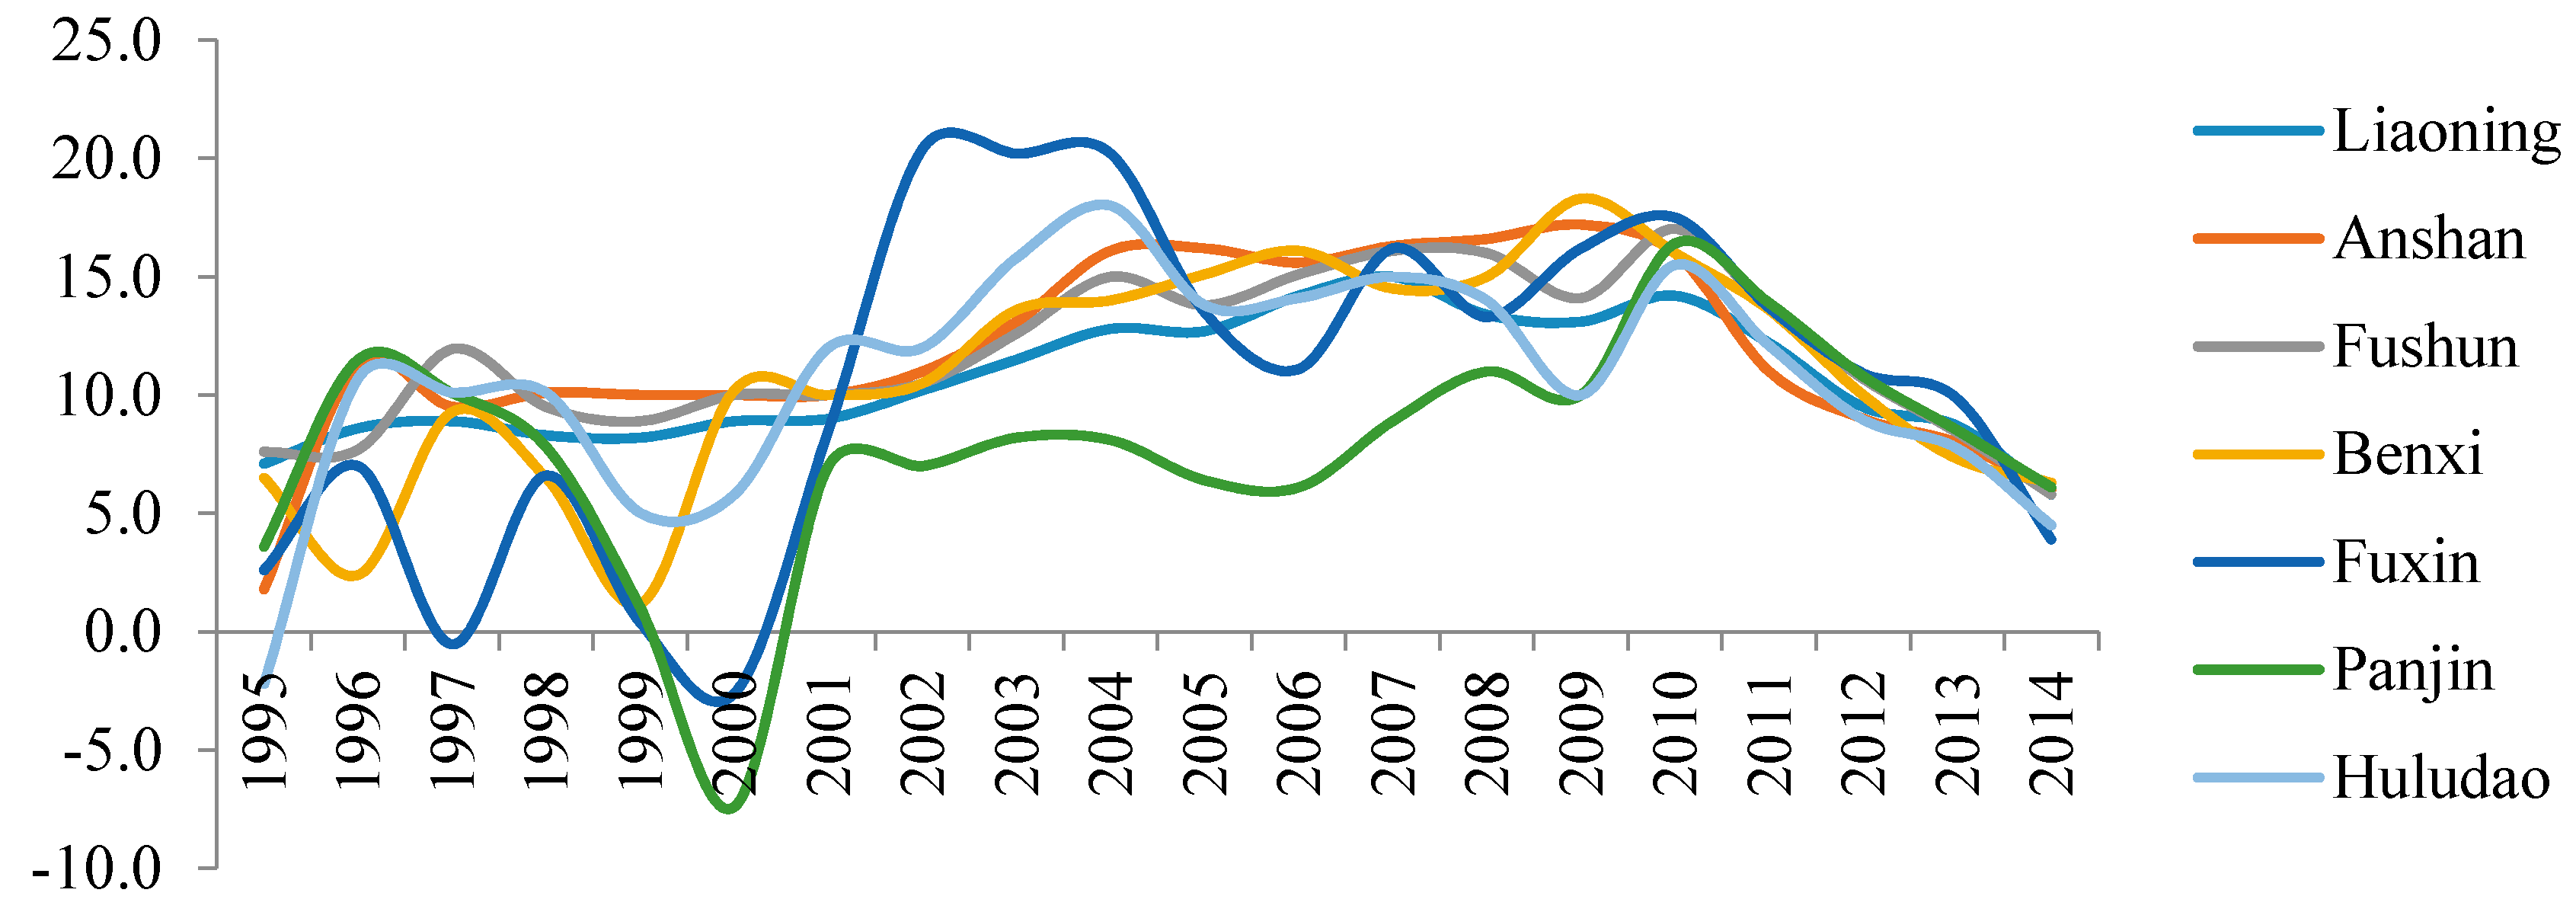
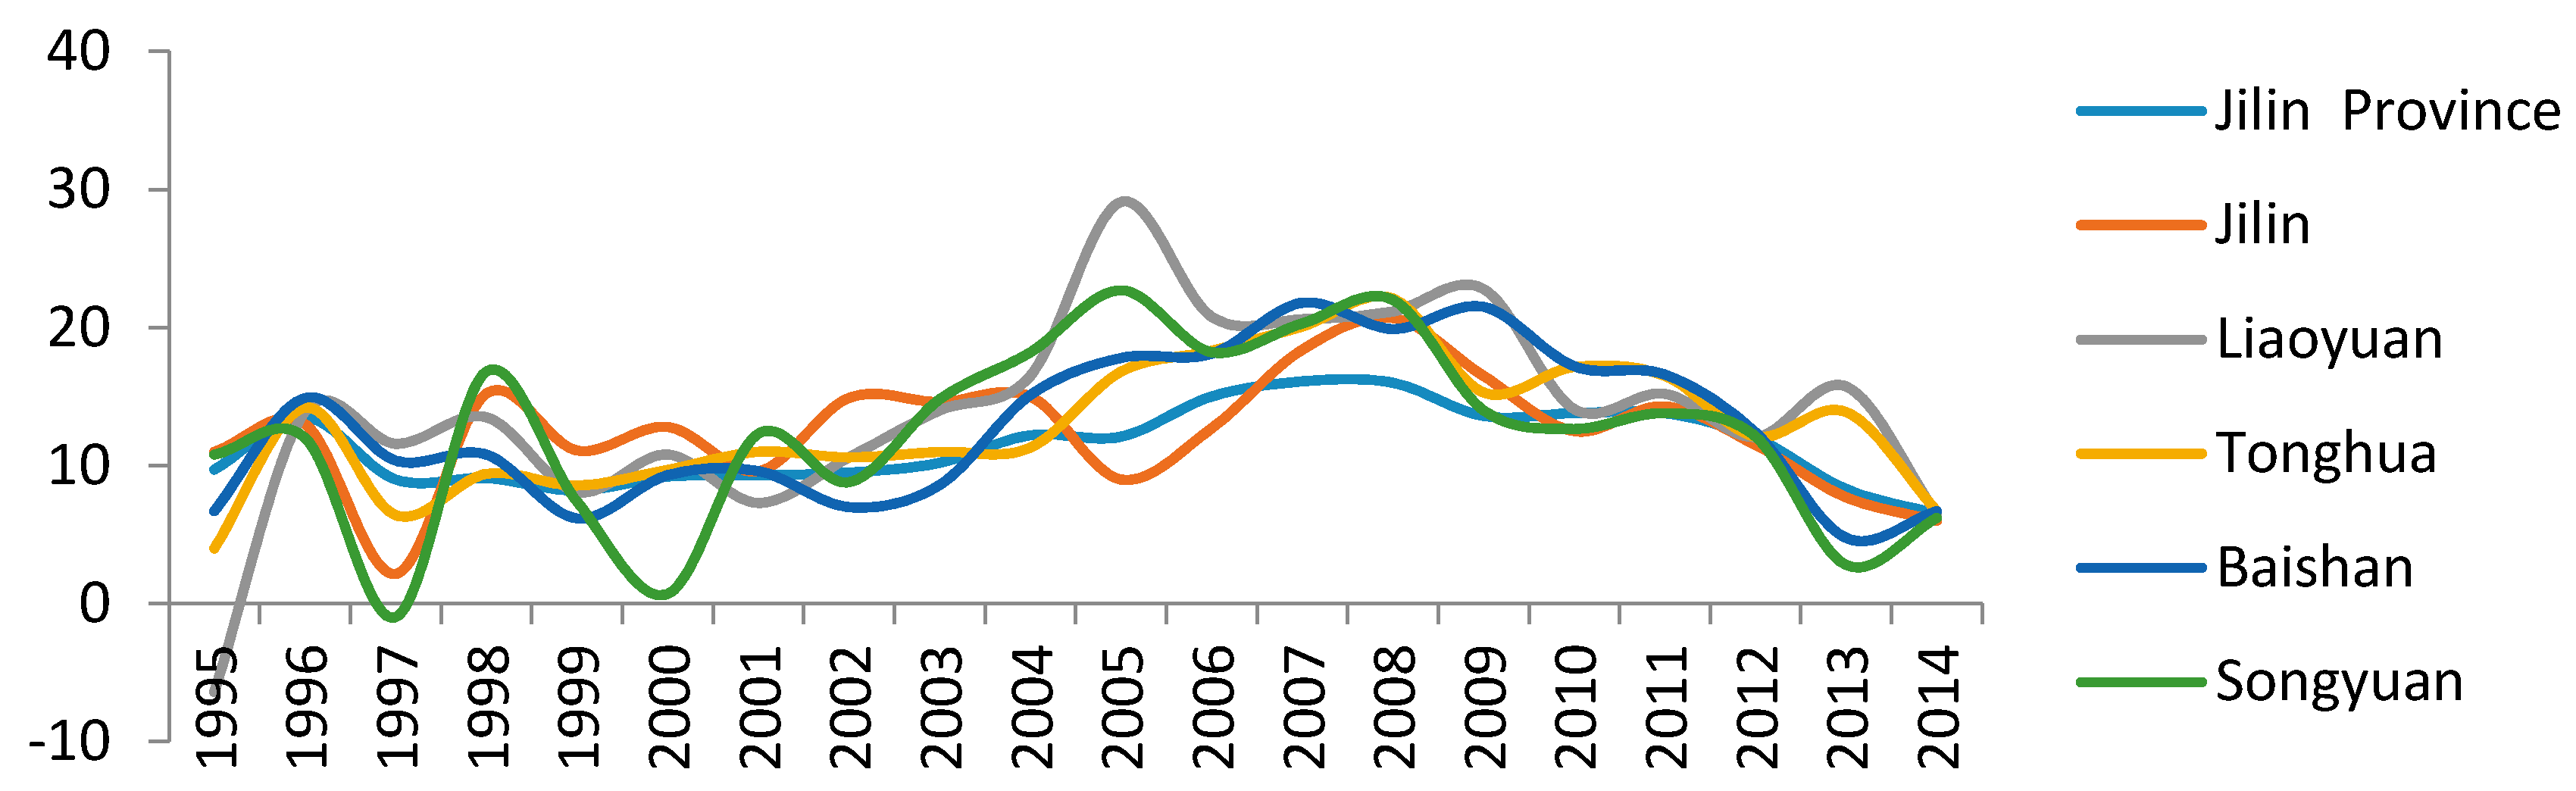
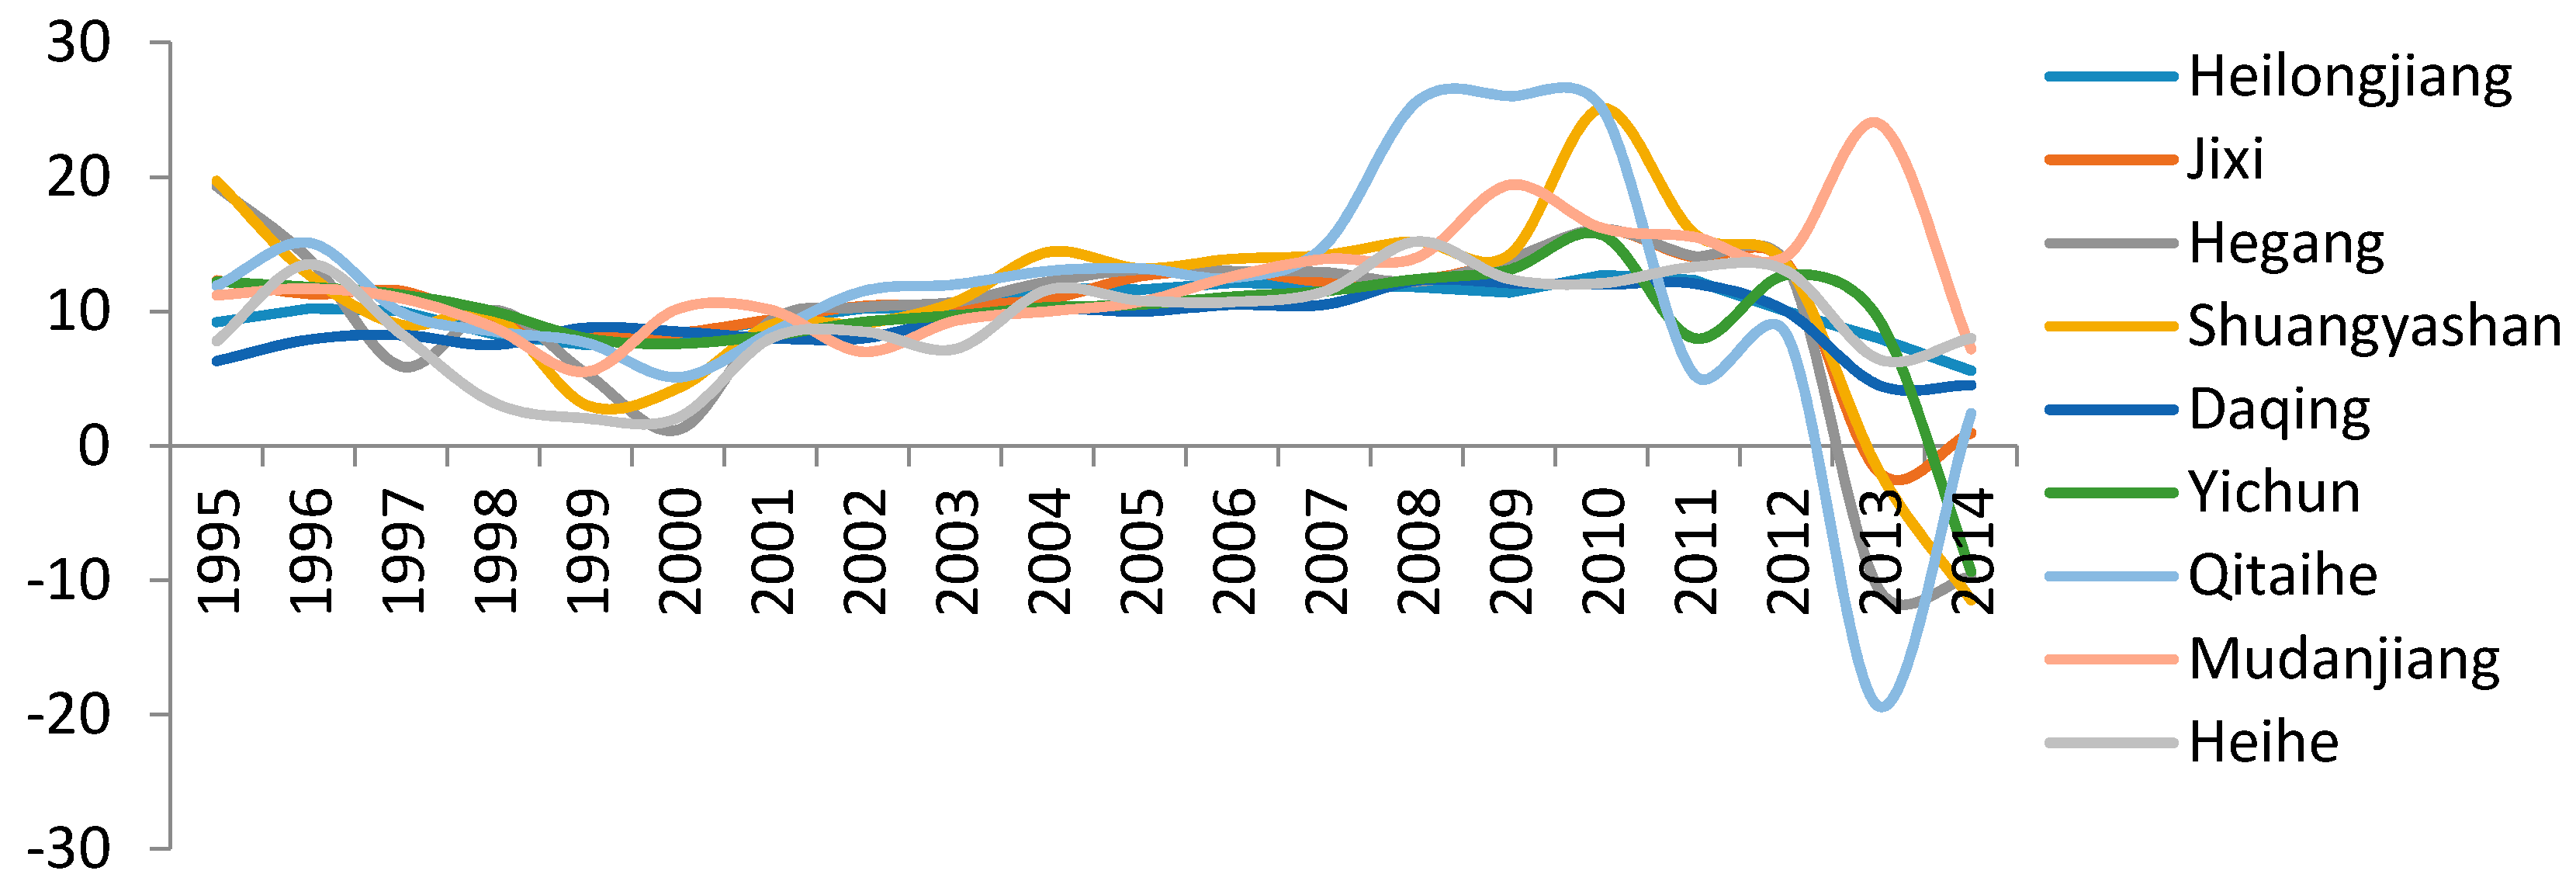
3.1. Major Recessionary Shocks
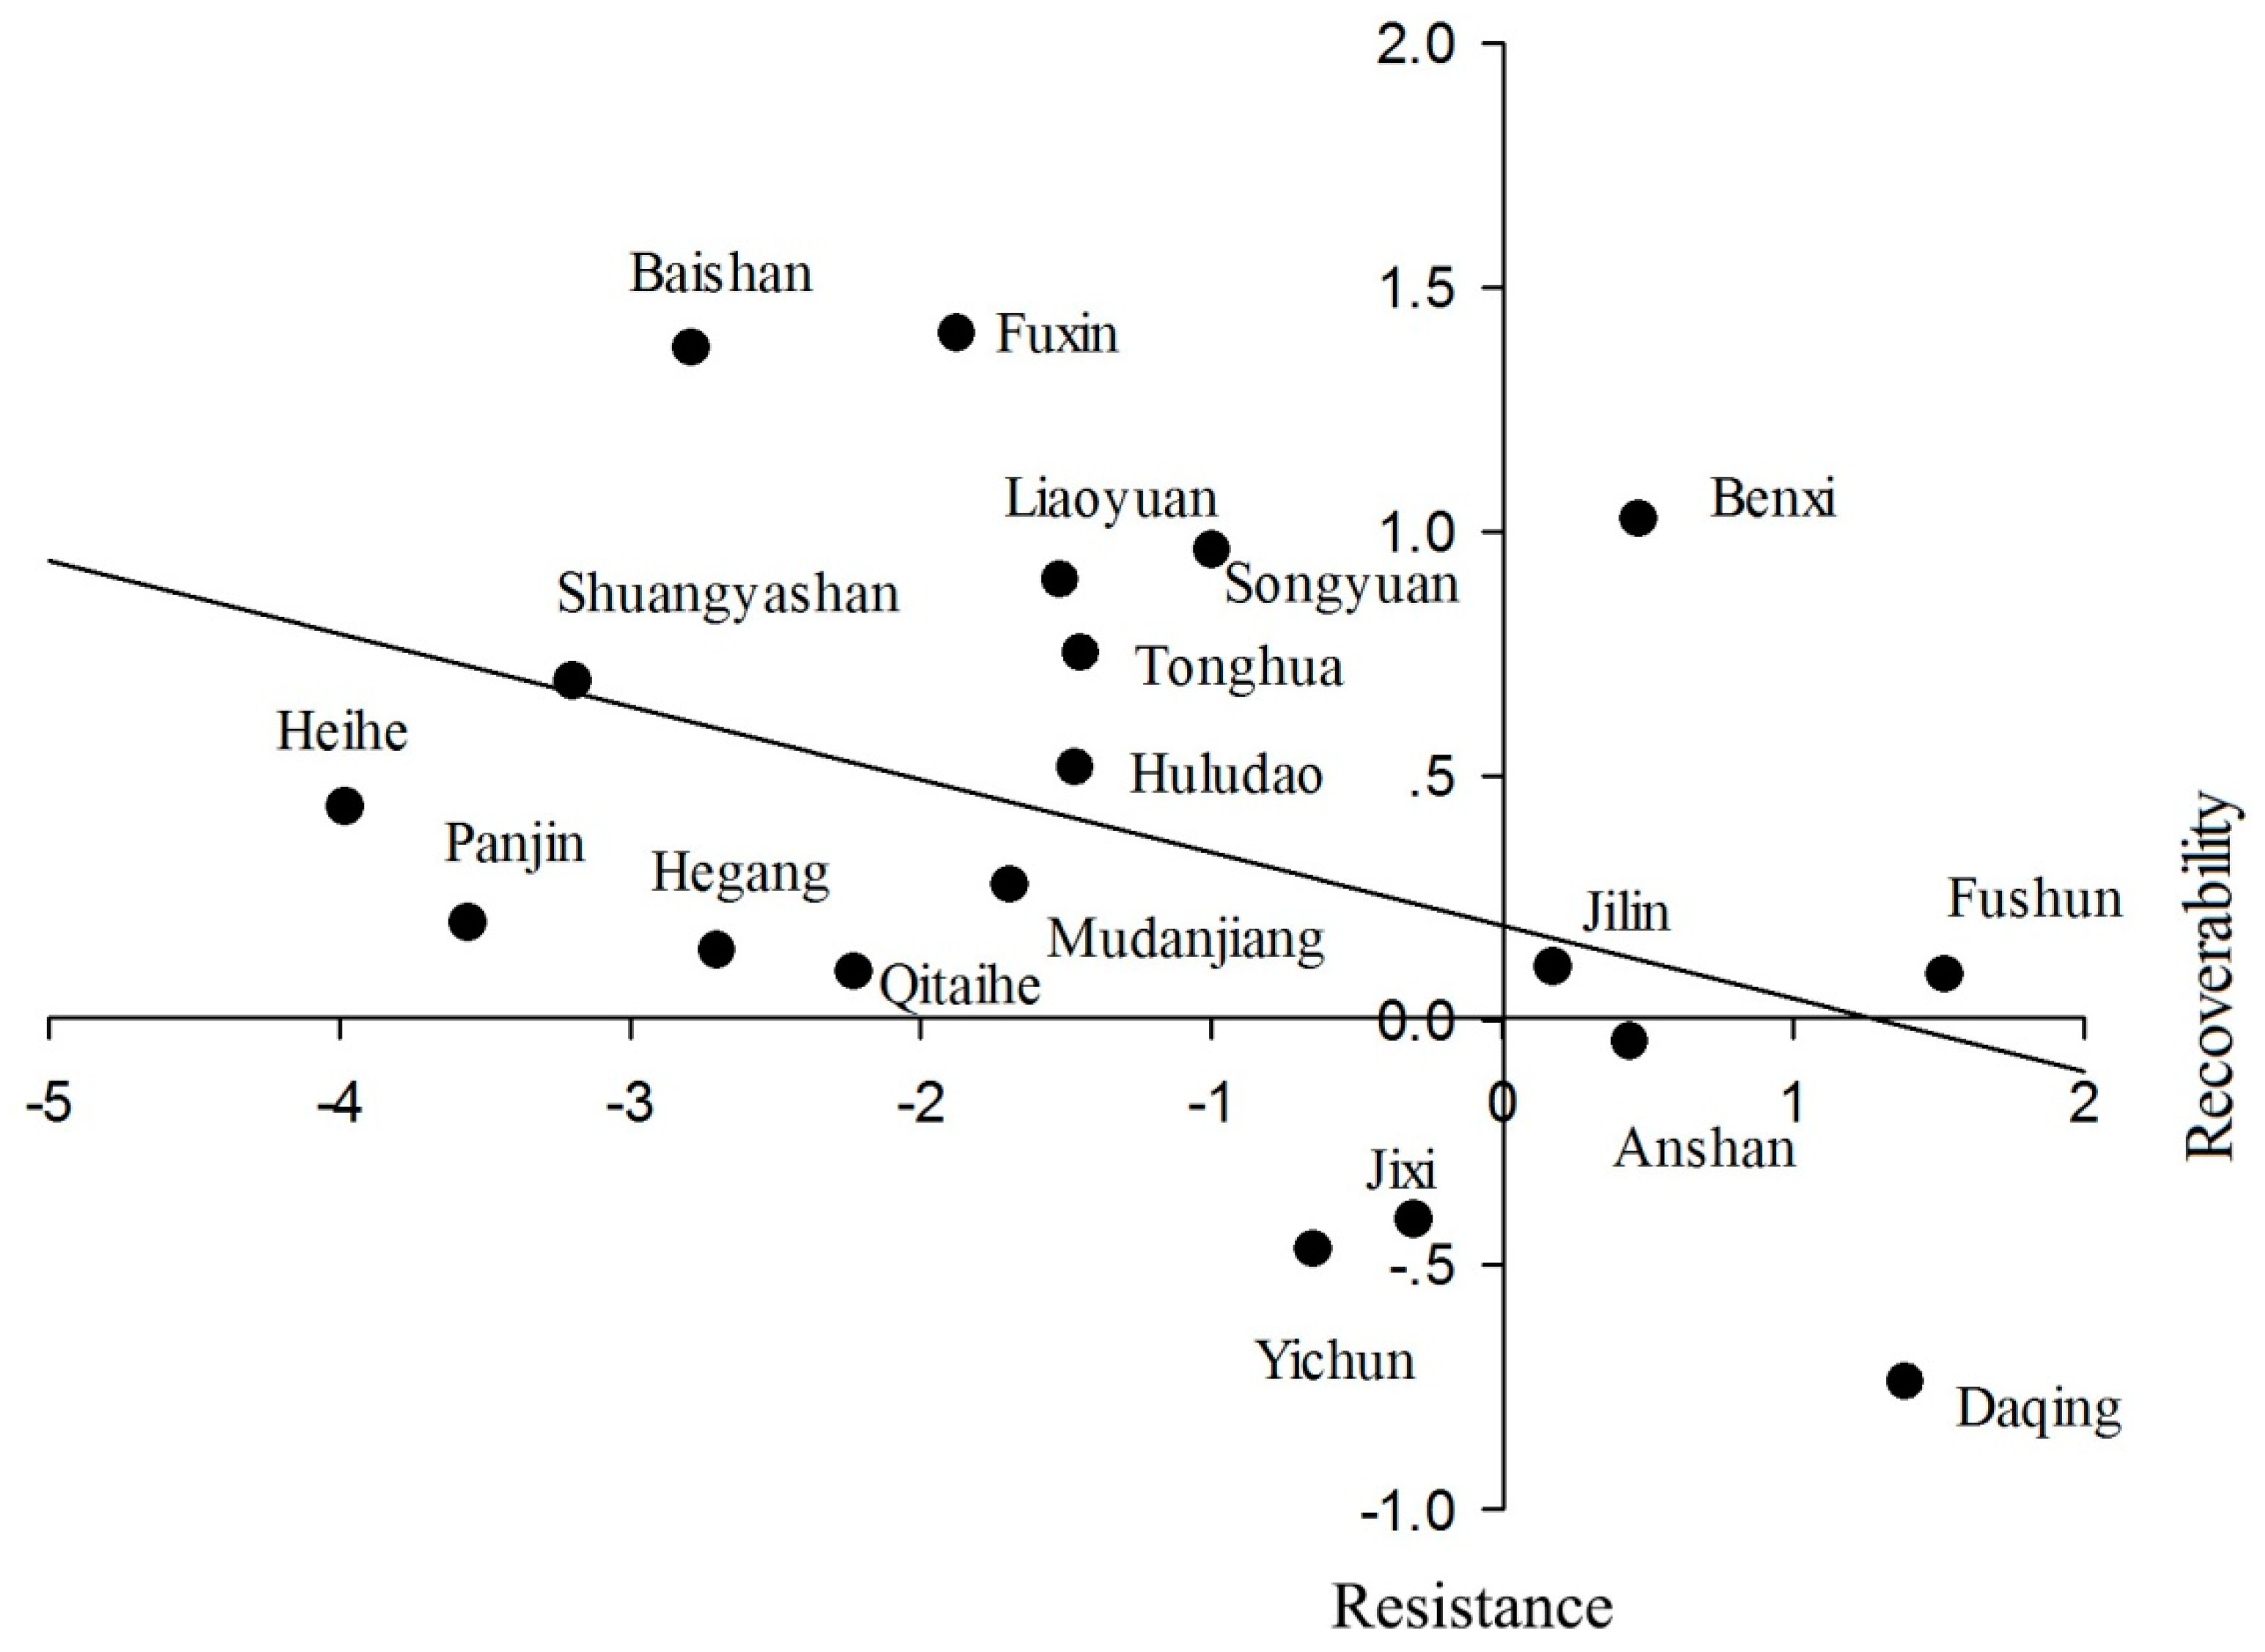
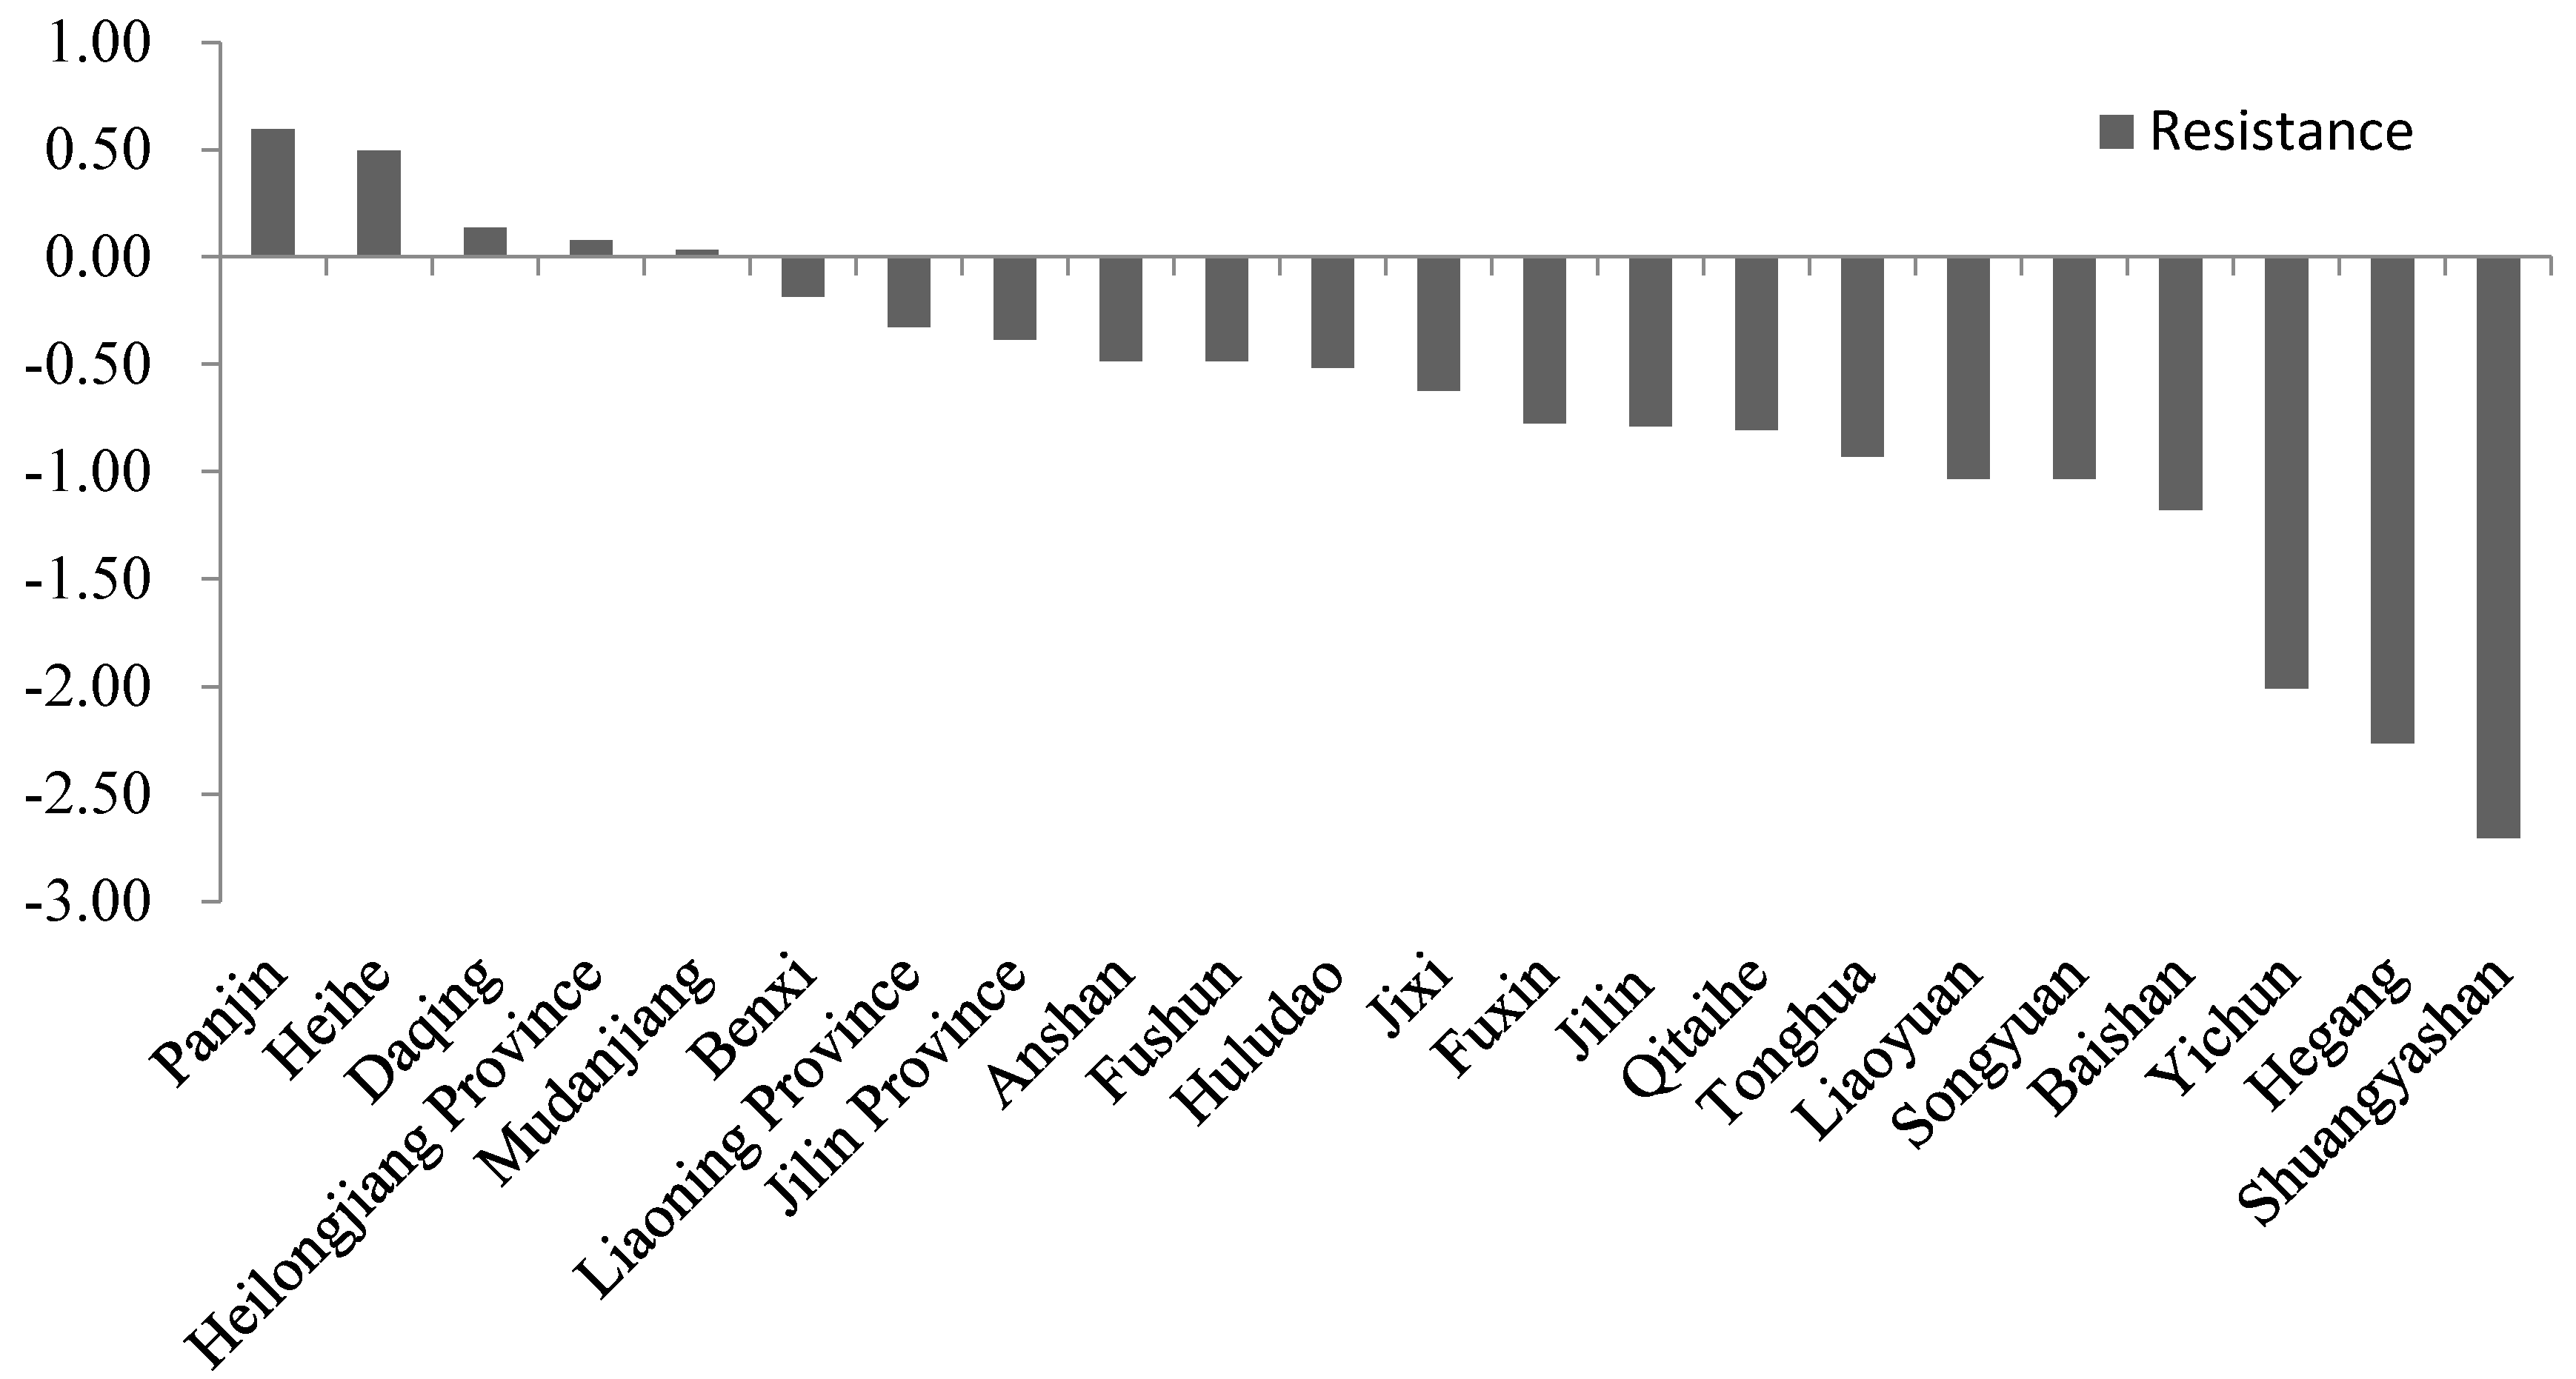
3.2. Measuring Resistance and Recoverability
4. Determinants of the Resilience of RBCs in Northeast China
4.1. Determinants of Regional Resilience
4.2. Geographical Detector
5. Discussion and Conclusions
5.1. Economic Resilience Characteristics of RBCs
5.2. Attributes of Resilience Vary across Different Economic Cycles
5.3. Industry Structure and Economic Resilience
5.4. Global Price, Resource Supply, and Economic Resilience
Acknowledgments
Author Contributions
Conflicts of Interest
References
- Sabatino, M. Economic crisis and resilience: Resilient capacity and competitiveness of the enterprises. J. Bus. Res. 2016, 69, 1924–1927. [Google Scholar] [CrossRef]
- Folke, C. Resilience: The emergence of a perspective for social-ecological systems analyses. Glob. Environ. Chang. 2006, 16, 253–267. [Google Scholar] [CrossRef]
- Xu, L.; Marinova, D.; Guo, X. Resilience thinking: A renewed system approach for sustainability science. Sustain. Sci. 2015, 10, 123–138. [Google Scholar] [CrossRef]
- Christopherson, S.; Michie, J.; Tyler, P. Regional resilience: Theoretical and empirical perspectives. Camb. J. Reg. Econ. Soc. 2010, 3, 3–10. [Google Scholar] [CrossRef]
- Balsas, C.J.L. Downtown resilience: A review of recent (re)developments in Tempe, Arizona. Cities 2014, 36, 158–169. [Google Scholar] [CrossRef]
- Weichselgartner, J.; Kelman, I. Geographies of resilience Challenges and opportunities of a descriptive concept. Prog. Hum. Geogr. 2015, 39, 249–267. [Google Scholar] [CrossRef]
- Martin, R. Regional economic resilience, hysteresis and recessionary shocks. J. Econ. Geogr. 2012, 12, 1–32. [Google Scholar] [CrossRef]
- Gallopín, G.C. Linkages between vulnerability, resilience, and adaptive capacity. Glob. Environ. Chang. 2006, 16, 293–303. [Google Scholar] [CrossRef]
- Simmie, J.; Martin, R. The economic resilience of regions: Towards an evolutionary approach. Camb. J. Reg. Econ. Soc. 2010, 3, 27–43. [Google Scholar] [CrossRef]
- Eraydin, A. Attributes and characteristics of regional resilience: Defining and measuring the resilience of Turkish regions. Reg. Stud. 2016, 50, 600–614. [Google Scholar] [CrossRef]
- Davoudi, S. Resilience: A bridging concept or a dead end? Plan. Theory Pract. 2012, 13, 299–307. [Google Scholar] [CrossRef]
- Hassink, R. Regional resilience: A promising concept to explain differences in regional economic adaptability? Camb. J. Reg. Econ. Soc. 2010, 3, 45–58. [Google Scholar] [CrossRef]
- Martin, R.; Sunley, P.; Gardiner, B.; Tyler, P. How regions react to recessions: Resilience and the role of economic structure. Reg. Stud. 2016, 50, 561–585. [Google Scholar] [CrossRef]
- Di Caro, P. Recessions, recoveries and regional resilience: Evidence on Italy. Camb. J. Reg. Econ. Soc. 2015, 8, 273–291. [Google Scholar] [CrossRef]
- Sensier, M.; Artis, M. The resilience of employment in Wales: Through recession and into recovery. Reg. Stud. 2016, 50, 586–599. [Google Scholar] [CrossRef]
- Pendall, R.; Foster, K.A.; Cowell, M. Resilience and regions: Building understanding of the metaphor. Camb. J. Reg. Econ. Soc. 2010, 3, 71–84. [Google Scholar] [CrossRef]
- Fingleton, B.; Garretsen, H.; Martin, R. Recessionary shocks and regional employment: Evidence on the resilience of UK regions. J. Reg. Sci. 2012, 52, 109–133. [Google Scholar] [CrossRef]
- Cellini, R.; Torrisi, G. Regional resilience in Italy: A very long-run analysis. Reg. Stud. 2014, 48, 1779–1796. [Google Scholar] [CrossRef]
- Davies, S. Regional resilience in the 2008–2010 downturn: Comparative evidence from European countries. Camb. J. Reg. Econ. Soc. 2011, 4, 369–382. [Google Scholar] [CrossRef]
- Courvisanos, J.; Jain, A.K.; Mardaneh, K. Economic resilience of regions under crises: A study of the Australian economy. Reg. Stud. 2016, 50, 629–643. [Google Scholar] [CrossRef]
- Dubé, J.; PolèSe, M. Resilience revisited: Assessing the impact of the 2007–2009 recession on 83 Canadian regions with accompanying thoughts on an elusive concept. Reg. Stud. 2016, 50, 615–628. [Google Scholar] [CrossRef]
- Doran, J.; Fingleton, B. Employment resilience in Europe and the 2008 economic crisis: Insights from micro-level data. Reg. Stud. 2016, 50, 644–656. [Google Scholar] [CrossRef]
- Tan, J.; Zhang, P.; Lo, K.; Li, J.; Liu, S. Conceptualizing and measuring economic resilience of resource-based cities: Case study of Northeast China. Chin. Geogr. Sci. 2017, 27, 471–481. [Google Scholar] [CrossRef]
- Hu, X.; Hassink, R. Exploring adaptation and adaptability in uneven economic resilience: A tale of two Chinese mining regions. Camb. J. Reg. Econ. Soc. 2017, 10, 527–541. [Google Scholar] [CrossRef]
- Hu, X. State-led path creation in China’s rustbelt: The case of Fuxin. Reg. Stud. Reg. Sci. 2014, 1, 294–300. [Google Scholar] [CrossRef]
- Desrochers, P.; Leppälä, S. Opening up the ‘Jacobs Spillovers’ black box: Local diversity, creativity and the processes underlying new combinations. J. Econ. Geogr. 2011, 11, 843–863. [Google Scholar] [CrossRef]
- Davies, A.; Tonts, M. Economic diversity and regional socioeconomic performance: An empirical analysis of the Western Australian grain belt. Geogr. Res. 2010, 48, 223–234. [Google Scholar] [CrossRef]
- Boschma, R. Towards an evolutionary perspective on regional resilience. Reg. Stud. 2015, 49, 733–751. [Google Scholar] [CrossRef]
- Li, H.; Long, R.; Chen, H. Economic transition policies in Chinese resource-based cities: An overview of government efforts. Energy Policy 2013, 55, 251–260. [Google Scholar] [CrossRef]
- Gong, H.; Hassink, R. Regional resilience: The critique revisited. In Creating Resilient Economies: Entrepreneurship, Growth and Development in Uncertain Times; Tim, V., Nick, W., Eds.; Edward Elgar: Cheltenham Glos, UK, 2016. [Google Scholar]
- Evenhuis, E. New directions in researching regional economic resilience and adaptation. Geogr. Compass 2017, e12333. [Google Scholar] [CrossRef]
- Bristow, G.; Healy, A. Regional resilience: An agency perspective. Reg. Stud. 2014, 48, 923–935. [Google Scholar] [CrossRef]
- Huang, Z. Study on China’s Economic Cycle and Macro-Control Efforts in 30 Years of Reform and Opening-up. J. Financ. Econ. 2008, 34, 88–100. [Google Scholar]
- Yu, H. The ascendency of state-owned enterprises in China: Development, controversy and problems. J. Contemp. China 2014, 23, 161–182. [Google Scholar] [CrossRef]
- Holz, C.A. The quality of China’s GDP statistics. China Econ. Rev. 2014, 30, 309–338. [Google Scholar] [CrossRef]
- Martin, R.; Sunley, P.; Tyler, P. Local growth evolutions: Recession, resilience and recovery. Camb. J. Reg. Econ. Soc. 2015, 8, 141–148. [Google Scholar] [CrossRef]
- Lagravinese, R. Economic crisis and rising gaps North-South: Evidence from the Italian regions. Camb. J. Reg. Econ. Soc. 2015, 8, 331–342. [Google Scholar] [CrossRef]
- Pike, A.; Marlow, D.; McCarthy, A.; O’Brien, P.; Tomaney, J. Local institutions and local economic development: The Local Enterprise Partnerships in England, 2010–. Camb. J. Reg. Econ. Soc. 2015, 8, 185–204. [Google Scholar] [CrossRef]
- Brakman, S.; Garretsen, H.; van Marrewijk, C. Regional resilience across Europe: On urbanization and the initial impact of the Great Recession. Camb. J. Reg. Econ. Soc. 2015, 8, 225–240. [Google Scholar] [CrossRef]
- Mason, C.; Brown, R.; Hart, M.; Anyadike-Danes, M. High growth firms, jobs and peripheral regions: The case of Scotland. Camb. J. Reg. Econ. Soc. 2015, 343–358. [Google Scholar] [CrossRef]
- Wang, J.F.; Li, X.H.; Christakos, G.; Liao, Y.L.; Zhang, T.; Gu, X.; Zheng, X.Y. Geographical detectors-based health risk assessment and its application in the neural tube defects study of the Heshun Region, China. Int. J. Geogr. Inf. Sci. 2010, 24, 107–127. [Google Scholar] [CrossRef]
- Hu, Y.; Wang, J.; Li, X.; Ren, D.; Zhu, J. Geographical detector-based risk assessment of the under-five mortality in the 2008 Wenchuan earthquake, China. PLoS ONE 2011, 6, 1–8. [Google Scholar] [CrossRef] [PubMed]
- Ding, Y.; Cai, J.; Ren, Z.; Yang, Z. Spatial disparities of economic growth rate of China’s National-level ETDZs and their determinants based on geographical detector analysis. Prog. Geogr. 2014, 33, 657–666. [Google Scholar]
- Li, H.; Zhang, P.; Cheng, Y. Economic vulnerability of mining city—A case study of Fuxin City, Liaoning Province, China. Chin. Geogr. Sci. 2009, 19, 211–218. [Google Scholar] [CrossRef]
- Su, F.; Zhang, P.; Li, H. Vulnerability assessment of coal-mining cities’ economic systems in China. Geogr. Res. 2008, 27, 907–916. [Google Scholar]
- Duranton, G.; Puga, D. Diversity and specialisation in cities: Why, where and when does it matter? Urban Stud. 2000, 37, 533–555. [Google Scholar] [CrossRef]
- Bridges, B. Europe and the Asian financial crisis: Coping with contagion. Asian Surv. 1999, 39, 456–467. [Google Scholar] [CrossRef]
- Chan, KW. The global financial crisis and migrant workers in China: ‘There is no future as a labourer; returning to the village has no meaning’. Int. J. Urban Reg. Res. 2010, 34, 659–677. [Google Scholar] [CrossRef]
- Li, H.; Lo, K.; Wang, M. Economic transformation of mining cities in transition economies: Lessons from Daqing, Northeast China. Int. Dev. Plan. Rev. 2015, 37, 311–328. [Google Scholar] [CrossRef]


| Recession (1996–1999) | Recovery (1999–2007) | Recession (2007–2014) | |
|---|---|---|---|
| Multi-resource | −1.48 | 0.72 | −0.83 |
| Petroleum | −1.06 | 0.14 | −0.10 |
| Metal | 0.45 | 0.49 | −0.33 |
| Coal | −1.46 | 0.34 | −1.28 |
| Forestry | −1.79 | 0.35 | −0.69 |
| Resistance (1997–1999) | Recoverability (1999–2007) | Resistance (2007–2014) | ||||
|---|---|---|---|---|---|---|
| Secondary Industry | Tertiary Industry | Secondary Industry | Tertiary Industry | Secondary Industry | Tertiary Industry | |
| Anshan | 1.15 | −0.6 | 2.04 | −0.58 | −0.74 | 0.22 |
| Fushun | 0.82 | 3.5 | 1.15 | −0.39 | −0.63 | 0 |
| Benxi | 1.94 | −2.8 | 3.46 | 0.23 | −0.17 | 0.05 |
| Fuxin | 2.04 | −2.8 | 0.45 | 0.43 | −0.83 | −0.11 |
| Panjin | −0.27 | −0.6 | −1.05 | −0.74 | 0.7 | 0.22 |
| Huludao | −1.03 | 3.8 | 0.59 | −0.61 | −0.5 | −0.16 |
| Jilin | 1.44 | 0.32 | 0.81 | 0.53 | −0.92 | −0.62 |
| Liaoyuan | −6.23 | −4.43 | 0.27 | 0.74 | −1.7 | −0.36 |
| Tonghua | 1.49 | 3.92 | 0.53 | 0.42 | −1.32 | −0.53 |
| Baishan | 0.99 | −10.9 | 0.4 | 1.62 | −1.66 | −0.68 |
| Songyuan | 2.05 | 13.09 | 1.1 | −0.03 | −1.58 | −1.42 |
| Jixi | 0.16 | −3.7 | 0.35 | −0.71 | −2.12 | 0.31 |
| Hegang | −0.87 | −3.6 | 1.12 | −0.37 | −1.47 | −0.36 |
| Shuangyashan | −1.48 | −4.3 | 0.43 | −0.37 | −3.56 | −0.86 |
| Daqing | 1 | 1.5 | 0.49 | −1.12 | −5.42 | −1.19 |
| Yichun | 0.44 | −10.5 | −0.65 | 0.86 | 0.18 | −0.09 |
| Qitaihe | −1 | −5.3 | −5.2 | −0.84 | −3.59 | −1.29 |
| Mudanjiang | 1 | −2.6 | 11.59 | −0.69 | −1.13 | −0.54 |
| Heihe | −1.91 | 3.5 | 0.44 | −1.13 | −0.4 | 0.49 |
| Urban | Supporting Policies | Assigned Value |
|---|---|---|
| Anshan, Benxi, Songyuan, Jixi, Mudanjiang | Policy support for general resource-based cities | 1 |
| Hegang, Shuangyashan | Policy support for third batch of resource-exhausted cities | 2 |
| Tonghua (Erdaojiang district) | Policy support for third batch of resource-exhausted districts | 2 |
| Fushun, Qitaihe | Policy support for second batch of resource-exhausted cities | 3 |
| Jilin (Shulan), Heihe (Wudalianchi) | Policy support for second batch of resource-exhausted counties | 3 |
| Huludao (Nanpiao district) | Policy support for second batch of resource-exhausted districts | 3 |
| Daqing | Policy support for experimental resource-based cities for economic transition | 4 |
| Fuxin, Panjin, Liaoyuan, Baishan, Yichun | Policy support for experimental resource-based cities for economic transition and first batch of resource-exhausted cities | 4 |
| Factors | PD,U | |||
|---|---|---|---|---|
| Resistance (1997–1999) | Recoverability (1999–2008) | Resistance (2008–2014) | ||
| Urban Development | Location (X1) | 0.544 | 0.279 | 0.175 |
| Resource availability (X2) | 0.132 | −0.191 | 0.502 | |
| Urban scale (X3) | 0.724 | −0.330 | 0.323 | |
| Economic basis (X4) | 0.178 | −0.357 | −0.295 | |
| Industrial Structure | Industrial specialization (X5) | −0.219 | 0.205 | 0.159 |
| Proportion of tertiary industry (X6) | −0.296 | −0.350 | 0.307 | |
| R & D intensity (X7) | 0.171 | 0.295 | 0.249 | |
| Proportion of employed persons in resource industries (X8) | −0.182 | −0.132 | −0.102 | |
| Labor Condition | Unemployment rate (X9) | −0.249 | 0.242 | −0.499 |
| Proportion of employee for scientific research and technical services (X10) | 0.441 | −0.460 | 0.212 | |
| Financial Arrangement | Foreign trade dependence ratio (X11) | 0.151 | 0.119 | 0.312 |
| Cumulative per capita fiscal revenue (X12) | 0.511 | −0.190 | 0.299 | |
| Governance | Policy support (X13) | -- | 0.057 | 0.497 |
| Cumulative per capita investment in fixed assets (X14) | 0.213 | −0.427 | 0.251 | |
© 2017 by the authors. Licensee MDPI, Basel, Switzerland. This article is an open access article distributed under the terms and conditions of the Creative Commons Attribution (CC BY) license (http://creativecommons.org/licenses/by/4.0/).
Share and Cite
Tan, J.; Lo, K.; Qiu, F.; Liu, W.; Li, J.; Zhang, P. Regional Economic Resilience: Resistance and Recoverability of Resource-Based Cities during Economic Crises in Northeast China. Sustainability 2017, 9, 2136. https://doi.org/10.3390/su9122136
Tan J, Lo K, Qiu F, Liu W, Li J, Zhang P. Regional Economic Resilience: Resistance and Recoverability of Resource-Based Cities during Economic Crises in Northeast China. Sustainability. 2017; 9(12):2136. https://doi.org/10.3390/su9122136
Chicago/Turabian StyleTan, Juntao, Kevin Lo, Fangdao Qiu, Wenxin Liu, Jing Li, and Pingyu Zhang. 2017. "Regional Economic Resilience: Resistance and Recoverability of Resource-Based Cities during Economic Crises in Northeast China" Sustainability 9, no. 12: 2136. https://doi.org/10.3390/su9122136
APA StyleTan, J., Lo, K., Qiu, F., Liu, W., Li, J., & Zhang, P. (2017). Regional Economic Resilience: Resistance and Recoverability of Resource-Based Cities during Economic Crises in Northeast China. Sustainability, 9(12), 2136. https://doi.org/10.3390/su9122136