Synergetic Development Assessment of Urban River System Landscapes


1
College of Landscape Architecture, Northeast Forestry University, Harbin 150040, China
2
College of Architecture and Urban Planning, Guangzhou University, Guangzhou 510006, China
3
Nanyang Environment & Water Research Institute, Nanyang Technological University, 1 CleanTech Loop, #06-10, Singapore 637141, Singapore
4
College of Horticulture & Landscape Architecture, Northeast Agricultural University, Harbin 150001, China
5
College of Landscape Architecture, Beijing Forestry University, Beijing 100089, China
*
Author to whom correspondence should be addressed.
Sustainability 2017, 9(12), 2145; https://doi.org/10.3390/su9122145
Submission received: 25 October 2017
/
Revised: 8 November 2017
/
Accepted: 19 November 2017
/
Published: 24 November 2017
Abstract
:This paper presents Synergetic Development Assessment (SDA) as a methodology to evaluate the environmental, economic, and social performance of an urban river system landscape from the perspective of sustainability. SDA is based on synergetics and its “order parameters” theory, proposed as a science to study the self-organization of complex systems. A case study of river system landscapes in China was carried out by, first, simplifying the composite system into three subsystems: environmental, economic, and social; then, going on to construct a hierarchical structure to explore the order parameters as the evaluation index. The Analytic Hierarchy Process was used to get the weight of the evaluation index to complete the assessment index system. At the same time, a Sequential Synergy Degree Model was built to accomplish the SDA. We find that from 2005 to 2015, the order degree of the environmental subsystem developed slowly, with fluctuations, and that river pattern is the key factor. Meanwhile, the order degree of the economic subsystem fluctuated widely, which significantly depended on the changing value of water resources, and the order degree of social subsystem improved continuously, with social culture lagging far behind. As a whole, the synergy degree of the composite system developed orderly at a corresponding low level, which was in low synergy from 2005 to 2009 and then in general synergy up to 2015.
1. Introduction
For research on sustainable development systems, it is important to find out the rules of self-organization, to make clear how the subsystems compete, cooperate and finally lead to their macroscopic structure in space, time and functionality [1]. Synergetics was proposed in 1975 by the German theoretical physicist Herman Haken as a framework for research on the self-organization of dynamic systems [2,3], and has since been widely applied in the fields of economics and social sciences [4,5] as well as the research on the self-organization of cities and settlements [6,7,8]. The synergetic view is very helpful in figuring out the internal mechanisms and rules of complex systems which contribute to their sustainability. Synergetic development is based on synergetics, and it is also the precondition and necessary foundation for sustainable development [9]. Synergetic Development Assessment (SDA) is a framework and guide for realizing sustainable development [10].
The basic concept of synergetics is the order parameter, which can be regarded as a macro-parameter representing the orderly state of the system in the process of evolution, measuring the synergetic efficiency of the subsystems. Order parameters are the key factors in synergetics theory, generated from the subsystems competition and then, in return, dominate the subsystems to operate in an orderly manner [11,12]. Order parameters are not unique and changing constantly. Synergetics research finds that subsystems can spontaneously collaborate to produce the order parameters by developing certain rules and adjusting certain parameters, thus promoting the evolution of the system to achieve nonlinear and self-organizing operation. Therefore, exploring and motivating the order parameters is the critical step to achieve synergy, and exploring order parameters as the evaluation indexes can perfectly evaluate the effectiveness in the process of system synergetic development.
An urban river system landscape (URSL) is a self-organizing complex ecosystem, containing many elements as natural representation, and meanwhile has its unique structure correlating with its functional characterization. As a consequence of urbanization and climate change, urban water managers have to consider a wider array of management options that account for economic, social and environmental factors [13]. According to structural functionalism and social-economic-natural complex ecosystem [14], each URSL also consists of three subsystems—environmental, economic, and social—and the final form of the URSL results from competition and collaboration among them.
The methods and indicators of river assessment are well documented worldwide, but there is disagreement over whether social values should be included. Karr [15] insisted that the river’s ecological integrity be regarded as the health standard, while Norris [16] believed that river ecosystem health depended on the social system, including social values and human welfare. For now, indicator-species methods such as the Index of Biotic Integrity and the River Invertebrate Prediction and Classification System are still common in river health assessment [17]. Meanwhile, methods including social and economic indicators have been widely proposed and applied in practice, such as the Rapid Bioassessment Protocols proposed by USEPA [18], the Riparian, Channel and Environmental Inventory in Sweden [19], and the Index of Stream Condition in Australia [20].
This study considered social and economic indicators owing to the urban environment, following the previous research, but it paid more attention to the river habitat landscape and the effect of urbanization. In addition, though river assessment has a mature theoretical basis, few studies have conducted such assessment from the perspective of the mutual effect of subsystems and factors through research into system self-organization. Moreover, continuous dynamic assessment methods are rarely applied to river landscapes. Thus, this research tried to construct an SDA system considering the dynamic development of a URSL and its subsystems. The SDA is the prerequisite for scientifically guiding the planning of a river system landscape; it can identify problems of dis-synergy in the process of evolution, and evaluate the synergy degree, and therefore propose countermeasures. In coordination with sustainable development, SDA can provide a comprehensive decision-making basis for decision-makers, better socio-economic information resources for the public, and technology and theoretical support for the synergetic development planning of a URSL.
2. Methodology and Data
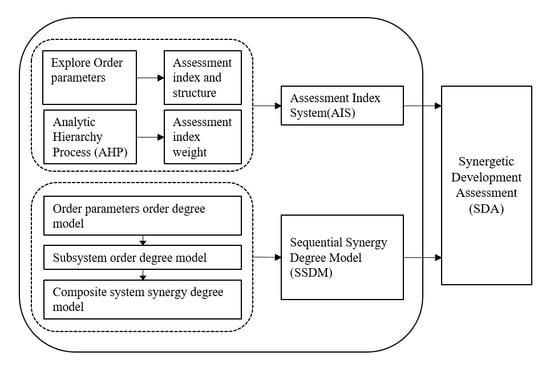
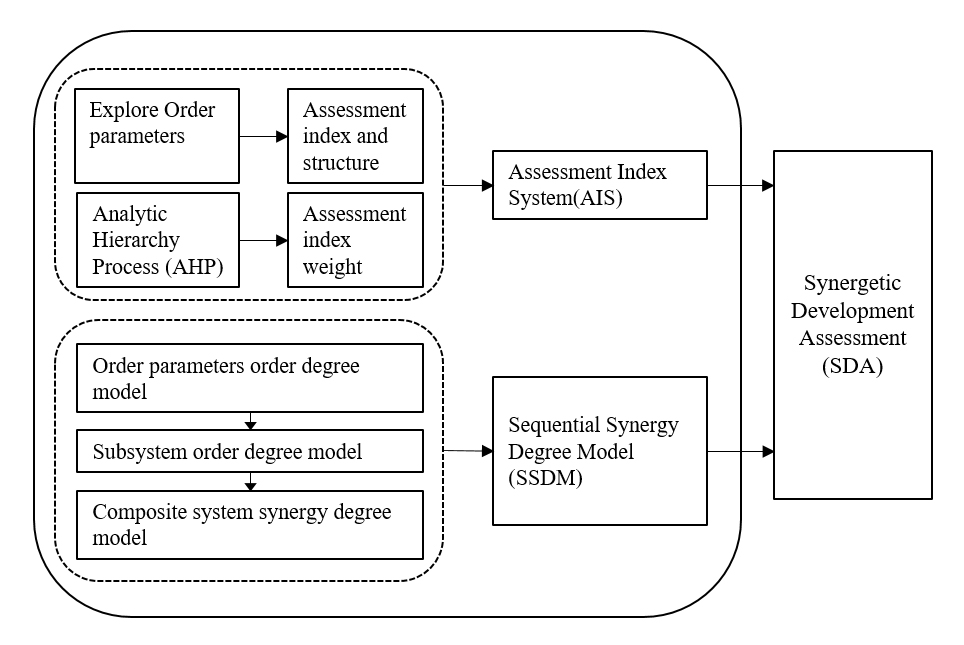
Primarily, using hierarchical structure theory, the study tried to figure out the order parameters by simplifying a complex system, exactly similar to the hierarchical structural model of an assessment index system (AIS), containing system, subsystem, and order parameters. Then, the AIS was constructed as the foundation, including assessment indexes, and a hierarchical structural model based on the first step, as well as assessment index weights obtained by the Analytic Hierarchy Process. Finally, a Sequential Synergy Degree Model was applied to calculate the data sources corresponding to the assessment indexes and AIS (Figure 1).
2.1. Study Site
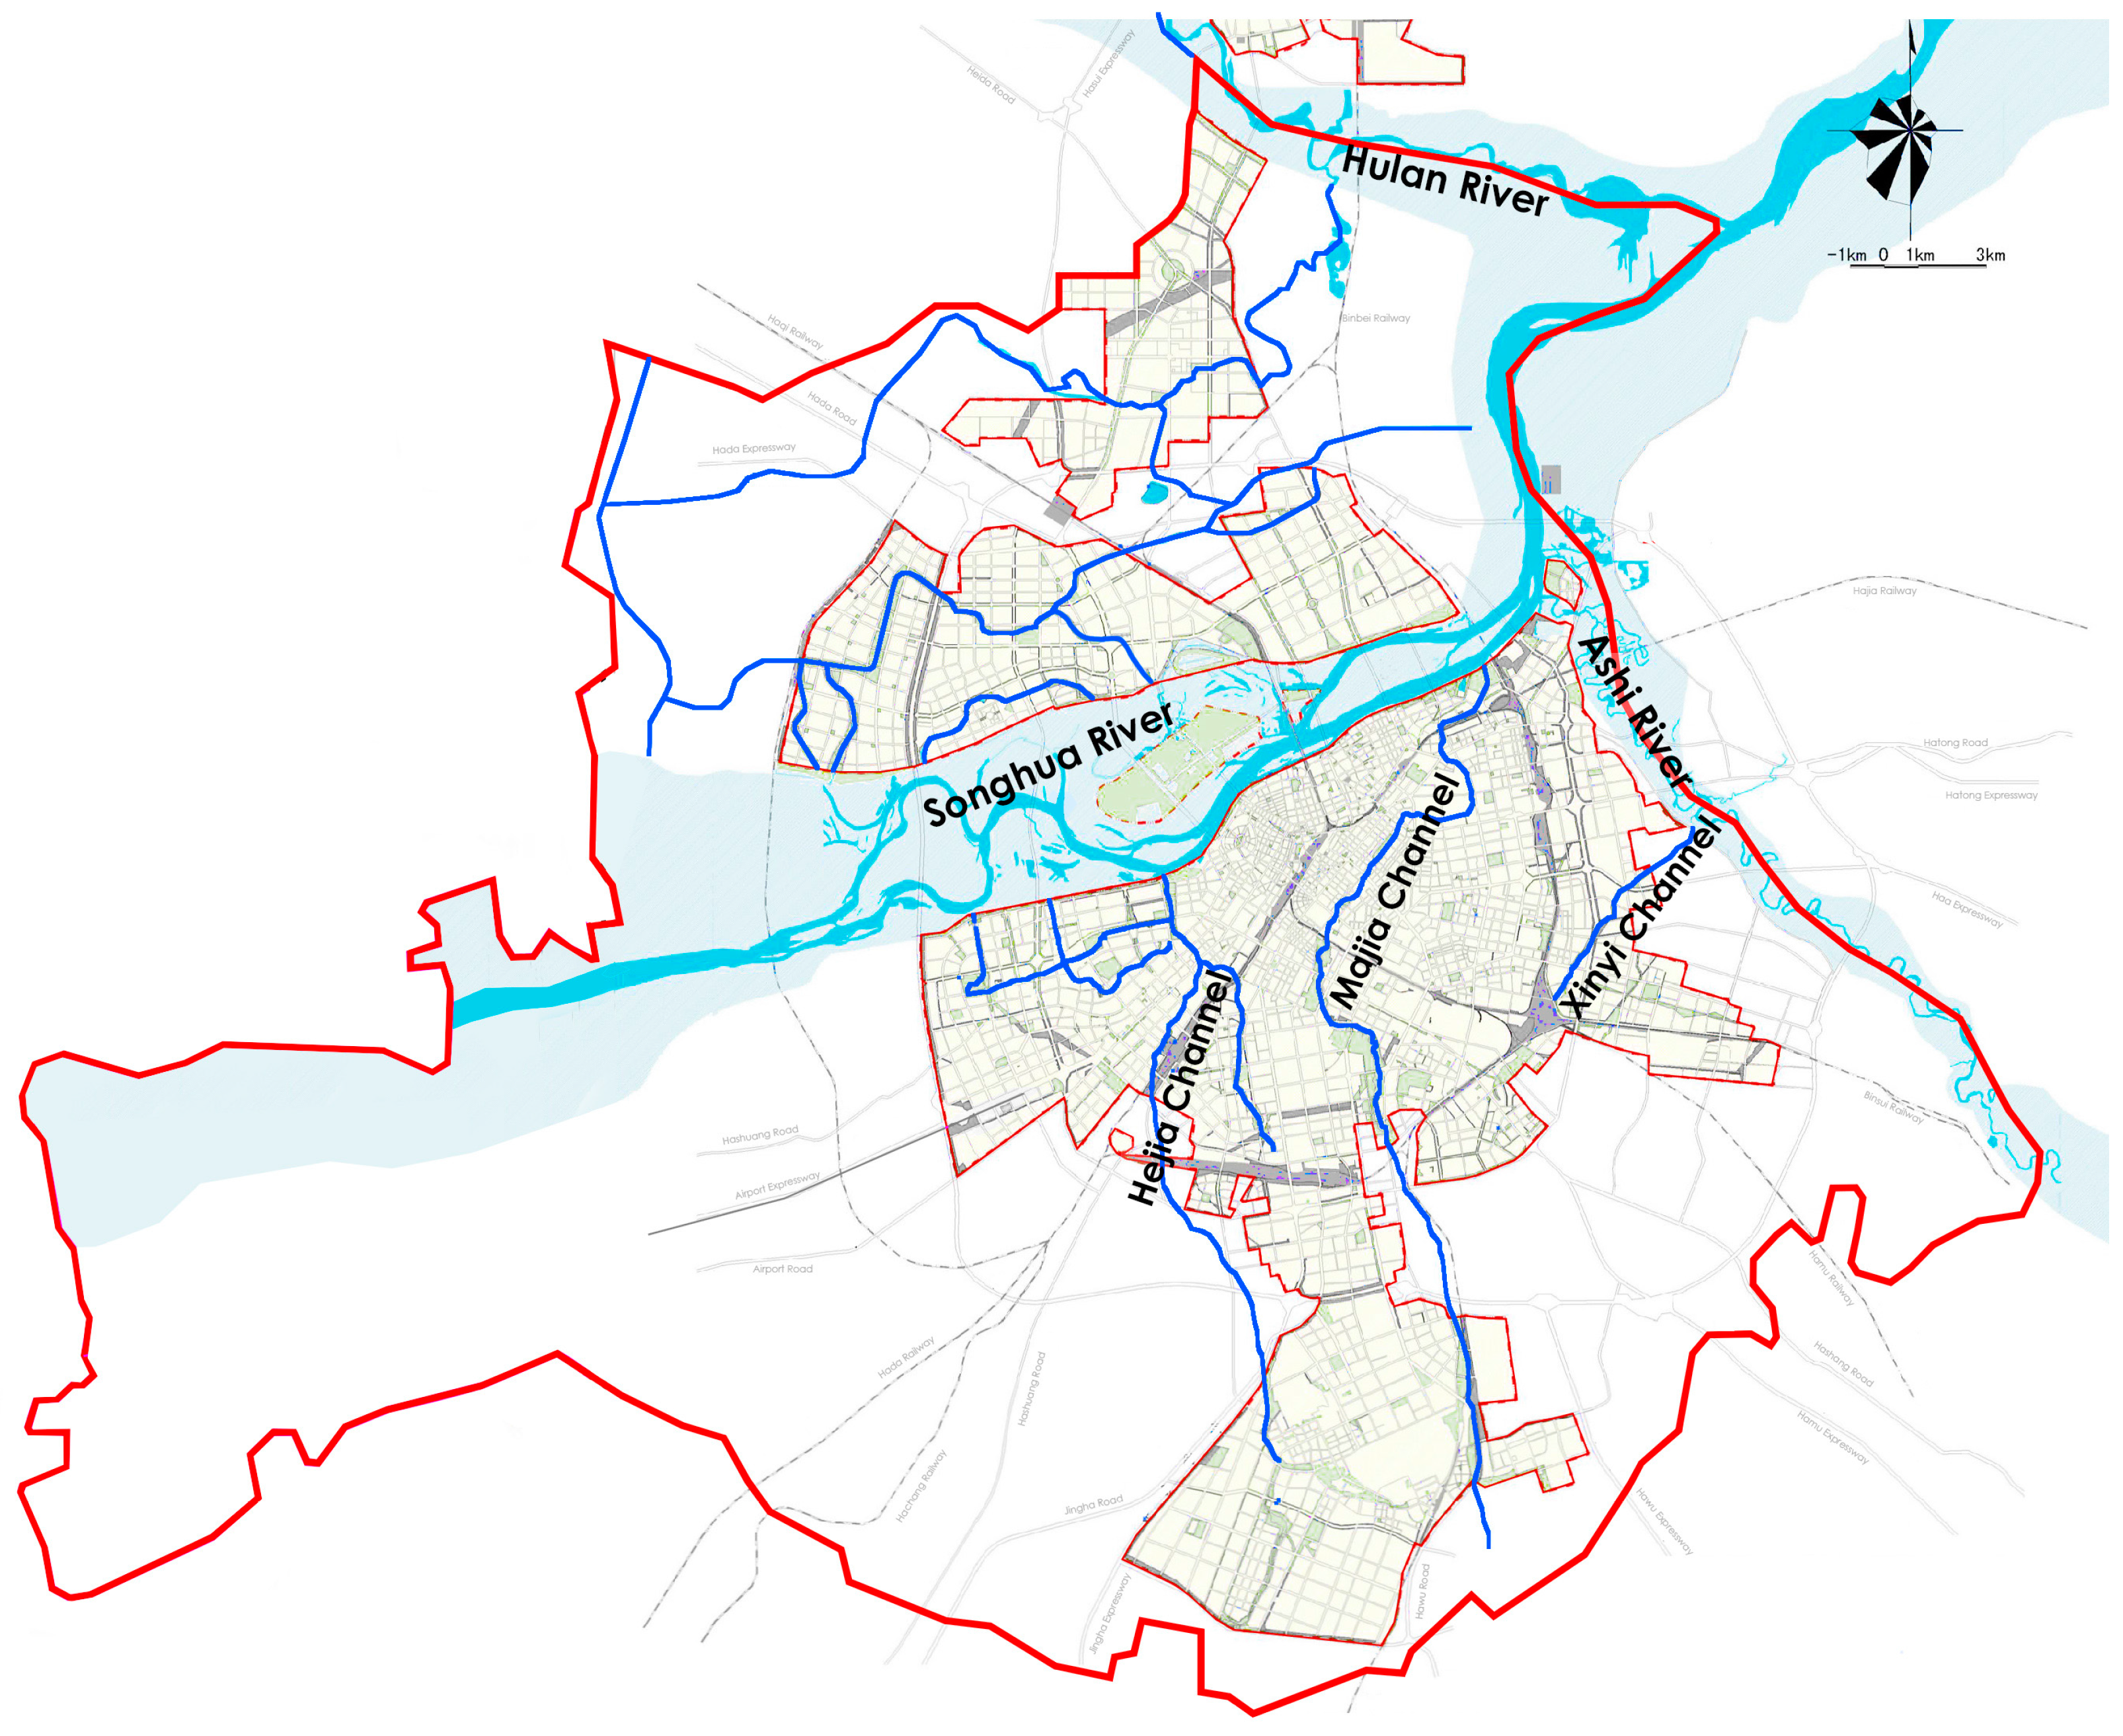
The selected research area is in Harbin, northern China, with an area of 1510 km2 compared to 53,100 km2 for the city, villages and towns, mainly containing three rivers and three channels. All of the rivers in the city belong to the Songhua River system; this is the main stream that all the other rivers flow into. The basic information on the urban river system is summarized in Table 1. According to the 2013–2030 eco-city construction plan, most of the rivers will be dug to connect the existing waterways to improve the URSL pattern (Figure 2).
2.2. Order Parameters and Assessment Index System
2.2.1. Exploring for the Order Parameters
The majority of the parameters influence the synergetic development of URSL, and contemporary science cannot clearly figure out the mechanism and regularity of the elements acting in the system. Moreover, one main parameter can barely play long-term influence on the system as a whole vecause the system constantly changes over time with different parameters holding dominant position. Consequently, the feasible method for exploring order parameters is to learn from hierarchical structure theory, simplify the complex system and make clear the structural relationships. Drawing lessons from the “social-economic-natural” complex ecosystem proposed by [21], considering location and social conditions, the URSL ecosystem is formed by the interaction of the three subsystems of environment, economy and society through mutual competition and cooperation. Therefore, the exploration of the order parameters of the URSL should also begin with these three subsystems, and then construct the hierarchical structure with progressive layers, including system, subsystem and order parameters.
For the environmental subsystem, according to the river health assessment index [22,23,24,25], in addition to research on natural river composition, it mainly contains three parameters: river pattern, riparian zone pattern, and hydrology and water characteristics. Economy dramatically affects the sustainable development of river landscapes, especially the tension between environmental sustainability and economic development should be well handled, and efficient and intensive urban economic development by innovative and effective technological means should also be insisted on [26]. Considering the basic component of river landscapes and the water sustainability index [27], the economic subsystem has two parts: water resources value and waterfront value. Within the social aspect, synergetic development strives to create a society where people live a healthy and happy life with equality, vitality, harmony and stability just as the goal of sustainable urban system [28]. Thus, the social subsystem was divided into three components: security, benefit and culture, represented as the basic desire and the spiritual needs.
Due to the complexity of the URSL, this study extended the order parameter component as indicator layer to indicate order parameters. Based on the above order parameters, the study tried to further explore the order parameter component using phenomenological synergy [29]. Learning from the natural evolution law of river systems, economic development regulations and the way of social participation, in reference to various types of national urban water system planning norms as well as river landscape evaluation indicators and river health evaluation indicators established by various experts and scholars, the final order parameters index system is presented in Table 2.
2.2.2. Establishment of AIS and Index Weight
The Analytic Hierarchy Process (AHP), proposed by Thomas. L. Satty as a qualitative and quantitative system analysis method [30,31], is used for quantifying experts’ opinions on alternative preference with regard to various qualitative indicators and for indicator weight elicitation [32]. Review papers on multi-criteria decision making for solid waste management [33] and for green supplier evaluation [34] confirm the popularity of the method. This paper applied the AHP to construct the hierarchical model of the AIS and confirm index weights for the purpose of evaluating the synergetic development of the URSL. In the hierarchical model of the AIS, each layer of factors subordinates or affects the upper level factor, while dominating the role of the next layer of factors. In this study, the top layer is the target layer, referring to development of the URSL; the middle is the criteria layer, corresponding to subsystem according to the actual situation; the decomposition of the secondary criteria layer corresponds to order parameters; and the bottom of the program is normally the indicator layer, referring to the order parameter components (Table 2).
After constructing the hierarchical model of the AIS with order parameters as assessment indexes, the study established Pairwise Comparison Matrices (PCMs), and generated an expert questionnaire with pairwise comparison indexes, while making evaluations using a 1–9 scale, with only two alternatives are considered at a time in relation to each index. These questionnaires were sent to a team of twelve experts from environmental science, landscape and urban planning, ecological economy, ecological sociology, management science and engineering to complete the quantitative evaluation of the relative importance of the order parameter indexes. The AHP was adopted to calculate the weight of each index using the PCMs proposed by the experts, and the PCMs consistency test was done until the standard was satisfied, namely, consistency ratio <0.1. During the group decision making process, many papers assume that all the decision makers have the same importance [35], however, in view of the disunity of different experts, this paper assigned a certain degree of expert weights to aggregate group decisions according to their academy impacts and research fields. The total expert weight was set as 1, and all twelve experts were divided into two groups. One group contained five relatively more authoritative experts from every of the above five fields, and each of them was assigned 0.1 equally, while the half weight of 0.5 was assigned to the other seven experts averagely in another group. The final assessment weights were calculated using weight arithmetic average combining these expert weights and the results of PCMs calculated by the AHP. The assessment weights of the subsystems and order parameters are shown in Table 2.
2.3. Sequential Synergy Degree Model
Synergetic development refers to a situation where the composite system comes to a coordinated state through the synergies and mutual influences of subsystems, and this degree of collaborative development state is the synergy degree. The evaluation model of synergetic development of the system finally depends on the construction of composite system synergy degree model. The synergy degree model is based on the order parameters order degree model and the subsystem order degree model.
2.3.1. Order Parameters Order Degree Model
In a compound system S = {S1, S2, …, Sn}, where Sn is a subsystem of S, S itself has several subsystems and order parameters. In this research, n = 3, that is, the synergetic system of the URSL has three subsystems: the environmental subsystem, S1; the economic subsystem, S2; and the social subsystem, S3.
Supposing that Sh (h ∈ [1, n]) is a random subsystem, and Sh = {Qh1, Qh2, …, Qhq}, Qhi (i ∈ [1, q]) is an order parameter of Sh. The order parameter Qhi temporary simplified for ei, supposing ei = (ei1, ei2, …, eim), where j ∈ [1, m], βij ≤ eij ≤ αij, and obviously αij and βij are the upper and lower limits, respectively, of the order parameter component eij. According to the practical situation, the threshold value should be the target value and minimum value.
In synergetics theory, the order parameter has two different functions in the formation of systematic order. One is a positive effect: the order degree of the system increases along with the change of the order parameter and its component value. Supposing j ∈ [1, k], the order parameter component eij is called a positive index. On the other hand, when j ∈ [k + 1, m], the order parameter component eij is called a negative index, and if the value increases, the order degree of system decreases accordingly. Therefore, the computation formula is:
In Equation (1), , and the larger is, the more it contributes to the system order degree.
Generally, the order parameter model is evaluated by from the integration of , namely the “total contribution” of the order parameter component eij to the order degree of the system, and it is done using the geometric weight sum. Since Qhi is simplified for ei, is equal to , expressed as
2.3.2. Subsystem Order Degree Model
In the same way, the order parameters directly contribute to the orderly development of the subsystem and the increase of its order degree. The calculation model is just similar to the above equation, using the geometric weight sum:
It can be seen from Equation (3) that is the order degree of subsystem Sh, and wi is the weight of the order parameter Qhi, also referring to Table 2.
2.3.3. Composite System Synergy Degree Model
The composite system’s synergy degree is based on the level of the synergetic development of each subsystem. Taking t0 as the initial time, the degree of the composite system corresponds to the order degree of subsystem ; when the system reaches the time t1, the degree changes to , and the composite system synergy degree model is calculated as:
where is presented as change range of order degree of the subsystem Sh from t0 to t1, . Therefore, the composite system synergy degree , and the closer U is to 1, the higher the level of synergistic development will be. In Equation (5), only when is the calculation result positive, which means that the subsystem has a positive effect on the synergetic development of the composite system, accelerating the orderly development of system from t0 to t1.
2.3.4. Classification of Composite System Synergy Degree
Because the relationships among the subsystems include not only competition but also synergies, and they are in the process of constant change, the order and steady state of the composite system is a concept of relative balance. Whether the URSL is coordinated or not is the combination of effects of the subsystems’ development, and individuals cannot react to the whole. Therefore, this article divides the synergetic development model of the system into five basic forms according to the composite system synergy degree (Table 3).
2.4. Data Sources and Processing
2.4.1. Data Sources
In this paper, the order parameters of the URSL’s environment, economy and society are collected and sorted according to the principle of availability and representativeness. The main original data and materials represent every two years from 2005 to 2015, and were obtained mainly from the national and local levels of the Statistical Yearbook and Water Resources Bulletin as well as data from the study area, including planning documents, ecological restoration documents, monitoring records and graphic data. Field research was also conducted to characterize the situation more precisely.
2.4.2. The Threshold of Order Parameters
Based on the collected data, according to the calculation formula of the evaluation model, the thresholds of the order parameters, that is, the upper and lower limits, should first be determined. The thresholds are directly related to the rationality of the evaluation result, so they should be chosen based on the laws, regulations, and standards at the national and local levels, as well as information and professional knowledge from consultants. The local natural, social and economic conditions of the study area should also be considered to choose the final thresholds. On the grounds of this study, the lower limit of the indicator was the index value in 2003, or the minimum value of environmental carrying capacity. The upper limit mainly came from the 13th Five-Year Plan for Urban Development, that is, the 2020 index value or the reference value of developed countries and cities.
2.4.3. Data Processing
In view of the different river levels in the research area, the final data were calculated based on the assignment weights of main stream and tributary, generally 2:1. At the same time, for the sake of proportionality when dealing with the data by calculation and analysis, it is necessary to non-dimensionalize the evaluation index data, since the original data for the order parameters have different dimensions and orders of magnitude. The equalization method introduces the coefficient of each variable value to the mean of variable value, using the coefficient of variation of the original variable as the standard deviation. Then, information in the original data can be sufficiently preserved while eliminating the original data quantities and dimensions. This paper adopted the equalization method of Equation (6) in dimensionless treatment to reduce the loss of information, and the processed data are expressed in Table 4.
3. Results and Discussion
3.1. SDA of the Environmental Subsystem
From the order degree model of Equations (1)–(3) and the above dimensionless indicator data, the changes of order degree of the environmental subsystems and order parameters from 2005 to 2015 (once every two years) can be obtained (Table 5).
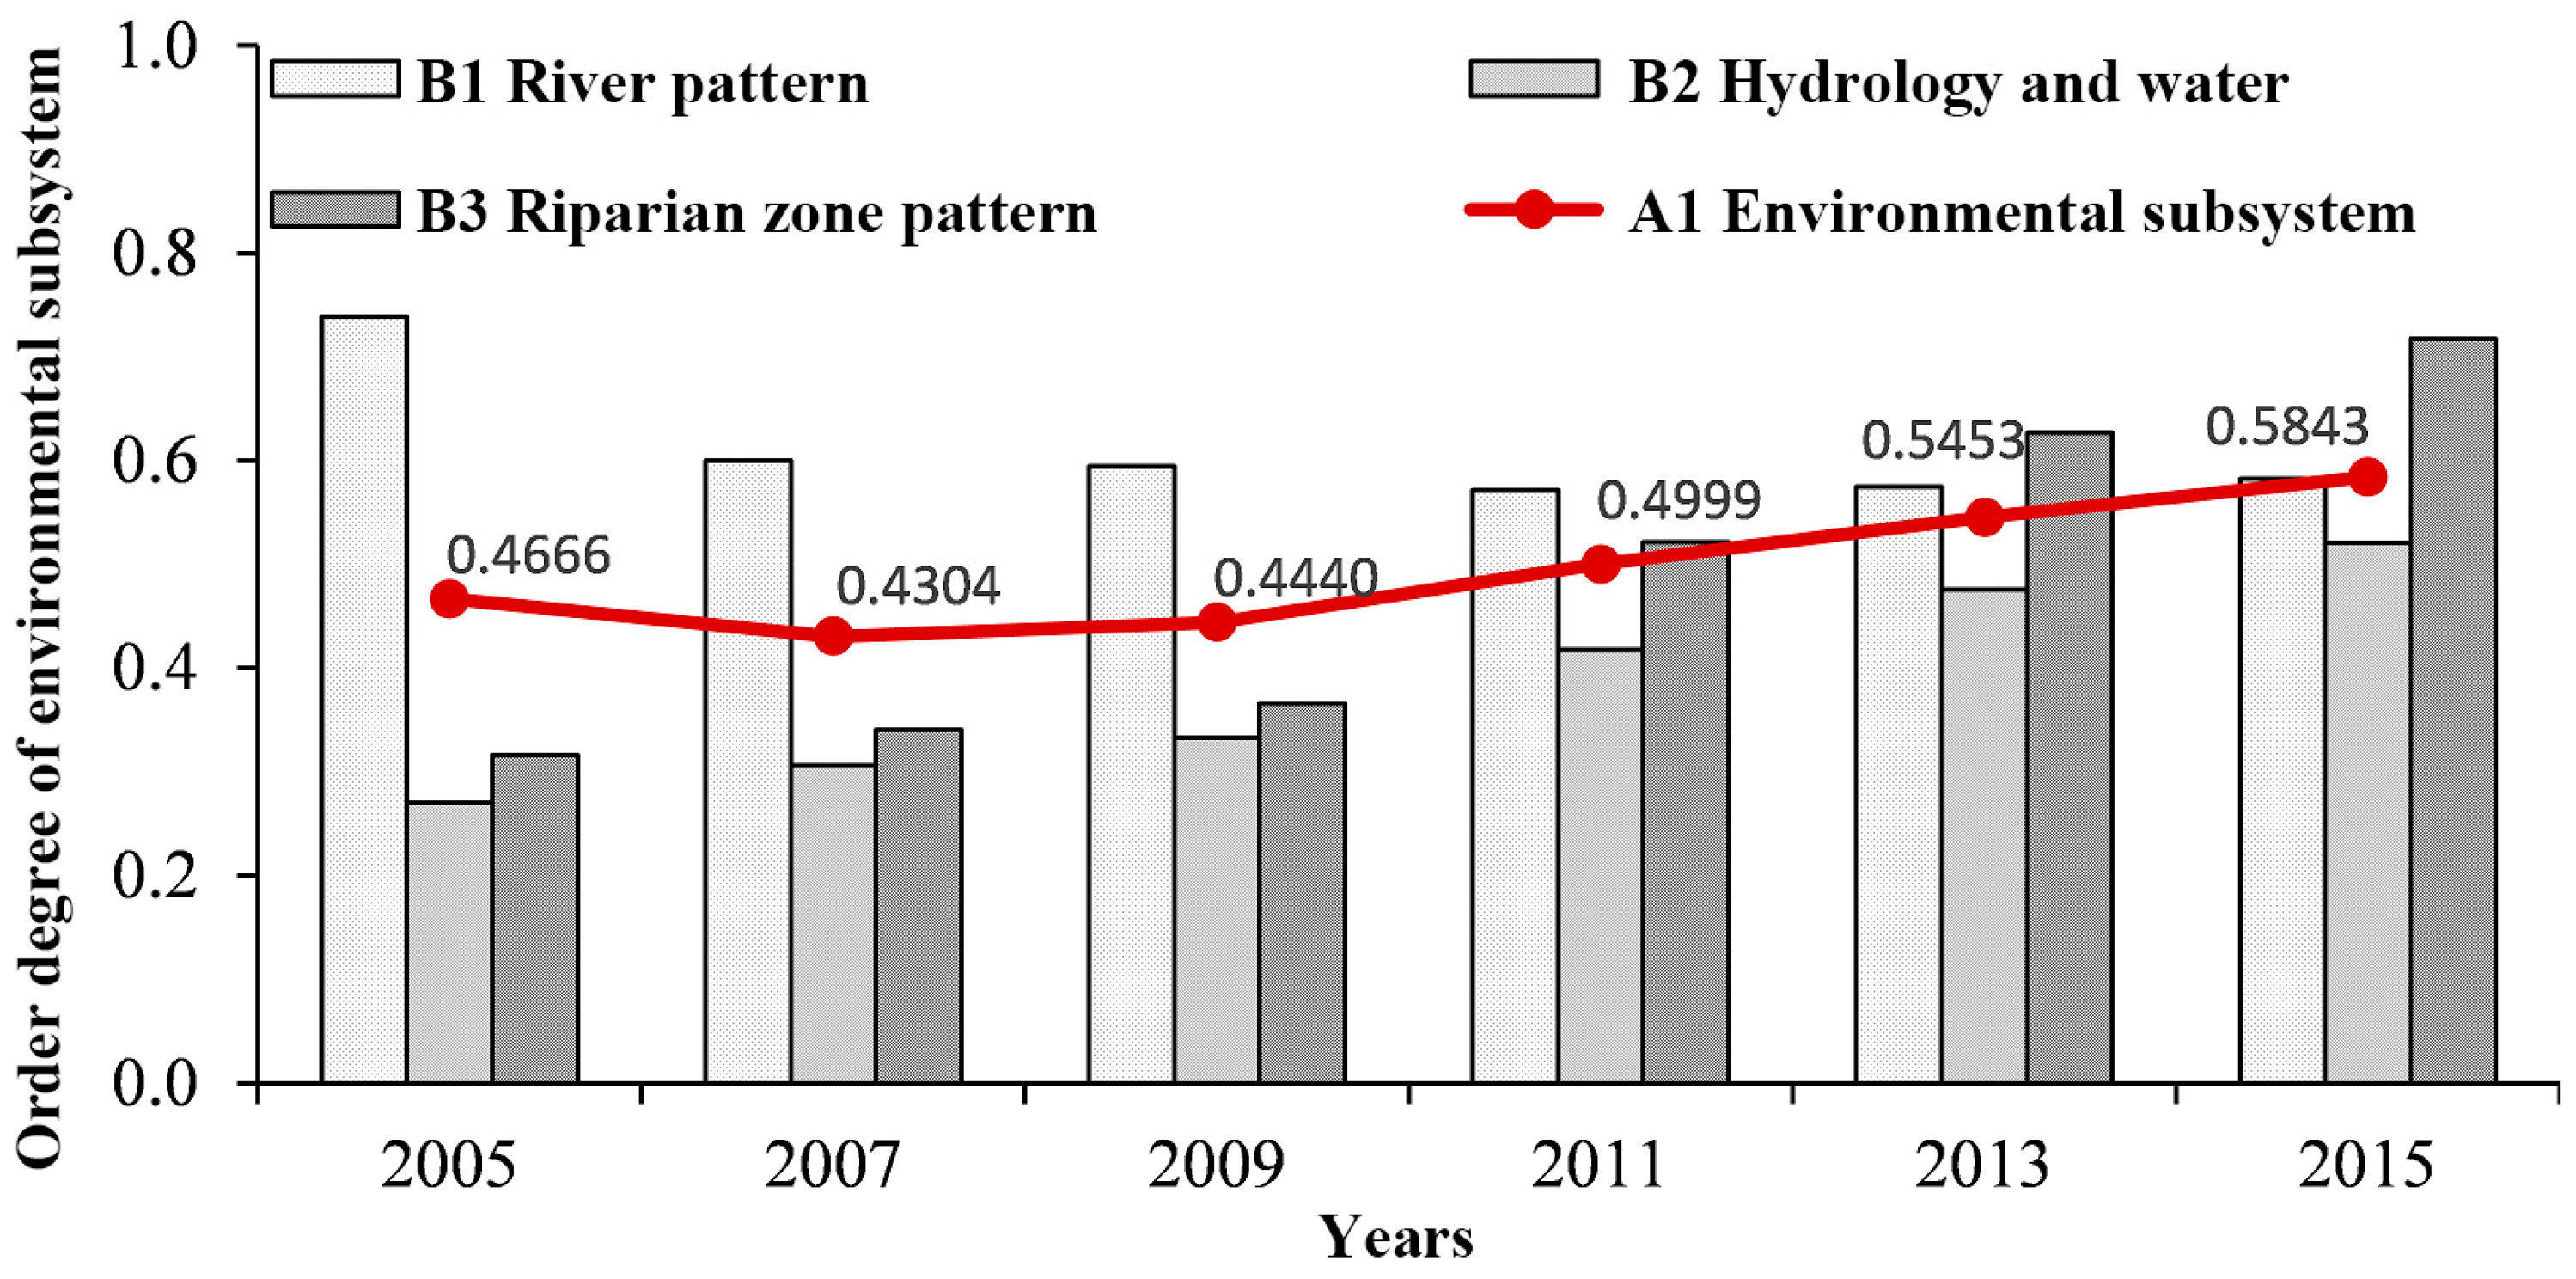
Figure 3 shows that the environmental subsystem developed unstably from 2005 to 2015 with an overall slow development and a lower degree, temporarily declining from 2005 to 2007 to as low as 0.4304, and then rebounding to 0.5843 in 2015. As a whole, the overall trend to ease with no significant fluctuations, and in the meantime the order degree is not high enough.
Considering the interactive relationship of the three order parameters, the main reason for the decline of the order degree of the subsystem is the disorderly state of the development of the river pattern, which showed a downward trend (lightest-gray bars in Figure 3). At the same time, the order degrees of the other two order parameters, hydrology and water characteristics and riparian zone pattern, were climbing in the evaluation period, promoting the environmental subsystem to realize the evolution of synergetic self-organization.
3.2. SDA of the Economic Subsystem
Similarly, from Equations (1)–(3) and the above data, the study expressed the dynamic development of the order degree of the economic subsystem and order parameters from 2005 to 2015 (once every two years) in Table 6.
The order degree of the economic subsystem presented extremely unstable development, with multiple fluctuations. The curve in Figure 4 shows a decline of the order degree of the economic subsystem in 2007, 2011 and 2015, tumbling to its lowest level of 0.1918 in 2007.
Considering the interactive relationship of the two order parameters, the orderly instability of the subsystem is mainly attributed to the disorderly state and fluctuation of water resources value (lightest-gray bars in Figure 4), which indicates that the economic subsystem was severely restricted by water resources. At the same time, the order parameter of waterfront value developed in an orderly manner, which promoted the synergetic evolution of the economic subsystem to a certain extent.
3.3. SDA of The Social Subsystem
The study also calculated the order degree of the social subsystem and order parameters from 2005 to 2015 (once every two years) by Equations (1)–(3) as expressed in Table 7.
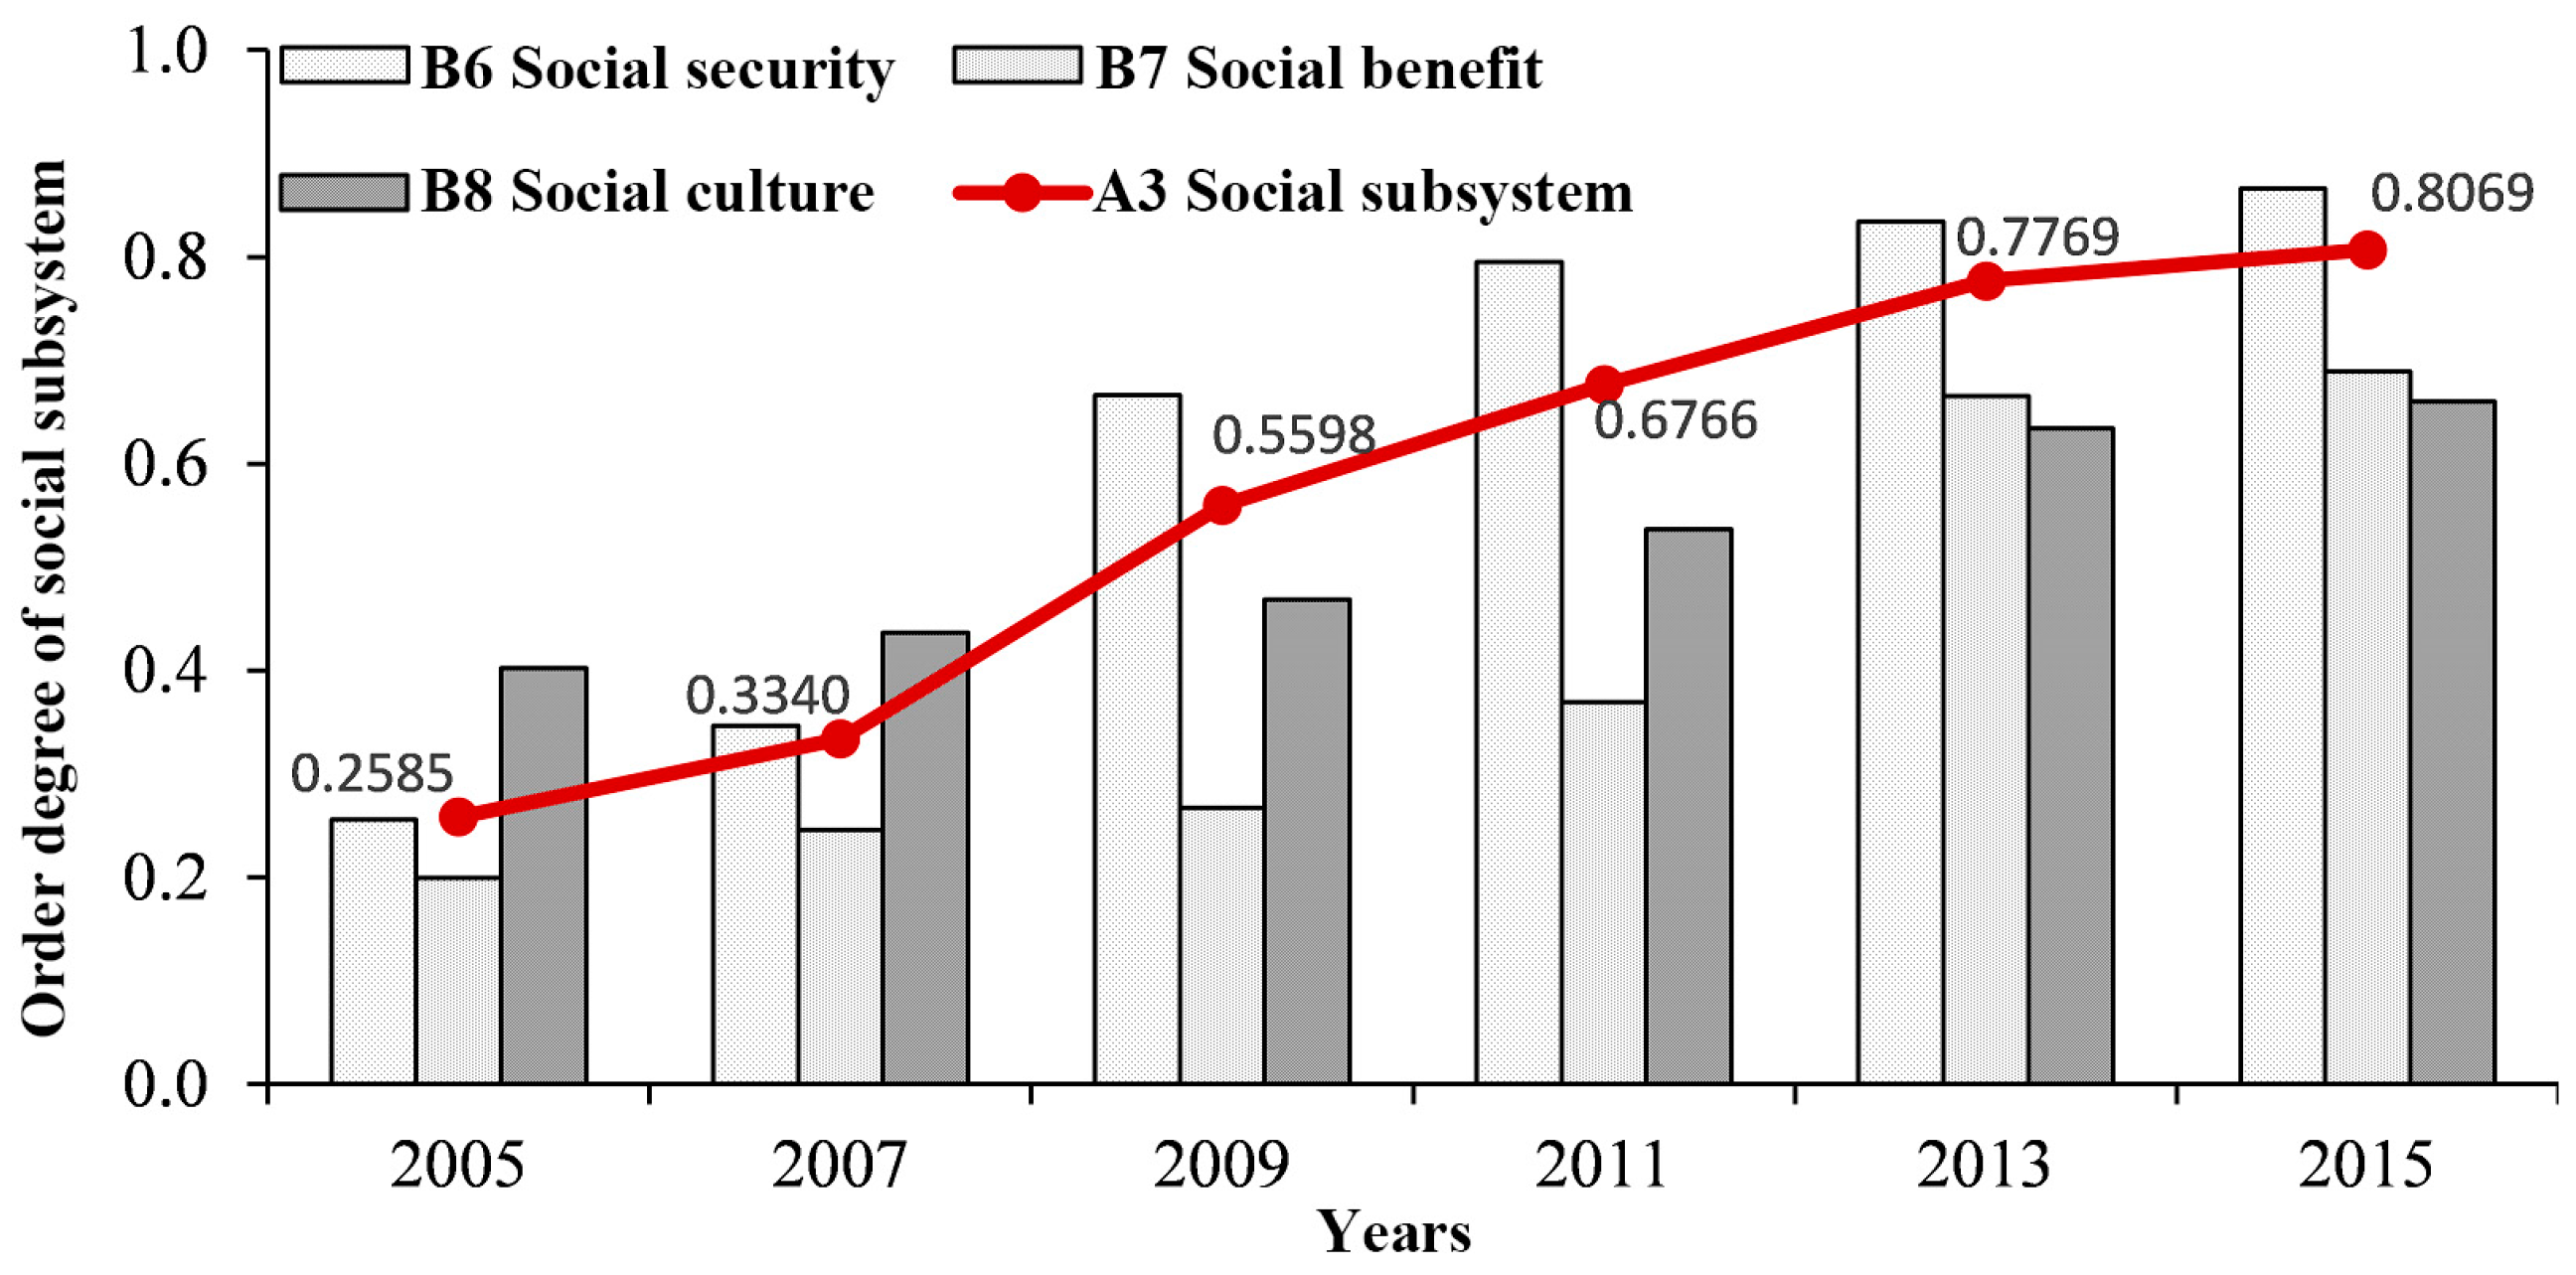
The synergetic development of the social subsystem of the URSL in the research area was in a good and orderly state with a high order degree. The order curve (Figure 5) was on a rising trend; the rate of rise gradually increased from 2007 to 2009, and then evened out. The order degree reached a maximum of 0.8069 in 2015.
According to the mutual effect of the three order parameters, social security greatly promoted the rise of the order degree of the social subsystem, and the other two order parameters in the evaluation term, social benefit and social culture, both showed an orderly development, with the latter at a relatively lower level. In general, the favorable development trends of all three of these order parameters indicate that the social subsystem is continuously in a synergistic evolution condition under the catalytic effect of artificial force.
3.4. SDA of the Composite System
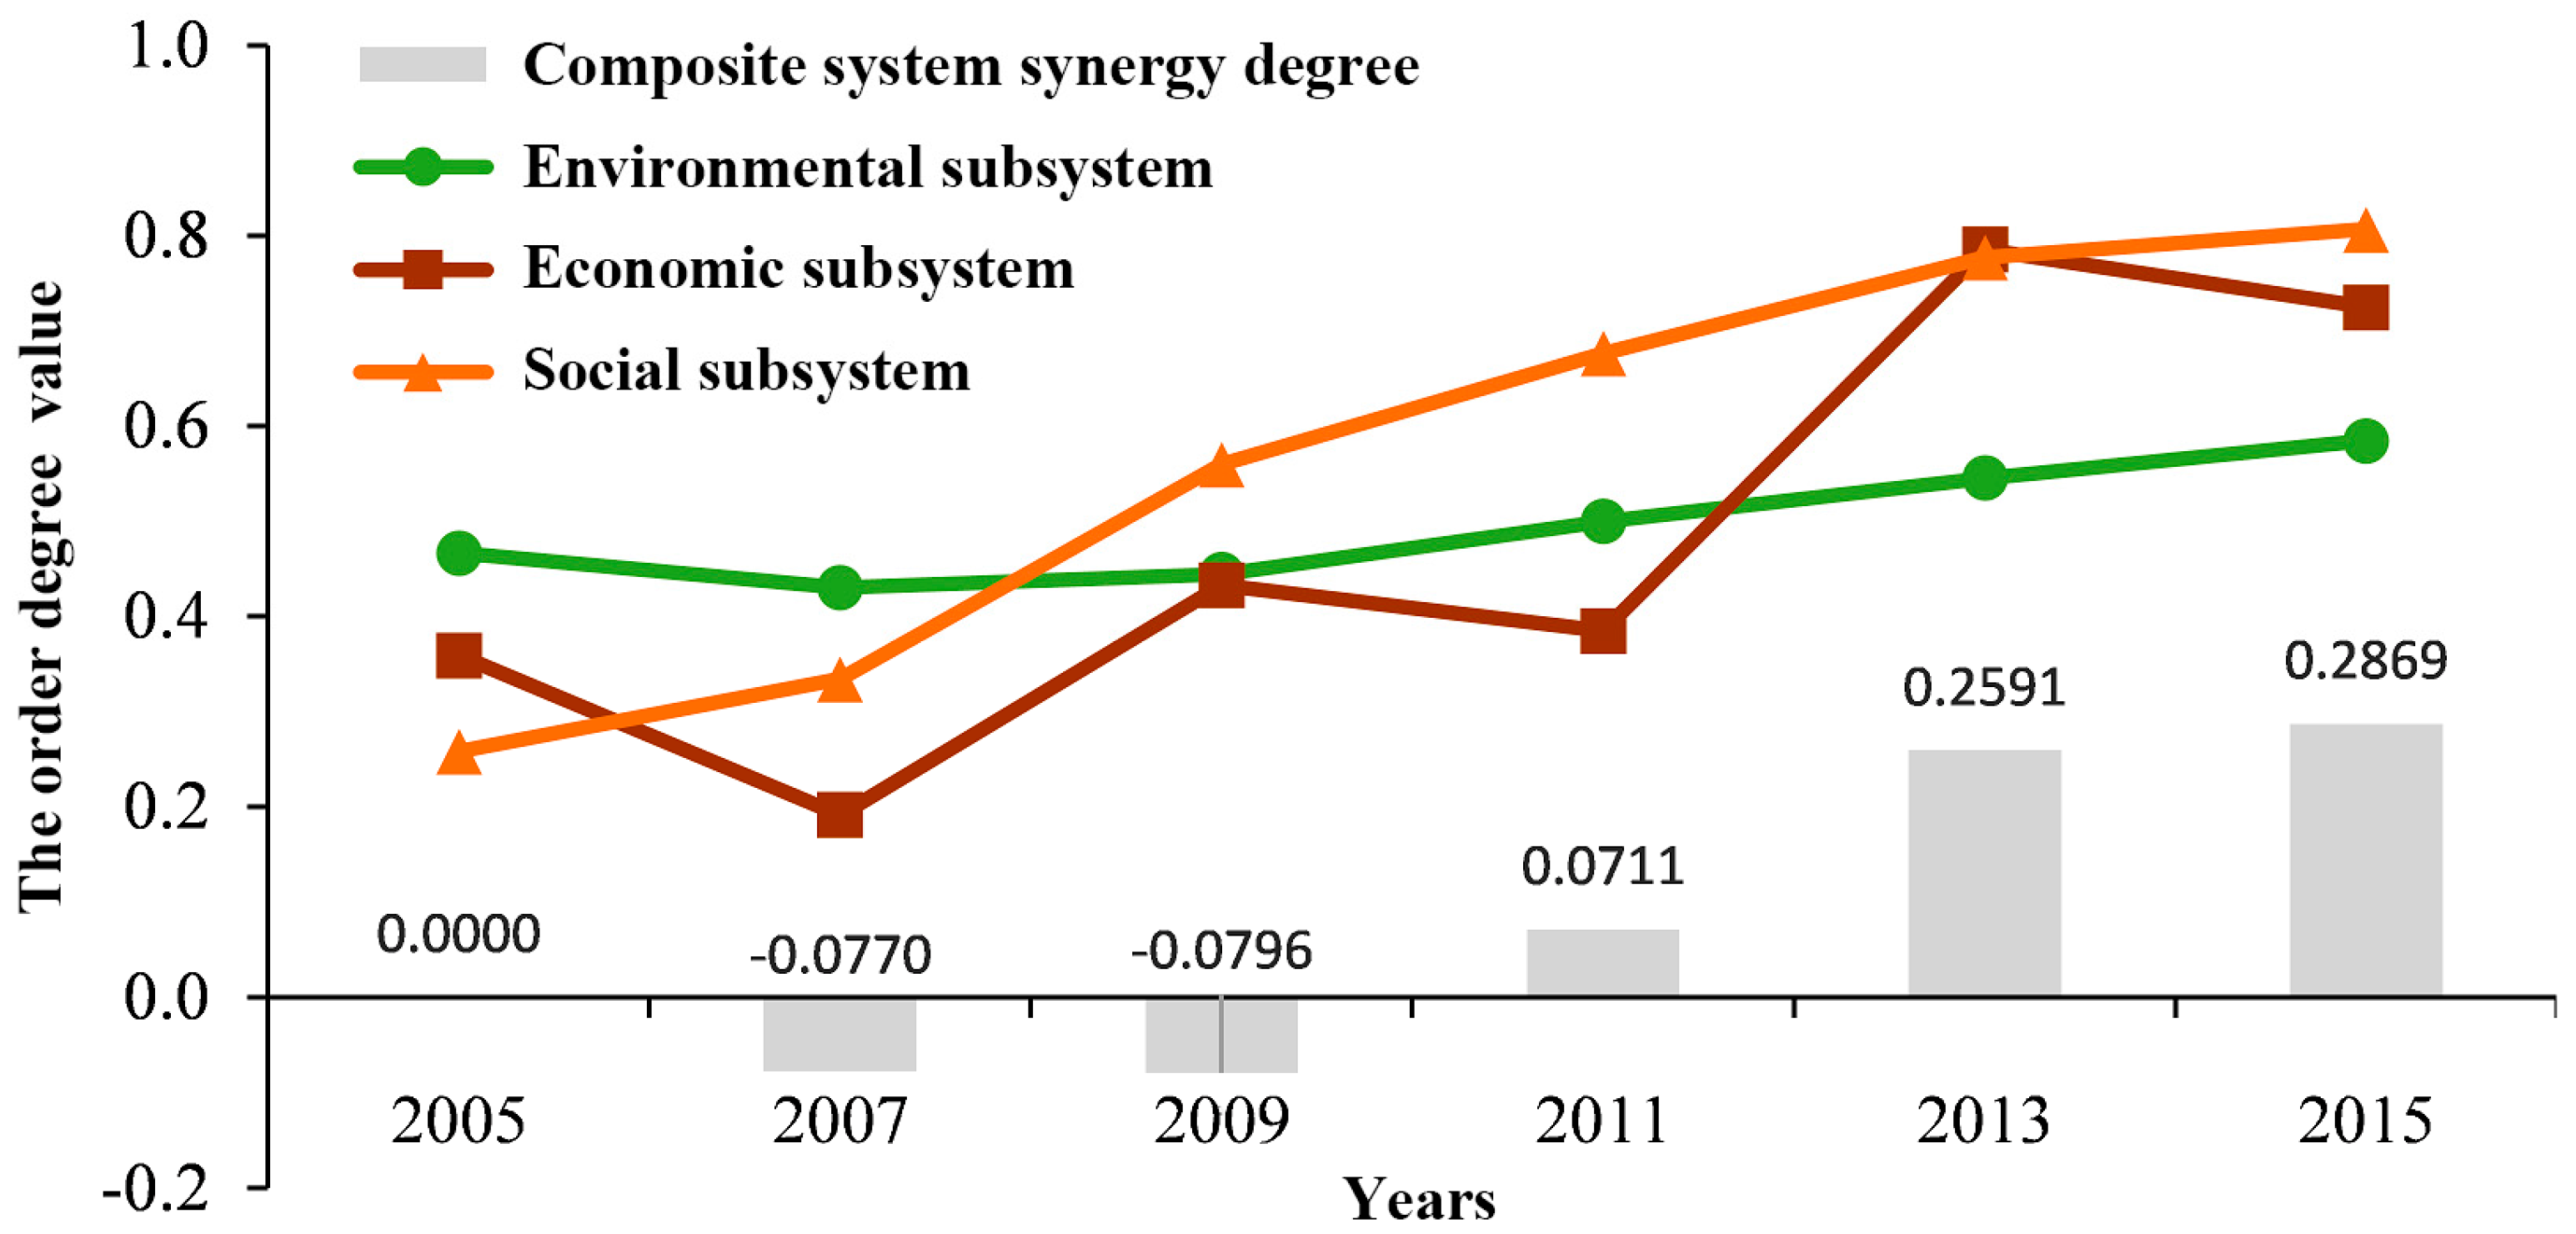
The composite system synergy model can reflect the comprehensive development level of the URSL in the research area based on the results and analysis of the order degree of the subsystems. According to the composite system synergy model and Equations (4) and (5), the changes of synergy degree of the composite system from 2005 to 2015 (once every two years) can be obtained, as presented in Figure 6.
By reference to the classification of composite system synergy degree in Table 3, the composite system was in a low-synergy condition, with an imbalance of development, from 2005 to 2009. Especially from the initial development period to 2007, due to the disordered state of the environment and the economic subsystem, system synergy degree was negative and decreasing. By 2009, the economic subsystem was in synergetic development, but the environmental subsystem was still relatively disordered, resulting in the lowest degree of synergy (−0.0796). In the following years, from 2011 to 2015, the composite system was in a general synergy condition; despite fluctuations in the subsystems, the overall system developed orderly, at a corresponding low level, as presented in Figure 6. Therefore, the synergetic development of the URSL in the research area should be further promoted until it reaches high synergy.
4. Discussion
According to the SDA of the URSL in the research area, URSL planning should focus on key stress factors. Specifically, it should promote the synergetic development of environmental subsystems by focusing on improving the river pattern; promote synergetic development of economic subsystems by increasing the value of water resources; and promote synergetic development of social subsystems by boosting social culture.
Although there is some contradiction between the environment and the economy from the point of view of urban development, the disorder of the order parameter river pattern in the research area was mainly due to the loss of longitudinal connectivity caused by the use of water gates to form backwaters and the construction of the Dadingzishan Hydropower Station. From the key stress factors that affect the orderliness of each subsystem, the common goal is to meet environmental water goals and maximize economic water benefits, so they have some synergetic attributes.
For this, first, reduce as much as possible the artificial obstruction of the river, to protect the quality of the water. Learn from low-impact development; set up retention and purification measures at the river bank for source management, such as bioretention basins and vegetated swales. Use irrigation canal diversion to retain rainwater and seriously polluted water for path management, and then reuse the reclaimed water after integrated and centralized treatment. Second, it is key to improve water utility efficiency, including the implementation of water-saving technology, the improvement of water management by government-led and market-oriented economy, and the construction of water resources management laws and regulations. Finally, optimize the scheduling of water resources, mainly through dual water supply and adjusting the industrial structure of water supply and water rights market regulation. For the social subsystem, increasing public participation will enhance citizens’ environmental awareness; and boost social culture, which also helps promote the synergetic development of the environmental economic subsystem. It is also necessary to use ecological planning and technology continuously to adopt planning strategies and measures to promote the mutual competition and cooperation of the three subsystems of the URSL in the research area to realize the steady improvement of order degree and finally to achieve comprehensive system synergetic development.
5. Conclusions
The order degree of the environmental subsystem of the URSL in the research area has developed slowly, with fluctuations, staying at a relatively low level overall, and the key factor that affected it was the river pattern. Meanwhile, the order degree of the economic subsystem fluctuated widely, depending on the changing value of water resources. Finally, the order degree of the social subsystem improved continuously, but the development level of the order parameter social culture lagged far behind.
The improvement of the synergy of the URSL can be attributed to cooperation and coupling among the three subsystems. However, the degradation of any subsystem will greatly affect the synergetic development of the whole system. Therefore, this study can identify the key stress factors, namely, “short board” subsystems, that affect the disorderly state or orderly development of the system based on the analysis of the results of the SDA. With great promotion of the order degree referring to the key stress factors, and with comprehensive planning strategies which promote cooperation between the subsystems, synergetic development of the composite system of the URSL could ultimately be realized.
Acknowledgments
This research was financially supported by the Graduate Student Education Fundation of NEFU (No. 602061) and the Lateral Research Funds of Heilongjiang Province (NO. 43214005).
Author Contributions
Jingya Qiao designed the research topic and drafted the manuscript; Mo Wang and Dongqing Zhang contributed to the methodology and edited the manuscript; Chenyang Ding collected and analyzed the data; and Jingjing Wang and Dawei Xu provided suggestions to revise the paper. The manuscript was written with support from Dawei Xu.
Conflicts of Interest
The authors declare no conflict of interest.
References
- Xiaohua, F. Research on the self-organization of sustainable development system in china with the view of synergetics. J. Syst. Dialectics 2004, 1, 50–55. [Google Scholar]
- Haken, H. Synergetics. Naturwissenschaften 1980, 67, 121–128. [Google Scholar] [CrossRef]
- Haken, H. Visions of synergetics. J. Frankl. Inst. 1997, 334, 759–792. [Google Scholar] [CrossRef]
- Videira, N.; Schneider, F.; Sekulova, F.; Kallis, G. Improving understanding on degrowth pathways: An exploratory study using collaborative causal models. Futures 2014, 55, 58–77. [Google Scholar] [CrossRef]
- Chernomaz, K.; Levin, D. Efficiency and synergy in a multi-unit auction with and without package bidding: An experimental study. Games Econ. Behav. 2012, 76, 611–635. [Google Scholar] [CrossRef]
- Haken, H.; Portugali, J. A synergetic approach to the self-organization of cities and settlements. Environ. Plan. B Plan. Des. 1995, 22, 35–46. [Google Scholar] [CrossRef]
- Amit-Cohen, I. Synergy between urban planning, conservation of the cultural built heritage and functional changes in the old urban center—The case of Tel Aviv. Land Use Policy 2005, 22, 291–300. [Google Scholar] [CrossRef]
- Chen, A.; Gao, J. Urbanization in China and the coordinated development model—The case of Chengdu. Soc. Sci. J. 2011, 48, 500–513. [Google Scholar] [CrossRef]
- Mu, D.; Du, Z.-P. A study on dea evaluation for synergetic development of system. Math. Pract. Theory 2005, 4, 56–64. [Google Scholar]
- Zhang, J.; Yang, C.-H.; Qin, X.-H.; Du, W. The comprehensive evaluation for the synergetic development of urban traffic system based on DEA model. In Proceedings of the International Conference on Transportation Engineering 2007, Chengdu, China, 22–24 July 2007; pp. 2656–2661. [Google Scholar]
- Juval, P.P.D. Self-organization and the city. J. East Asia Int. Law 2000, 5, 495–510. [Google Scholar]
- Hu, D.-L.; Qi, F.-H. Reconstruction of order parameters in synergetics approach to pattern recognition. J. Infrared Millim. Waves 1998, 17, 177–181. [Google Scholar]
- Willuweit, L.; O’Sullivan, J.J. A decision support tool for sustainable planning of urban water systems: Presenting the dynamic urban water simulation model. Water Res. 2013, 47, 7206–7220. [Google Scholar] [CrossRef] [PubMed]
- Wang, R.; Li, F.; Hu, D.; Li, B.L. Understanding eco-complexity: Social-economic-natural complex ecosystem approach. Ecol. Complex. 2011, 8, 15–29. [Google Scholar] [CrossRef]
- Karr, J.R. Defining and measuring river health. Freshw. Biol. 1999, 41, 221–234. [Google Scholar] [CrossRef]
- Norris, R.H.; Thoms, M.C. What is river health? Freshw. Biol. 1999, 41, 197–209. [Google Scholar] [CrossRef]
- Karr, J.R.; Chu, E.W. Sustaining living rivers. Hydrobiologia 2000, 422, 1–14. [Google Scholar] [CrossRef]
- Barbour, M.T.; Gerritsen, J.; Snyder, B.D.; Stribling, J.B. Rapid Bioassessment Protocols for Use in Streams and Wadeable Rivers: Periphyton, Benthic Macroinvertebrates and Fish; US Environmental Protection Agency, Office of Water Washington: Washington, DC, USA, 1999. [Google Scholar]
- Petersen, R.C. The rce: A riparian, channel, and environmental inventory for small streams in the agricultural landscape. Freshw. Biol. 1992, 27, 295–306. [Google Scholar] [CrossRef]
- Ladson, A.R.; White, L.J.; Doolan, J.A.; Finlayson, B.L.; Hart, B.T.; Lake, P.S.; Tilleard, J.W. Development and testing of an index of stream condition for waterway management in Australia. Freshw. Biol. 1999, 41, 453–468. [Google Scholar] [CrossRef]
- Wang, C.; Wang, Y.; Geng, Y.; Wang, R.; Zhang, J. Measuring regional sustainability with an integrated social-economic-natural approach: A case study of the Yellow River Delta region of China. J. Clean. Prod. 2016, 114, 189–198. [Google Scholar] [CrossRef]
- Munné, A.; Prat, N.; Sola, C.; Bonada, N.; Rieradevall, M. A simple field method for assessing the ecological quality of riparian habitat in rivers and streams: Qbr index. Aquat. Conserv. Mar. Freshw. Ecosyst. 2003, 13, 147–163. [Google Scholar] [CrossRef]
- Maddock, I. The importance of physical habitat assessment for evaluating river health. Freshw. Biol. 1999, 41, 373–391. [Google Scholar] [CrossRef]
- Zhao, Y.; Yang, Z. Integrative fuzzy hierarchical model for river health assessment: A case study of Yong River in Ningbo city, China. Commun. Nonlinear Sci. Numer. Simul. 2009, 14, 1729–1736. [Google Scholar] [CrossRef]
- Davies, P.; Harris, J.; Hillman, T.; Walker, K. The sustainable rivers audit: Assessing river ecosystem health in the Murray-Darling basin, Australia. Mar. Freshw. Res. 2010, 61, 764–777. [Google Scholar] [CrossRef]
- Portney, K.E. Taking Sustainable Cities Seriously: Economic Development, the Environment, and Quality of Life in American Cities; MIT Press Cambridge: Cambridge, MA, USA, 2013. [Google Scholar]
- Juwana, I.; Perera, B.J.C.; Muttil, N. A water sustainability index for West Java—Part 2: Refining the conceptual framework using delphi technique. Water Sci. Technol. 2010, 62, 1641–1652. [Google Scholar] [CrossRef] [PubMed]
- González-Mejía, A.M.; Eason, T.N.; Cabezas, H.; Suidan, M.T. Social and economic sustainability of urban systems: Comparative analysis of metropolitan statistical areas in Ohio, USA. Sustain. Sci. 2014, 9, 217–228. [Google Scholar] [CrossRef]
- Jian, Z.; Yifang, Z. Social Synergetics; Beijing Technology Publishing House: Beijing, China, 2000; pp. 32–44. [Google Scholar]
- Golden, B.L.; Wasil, E.A.; Harker, P.T. The Analytic Hierarchy Process: Applications and Studies; Springer: Berlin/Heidelberg, Germany, 1989; pp. 1–2. ISBN 978-3-642-50246-0. [Google Scholar]
- Vaidya, O.S.; Kumar, S. Analytic hierarchy process: An overview of applications. Eur. J. Oper. Res. 2006, 169, 1–29. [Google Scholar] [CrossRef]
- Gogate, N.G.; Kalbar, P.P.; Raval, P.M. Assessment of stormwater management options in urban contexts using multiple attribute decision-making. J. Clean. Prod. 2017, 142, 2046–2059. [Google Scholar] [CrossRef]
- Soltani, A.; Hewage, K.; Reza, B.; Sadiq, R. Multiple stakeholders in multi-criteria decision-making in the context of municipal solid waste management: A review. Waste Manag. 2015, 35, 318–328. [Google Scholar] [CrossRef] [PubMed]
- Govindan, K.; Rajendran, S.; Sarkis, J.; Murugesan, P. Multi criteria decision making approaches for green supplier evaluation and selection: A literature review. J. Clean. Prod. 2015, 98, 66–83. [Google Scholar] [CrossRef]
- Yue, Z. Developing a straightforward approach for group decision making based on determining weights of decision makers. Appl. Math. Model. 2012, 36, 4106–4117. [Google Scholar] [CrossRef]
Figure 1.
Study framework.
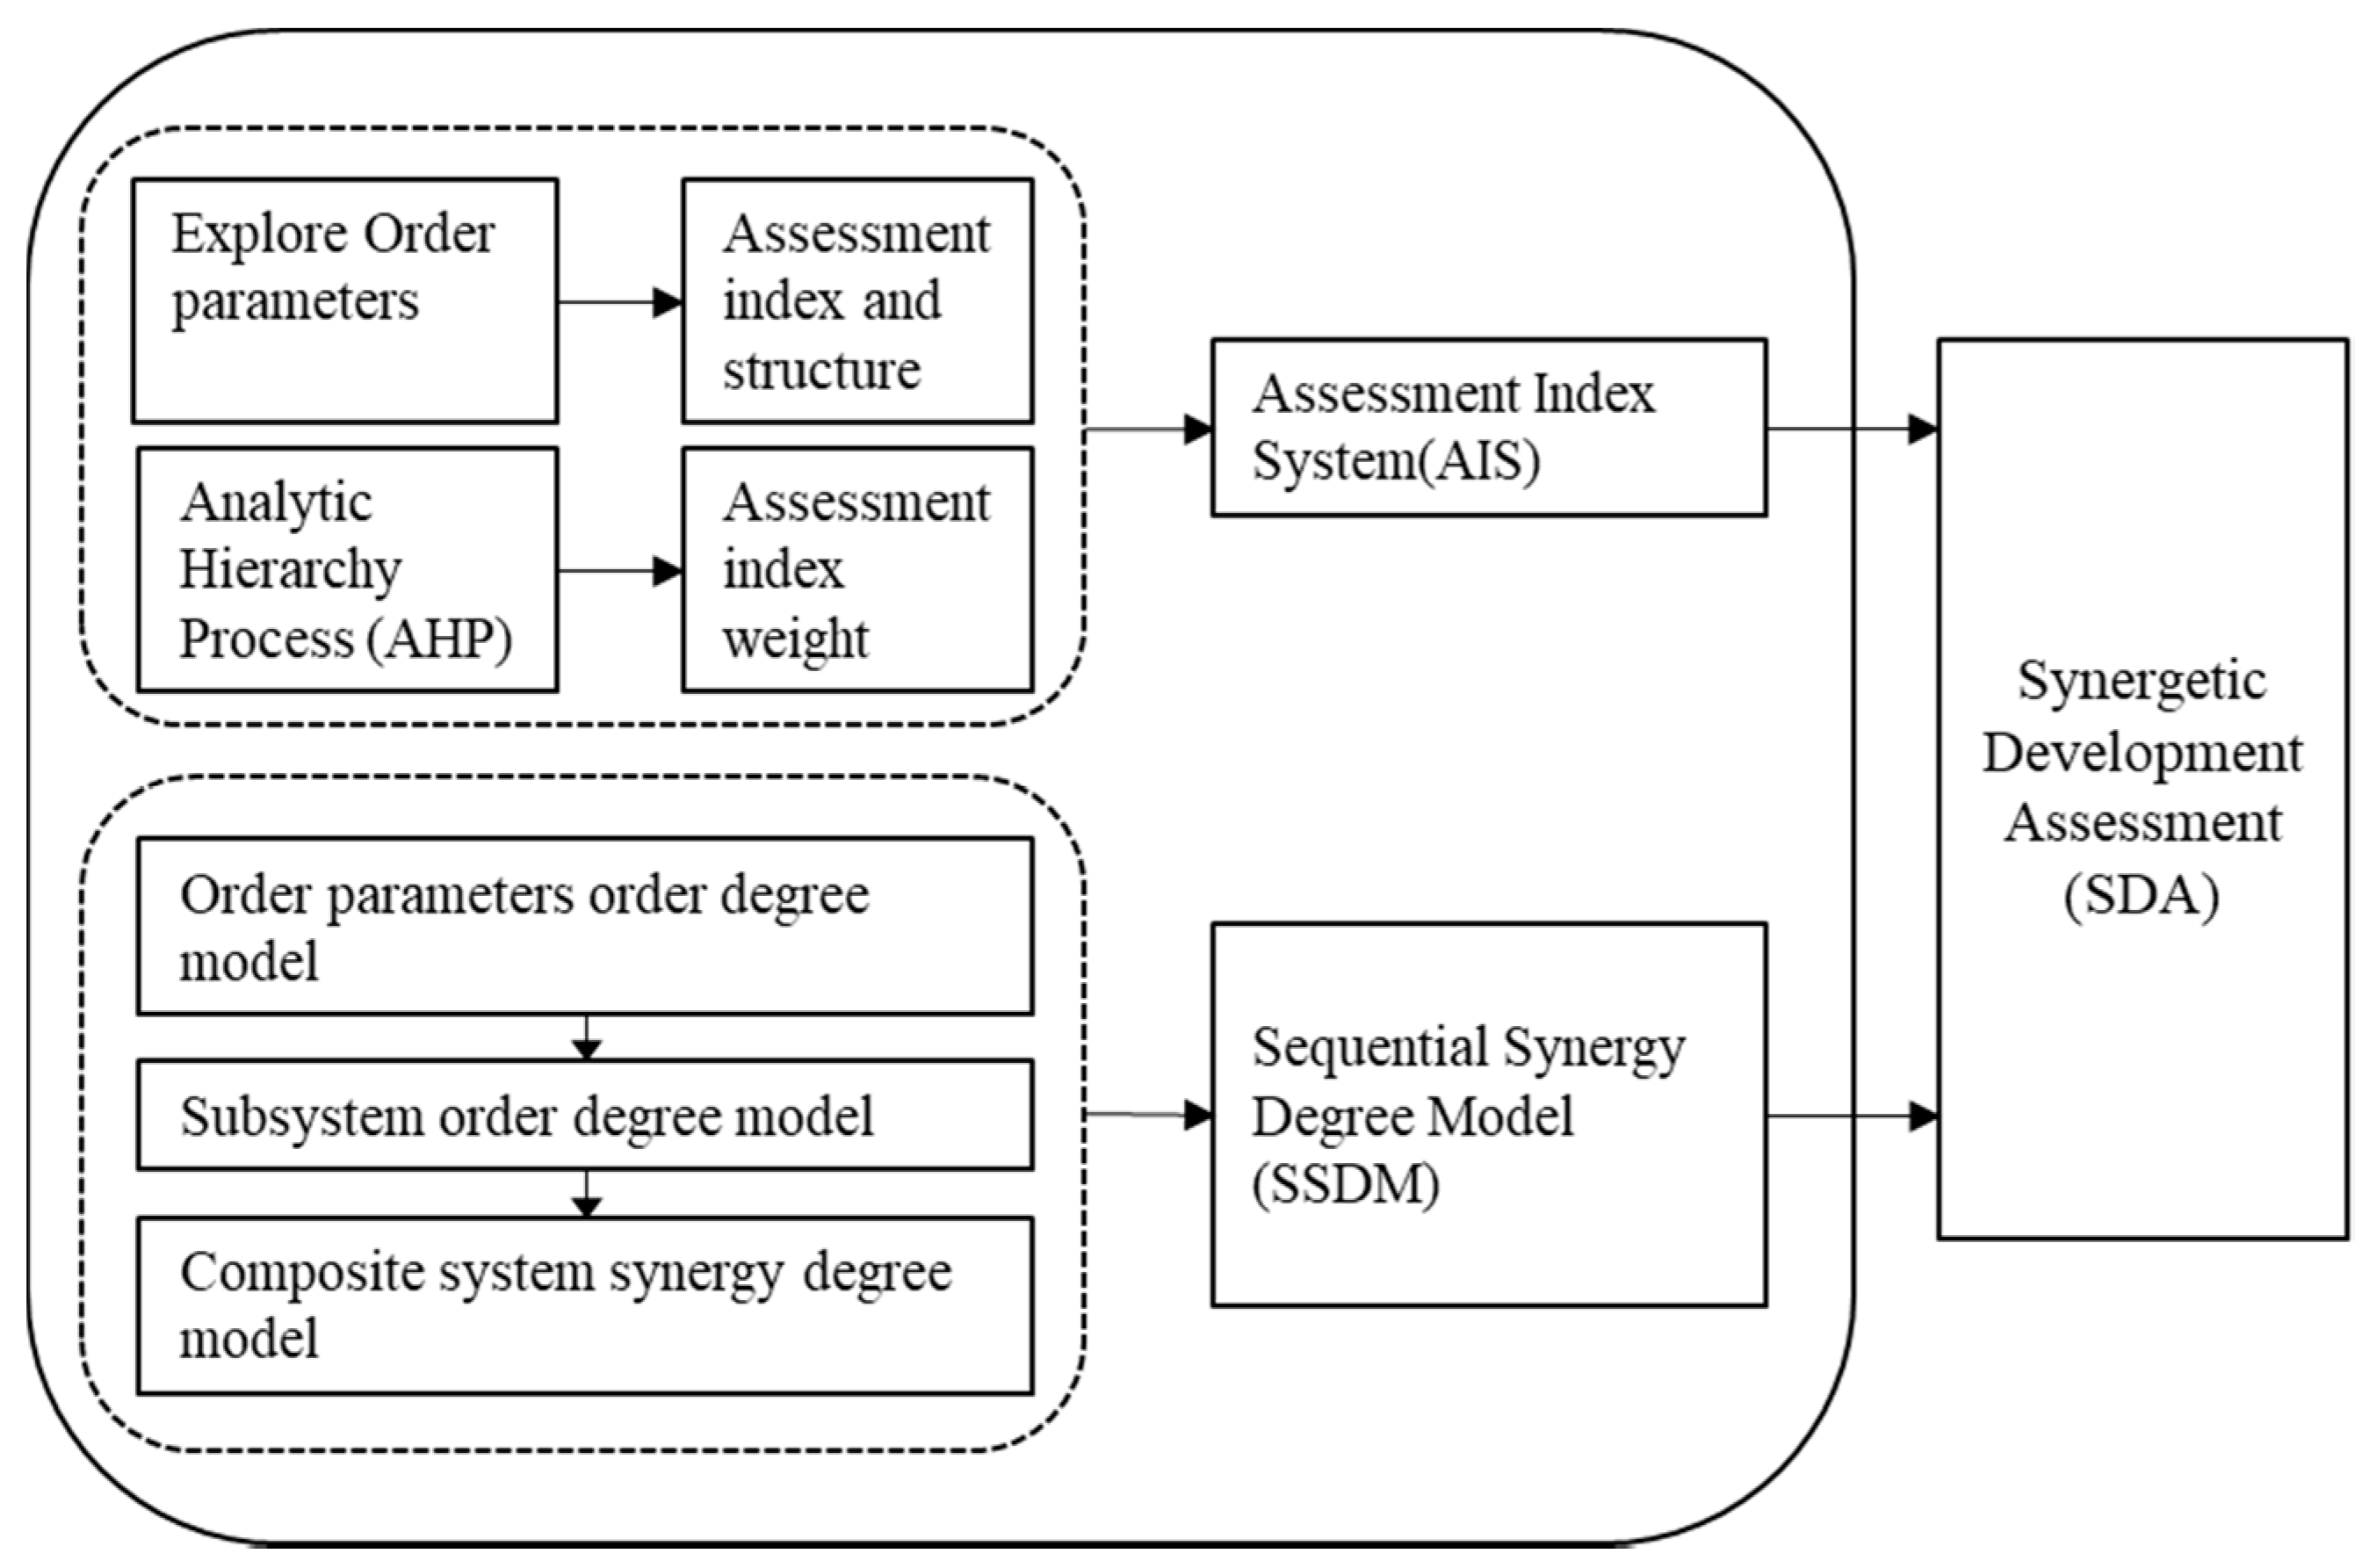
Figure 2.
The planning of the river system in the research area. Rivers with no marked name are to be built according to the 2013–2030 eco-city construction plan.
Figure 2.
The planning of the river system in the research area. Rivers with no marked name are to be built according to the 2013–2030 eco-city construction plan.

Figure 3.
Order degree dynamic development for environmental subsystem and order parameters.

Figure 4.
Order degree dynamic development for economic subsystem and order parameters.
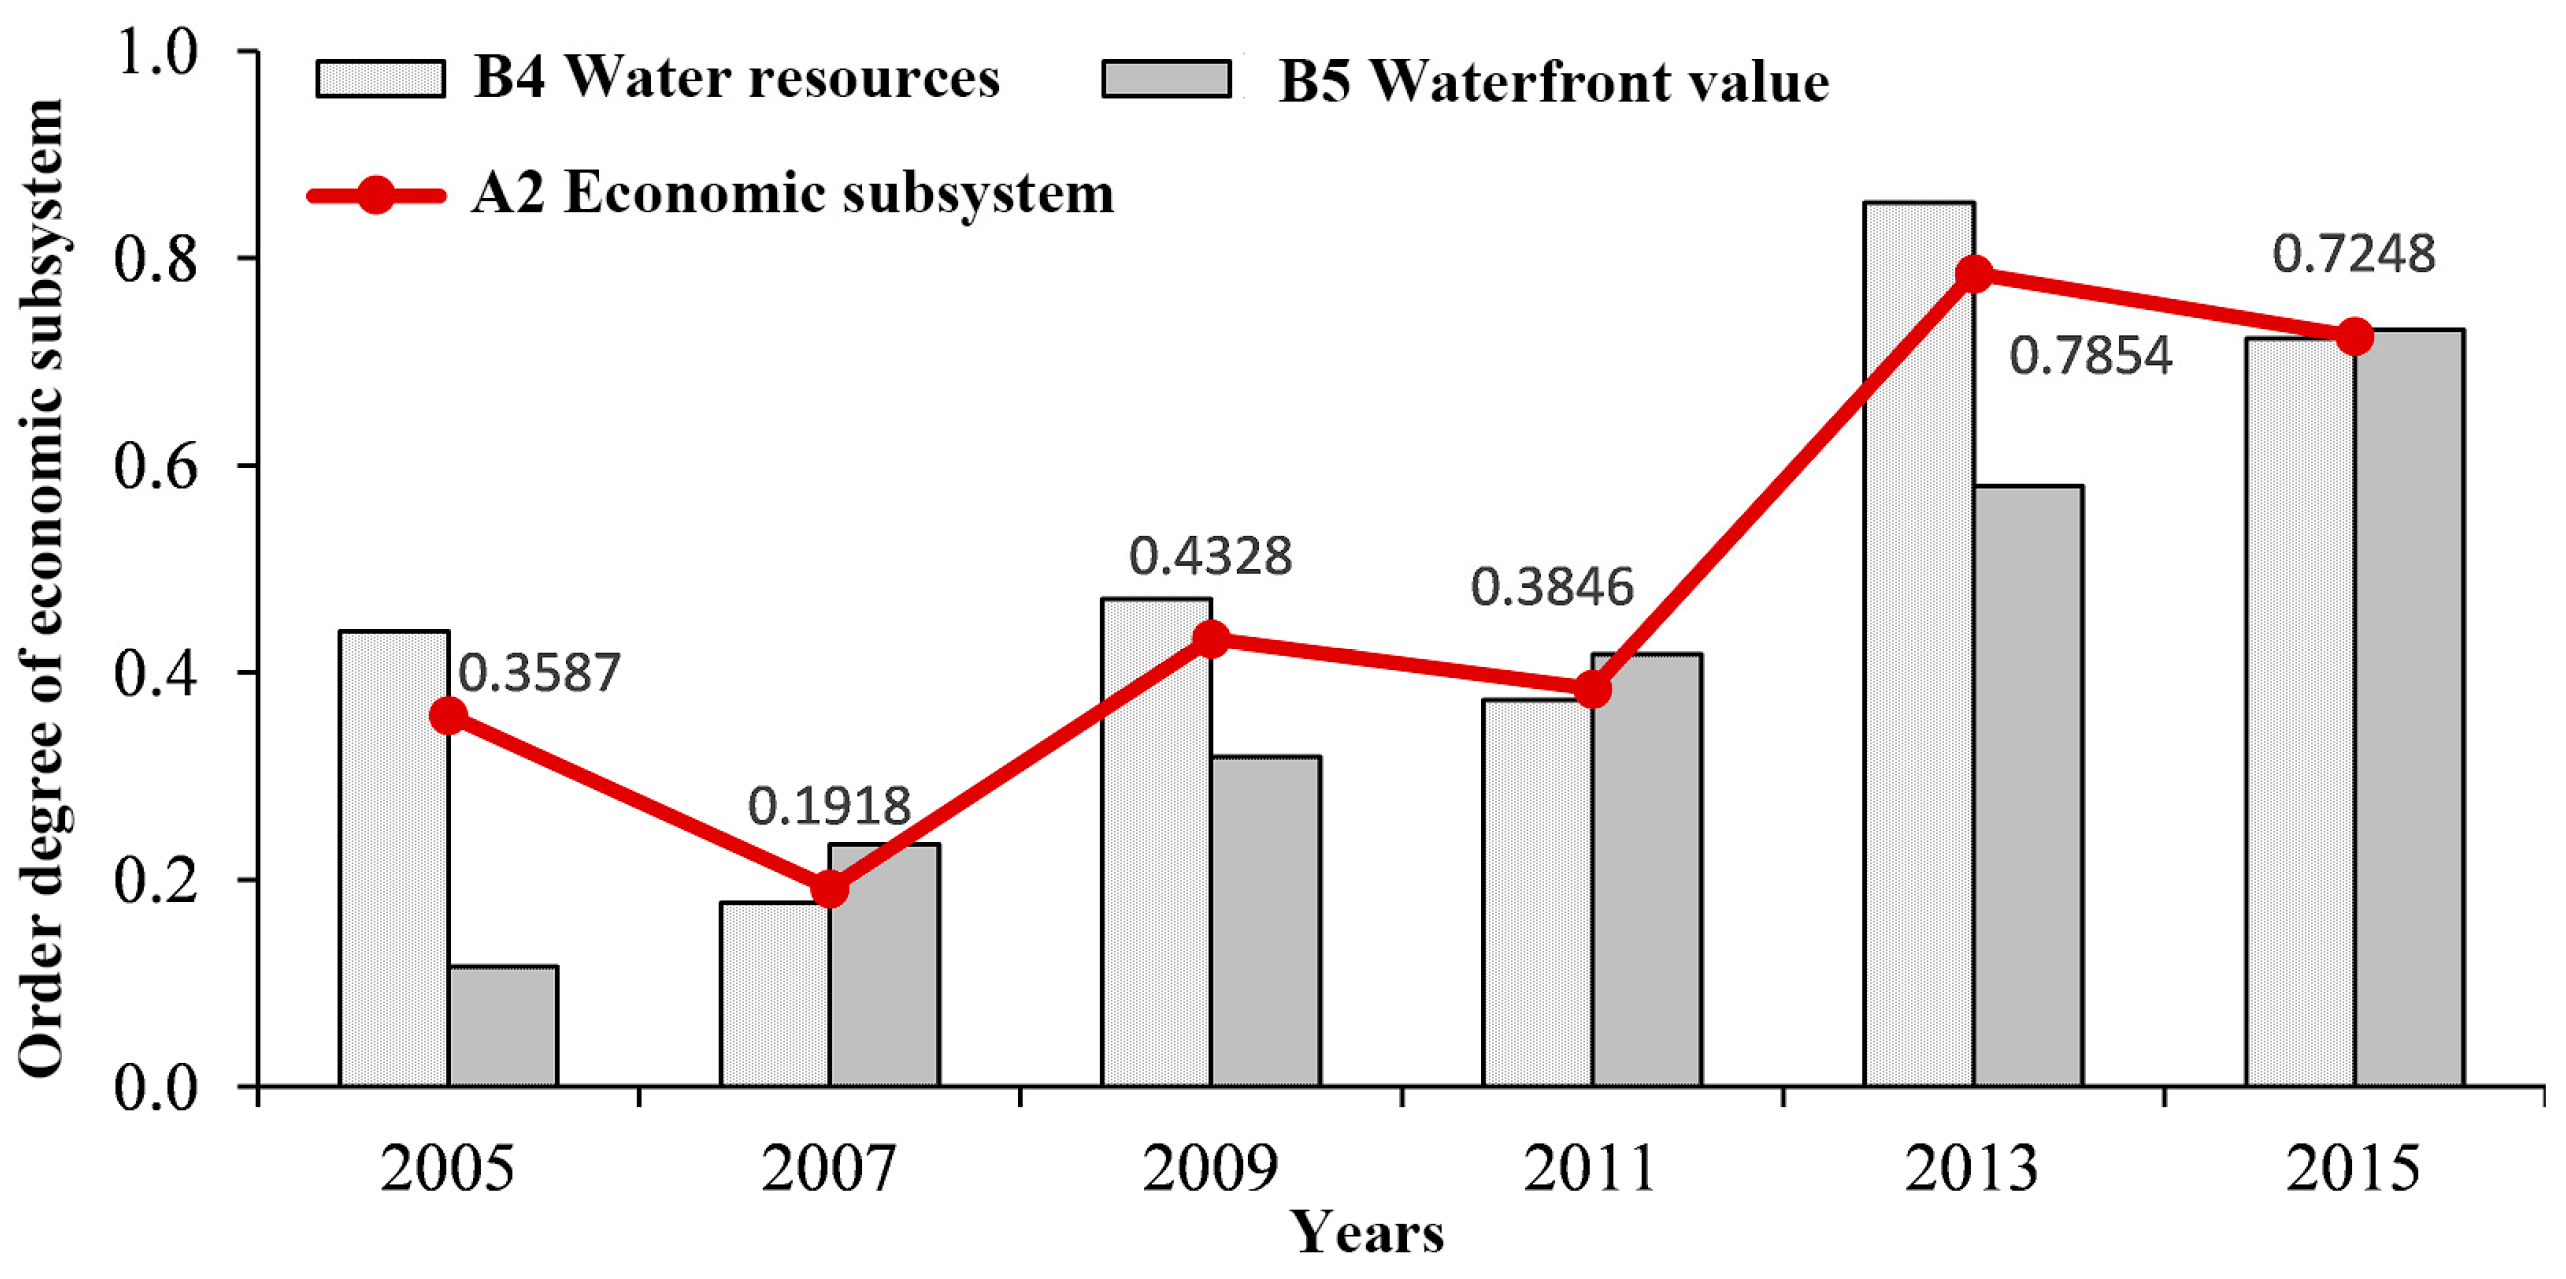
Figure 5.
Order degree dynamic development for social subsystem and order parameters.

Figure 6.
Dynamic development of synergetic degree of system and subsystems.


Table 1.
Statistics of the main rivers in the research area.
| River/Channel | Overall Length (km) | Catchment Area (km2) | Length of the River in the Study Area (km) | Width of the River and the Floodplain (km) |
|---|---|---|---|---|
| Songhua River | 1927 | 557,200 | 64.5 | 1.6–8.2 |
| Ashi River | 213 | 3489 | 29.7 | 0.5–2.1 |
| Hulan River | 523 | 35,683 | 17.1 | 0.6–2.0 |
| Majia Channel | 44.3 | 199.19 | 34.7 | <0.1 |
| Hejia Channel | 32.6 | 142.3 | 29.2 | <0.1 |
| Xinyi Channel | 21 | 48.9 | 7.4 | <0.1 |
Table 2.
Evaluation index system and weights based on order parameters.
| Target Layer | A: Criteria Layer | B: Secondary Criteria Layer | C: Indicator Layer |
|---|---|---|---|
| Subsystem | Order Parameter | Order Parameter Component | |
| (Weight) | (Weight) | (Weight) | |
| Synergetic development of URSL | A1 Environmental subsystem (0.540) | B1 River pattern (0.400) | C1 Drainage density (0.089) |
| C2 Longitudinal connectivity (0.268) | |||
| C3 Channel canalization (0.168) | |||
| C4 Riverbed stability (0.419) | |||
| C5 Winding (0.056) | |||
| B2 Hydrology and water characteristics (0.400) | C6 Environmental flow assurance rate (0.667) | ||
| C7 Standard-reaching rate of water function zones (0.333) | |||
| B3 Riparian zone pattern (0.200) | C8 Vegetation coverage (0.637) | ||
| C9 Ecological width assurance rate of riparian zone (0.258) | |||
| C10 Connectivity of riparian zone (0.105) | |||
| A2 Economic subsystem (0.163) | B4 Water resources value (0.750) | C11 Development and utilization rate of water resources (0.455) | |
| C12 Urban per capita comprehensive water consumption (0.321) | |||
| C13 Water consumption per 10,000 yuan GDP (0.139) | |||
| C14 Water accounted for the highest water consumption industry (0.085) | |||
| B5 Waterfront value (0.250) | C15 Appreciation of land value (0.250) | ||
| C16 Waterfront ecological industry output value (0.750) | |||
| A3 Social subsystem (0.297) | B6 Social security (0.682) | C17 Flood control indicator (0.500) | |
| C18 Qualification rate of drinking water source (0.500) | |||
| B7 Social benefit (0.216) | C19 Perfection degree of public facilities (0.101) | ||
| C20 Perfection degree of open space system (0.674) | |||
| C21 Accessibility of river landscape (0.225) | |||
| B8 Social culture (0.102) | C22 Public participation (0.875) | ||
| C23 Diversity of cultural landscape (0.125) |
Table 3.
Classification of composite system synergy degree.
| Synergy Degree | Synergetic Form | Morphological Description |
|---|---|---|
| U = −1 | No synergy | Subsystems are all in a state of disorder and confusion |
| −1 < U < 0 | Low synergy | Subsystems development are not balanced, and at least one subsystem is in a state of disorder |
| U = 0 | Inefficient synergy | Subsystems develop slowly or in relative disorder |
| 0 < U < 1 | General synergy | Subsystems develop orderly, but at a relatively low level |
| U = 1 | High synergy | Subsystems develop orderly at a high level and a balanced situation |
Table 4.
Dimensionless indicator data based on order parameters.
| Order Parameter | Order Parameter Component | 2005 | 2007 | 2009 | 2011 | 2013 | 2015 |
|---|---|---|---|---|---|---|---|
| B1 River pattern | C1 Drainage density (+) | 0.9526 | 0.9642 | 0.9758 | 0.9990 | 1.0339 | 1.0745 |
| C2 Longitudinal connectivity (+) | 2.0038 | 1.2402 | 1.0422 | 0.6052 | 0.5543 | 0.5543 | |
| C3 Channel canalization (+) | 1.0667 | 1.0667 | 1.0342 | 1.0112 | 0.9220 | 0.9220 | |
| C4 Riverbed stability (+) | 1.0588 | 0.8824 | 0.9412 | 1.0000 | 1.0588 | 1.0588 | |
| C5 Winding (+) | 1.0761 | 1.0761 | 1.0109 | 1.0109 | 0.9457 | 0.8804 | |
| B2 Hydrology and water characteristics | C6 Environmental flow assurance rate (+) | 0.8830 | 0.9091 | 0.9241 | 1.0286 | 1.0902 | 1.1649 |
| C7 Standard-reaching rate of water function zones (+) | 0.6480 | 0.7854 | 0.9064 | 1.0991 | 1.2591 | 1.3021 | |
| B3 Riparian zone pattern | C8 Vegetation coverage (+) | 0.7563 | 0.8067 | 0.8571 | 1.0084 | 1.1597 | 1.4118 |
| C9 Ecological width assurance rate of riparian zone (+) | 0.5683 | 0.6042 | 0.6424 | 1.1770 | 1.4757 | 1.5323 | |
| C10 Connectivity of riparian zone (+) | 0.7753 | 0.8235 | 0.8929 | 1.1312 | 1.1885 | 1.1885 | |
| B4 Water resources value | C11 Development and utilization rate of water resources (+) | 0.6925 | 1.5281 | 0.6906 | 1.2706 | 0.6868 | 1.1313 |
| C12 Urban per capita comprehensive water consumption (+) | 0.8509 | 0.8941 | 0.9084 | 1.0238 | 1.1767 | 1.1462 | |
| C13 Water consumption per 10,000 yuan GDP (−) | 0.6422 | 0.8032 | 1.0455 | 1.2375 | 1.2702 | 1.5477 | |
| C14 Water accounted for the highest water consumption industry (−) | 1.0688 | 1.0223 | 0.9956 | 0.9932 | 0.9834 | 0.9451 | |
| B5 Waterfront value | C15 Appreciation of land value (+) | 0.6040 | 0.7651 | 0.8456 | 1.1275 | 1.2886 | 1.3691 |
| C16 Waterfront ecological industry output value (+) | 0.6277 | 0.7846 | 0.9046 | 0.9969 | 1.2277 | 1.4585 | |
| B6 Social security | C17 Flood control indicator (+) | 0.9154 | 0.9314 | 0.9633 | 1.0272 | 1.0653 | 1.0973 |
| C18 Qualification rate of drinking water source (+) | 0.9728 | 0.9799 | 1.0073 | 1.0133 | 1.0133 | 1.0133 | |
| B7 Social benefit | C19 Perfection degree of public facilities (+) | 0.7039 | 0.8045 | 0.9050 | 1.0391 | 1.2737 | 1.2737 |
| C20 Perfection degree of open space system (+) | 0.6788 | 0.7332 | 0.7396 | 0.9157 | 1.4568 | 1.4760 | |
| C21 Accessibility of river landscape (+) | 0.8918 | 0.9415 | 0.9825 | 1.0058 | 1.0614 | 1.1170 | |
| B8 Social culture | C22 Public participation (+) | 0.8348 | 0.8599 | 0.8946 | 1.0161 | 1.1722 | 1.2224 |
| C23 Diversity of cultural landscape (+) | 0.6000 | 0.8000 | 0.9429 | 1.0571 | 1.2857 | 1.3143 |
Note: (+) means a positive effect; (−) a negative effect. Data sources: The data of C1 and C5 are calculated from the original graphic data provided by Harbin Municipal Bureau of Water Affairs and Planning. The data of C2, C3, C4, and C6 are from the monitoring records, ecological restoration documents provided by Harbin Municipal Bureau of Water Affairs. The data of C7, C12, C13, and C18 are from the original Municipal Bureau of Water Resources Bulletin (2005–2015). The data of C8, C9, and C10 are calculated from the original graphic data provided by Harbin Municipal Bureau of Water Affairs. The data of C11, C14, and C17 are calculated from the Municipal Bureau of Water Resources Bulletin (2005–2015). The data of C15, C16, and C22 are calculated from the Statistical Yearbook (2005–2016) and property survey documents provided by Harbin National and Municipal Bureau of Statistics and Land Resources Committee. The data of C19, C20, C21, and C23 are calculated from the graphic data and planning documents provided by Harbin Municipal Bureau of Planning.
Table 5.
The order degrees of environmental subsystem and order parameters.
| 2005 | 2007 | 2009 | 2011 | 2013 | 2015 | |
|---|---|---|---|---|---|---|
| B1 River pattern | 0.7385 | 0.6001 | 0.5942 | 0.5713 | 0.5746 | 0.5821 |
| B2 Hydrology and water characteristics | 0.2701 | 0.3058 | 0.3330 | 0.4177 | 0.4751 | 0.5202 |
| B3 Riparian zone pattern | 0.3160 | 0.3403 | 0.3658 | 0.5215 | 0.6269 | 0.7171 |
| A1 Environmental subsystem | 0.4666 | 0.4304 | 0.4440 | 0.4999 | 0.5453 | 0.5843 |
Table 6.
The order degrees of economic subsystem and order parameters.
| 2005 | 2007 | 2009 | 2011 | 2013 | 2015 | |
|---|---|---|---|---|---|---|
| B4 Water resources value | 0.4397 | 0.1775 | 0.4708 | 0.3736 | 0.8537 | 0.7227 |
| B5 Waterfront value | 0.1158 | 0.2346 | 0.3188 | 0.4176 | 0.5805 | 0.7309 |
| A2 Economic subsystem | 0.3587 | 0.1918 | 0.4328 | 0.3846 | 0.7854 | 0.7248 |
Table 7.
The order degrees of social subsystem and order parameters.
| 2005 | 2007 | 2009 | 2011 | 2013 | 2015 | |
|---|---|---|---|---|---|---|
| B6 Social security | 0.2557 | 0.3464 | 0.6662 | 0.7950 | 0.8338 | 0.8663 |
| B7 Social benefit | 0.1990 | 0.2459 | 0.2671 | 0.3692 | 0.6653 | 0.6890 |
| B8 Social culture | 0.7385 | 0.6001 | 0.5942 | 0.5713 | 0.5746 | 0.5821 |
| A3 Social subsystem | 0.2585 | 0.3340 | 0.5598 | 0.6766 | 0.7769 | 0.8069 |
© 2017 by the authors. Licensee MDPI, Basel, Switzerland. This article is an open access article distributed under the terms and conditions of the Creative Commons Attribution (CC BY) license (http://creativecommons.org/licenses/by/4.0/).
Share and Cite
MDPI and ACS Style
Qiao, J.; Wang, M.; Zhang, D.; Ding, C.; Wang, J.; Xu, D. Synergetic Development Assessment of Urban River System Landscapes. Sustainability 2017, 9, 2145. https://doi.org/10.3390/su9122145
AMA Style
Qiao J, Wang M, Zhang D, Ding C, Wang J, Xu D. Synergetic Development Assessment of Urban River System Landscapes. Sustainability. 2017; 9(12):2145. https://doi.org/10.3390/su9122145
Chicago/Turabian StyleQiao, Jingya, Mo Wang, Dongqing Zhang, Chenyang Ding, Jingjing Wang, and Dawei Xu. 2017. "Synergetic Development Assessment of Urban River System Landscapes" Sustainability 9, no. 12: 2145. https://doi.org/10.3390/su9122145
Note that from the first issue of 2016, this journal uses article numbers instead of page numbers. See further details here.