Abstract
Worldwide, damage to mangroves is alarming. Restoration is required to recover mangrove ecosystems, and communities’ involvement is a primary factor to reduce the threat to mangroves. Their participation might be interpreted as the appropriate decision concerning conservation and utilization of mangroves. Using a contingent valuation approach, this study assesses mangroves’ values to local communities through their willingness to contribute labor to obtain monetary value. Results showed that the opportunity cost of time was valued at IDR 398.76 thousand (US$29.99) a month or IDR 4.79 million (US$359.90) per year. A total annual benefit of mangrove restoration using the wage rate of time (WRT) is IDR 143 billion (US$10.77 million) per year. Accessing such information is crucial to making the appropriate decisions about conservation of mangroves within the context of developing countries that have poor coastal communities and low incomes. Tobit regression determined that five variables affect willingness to provide labor time and WRT significantly for mangrove restoration. These findings can support decision-makers with the relevant information for assessing a mangrove restoration project.
1. Introduction
Mangroves produce ecological and economic services for humans. For instance, they protect the area from tidal waves and erosion [1], improve water quality and control sediment [2]. Mangroves also act as habitats and nurseries for fish, shrimp, and crab [3] and are sources of ecotourism [4]. Furthermore, mangroves provide approximately US$1.6 billion per year in ecosystem benefits worldwide, thus supporting the economy in coastal areas [5,6]. However, the global threat to mangroves has become gigantic in recent years. Mangroves have declined significantly worldwide, a decrease of 20% in the last 25 years [2,7]. Anthropogenic pressure, industrialization, and conversion in commercial land uses have resulted in the loss of mangroves areas all over in the world [8]. In Indonesia, mangroves have been declining rapidly. Giesen et al. [9] reported that approximately 33% of Indonesian mangroves areas decreased between 1980 and 2000. In this period, 4.5 million hectares of mangroves areas fell to under 3 million hectares. In many regions of Indonesia, population pressure and urbanization as well as a conversion of mangrove areas into agriculture, industrialization, and coastal aquaculture are the driving factors threatening mangroves. Indonesian mangroves are the most significant mangrove area in the world with 3,112,989 hectares or 22.6% of the global total of mangroves [2,7]. Indonesia has the greatest variety of species worldwide, accounting for 45 out of the 75 species.
Many natural ecosystem benefits, including mangroves’ benefits, have the characteristics of pure public goods, which means that people can receive the benefit they provide without reducing the level of service received by another beneficiary (e.g., coastal protection, beautiful views, and carbon sequestration). Also, mangroves act as quasi-public goods when the benefit of services by the recipient at a particular level of use does reduce the degree of assistance obtained by others (e.g., feeding and nursery services for fisheries). These characteristics provide the limitations of potential for private incentives to manage sustainable mangroves services, and lack of markets for such services causes market failure on mangrove ecosystems services [10]. As a result, mangroves are threatened and degraded. Mangroves, moreover, are widely undervalued in both private and public decision-making relating to benefit-cost analyses of conservation and restoration versus other commercial land uses [11]. Therefore, information on the economic value and accurate estimation for mangrove services as natural capital are necessary for making the best choices relating to conservation and restoration of mangroves.
Mostly, mangrove services are undervalued in both private and public-policy relating their non-market services. The lack of information on the economic value of mangrove services has led to neglect in decision making, and the ecological benefits of mangrove as natural capital tends to be rejected when compared directly with the economic value of other public investments [10]. As a result, mangroves converted into the instantly profitable venture such as aquaculture, and coastal industries. Relating to the problem of information in understanding the adequately economic value of mangrove services, it is crucial to policy makers implementing the estimation of mangrove ecosystems values.
Furthermore, mangrove loss could lead to a diminishing of mangrove function as a nursery ground for aquatic organisms, which in turn reducing the marine yield. As a result, the income of communities whose mangroves-based livelihoods decline. Mangrove function, moreover, provides the protected coastal area from natural disasters. Participation of local communities, therefore, is significant to contribute to mangrove conservation and restoration.
The primary objective of this study is measuring the local communities’ willingness to contribute labor (WTCL) for assessing mangrove restoration using the contingent valuation method (CVM). This method is applied to measure the willingness to pay (WTP) of mangrove restoration in Mahakam Delta. The adoption of money as a payment vehicle in contingent valuation (CV) is well known for measuring the value of WTP of public goods and environmental quality. It, however, poses certain limitations when applied in developing countries relating low disposable income and imperfect labor markets [12,13]. Using a monetary payment vehicle can confine the households’ ability to allocate any part of their income to the restoration program, related to having tight budgets and a low income. We hope the results provide the estimation of the value of proper mangrove restoration and contribute to decision makers in the planning of mangroves restoration actions that can embrace and stimulate the willingness of local communities to be involved in mangrove conservation and restoration.
2. Materials and Methods
2.1. Study Area
This study was carried out in the Mahakam Delta located in Kutai Kartanegara Regency (Figure 1). This regency is one of the regencies in East Kalimantan Province. The distribution of poor people in this regency is 56.99 thousand people, which is the largest distribution of poor people in the province. Kutai Kartanegara accounts for 26.77% of provincial poverty levels [14]. About 67.40% of poor people in this area live in coastal and rural areas. Central Bureau of Statistics [14] reported that adult (15+) literacy rate in Kutai Kartanegara was 1.48%.
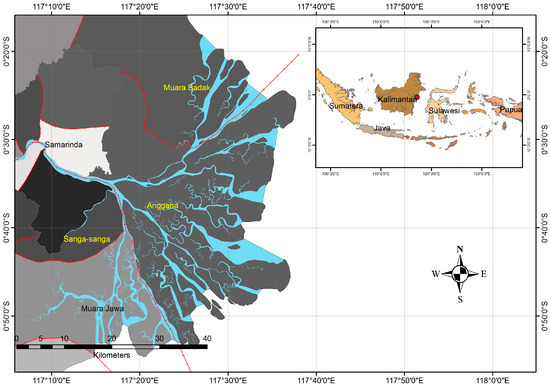
Figure 1.
Study areas in Mahakam Delta.
Mahakam Delta consists of five sub-districts, including 20 villages. Total population and households in this area are 99,347 individuals and 31,241 head households, respectively, with the primary occupations being fishermen and fish farmers. About 32% of households in the study area are fishing households [14]. The Mahakam Delta covers 5200 km2 consisting of 1500 km2 of terrestrial area, 1000 km2 of the delta front, and 2700 km2 of prodelta. The deposition of suspended solids has formed the delta, including 46 small islands that have been shaped over time as the result of sediment [15,16,17]. The Mahakam Delta has about 86 plants and 260 bird species as well as 86 species of freshwater fish, giving this area as one of the highest levels of biodiversity in Indonesia. Bourgeois et al. [18] noted that around 1950, the Mahakam delta was virtually uninhabited, and the original vegetation of mangroves grew in the Mahakam Delta. The total area is about 106,000 hectares. Nypa dominates mangrove species covering 55% of the entire area. At the time, Mahakam Delta was home to the most prominent pure Nypa vegetation in the world [19]. However, mangroves in this field are continuing to disappear. Recent data from local government indicates that the mangrove forest in the Mahakam Delta is about 29,600 hectares. Loss of mangrove forest from 1992 to 2009 is estimated at 72% [14].
2.2. Data Collection and Survey Structure
We designed a structured questionnaire by conducting a pre-test survey on a sample of 30 randomly chosen households to ensure that respondents had accurate and sufficient information to make them fully understand the hypothetical market situation. We arranged the questionnaire with three parts. The first section describes the general information about current mangroves’ condition in the study area. It also explains the impact of mangrove degradation on local communities’ livelihoods, including the advantages of mangrove restoration programs. The second part was comprised of questions for respondents regarding the WTCL for mangrove restoration program. The respondents’ duration of labor time was also requested in this part. The last part started by asking the respondents about socioeconomic characteristics including age, gender, education level, income, occupation, number of household members, and residence status. A sample of respondents is selected based on the highest number of households in a village. Two villages (Tani Baru and Muara Pantuan) are currently under the jurisdiction of the Anggana sub-district, and two settlements (Salok Palai and Saliki) are under Muara Badak sub-district. The survey was conducted from April to June 2016 with face-to-face interviews. It required between 30 and 45 min for completing interviews. Of the 380 distributed questionnaires, 364 were completed.
2.3. Analytical Framework
2.3.1. Determinants and Intensity of WTCL for Mangrove Restoration
Contingent Valuation Method (CVM) is a widely used economic valuation methods for ecosystem and ecological services. In environmental economics, CVM is applied to estimate the monetary value of changes in non-use values, non-market values or both of environmental resources [20,21]. CVM is based on interviews with people regarding a contingent valuation survey that presents them with a hypothetical scenario to elicit individuals’ maximum willingness to pay (WTP) or willingness to accept (WTA). Money is a payment vehicle widely used in contingent valuation (CV) questions [22]. In developing countries, however, the application of money as a payment vehicle in CV becomes limited, especially for low-income people who cannot contribute any part of their income for public activities. As an alternative measure in CV, therefore, non-monetary payment in the form of labor contribution is widely used in developing countries (e.g., [23,24,25,26]). As a payment vehicle for CV studies, the theoretical framework of using time is used based on the concept of a time compensating surplus comparable with a compensating surplus measure of monetary WTP [26,27]. Based on this framework, we can express the welfare estimates of restoring mangroves in following:
where V denotes the indirect utility function representing the amount of time a respondent is willing to labor (WTCL) for mangroves restoration and also helps to provide a change in environmental quality from unimproved (q0) to improved (q1). The labor time contribution to mangrove restoration denotes a payment that reduces availability in respondents’ time budget (M) for other activities. Z is the variable indicating the vectors of the socioeconomic status of the respondents.
CV studies take various forms, including open-ended, dichotomous choice, multiple-bounded dichotomous choice, iterative bidding, and payment cards. In this study, we adopt an open-ended CV format to elicit each respondent’s WTCL for mangrove restoration. Respondents who were not interested to contribute labor for mangrove restoration or did not accept the hypothetical scenario defined in the survey were dealing with as having zero values [28]. Strazzera et al. [29] stated true zero values could be covered in CV analysis using Tobit model. This model accepted zero values, but it is not observed because of censoring at zero. Application of Least Squares Estimation in open-ended bid formats often produces biased and inconsistent parameter estimates when a dependent variable in the model is censored [30]. Also, useful information will be missing, and there is sample selection bias into the model if we reduce zero values from the sample set. Therefore, the maximum likelihood estimation technique of the Tobit model is used to provide unbiased and suitable parameter estimates [31].
where, is latent or unobserved willingness to labor for mangrove restoration; is unknown parameter vector to be estimated; is a vector of explanatory variables, is an independently distributed error term assumed to be normally distributed with a zero mean and constant variance ; and i = 1, 2, …, n represents individual in the sample. The observed dependent variable as follow [32]:
The likelihood function for Tobit model as follows:
where and are the distribution and density function, respectively, of the standard normal variable. β represents a vector of Tobit maximum vector likelihood estimates; and σ is the standard error of the error term.
2.3.2. Marginal Effects
Marginal effects are the change of predicted probability related to changes in explanatory variables of Tobit model [33]. Marginal effects explain the effects of a given explanatory variable on the probability of dependent variable, which coefficients of Tobit model are not able to interpret directly. The formula can be shown as follows:
2.3.3. Conversion of Labor Contribution into Monetary Value
In this study, respondents who have positive responses to WTCL provide labor contribution. Meanwhile, those who do not respond to the hypothetical scenario of CV survey are treated as having zero values. Labor contribution will be converted into monetary values to determine the economic value of mangrove restoration based on the assumption that voluntary time of respondents will require an opportunity cost. Respondents who are willing to contribute as labor will be asked about their expected wage rate (IDR per hour) if they are to get paid. Thus, WTCL can be converted into monetary value. The expected wage rate of respondents is used to identify the opportunity cost of time contribution for mangrove restoration.
Arbiol et al. [26] noted that the opportunity cost of time could be valued using the average wage rate of time (WRT) if respondents undertook trade-off between working time and time spent contributing. Therefore, the opportunity cost of time can be estimated in a comparatively straightforward approach using the average wage rate of time (WRT) as described in Equation (6):
where, denotes WTCL for mangrove restoration by respondent i; represents the expected wage of respondent i, and is the total number of respondents in the sample.
3. Results
3.1. Descriptive Statistics
Table 1 presents descriptive statistics of those surveyed. On average, labor time contribution of interviewees is 9.18 h/month with the distribution ranging from 0 to 80 h/month. Of the 360 samples, 261 respondents (71.70%) were willing to contribute to mangrove restoration programs, while 103 respondents (28.30%) were not willing and gave a zero value. About 79% of respondents in the study area are male and dominated by households who have three members. The average age of respondents is in the productive life phase indicated by the mean actual age that ranged from 31 to 40 years. We found that 34% of occupation types in the study area were fish farmers and immigrants (66%). On average, education level of respondents is primary school, implying that their work does not require any education background. The average monthly income of respondents ranged between IDR 2 million and IDR 2.9 million (US$150.42 to US$218.11).

Table 1.
Descriptive statistic of the sampled respondents.
Regarding the participation of respondents in mangrove restoration, we asked respondents to select the options of planting mangrove seedlings, monitoring plants’ progress and protecting the mangrove area. Only 37% of respondents chose the planting seedlings, and 63% wanted the other options, including respondents were not willing to participate. On average, 90% of them agreed that the restoration of mangroves was their responsibility. The data also shows about 40% of respondents recognize that mangroves ecosystems are a nursery ground for aquatic organisms.
3.2. Interest of Household in Salaried Work
Respondents were asked to express their interest in working if money was available as compensation with some questions regarding their passion. If willing to work, they were offered the participation types consisted of planting of mangrove seedlings, monitoring of plants progress, and mangrove areas protection. As mentioned earlier, only 261 households or 71.70% were willing to contribute to mangrove restoration. We offered them some alternatives of participation including the planting of mangrove seedlings, monitoring of plants’ progress, and mangrove areas protection. Table 2 reveals that among 261 households, 134 (51.34%) select planting of mangrove seedlings as their preferences, 86 homes (32.95%) choose the monitoring of plants’ progress and the remaining 41 households (15.71%) select mangrove areas protection.
Table 2.
Restoration work preferences of households.
3.3. Labor Time and Wage Rate of Time (WRT)
As explained in Section 2, households were asked whether they would be willing to contribute labor for the mangrove restoration program. Those who were ready to participate were then asked how many hours per day, how many days per week and how many weeks per month they would be prepared to contribute. Results in Table 3 show that households that select labor time below 10 h per month or 2.5 h per week are dominant, with 143 respondents (54.79% of the sample), followed by 10–30 h per month of 101 households, or 38.70%. Labor time with a duration of 51–70 h per month and length of above 70 h per month are the fewest working hours that participants choose, namely three households (1.15%) and one family (0.38%), respectively.
Table 3.
Distribution of willingness to contribute labor time and wage rate of time (WRT).
Out of the 261 households, about 66.28% (n = 173) have a WRT amount below IDR 500 thousand (US$37.61) per month with a contribution time between 4 and 16 h per month. Besides, about 59 households or 22.61% have WRT value range between IDR 500 thousand (US$37.61) and IDR 1 million (US$75.21) monthly with contribution time between 8 and 36 h per month. Only 2.68% of respondents or seven households have WRT value above IDR 2 million (US$150.42) per month with contribution time between 36 and 80 h per month.
3.4. Monetary Value of Mangrove Restoration
The opportunity cost of time using the average wage rate of time where households are WTCL to mangroves restoration is valued at IDR 398.76 thousand (US$29.99) a month or IDR 4.79 million (US$359.90) per year. The estimated benefits of mangrove restoration were determined as the estimated annual opportunity cost of time, the number of households, and the questionnaire response rate (see Appendix A). Table 4 shows that the number of homes living in the Mahakam Delta was 31,241. Of 380 questionnaires distributed, 364 respondents responded (thus, the survey response rate was computed as 364/380 = 0.96). Therefore, a total annual benefit of mangrove restoration using the WRT of IDR 143 billion (US$10.77 million) per year. These values reflect 0.12% of GDP of Kutai Kartanegara Regency, valued at IDR 117,461 billion or equivalent to US$8.83 billion [19].
Table 4.
Economic value of mangrove restoration.
3.5. Parameter Estimates of Willingness to Contribute
Table 5 shows the results of the estimated parameters and marginal effects of the independent variables that were hypothesized to influence households’ WTCL time and WRT for mangrove restoration. The estimated Tobit model is determined to be the good fit of the model as the value of the Likelihood Ratio-Chi-Square test (124.88) is significant at 1% level of significance. Of 10 independent variables considered in the Tobit model, five variables affect willingness to provide labor time and WRT significantly for mangrove restoration. Based on the obtained results, for labor time, planting of mangrove seedling and responsibility variables are statistically significant at 1% and have a positive coefficient. The estimated coefficient for nursery depicting mangrove’s biological function as a breeding ground for fish, shrimp, and crab is also positive and significant at the 5% level. Meanwhile, family size and income variables are considerable at 1% and have a negative coefficient. The results in Table 5 also indicate gender, planting of mangrove seedling, and responsibility variables have a positive coefficient with statistically significant influence on WRT at 10%, 1%, and 5%, respectively. Family size and income variables, meanwhile, are statistically significant at 1% and have a negative coefficient.
Table 5.
Tobit model estimates of willing to labor (WTCL) for mangrove restoration.
Gender has a significantly positive relationship with WRT (p < 0.10) that indicates male respondents expect to obtain considerably higher WRT in mangrove restoration programs than female respondents do. The marginal effect of gender presents that when households that contribute labor time for restoring mangroves are male, the probability of WRT increases by 9%. Furthermore, the parameter estimate of the family size variable is negative and significant toward both labor time contribution and WRT with the p-value less than 0.01. It expresses that households with larger family size contribute less WTCL time and expected WRT than households that have relatively smaller family size. The result of the marginal effects in Table 5 also displays that when the family size of the household increases by one member, then the probability of a household’s WTCL time and expected WRT declined to 5%.
Similarity, the other variable that had a negative and significant effect on both labor time contribution and WRT was income with the p-value less than 0.01. This indicates that households with lower income contribute more WTCL time and expected WRT than those with higher incomes. The marginal effect shows that a one-rupiah increase in a household’s income will decrease the probability of WTCL time and expected WRT to 10%.
Additionally, planting of mangrove seedlings as participation type selected by the household has a positive and significant influence on both labor time contribution and WRT (p < 0.01). It demonstrates that a family that chooses this participation type has more WTCL time and expected WRT than other participation models. The marginal effect also shows that when a household that decides to plant of mangrove seedlings increases by one family member, the probability of a household’s WTCL time and expected WRT increases by 23% and 33%, respectively. Interestingly, WTP results reported by Susilo et al. [34] shows that a household who selects planting of mangrove seedlings tends to be less willing to pay for mangrove restoration, or in other words, respondents who selected other participation types such as the monitoring of plant progress and the protection of the mangrove area are more willing to pay. Thus, this WTCL result confirms that a household prefers to donate time to contribute labor than to pay.
As expected, households that agreed about the protection of mangroves have a positive sign and significant effect on both labor time contribution and WRT with the p-value less than 0.01 and 0.05, respectively. It proves that households are willing to contribute more time for labor and expected WRT toward mangroves protection. Correctly, the marginal effect shows that every home that agrees to be responsible for mangrove protection increases the probability of labor time by nearly 24% and the chance of WRT by 20%.
As explained earlier, mangroves have multiple benefits such as providing a nursery ground for aquatic organisms, protecting coastal areas from tidal waves and erosion, improving water quality, controlling sediment and encouraging ecotourism. Households that selected mangroves as nursery ground are more willing to make a contribution of labor time than other chosen benefits. Results from the marginal effects also show that when a household that picked it increases, it also increases the probability of a family being willing to contribute labor to 10% and expected WRT increases by 6%.
4. Discussion
Some attractive finding emerged from the study. Firstly, compared to Reference [32], results revealed that WTCL values based on a labor payment vehicle provided a higher mean than the mean WTP value under a monetary payment vehicle. In line with studies conducted by Hung et al. [25], households in this study are more likely to state a real WTCL than to donate money for mangrove restoration. Contrary to the situation in developed countries, where payment vehicles are appreciated only in money terms, in a context of developing countries, payment vehicles as a donation or a pay money are impractical for poor households with tight budgets. Thus, households cannot convey their appreciation of environmental programs.
Secondly, family size and income have a significant effect with a negative sign on the willingness to contribute. It is possible that households with larger family size dedicate more attention to their families and have a high cost of living. Therefore, they are too busy with their primary occupations to meet the needs of their family and cannot spare the time or less willing to contribute labor to mangrove restoration. Furthermore, the tendency of the household with higher income is to be less willing to give work than households with lower incomes are. This finding might be explained because mangroves ecosystems are public goods, and the presence of free-riding behavior in the valuation of common-property resources causes small WTCL values. However, in comparison with WTP results from Susilo et al. [32], although not statistically significant, a household’s income has a positive sign, showing that those with higher incomes are more willing to pay for mangrove restoration. It revealed that those who have lower earnings in the study area were more willing to donate time than to give money for mangrove restoration. According to Arbiol et al. [26], within the context of developing countries, the use of labor time as a payment vehicle in CV is more precise than the use of money, related to the fact that disposable income is low [13].
Another finding is that planting of mangrove seedlings as one of participation type has a significant influence with a positive sign on the willingness to contribute. The local community is familiar with mangrove planting programs. Since mangroves have been massively degraded in the study area, the local community is aware of mangrove planting activity. Governments, NGOs, the private sector and universities have raised funds and involved local communities in planting mangrove seedlings as part of mangrove restoration actions.
Lastly, this study also examines households’ responses towards their responsibility and their knowledge about mangroves’ functions with the willingness to contribute to mangrove restoration. This study revealed that households believed that they were also responsible for the sustainability of mangrove forests were willing to provide more. This finding is essential in this study because it shows that if households’ responsibility is enhanced, they will provide more value for restoring mangrove ecosystems. Similar to the results by Tuan et al. [34], local community’s awareness and responsibility for the impact of climate change provided significant implications toward their willingness to participate in mangrove restoration. Furthermore, knowledge about mangrove functions may increase local community interest in participating in mangrove restoration. Fish farmers and fishermen are the occupation type that dominate in the study area. Those who recognized that mangroves function as a nursery ground for aquatic organisms and provided benefits for their communities had higher levels of willingness to contribute.
These findings of the study must be explained to deal with several limitations. First, use of an expected wage of households to identify the opportunity cost of time contribution might result in overestimation. For instance, in comparison, we use a minimum wage stipulated by the Governor of East Kalimantan Province Regulation No 561/K.573 of 2016 to replace the using of expected wage from of households. This regulation stipulated minimum wage for 2017 is IDR 2.33 million (US$175.96) a month. According to Indonesian labor law No 13 of 2003 that the working hours are 40 h a week or 160 h a month, thus, the minimum wage used is IDR 14.62 thousand (US$1.10) an hour. The opportunity cost of time under a minimum wage brings the value of mangrove restoration down to 3.24 times from an expected wage. Future studies could be considered by offering to respondents regarding an expected wage by households and a minimum wage stipulated by the local government simultaneously and then compare them to identify the true preference of respondents in determining willingness to contribute labor.
Another limitation of is that some variations of WTCL values are found regarding the large range between some zero responses and a few high WTCL values (maximum 80 h/month) when using an open-ended question format. The way this form was applied made it less sensitive to components in the questionnaire, and the lack of incentive compatibility gives rise to a free-ride from respondents [26,35]. It is an exciting finding that merits further studies to explore the use of dichotomous question formats. Loomis [36] noted that the dichotomous question format is a suitable incentive device for respondents to express true preferences about a provision of the goods.
5. Conclusions
In this study, using CVM payment in a labor contribution design, we attempt to convert labor-time donation of households to monetary value of the benefits that local communities receive from restoration of mangroves. Also, we also identify how socio-economic characteristics of families and their awareness affect whether they are willing to contribute labor to mangrove restoration. This study shows that the average homes in the study area ready to provide work to the restoration program. Furthermore, the study findings indicate using labor-time contribution as a CVM payment vehicle is acceptable to households in the Mahakam Delta. The use of opportunity cost of labor affords estimates of economic value of mangrove restoration to provide the relevant information for assessing a mangrove restoration project.
Evidence from the study demonstrates that socioeconomic characteristics of households such as family size and income are significant factors that influence the household’s willingness to contribute labor for mangrove restoration. Also, policy should focus on considering responsibility, participation type and knowledge of local communities to participate. Furthermore, information on benefits and economic values of mangrove services should be regularly disseminated through education and communication programs to enhance awareness of the sustainability of mangrove services.
Lastly, despite its limitations, this study contributes to the limited literature on the economic value of mangrove restoration and also adds to the literature on the use a CVM using specific payment forms for elicitation of preferences within the context of developing countries.
Acknowledgments
Many thanks to all the respondents who were involved in this study. The authors also thank the staff and the students in the Department of Fisheries Socio-economics, Mulawarman University, Indonesia and Yayasan Mangrove Lestari for helping with the surveys in the Mahakam delta, and the Ministry of Research, Technology, and Higher Education of the Republic of Indonesia.
Author Contributions
Heru Susilo, Yoshifumi Takahashi, and Mitsuyasu Yabe conceived and designed the questionnaire; Heru Susilo conducted the survey, analyzed the data and wrote the manuscript; and all the authors edited the manuscript and approved the final version.
Conflicts of Interest
The authors declare no conflict of interest.
Appendix A. Questionnaire on Mangrove Restoration in Mahakam Delta
As described, mangrove restoration aims to restore ecological functions in support of human life. The benefits of mangrove restoration program are:
- Increased of habitats for fish, shrimp and crabs that support the community’s livelihoods;
- mangrove vegetation provides new livelihood options for the local community through ecotourism activities; and
- Mangrove vegetation protects coasts from damage by tidal waves, hurricanes, and tsunamis;
The implementation of this program requires people to contribute by providing their share of labor time on a continuing basis if they want to enjoy the advantages that the mangroves restoration offers.
Contingent question:
- (1)
- Would you be willing to contribute labor for the mangroves restoration program?
- (2)
- If yes, how much time are you willing to give in voluntary work in support of the program?
- (a)
- Hours per day ( )
- (b)
- Days per week ( )
- (c)
- Weeks per month ( )
References
- Everard, M.; Jha, R.R.; Russell, S. The benefits of fringing mangrove systems to Mumbai. Aquat. Conserv. Mar. Freshw. Ecosyst. 2014, 24, 256–274. [Google Scholar] [CrossRef]
- Giri, C.; Ochieng, E.; Tieszen, L.L.; Zhu, Z.; Singh, A.; Loveland, T.; Masek, J.; Duke, N. Status and distribution of mangrove forests of the world using earth observation satellite data. Glob. Ecol. Biogeogr. 2011, 20, 154–159. [Google Scholar] [CrossRef]
- Kairo, J.G.; Wanjiru, C.; Ochiewo, J. Net Pay: Economic analysis of a replanted mangrove plantation in Kenya. J. Sustain. For. 2009, 28, 395–414. [Google Scholar] [CrossRef]
- Vo, Q.T.; Kuenzer, C.; Vo, Q.M.; Moder, F.; Oppelt, N. Review of valuation methods for mangrove ecosystem services. Ecol. Indic. 2012, 23, 431–446. [Google Scholar] [CrossRef]
- Costanza, R.; D’Arge, R.; de Groot, R.; Farber, S.; Grasso, M.; Hannon, B.; Limburg, K.; Naeem, S.; O’Neill, R.V.; Paruelo, J.; et al. The value of the world’s ecosystem services and natural capital. Nature 1997, 387, 253–260. [Google Scholar] [CrossRef]
- Polidoro, B.A.; Carpenter, K.E.; Collins, L.; Duke, N.C.; Ellison, A.M.; Ellison, J.C.; Farnsworth, E.J.; Fernando, E.S.; Kathiresan, K.; Koedam, N.E.; et al. The loss of species: Mangrove extinction risk and geographic areas of global concern. PLoS ONE 2010, 5, e10095. [Google Scholar] [CrossRef] [PubMed]
- Spalding, L.; Kainuma, M.; Collins, L. World Atlas of Mangroves; Earthscan: London, UK; Washington, DC, USA, 2010; Volume 39, pp. 107–109. ISBN 978-1-84407-657-4. [Google Scholar]
- Joffre, O.M.; Bosma, R.H.; Bregt, A.K.; van Zwieten, P.A.M.; Bush, S.R.; Verreth, J.A.J. What drives the adoption of integrated shrimp mangrove aquaculture in Vietnam? Ocean Coast. Manag. 2015, 114, 53–63. [Google Scholar] [CrossRef]
- Giesen, W.; Wulffraat, S.; Zieren, M.; Scholten, L. Mangrove Guidebook for Southeast Asia; FAO: Rome, Italy; Wetlands International: Wageningen, The Netherlands, 2006; ISBN 974-7946-85-8. [Google Scholar]
- Brander, L.M.; Wagtendonk, A.J.; Hussain, S.S.; McVittie, A.; Verburg, P.H.; de Groot, R.S.; van der Ploeg, S. Ecosystem service values for mangroves in Southeast Asia: A meta-analysis and value transfer application. Ecosyst. Serv. 2012, 1, 62–69. [Google Scholar] [CrossRef]
- Salem, M.E.; Mercer, D.E. The economic value of mangroves: A meta-analysis. Sustainability 2012, 4, 359–383. [Google Scholar] [CrossRef]
- Swallow, B.M.; Woudyalew, M. Evaluating willingness to contribute to a local public good: Application of contingent valuation to tsetse control in Ethiopia. Ecol. Econ. 1994, 11, 153–161. [Google Scholar] [CrossRef]
- O’Garra, T. Bequest values for marine resources: How important for indigenous communities in less-developed economies? Environ. Resour. Econ. 2009, 44, 179–202. [Google Scholar] [CrossRef]
- Central Bureau of Statistics (BPS). Kutai Kartanegara in Figures. 2017. Available online: https://kukarkab.bps.go.id/webbeta/website/pdf_publikasi/Kabupaten-Kutai-Kartanegara-Dalam-Angka-2017.pdf (accessed on 17 May 2017).
- Sidik, A.S. The changes of mangrove ecosystem in Mahakam Delta, Indonesia. A complex social-environmental pattern of linkages in resources utilization. In Proceedings of the Rescopar Scientific Meeting, Samarinda, Indonesia, 25–26 February 2009. [Google Scholar]
- Persoon, G.A.; Simarmata, R. Undoing ‘marginality’: The islands of the Mahakam Delta, East Kalimantan (Indonesia). J. Mar. Isl. Cult. 2014, 3, 43–53. [Google Scholar] [CrossRef]
- Allen, G.P.; Chambers, J.L.C. Sedimentation in the Modern and Miocene Mahakam Delta; Indonesian Petroleum Association: Jakarta, Indonesia, 1998. [Google Scholar]
- Bourgeois, R.A.; Gouyon, A.; Jésus, F.; Levang, P.; Langeraar, W.; Rahmadani, F.; Sudiono, E.; Sulistiadi, B. A Socio Economic and Institutional Analysis of Mahakam Delta Stakeholders; Total-Fina-Elf; CIRAD: Montpellier, France, 2002. [Google Scholar]
- Creocean. Mahakam Delta 1999 Environmental Baseline Survey; Final Report to Total Indonesie; Creocean: Montpellier, France, 2000; 132p, unpublished. [Google Scholar]
- Venkatachalam, L. The contingent valuation method: A review. Environ. Impact Assess. Rev. 2004, 24, 89–124. [Google Scholar] [CrossRef]
- Huang, C.H.; Wang, C.H. Estimating the Total Economic Value of Cultivated Flower Land in Taiwan. Sustainability 2015, 7, 4764–4782. [Google Scholar] [CrossRef]
- Lankia, T.; Neuvonen, M.; Pouta, E.; Sievänen, T. Willingness to contribute to the management of recreational quality on private lands in Finland. J. For. Econ. 2014, 20, 141–160. [Google Scholar] [CrossRef]
- Asrat, P.; Belay, K.; Hamito, D. Determinants of farmers’ willingness to pay for soil conservation practices in the southeastern highlands of Ethiopia. Land Degrad. Dev. 2004, 15, 423–438. [Google Scholar] [CrossRef]
- Tilahun, M.; Vranken, L.; Muys, B.; Deckers, J.; Gebregziabher, K.; Gebrehiwot, K.; Bauer, H.; Mathijs, E. Rural Households’ Demand for Frankincense Forest Conservation in Tigray: A Continent Valuation Analysis. Land Degrad. Dev. 2013, 26, 642–653. [Google Scholar] [CrossRef]
- Hung, L.T.; Loomis, J.B.; Thinh, V.T. Comparing money and labour payment in contingent valuation: The case of forest fire prevention in Vietnamese context. J. Int. Dev. 2007, 19, 173–185. [Google Scholar] [CrossRef]
- Arbiol, J.; Borja, M.; Yabe, M.; Nomura, H.; Gloriani, N.; Yoshida, S.I. Valuing human leptospirosis prevention using the opportunity cost of labor. Int. J. Environ. Res. Public Health 2013, 10, 1845–1860. [Google Scholar] [CrossRef] [PubMed]
- Eom, Y.S.; Larson, D.M. Valuing housework time from willingness to spend time and money for environmental quality improvements. Rev. Econ. Househ. 2006, 4, 205–227. [Google Scholar] [CrossRef]
- Ready, R.C.; Buzby, J.C.; Hu, D. Differences between continuous and discrete contingent value estimates. Land Econom. 1996, 72, 397–411. [Google Scholar] [CrossRef]
- Strazzera, E.; Genius, M.; Scarpa, R.; Hutchinson, G. The effect of protest votes on the estimates of WTP for use values of recreational sites. Environ. Resour. Econ. 2003, 25, 461–476. [Google Scholar] [CrossRef]
- Maddala, G.S. Limited-Dependent and Qualitative Variables in Economics; Cambridge University Press: New York, NY, USA, 1983; pp. 257–291. [Google Scholar]
- Tobin, J. Estimation of relationships for limited dependent variables. Econometrica 1958, 26, 24–36. [Google Scholar] [CrossRef]
- Susilo, H.; Takahashi, Y.; Yabe, M. Evidence for mangrove restoration in the Mahakam Delta, Indonesia, Based on Households’ Willingness to Pay. J. Agric. Sci. 2017, 9, 30–41. [Google Scholar] [CrossRef]
- Andersen, J.K.; Boldrin, A.; Christensen, T.H.; Scheutz, C. Mass balances and life cycle inventory of home composting of organic waste. Waste Manag. 2011, 31, 1934–1942. [Google Scholar] [CrossRef] [PubMed]
- Tuan, T.H.; My, N.H.D.; Anh, L.T.Q.; Toan, N.V. Using contingent valuation method to estimate the WTP for mangrove restoration under the context of climate change: A case study of Thi Nai lagoon, Quy Nhon city, Vietnam. Ocean Coast. Manag. 2014, 95, 198–212. [Google Scholar] [CrossRef]
- Champ, P.A.; Bishop, R.C. Is willingness to pay for a public good sensitive to the elicitation format? Land Econ. 2006, 82, 162–173. [Google Scholar] [CrossRef]
- Loomis, J.; Brown, T.; Lucero, B.; Peterson, G. Evaluating the Validity of the Dichotomous Choice Question Format in Contingent Valuation. Environ. Resour. Econ. 1997, 10, 109–123. [Google Scholar] [CrossRef]
© 2017 by the authors. Licensee MDPI, Basel, Switzerland. This article is an open access article distributed under the terms and conditions of the Creative Commons Attribution (CC BY) license (http://creativecommons.org/licenses/by/4.0/).