Global Warming Leading to Phenological Responses in the Process of Urbanization, South Korea


Abstract
:1. Introduction
2. Data
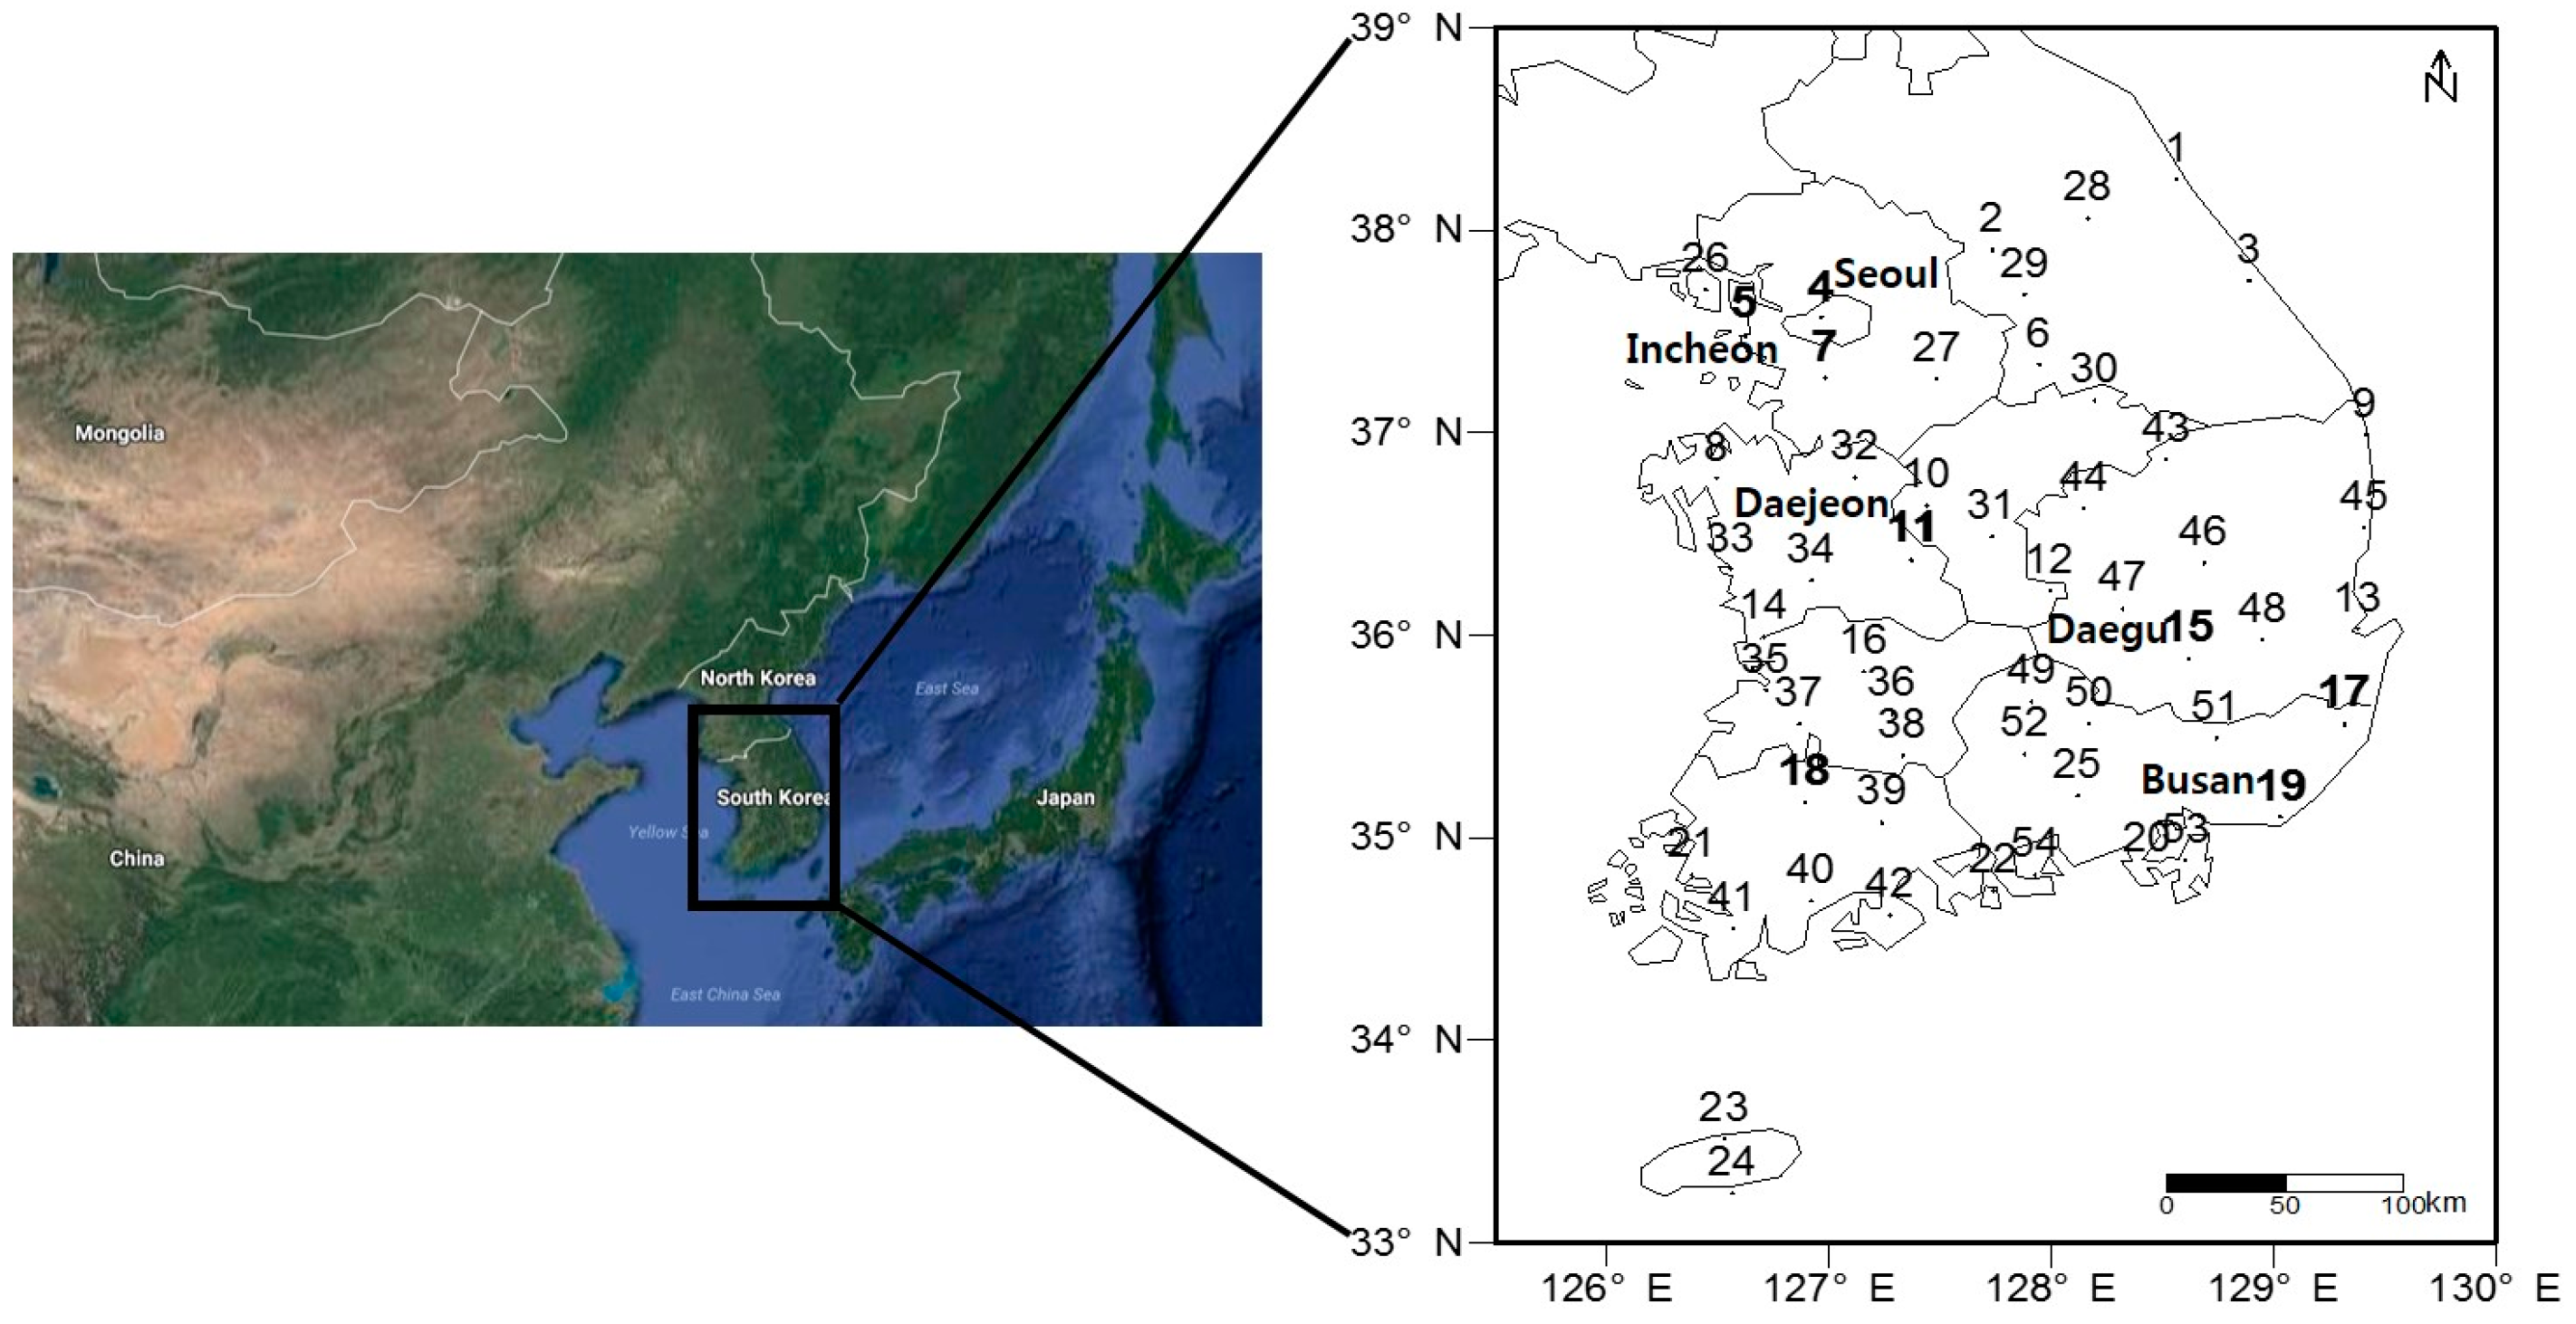
2.1. Phenological Events and Stations
2.2. Climate Factors
3. Methods
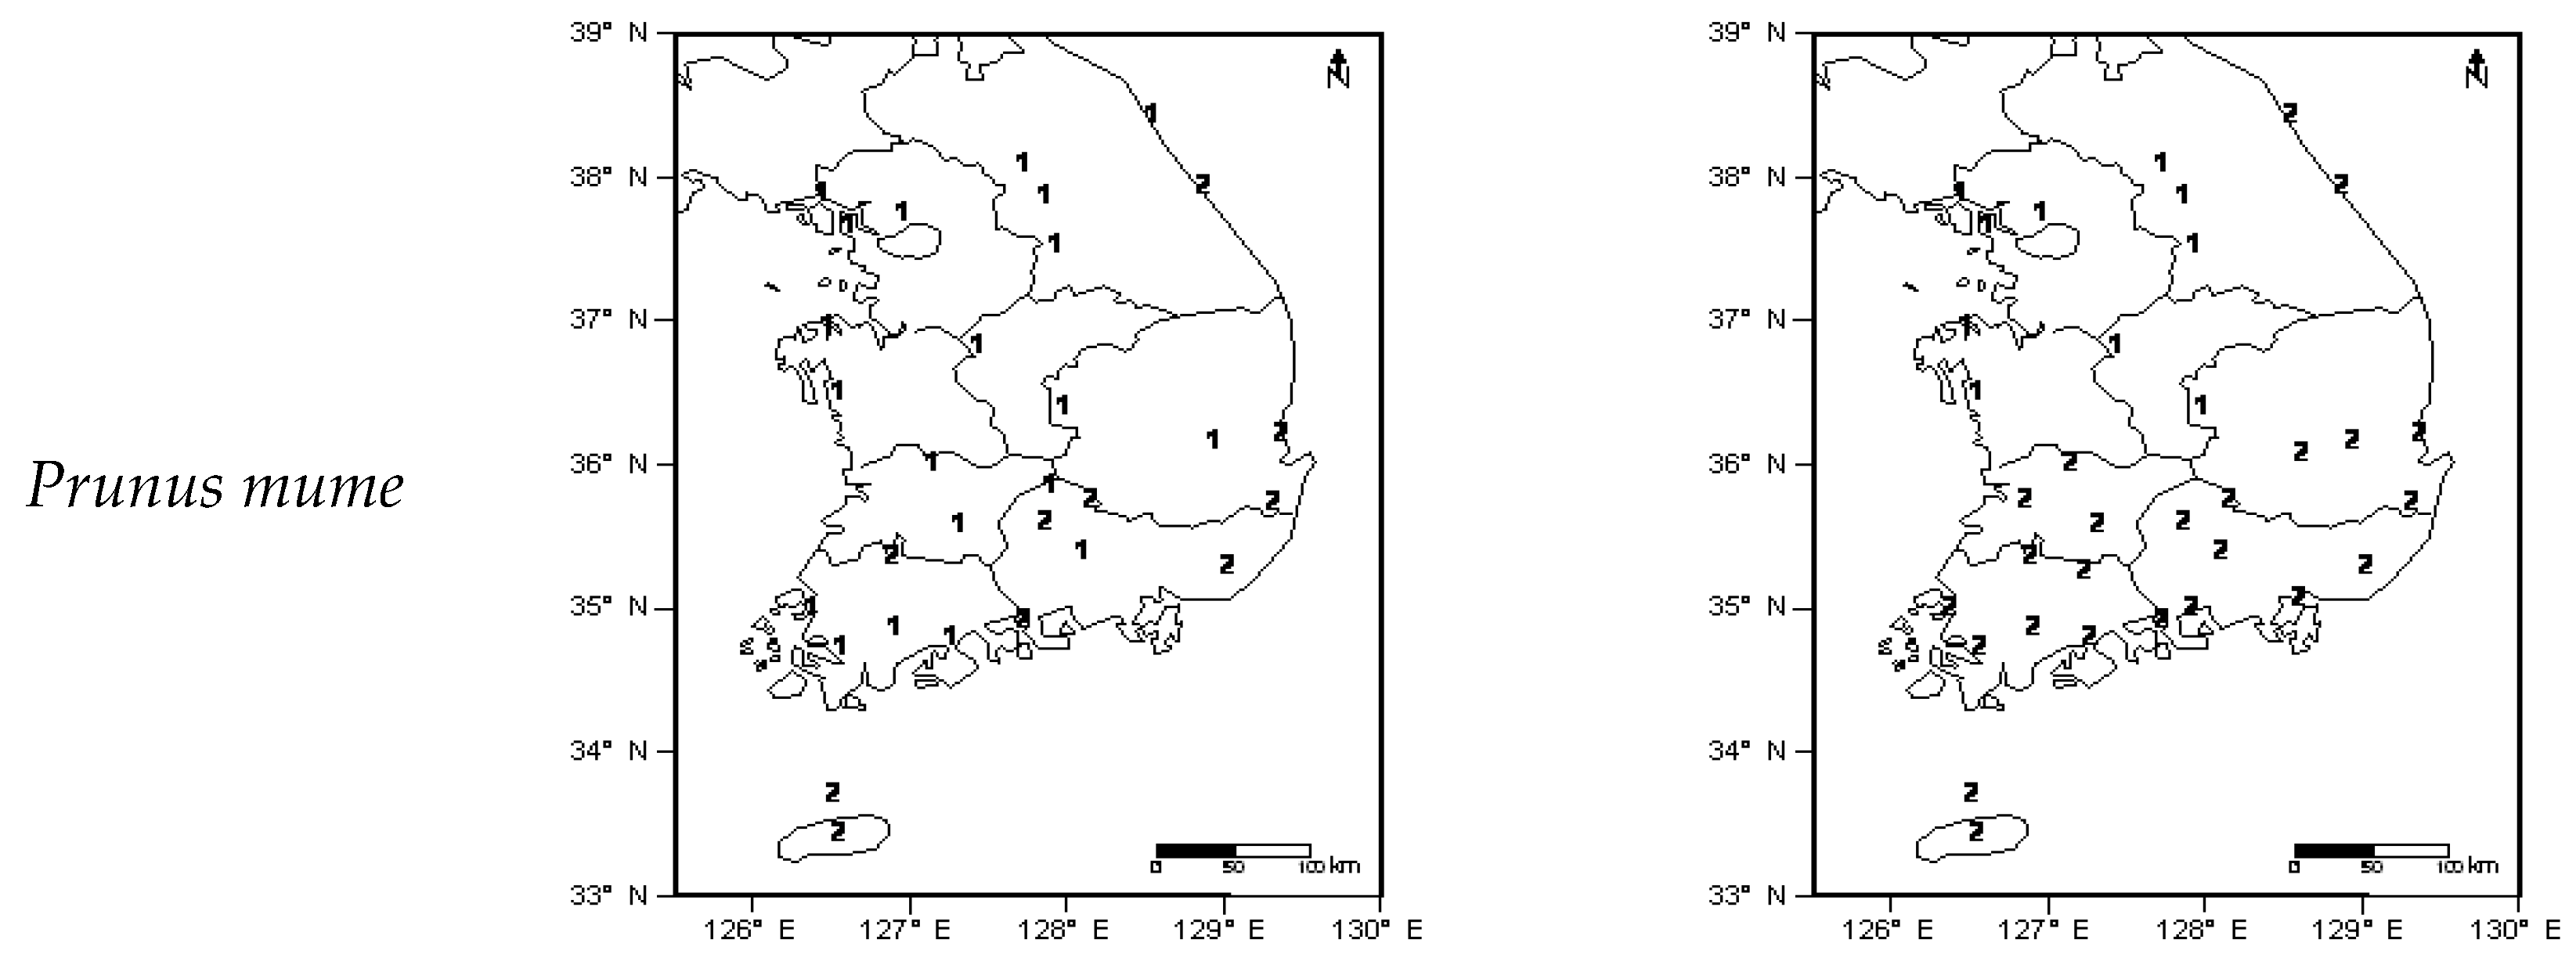
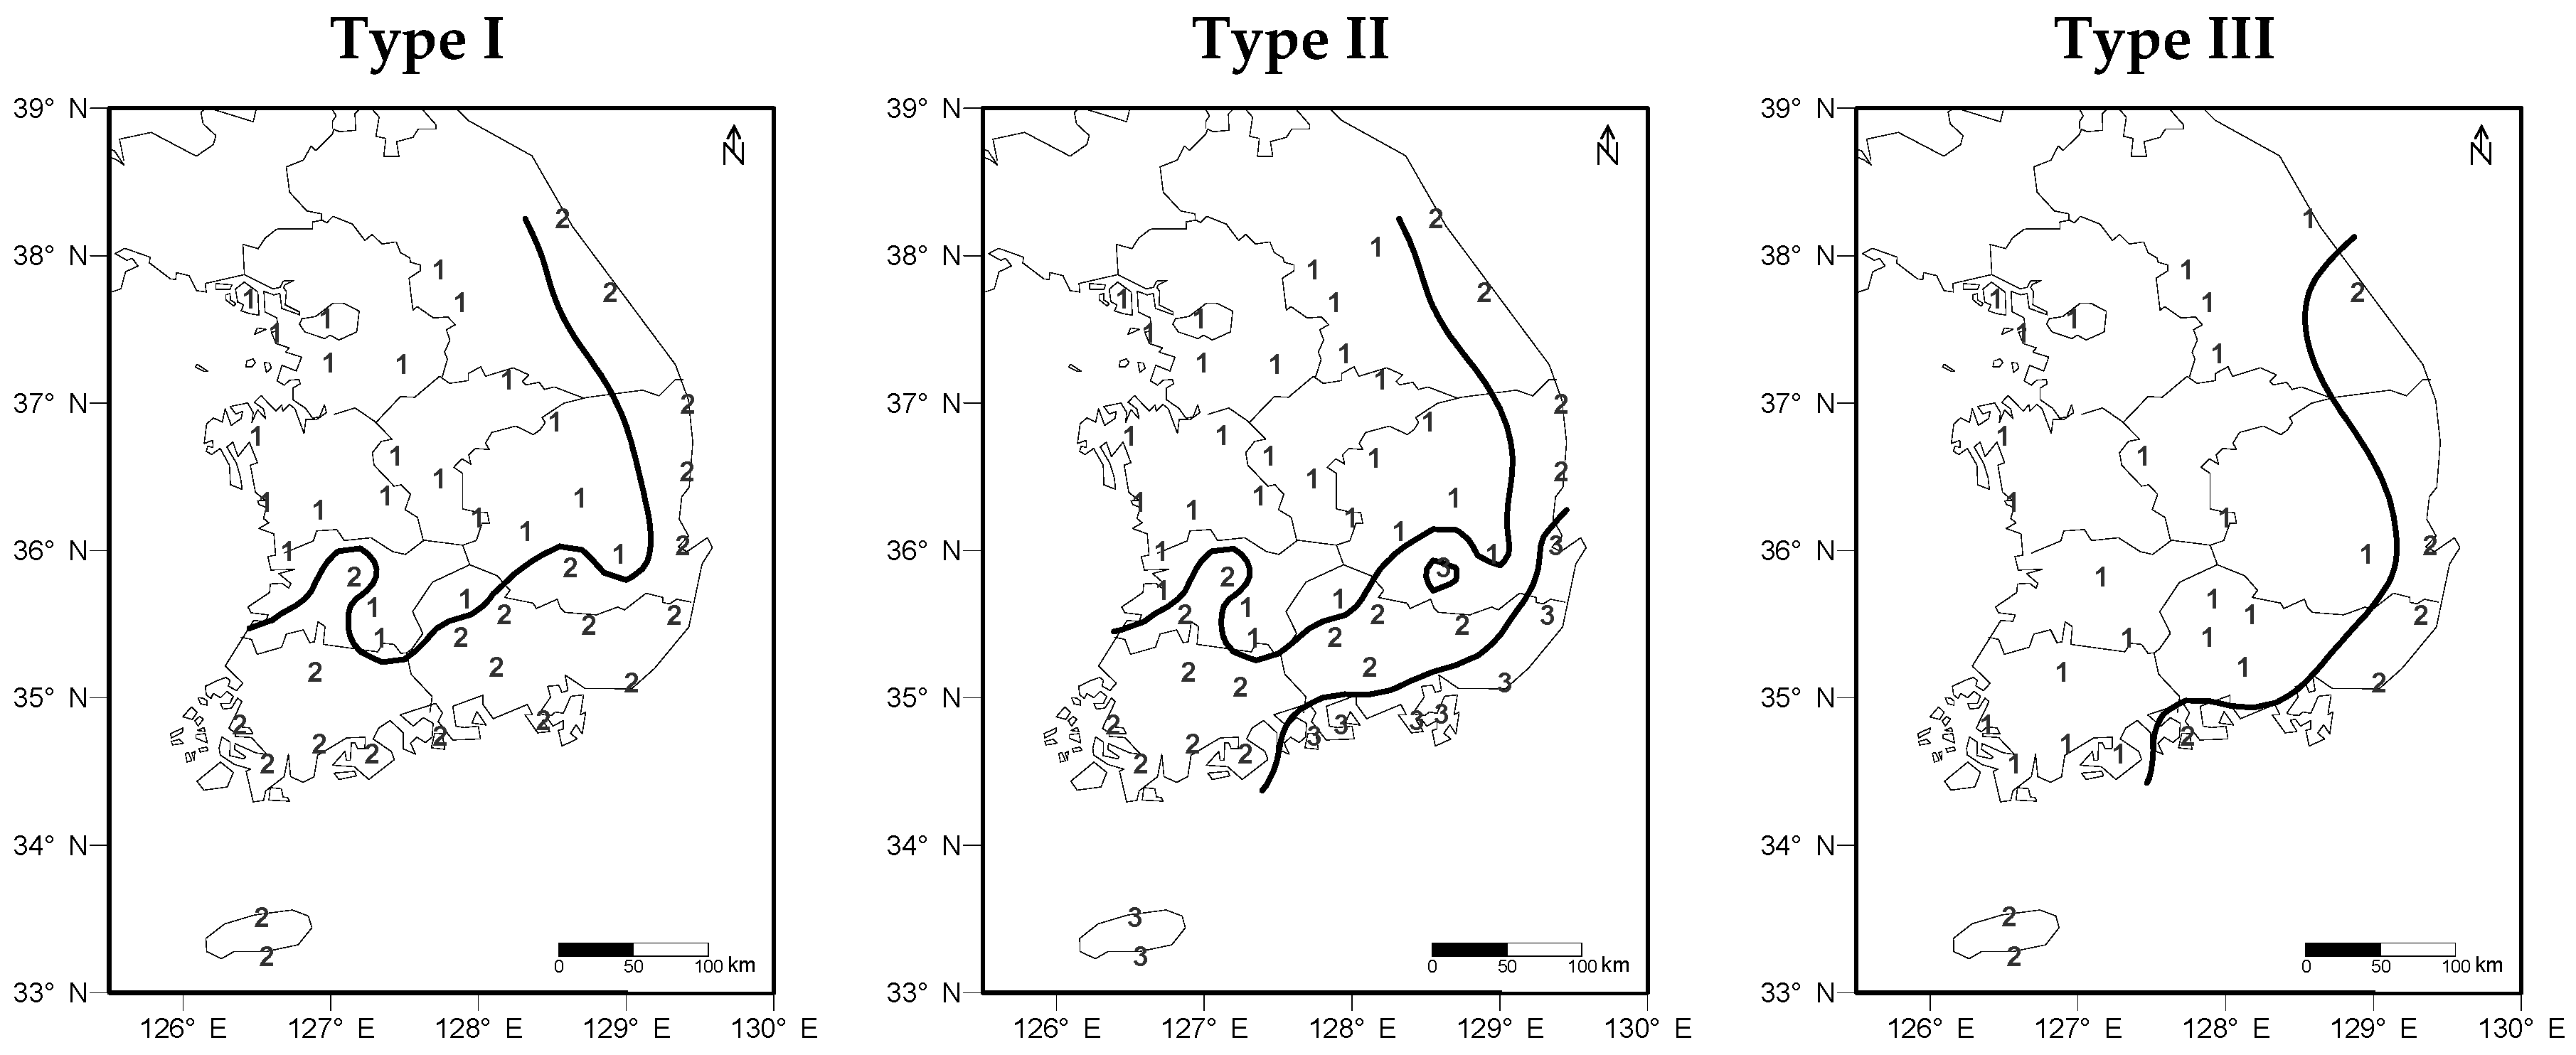
3.1. Cluster Analysis
3.2. Multiple Linear Regression Model
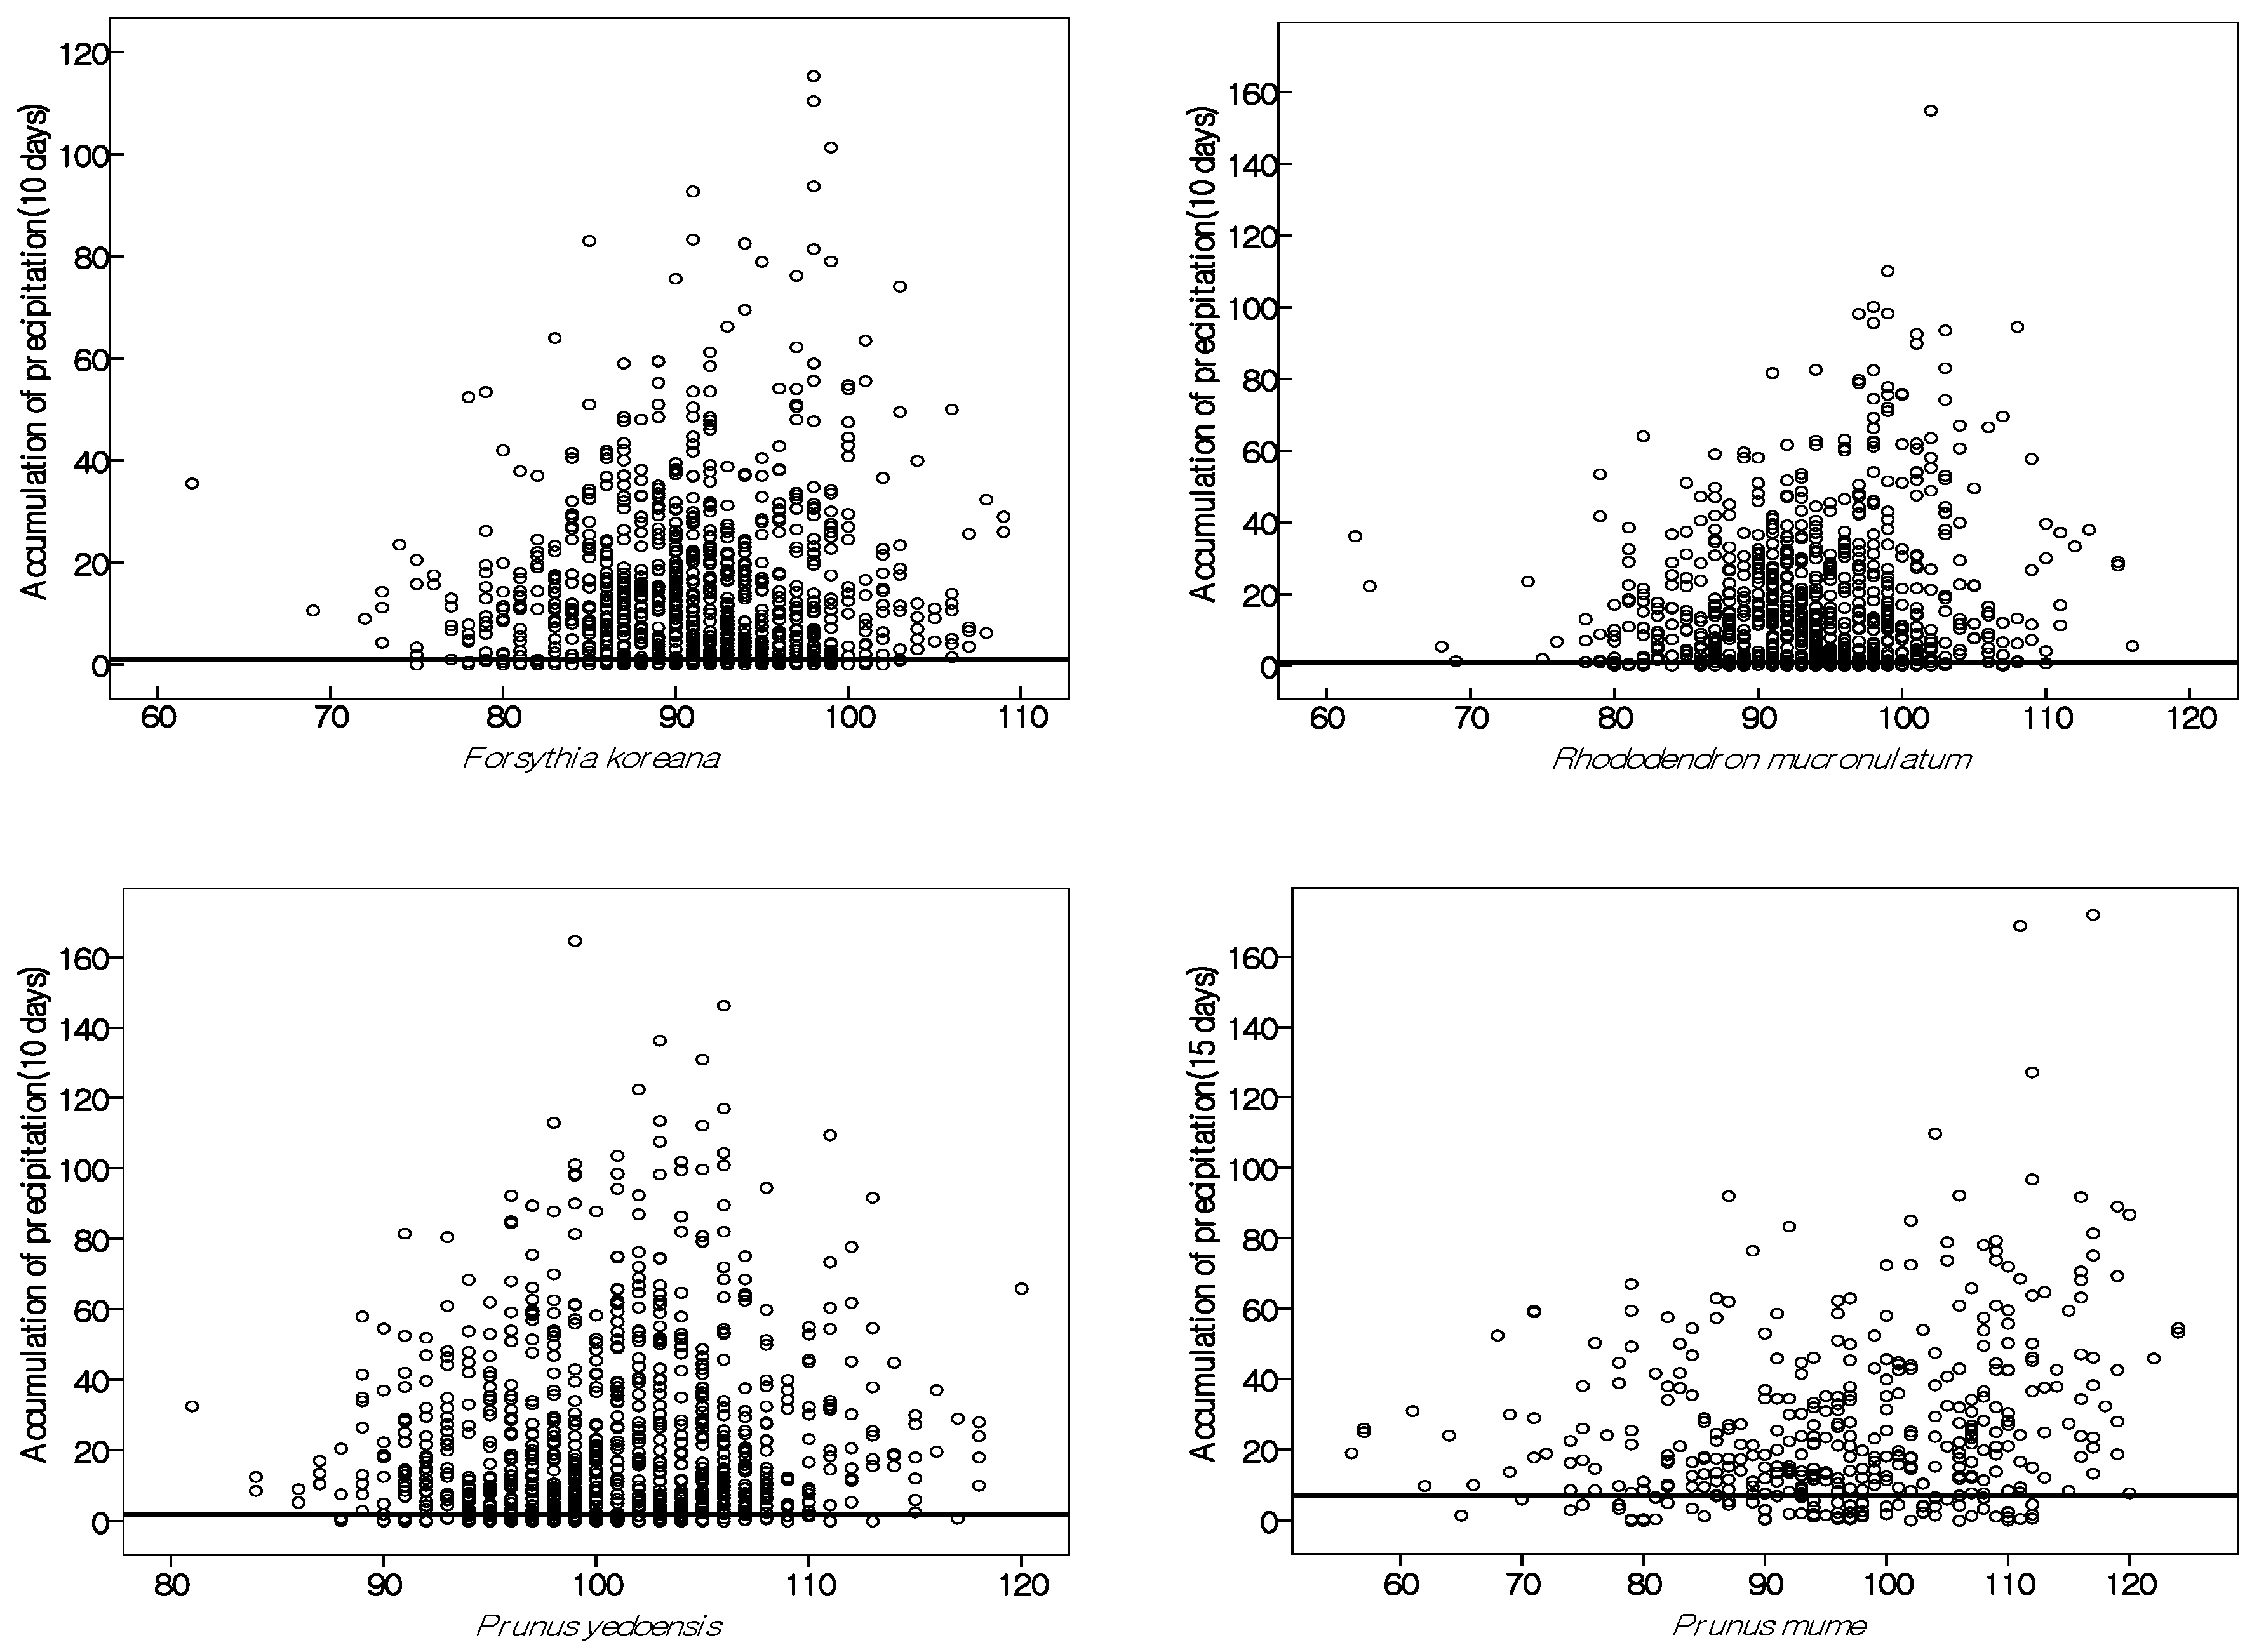
3.3. Precipitation Effect
3.4. Urbanization
4. Results
4.1. Cluster Analysis According to Phenological Events and Climates
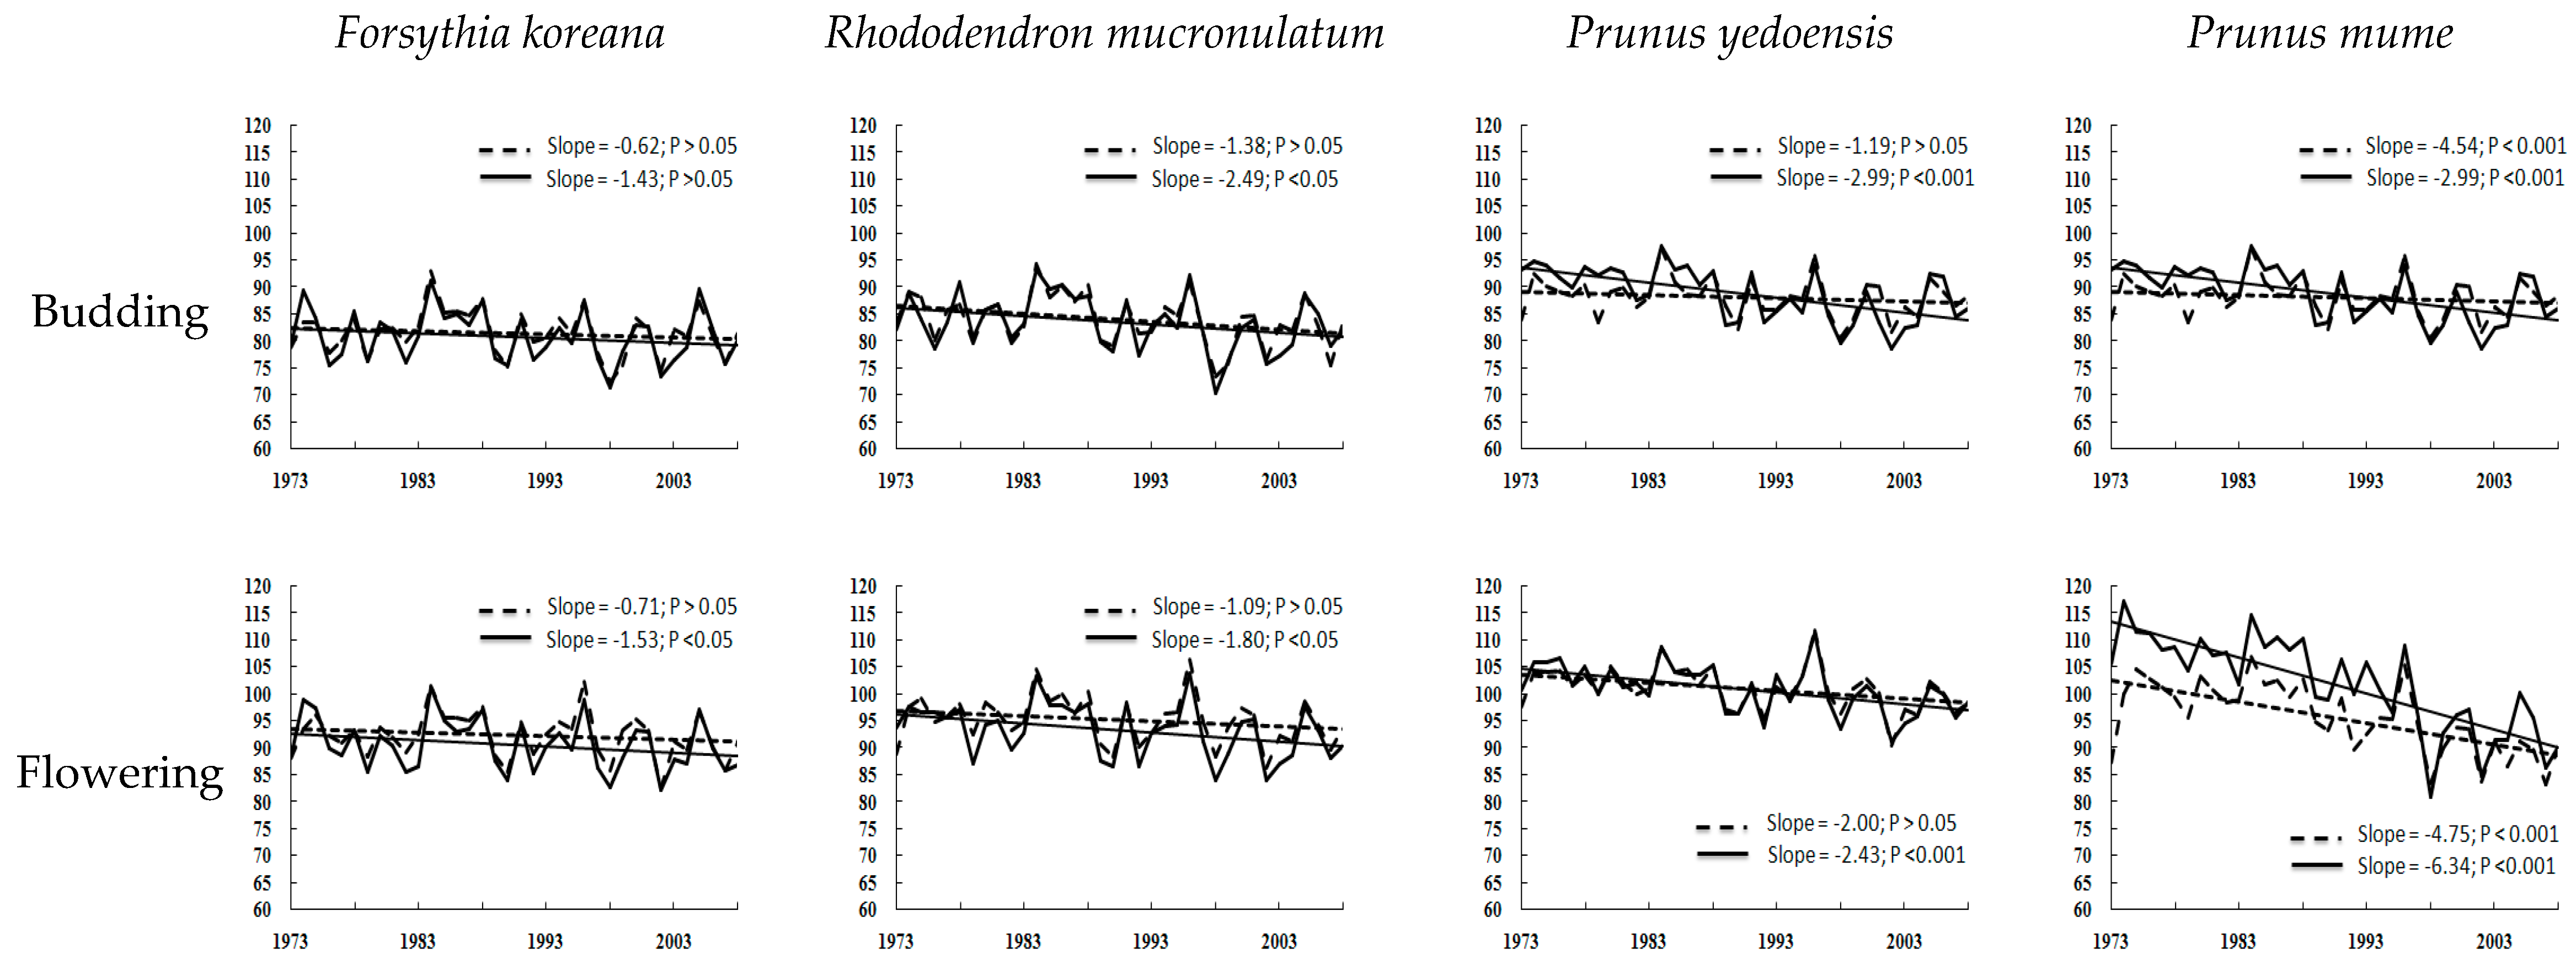
4.2. Phenological Responses to Temperature and Precipitation
4.3. Details of Precipitation Effect
4.4. Global Warming and Urbanization
5. Discussion
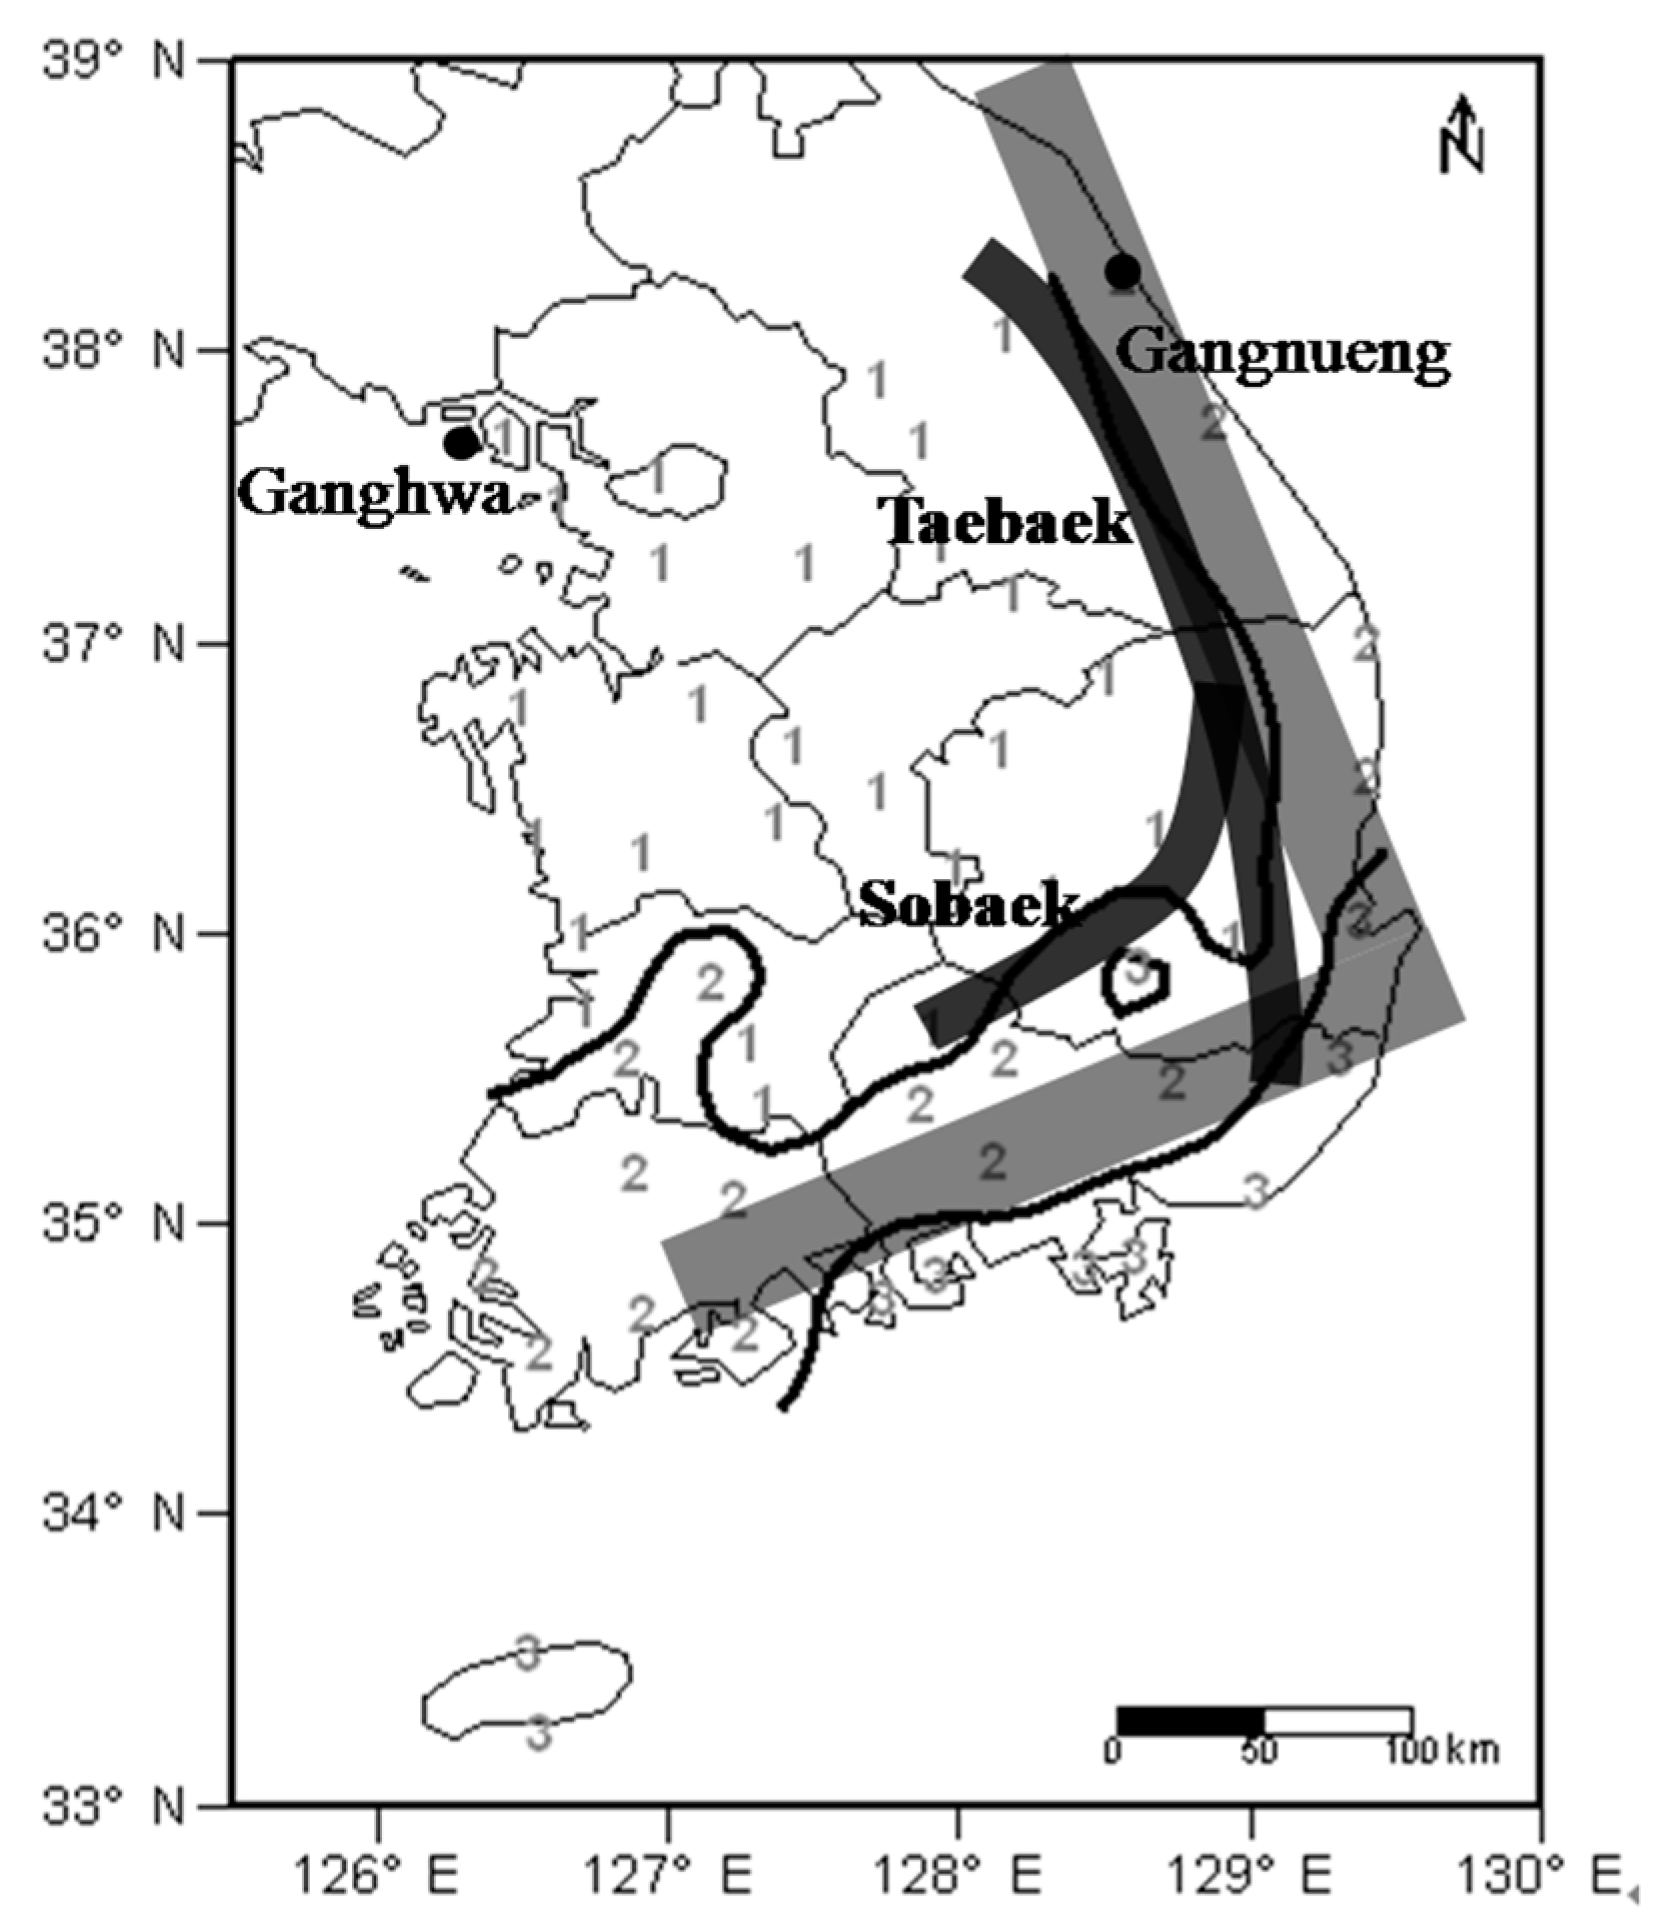
 ). Climates are influenced by latitude and also by topographical factors ([35]. Ganghwa (37.71° N 126.45° E) and Gangnueng (37.75° N 128.89° E) are placed at similar latitudes and the rural areas around the coastline but these are divided as different clusters because of the unique topography (high east, low west-type) of South Korea. Apricot budding, which is of type III, can be largely affected in January and February by the Siberian high atmospheric pressure.
6. Conclusions
Acknowledgments
Conflicts of Interest
References
- Intergovernmental Panel on Climate Change (IPCC). Climate Change 2007: The Physical Science Basis; Contribution of Working Group I to the Forth Assessment Report of the Intergovernmental Panel on Climate Change; Cambridge University Press: Cambridge, UK, 2007; p. 966. [Google Scholar]
- Williams, S.E.; Bolitho, E.E.; Fox, S. Climate change in Australian tropical rainforests: An impending environmental catastrophe. Biol. Sci. 2003, 270, 1887–1892. [Google Scholar] [CrossRef] [PubMed]
- Parmesan, C.; Yohe, G. A globally coherent fingerprint of climate change impacts across natural systems. Nature 2003, 421, 37–42. [Google Scholar] [CrossRef] [PubMed]
- Root, T.L.; Price, J.T.; Hall, K.R.; Schneider, S.H.; Rosenzweig, C.; Pounds, J.A. Fingerprints of global warming on wild animals and plants. Nature 2003, 421, 57–60. [Google Scholar] [CrossRef] [PubMed]
- Walther, G.R.; Post, E.; Convey, P.; Menzel, A.; Parmesan, C.; Beebee, T.J.C.; Fromentin, J.M.; Hoegh-Guldberg, O.; Bairlein, F. Ecological responses to recent climate change. Nature 2002, 416, 389–395. [Google Scholar] [CrossRef] [PubMed]
- Abu-Asab, M.S.; Peterson, P.M.; Shetler, S.G.; Orli, S.S. Earlier plant flowering in spring as a response to global warming in the Washington, DC, area. Biodivers. Conserv. 2001, 10, 597–612. [Google Scholar] [CrossRef]
- Miller-Rushing, A.J.; Primack, R.B. Global warming and flowering times in Thoreau’s Concord: A community perspective. Ecology 2008, 89, 332–341. [Google Scholar] [CrossRef] [PubMed]
- Penuelas, P.; Filella, I.; Comas, P. Change plant and animal life cycles from 1952 to 2000 in the Mediteranean region. Glob. Chang. Biol. 2002, 8, 531–544. [Google Scholar] [CrossRef]
- Gordo, O.; Sanz, J.J. Climate change and bird phenology: A long-term study in the Iberian Peninsula. Glob. Chang. Biol. 2006, 12, 1993–2004. [Google Scholar] [CrossRef]
- Miller-Rushing, A.J.; Lloyd-Evans, T.L.; Primack, P.B.; Satzinger, P. Bird migration times, climate change and changing population sizes. Glob. Chang. Biol. 2008, 14, 1959–1972. [Google Scholar] [CrossRef]
- Sparks, T.H.; Yates, T.J. The effect of spring temperature on the appearance dates of British butterflies 1883–1993. Ecography 1997, 20, 368–374. [Google Scholar] [CrossRef]
- Gibbs, J.P.; Breisch, A.R. Climate Warming and Calling Phenology of Frogs near Ithaca, New York, 1900–1999. Conserv. Biol. 2001, 15, 1175–1178. [Google Scholar] [CrossRef]
- Ahas, R.; Aasa, A. The effects of climate change on the phenology of selected Estonian plant, bird and fish populations. Int. J. Biometeorol. 2006, 51, 17–26. [Google Scholar] [CrossRef] [PubMed]
- Post, E.S.; Pedersen, C.; Wilmers, C.C.; Forchhammer, M.C. Phenological sequences reveal aggregate life history response to climatic warming. Ecology 2008, 89, 363–370. [Google Scholar] [CrossRef] [PubMed]
- Primack, R.B.; Ibanez, I.; Higuchi, H.; Lee, S.D.; Miller-Rushing, A.J.; Wilson, A.M.; Silander, J.A., Jr. Spatial and interspecific variability in phenological responses to warming temperatures. Biol. Conserv. 2009, 142, 2569–2577. [Google Scholar] [CrossRef]
- Araujo, M.B.; Thuiller, W.; Pearson, R.G. Climate warming and the decline of amphibians and reptiles in Europe. Biogeography 2006, 33, 1712–1728. [Google Scholar] [CrossRef]
- Ho, C.H.; Lee, E.J.; Lee, I.; Jeong, S.J. Earlier spring in Seoul, Korea. Int. J. Climatol. 2006, 26, 2117–2127. [Google Scholar] [CrossRef]
- Min, B.M. Comparison of phenological characteristics for several woody plants in urban climates. J. Plant Biol. 2000, 43, 10–17. [Google Scholar] [CrossRef]
- Ziska, L.H.; Gebhard, D.E.; Frenz, D.A.; Faulkner, S.; Singer, B.D.; Straka, J. Cities as harbingers of climate change: Common ragweed, urbanization and public health. J. Allergy Clin. Immune 2003, 111, 290–295. [Google Scholar] [CrossRef]
- Arnfield, A.J. Two decade of urban climate research: A review of turbulence, exchanges of energy and water and the urban heat island. Int. J. Climatol. 2003, 23, 1–26. [Google Scholar] [CrossRef]
- Cetin, M.; Adiguzel, F.; Kaya, O.; Sahap, A. Mapping of bioclimatic comfort for potential planning using GIS in Aydin. Environ. Dev. Sustain. 2016, 1–15. Available online: https://link.springer.com/article/10.1007/s10668-016-9885-5 (accessed on 27 November 2017).
- Lu, P.; Yu, Q.; Lui, J.; Lee, X. Advance of tree-flowering dates in response to urban climate change. Agric. For. Meteorol. 2006, 138, 120–131. [Google Scholar] [CrossRef]
- Neil, K.; Wu, J. Effects of urbanization on plant flowering phenology: A Review. Urban Ecosyst. 2006, 9, 243–257. [Google Scholar] [CrossRef]
- Cetin, M. Sustainability of urban coastal area management: A case study on Cide. J. Sustain. For. 2016, 35, 527–541. [Google Scholar] [CrossRef]
- Cetin, M. Determining the bioclimatic comfort in Kastamonu City. Environ. Monit. Assess. 2015, 187, 640. [Google Scholar] [CrossRef] [PubMed]
- Franks, S.J.; Sim, S.; Weis, A.E. Rapid eVolution of flowering time by an annual plant in response to a climate fluctuation. Proc. Natl. Acad. Sci. USA 2007, 104, 1278–1282. [Google Scholar] [CrossRef] [PubMed]
- Inouye, D.W. Effects of climate change on phenology, frost damage and floral abundance of Montana wildflowers. Ecology 2008, 89, 353–362. [Google Scholar] [CrossRef] [PubMed]
- Korea Meteorological Administration (KMA). Available online: http://www.kma.go.kr/sfc/sfc_03_02.jsp (accessed on 16 November 2017).
- Korea Meteorological Administration (KMA). Guideline of Phenological Events Observation; NIMR: Seoul, Korea, 2003; p. 95. [Google Scholar]
- Jeong, S.J.; Ho, C.H.; Jeong, J.H. Increase in vegetation greenness and decrease in springtime warming over East Asia. Geophys. Res. Lett. 2009, 36, L02710. [Google Scholar] [CrossRef]
- Lee, S.D.; Miller-Rushing, A. Degradation, urbanization and restoration: A review of the challenges and future of conservation on the Korean Peninsula. Biol. Conserv. 2014, 176, 262–276. [Google Scholar] [CrossRef]
- Aldenderfer, M.S.; Blashfield, R.K. Cluster Analysis; Sage Publication: Beverly Hills, CA, USA, 1984. [Google Scholar]
- Williams, F. Reasoning with Statistics; Holt, Rinehart and Winston: New York, NY, USA, 1979. [Google Scholar]
- Park, S.Y. Trends of Phonological Responses to Climate Change and Urbanization in South Korea. Master’s Thesis, Ewha Womans University, Seoul, Korea, January 2010. [Google Scholar]
- Lee, K.M.; Kown, W.T.; Lee, S.H. A study on plant phenological trends in South Korea. Korean J. Reg. Geogr. 2009, 15, 337–350. [Google Scholar]
- Spano, D.; Cesaraccio, C.; Duce, P.; Snyder, R.L. Phenological stages of natural species and their use as climate indicators. Int. J. Biometeorol. 1999, 42, 124–133. [Google Scholar] [CrossRef]
- Moller, A.P.; Merila, J. Analysis and interpretation of long-term studies investigating responses to climate change. Adv. Ecol. Res. 2004, 35, 111–130. [Google Scholar]
- Menzel, A. Trends in phenological phases in Europe between 1951 and 1996. Int. J. Biometeorol. 2000, 44, 76–81. [Google Scholar] [CrossRef] [PubMed]
- Fiscus, E.L.; Booker, F.L.; Burkey, K.O. Crop responses to ozone: Uptake, modes of action, carbon assimilation and partitioning. Plant Cell Environ. 2005, 28, 997–1011. [Google Scholar] [CrossRef]
- Menzel, A. Phenology: Its importance to the global change community. Clim. Chang. 2002, 54, 379–385. [Google Scholar] [CrossRef]

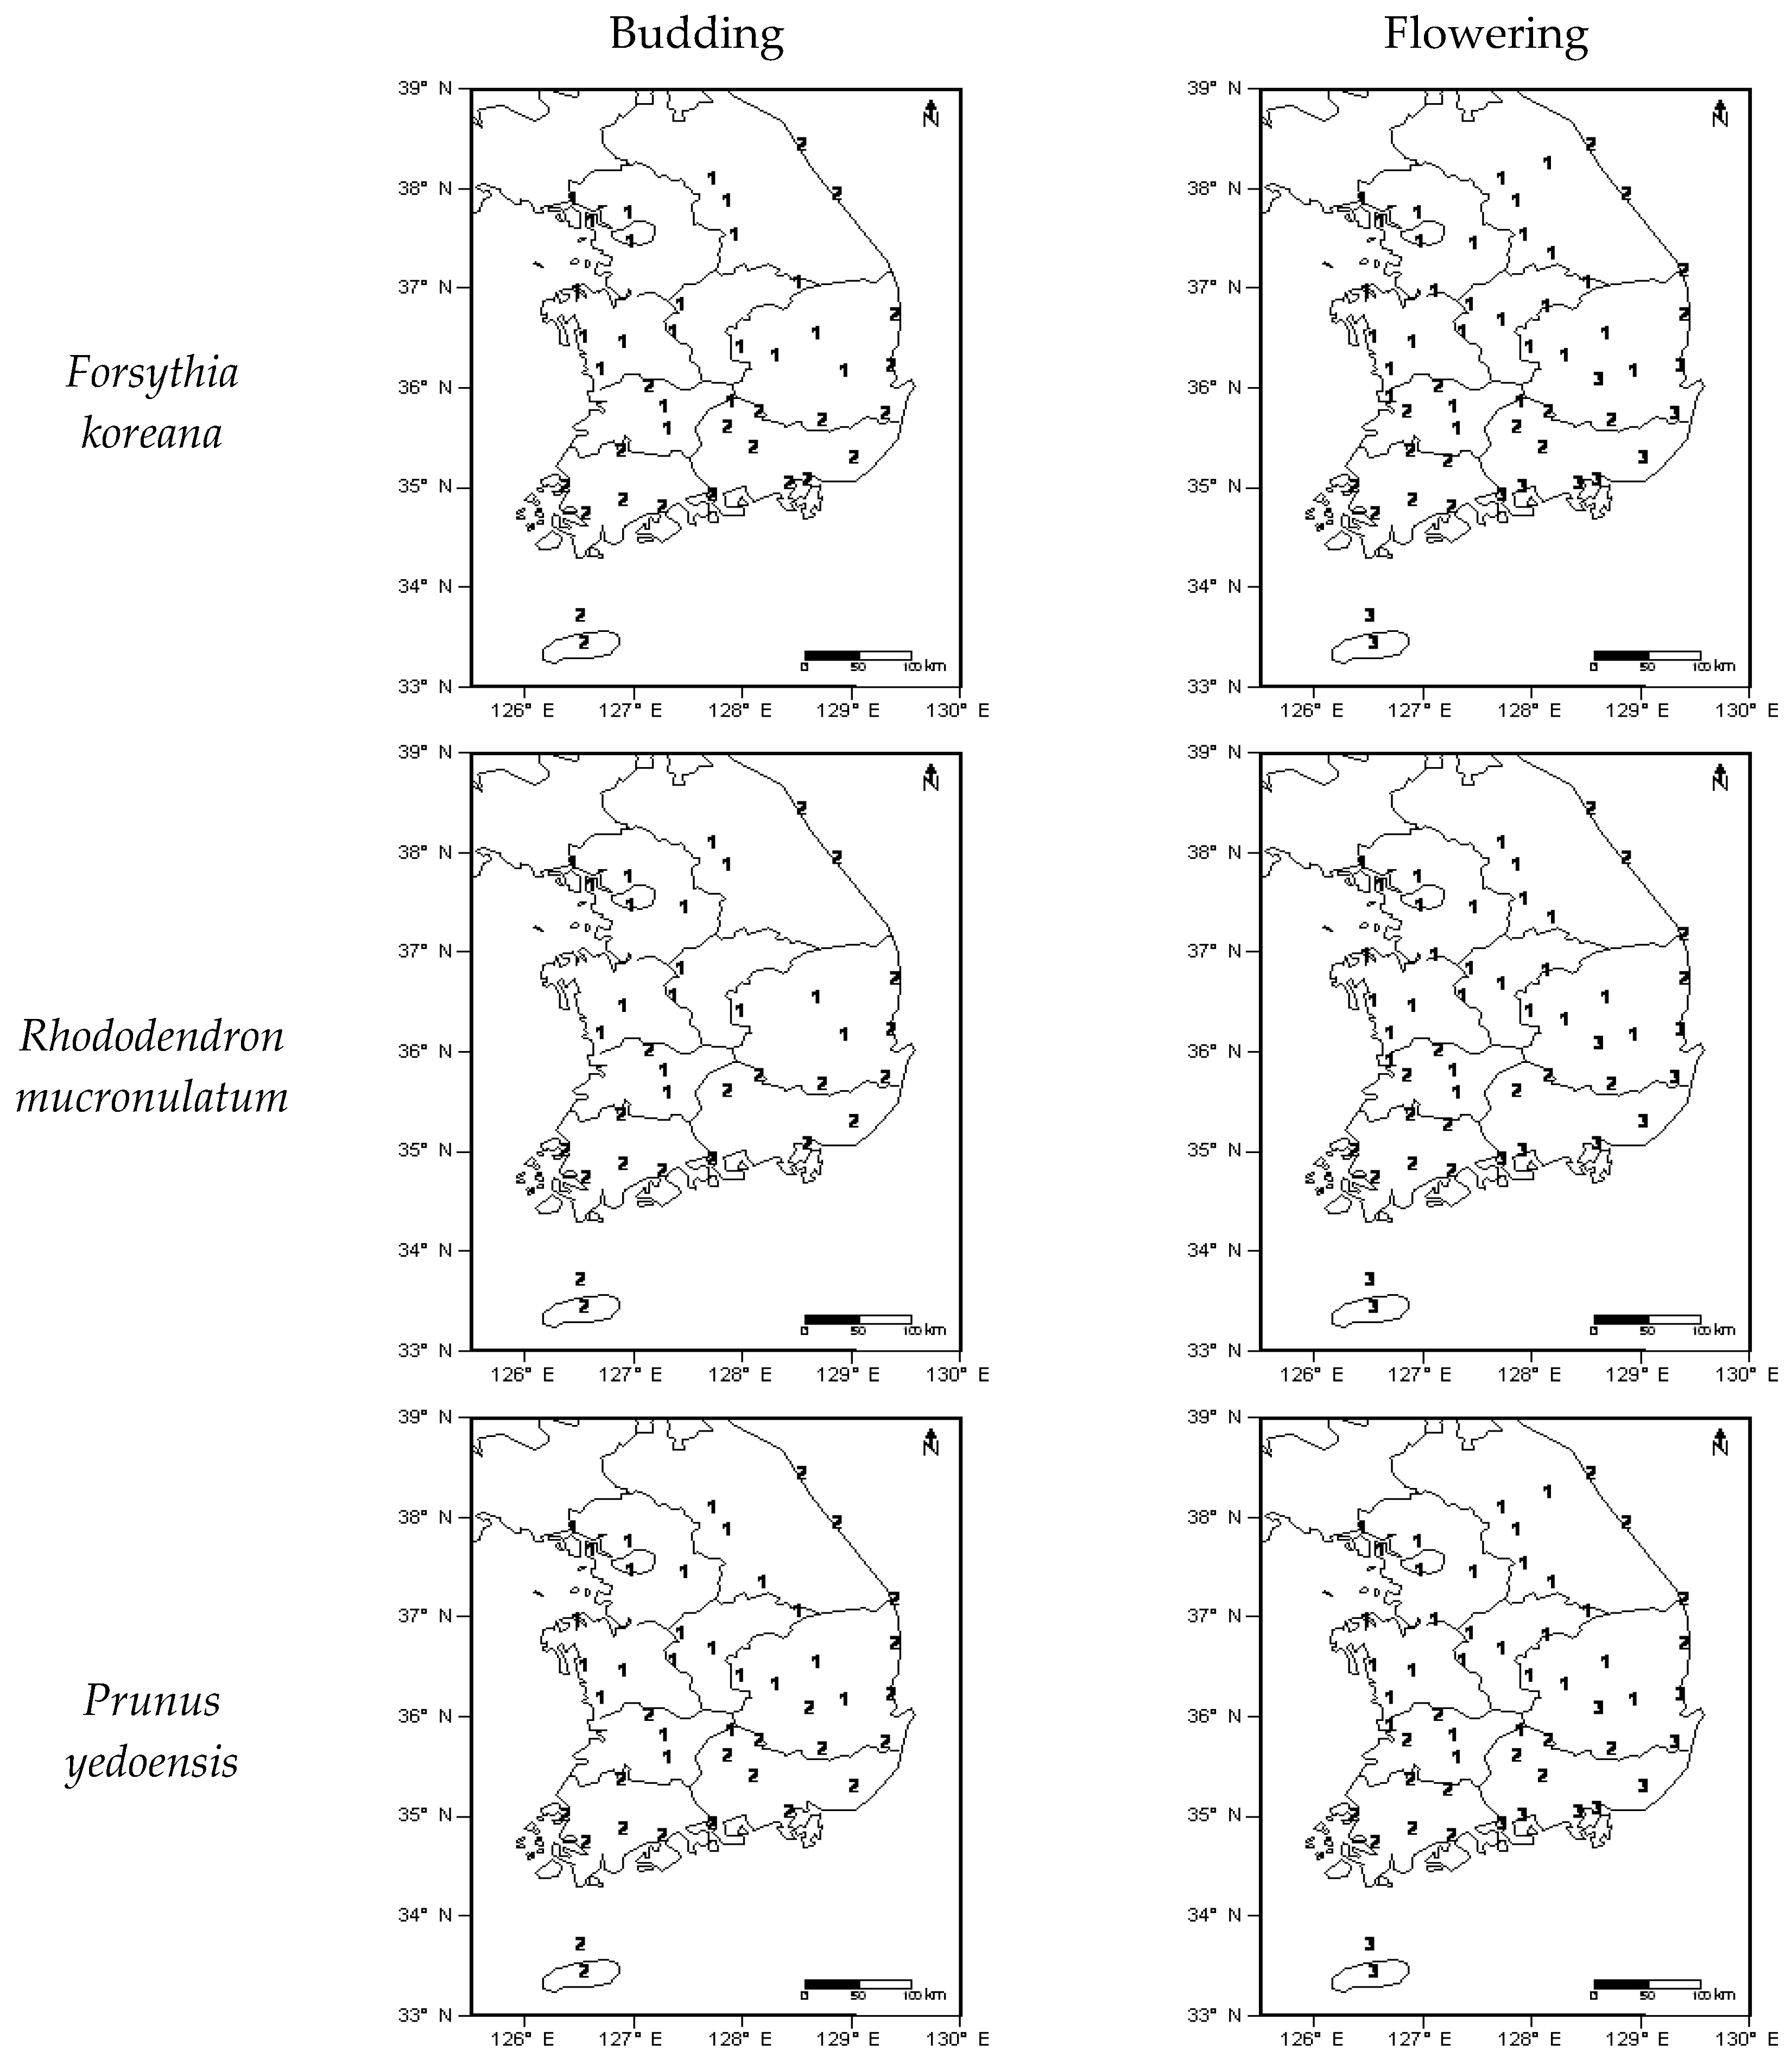


 ) which are Taebaek and Sobaek. Divided region resembled as reversed L-shape ( ).
) which are Taebaek and Sobaek. Divided region resembled as reversed L-shape ( ).
) which are Taebaek and Sobaek. Divided region resembled as reversed L-shape ( ).

| No. | Station | Latitude [°N] | Longitude [°E] | Altitude [m] | Population [Thousands] | Forsythia koreana | Rhododendron mucronulatum | Prunus yedoensis | Prunus mume |
|---|---|---|---|---|---|---|---|---|---|
| 1 | Sokcho | 38.25 | 128.56 | 23 | 86 | B/F | B/F | B/F | B/F |
| 2 | Chuncheon | 37.90 | 127.74 | 77 | 261 | B/F | B/F | B/F | B/F |
| 3 | Gangneung | 37.75 | 128.89 | 26 | 222 | B/F | B/F | B/F | B/F |
| 4 | Seoul | 37.57 | 126.97 | 86 | 10,421 | B/F | B/F | B/F | B/F |
| 5 | Incheon | 37.48 | 126.62 | 69 | 2710 | B/F | B/F | B/F | B/F |
| 6 | Wonju | 37.34 | 127.95 | 151 | 301 | B/F | F | F | B/F |
| 7 | Suwon | 37.27 | 126.99 | 35 | 1000 | B/F | B/F | B/F | |
| 8 | Seosan | 36.77 | 126.50 | 25 | 155 | B/F | F | B/F | B/F |
| 9 | Uljin | 36.99 | 129.41 | 49 | 54 | F | F | B/F | |
| 10 | Cheongju | 36.64 | 127.44 | 56 | 638 | B/F | B/F | B/F | B/F |
| 11 | Daejeon | 36.37 | 127.37 | 63 | 1487 | B/F | B/F | B/F | |
| 12 | Chupungnyeong | 36.22 | 127.99 | 241 | 3 | B/F | B/F | B/F | B/F |
| 13 | Pohang | 36.03 | 129.38 | 1 | 508 | B/F | B/F | B/F | B/F |
| 14 | Gunsan | 36.00 | 126.76 | 26 | 263 | B/F | B/F | B/F | |
| 15 | Daegu | 35.89 | 128.62 | 57 | 2513 | F | F | B/F | F |
| 16 | Jeonju | 35.82 | 127.15 | 61 | 628 | B/F | B/F | B/F | B/F |
| 17 | Ulsan | 35.56 | 129.32 | 35 | 1113 | B/F | B/F | B/F | B/F |
| 18 | Gwangju | 35.17 | 126.89 | 75 | 1423 | B/F | B/F | B/F | B/F |
| 19 | Busan | 35.10 | 129.03 | 69 | 3615 | B/F | B/F | B/F | B/F |
| 20 | Tongyeong | 34.85 | 128.44 | 31 | 134 | B/F | B/F | ||
| 21 | Mokpo | 34.82 | 126.38 | 37 | 245 | B/F | B/F | B/F | B/F |
| 22 | Yoesu | 34.74 | 127.74 | 73 | 297 | B/F | B/F | B/F | B/F |
| 23 | Jeju | 33.51 | 126.53 | 20 | 408 | B/F | B/F | B/F | B/F |
| 24 | Seogwipo | 33.25 | 126.57 | 50 | 155 | B/F | B/F | B/F | B/F |
| 25 | Jinju | 35.16 | 128.04 | 27 | 333 | B/F | B/F | B/F | |
| 26 | Ganghwa | 37.71 | 126.45 | 46 | 66 | B/F | B/F | B/F | B/F |
| 27 | Icheon | 37.26 | 127.48 | 90 | 198 | F | B/F | B/F | |
| 28 | Inje | 38.06 | 128.17 | 199 | 32 | F | F | ||
| 29 | Hongcheon | 37.68 | 127.88 | 146 | 71 | B/F | B/F | B/F | B/F |
| 30 | Jecheon | 37.16 | 128.19 | 263 | 137 | F | F | B/F | |
| 31 | Boeun | 36.49 | 127.73 | 173 | 35 | F | F | B/F | |
| 32 | Cheonan | 36.78 | 127.12 | 21 | 540 | F | F | F | |
| 33 | Boryeong | 36.33 | 126.56 | 18 | 108 | B/F | F | B/F | B/F |
| 34 | Buyeo | 36.27 | 126.92 | 11 | 78 | B/F | B/F | B/F | |
| 35 | Buan | 35.73 | 126.72 | 4 | 62 | F | F | F | |
| 36 | Imsil | 35.61 | 127.29 | 248 | 32 | B/F | B/F | B/F | |
| 37 | Jeongeup | 35.56 | 126.87 | 40 | 125 | F | F | F | F |
| 38 | Namwon | 35.41 | 127.33 | 94 | 89 | B/F | B/F | B/F | B/F |
| 39 | Suncheon | 35.07 | 127.24 | 74 | 271 | F | F | F | F |
| 40 | Jangheung | 34.69 | 126.92 | 45 | 43 | B/F | B/F | B/F | B/F |
| 41 | Haenam | 34.55 | 126.57 | 5 | 83 | B/F | B/F | B/F | B/F |
| 42 | Goheung | 34.62 | 127.28 | 53 | 78 | B/F | B/F | B/F | B/F |
| 43 | Yeongju | 36.87 | 128.52 | 211 | 116 | B/F | B/F | ||
| 44 | Mungyeong | 36.63 | 128.15 | 171 | 75 | F | F | F | |
| 45 | Yeongdeok | 36.53 | 129.41 | 41 | 43 | B/F | B/F | B/F | |
| 46 | Uiseong | 36.36 | 128.69 | 83 | 61 | B/F | B/F | B/F | |
| 47 | Gumi | 36.13 | 128.32 | 47 | 396 | B/F | F | B/F | |
| 48 | Yeongcheon | 35.98 | 128.95 | 93 | 107 | B/F | B/F | B/F | B/F |
| 49 | Geochang | 35.67 | 127.91 | 221 | 63 | B/F | B/F | B | |
| 50 | Hapcheon | 35.57 | 128.17 | 33 | 55 | B/F | B/F | B/F | B/F |
| 51 | Miryang | 35.49 | 128.74 | 11 | 111 | B/F | B/F | B/F | |
| 52 | Sancheong | 35.41 | 127.88 | 139 | 35 | B/F | B/F | B/F | B/F |
| 53 | Geoje | 34.89 | 128.60 | 45 | 213 | B/F | B/F | F | F |
| 54 | Namhae | 34.82 | 127.93 | 43 | 51 | F | F | F | F |
| Total Budding Stations | 42 | 35 | 45 | 30 | |||||
| Total Flowering Stations | 54 | 49 | 54 | 34 | |||||
| Mean Temperature | Maximum Temperature | Minimum Temperature | Precipitation | ||||||||||
|---|---|---|---|---|---|---|---|---|---|---|---|---|---|
| January | February | March | January | February | March | January | February | March | January | February | March | ||
| Forsythia koreana | Budding | −0.614 ** | −0.719 ** | −0.732 ** | −0.580 ** | −0.675 ** | −0.557 ** | −0.594 ** | −0.660 ** | −0.655 ** | −0.249 ** | −0.329 ** | −0.265 ** |
| Flowering | −0.631 ** | −0.741 ** | −0.792 ** | −0.605 ** | −0.712 ** | −0.668 ** | −0.626 ** | −0.691 ** | −0.706 ** | −0.275 ** | −0.337 ** | −0.217 ** | |
| Rhododendron mucronulatum | B | −0.589 ** | −0.670 ** | −0.667 ** | −0.564 ** | −0.629 ** | −0.503 ** | −0.568 ** | −0.616 ** | −0.605 ** | −0.258 ** | −0.265 ** | −0.258** |
| F | −0.574 ** | −0.667 ** | −0.675 ** | −0.558 ** | −0.644 ** | −0.557 ** | −0.625 ** | −0.611 ** | −0.532 ** | −0.310 ** | −0.293 ** | −0.178 ** | |
| Prunus yedoensis | B | −0.606 ** | −0.676 ** | −0.698 ** | −0.578 ** | −0.633 ** | −0.550 ** | −0.580 ** | −0.619 ** | −0.617 ** | −0.263 ** | −0.268 ** | −0.238 ** |
| F | −0.654 ** | −0.757 ** | −0.808 ** | −0.649 ** | −0.755 ** | −0.723 ** | −0.634 ** | −0.687 ** | −0.686 ** | −0.322 ** | −0.305 ** | −0.208 ** | |
| Prunus mume | B | −0.710 ** | −0.713 ** | −0.708 ** | −0.676 ** | −0.649 ** | −0.510 ** | −0.681 ** | −0.668 ** | −0.650 ** | −0.244 ** | −0.264 ** | −0.310 ** |
| F | −0.687 ** | −0.710 ** | −0.705 ** | −0.687 ** | −0.687 ** | −0.567 ** | −0.654 ** | −0.647 ** | −0.623 ** | −0.242 ** | −0.275 ** | −0.293 ** | |
| SS | df | MS | F | p | |||
|---|---|---|---|---|---|---|---|
| Fosythia koreana | Budding | Between Groups | 28,917 | 1 | 28,917 | 506 | 0.000 |
| Within Groups | 83,479 | 1460 | 57 | ||||
| Total | 112,396 | 1461 | |||||
| Flowering | Between Groups | 42,544 | 2 | 21,272 | 500 | 0.000 | |
| Within Groups | 81,082 | 1906 | 43 | ||||
| Total | 123,626 | 1908 | |||||
| Rhododendron mucronulatum | B | Between Groups | 29,234 | 1 | 29,234 | 371 | 0.000 |
| Within Groups | 94,593 | 1202 | 79 | ||||
| Total | 123,827 | 1203 | |||||
| F | Between Groups | 35,891 | 2 | 17,945 | 332 | 0.000 | |
| Within Groups | 92,371 | 1709 | 54 | ||||
| Total | 128,262 | 1711 | |||||
| Prunus yedoensis | B | Between Groups | 38,414 | 1 | 38,414 | 555 | 0.000 |
| Within Groups | 107,311 | 1551 | 69 | ||||
| Total | 145,725 | 1552 | |||||
| F | Between Groups | 35,356 | 2 | 17,678 | 481 | 0.000 | |
| Within Groups | 69,679 | 1896 | 37 | ||||
| Total | 105,035 | 1898 | |||||
| Prunus mume | B | Between Groups | 93,729 | 1 | 93,729 | 360 | 0.000 |
| Within Groups | 265,764 | 1021 | 260 | ||||
| Total | 359,493 | 1022 | |||||
| F | Between Groups | 155,840 | 1 | 155,840 | 669 | 0.000 | |
| Within Groups | 269,931 | 1159 | 233 | ||||
| Total | 425,770 | 1160 |
| Type | Cluster | Forsythia koreana | Rhododendron mucronulatum | Prunus yedoensis | Prunus mume |
|---|---|---|---|---|---|
| I | 1 | Phenology = 93.21 − 1.23 × FMT − 2.66 × MMT (R2 = 0.507) | Phenology = 94.76 − 1.50 × FMT − 2.43 × MNT (R2 = 0.507) | Phenology = 98.85 − 1.06 × FMT − 2.35 × MMT (R2 = 0.337) | |
| 2 | Phenology = 83.42 − 1.28 × FMT − 0.97 × FXT (R2 = 0.358) | Phenology = 91.319 − 0.43 × JMT − 2.12 × FXT (R2 = 0.307) | Phenology = 92.20 − 1.05 × FMT − 1.39 × FXT (R2 = 0.338) | ||
| III | 1 | Phenology = 84.72 − 2.62 × JMT − 2.49 × FXT (R2 = 0.331) | |||
| 2 | Phenology = 49.695 − 1.35 × JNT − 1.22 × FNT (R2 = 0.313) |
| Type | Cluster | Forsythia koreana | Rhododendron mucronulatum | Prunus yedoensis | Prunus mume |
|---|---|---|---|---|---|
| I | 1 | Phenology = 124.84 − 3.60 × MMT − 2.32 × FXT + 0.04 × MMP (R2 = 0.435) | |||
| 2 | Phenology = 98.18 − 2.04 × JNT − 2.81 × FXT (R2 = 0.331) | ||||
| II | 1 | Phenology = 109.55 − 3.09 × MMT − 0.62 × FXT − 0.02 × FMP + 0.01 × MMP (R2 = 0.574) | Phenology = 101.64 − 2.60 × MMT − 0.81 × FNT + 0.02 × MMP (R2 = 0.472) | Phenology = 116.09 − 2.36 × MMT − 0.90 × FXT + 0.02 × MMP (R2 = 0.550) | |
| 2 | Phenology = 107.39 − 0.40 × FMT − 0.39 × MXT (R2 = 0.423) | Phenology = 101.43 − 1.74 × FMT − 1.81 × MMT (R2 = 0.435) | Phenology = 120.81 − 1.47 × FMT − 1.86 × MXT (R2 = 0.573) | ||
| 3 | Phenology = 94.22 − 0.68 × FMT − 1.36 × FXT (R2 = 0.398) | Phenology = 113.17 + 2.17 × FMT − 4.40 × FXT (R2 = 0.222) | Phenology = 126.77 − 1.39 × FMT − 2.39 × MXT (R2 = 0.649) |
| N | Mean | SD | ANOVA | SS | df | MS | F | p | ||
|---|---|---|---|---|---|---|---|---|---|---|
| 5 days | Forythia koreana | 985 | 7.7 | 13.2 | Between Groups | 11,154 | 3 | 3718 | 15 | 0.000 |
| Rhododendron mucronulatum | 869 | 9.6 | 13.1 | |||||||
| Prunus yedoensis | 978 | 12.4 | 19 | Within Groups | 824,765 | 3235 | 254 | |||
| Prunus mume | 407 | 9.1 | 13.8 | |||||||
| Total | 835,919 | 3238 | ||||||||
| 10 days | Forythia koreana | 985 | 14.4 | 16.5 | Between Groups | 11,154 | 3 | 3718 | 27 | 0.000 |
| Rhododendron mucronulatum | 869 | 17.1 | 20.1 | |||||||
| Prunus yedoensis | 978 | 22.8 | 25.6 | Within Groups | 824,765 | 3235 | 254 | |||
| Prunus mume | 407 | 18.3 | 19.6 | |||||||
| Total | 835,919 | 3238 | ||||||||
| 15 days | Forythia koreana | 985 | 21.4 | 19.1 | Between Groups | 11,154 | 3 | 3718 | 29 | 0.000 |
| Rhododendron mucronulatum | 869 | 24.2 | 23.6 | |||||||
| Prunus yedoensis | 978 | 31.3 | 29.8 | Within Groups | 824,765 | 3235 | 254 | |||
| Prunus mume | 407 | 26.9 | 24.6 | |||||||
| Total | 835,919 | 3238 | ||||||||
| 30 days | Forythia koreana | 985 | 44.3 | 27 | Between Groups | 11,154 | 3 | 3718 | 9 | 0.000 |
| Rhododendron mucronulatum | 869 | 45.5 | 29.4 | |||||||
| Prunus yedoensis | 978 | 51.1 | 35.6 | Within Groups | 824,765 | 3235 | 254 | |||
| Prunus mume | 407 | 48.9 | 36.2 | |||||||
| Total | 835,919 | 3238 | ||||||||
| Flowering | Forsythia koreana | Rhododendron mucronulatum | Prunus yedoensis | Prunus mume | ||||||||||||
|---|---|---|---|---|---|---|---|---|---|---|---|---|---|---|---|---|
| Events (%) | 5 Days | 10 Days | 15 Days | 30 Days | 5 Days | 10 Days | 15 Days | 30 Days | 5 Days | 10 Days | 15 Days | 30 Days | 5 Days | 10 Days | 15 Days | 30 Days |
| 90% | 0 | 0 | 2.4 | 13.6 | 0 | 0 | 1.9 | 13 | 0 | 0.2 | 2.7 | 13 | 0 | 0.2 | 2.5 | 11.6 |
| 80% | 0 | 1 | 5.7 | 21.3 | 0 | 1.1 | 4.9 | 21 | 0 | 2.1 | 6.4 | 20.8 | 0 | 1.7 | 7.4 | 18.9 |
| 70% | 0 | 2.9 | 9.5 | 27.5 | 0 | 2.9 | 9.5 | 27.5 | 0.1 | 5 | 11.5 | 27.1 | 0 | 5 | 11.3 | 25.2 |
| 60% | 0.5 | 6 | 13.3 | 32.5 | 0.5 | 6.4 | 13.5 | 32 | 1.2 | 9 | 16.5 | 34 | 0.7 | 9.2 | 15 | 31.3 |
| 50% | 1.5 | 9.6 | 16.5 | 38.7 | 2 | 10.5 | 17.3 | 39.1 | 3.2 | 13 | 22.5 | 42.4 | 2.5 | 12.6 | 19.7 | 39.7 |
| 40% | 4.3 | 13.5 | 20.5 | 45.8 | 5.1 | 14.6 | 22.6 | 47.2 | 7.2 | 19.5 | 30 | 52.8 | 5.5 | 15.2 | 25.5 | 50 |
| 30% | 8 | 17.9 | 25.6 | 54.8 | 9.8 | 21.5 | 29.4 | 56.8 | 12.5 | 28.4 | 38.5 | 65 | 10.2 | 20.9 | 34 | 60.7 |
| 20% | 13 | 25 | 33.5 | 65.3 | 15.3 | 30 | 39 | 68.9 | 22.5 | 40.2 | 52 | 76.9 | 16.1 | 31.4 | 44.2 | 72 |
| 10% | 22.9 | 35.2 | 47 | 84.5 | 30.1 | 44.5 | 53.5 | 85.4 | 39.3 | 58.6 | 71 | 100.6 | 29.1 | 46.5 | 59.5 | 97.5 |
| Mean Temperature | Maximum Temperature | Minimum Temperature | Precipitation | ||||||||||
|---|---|---|---|---|---|---|---|---|---|---|---|---|---|
| January | February | March | January | February | March | January | February | March | January | February | March | ||
| All stations | 0.48 ** | 0.46 ** | 0.40 ** | 0.45 ** | 0.69 ** | 0.51 ** | 0.57 ** | 0.33 ** | 0.29 ** | 0.57 | 0.43 * | 1.42 | |
| Type I | Cluster 1 | 0.55 ** | 0.46 ** | 0.42 ** | 0.51 ** | 0.73 ** | 0.52 ** | 0.64 ** | 0.32 ** | 0.27 ** | 0.33 | 0.72 | −0.29 |
| Cluster 2 | 0.43 ** | 0.48 ** | 0.39 ** | 0.40 ** | 0.65 ** | 0.50 ** | 0.50 ** | 0.36 ** | 0.32 ** | 0.16 | −3.36 * | 2.15 | |
| Type II | Cluster 1 | 0.55 ** | 0.46** | 0.42 ** | 0.51 ** | 0.73 ** | 0.52 ** | 0.64 ** | 0.32 ** | 0.27 ** | 0.33 | 0.72 | −0.29 |
| Cluster 2 | 0.29 ** | 0.35 ** | 0.33 ** | 0.34 ** | 0.63 ** | 0.50** | 0.29 ** | 0.16 * | 0.18 ** | −0.13 | −4.50 * | 1.95 | |
| Cluster 3 | 0.53 ** | 0.57 ** | 0.45 ** | 0.42 ** | 0.62 ** | 0.46 ** | 0.68 ** | 0.56 ** | 0.50 ** | 2.58 | −1.88 | 2.58 | |
| Type III | Cluster 1 | 0.48 ** | 0.43 ** | 0.39 ** | 0.48 ** | 0.71 ** | 0.52 ** | 0.55 ** | 0.27 * | 0.24 ** | 0.41 | −1.61 * | 0.71 |
| Cluster 2 | 0.49 ** | 0.58 ** | 0.45 ** | 0.37 ** | 0.62 * | 0.48 ** | 0.63 ** | 0.56 ** | 0.47 ** | 2.81 | −3.44 | 1.46 | |
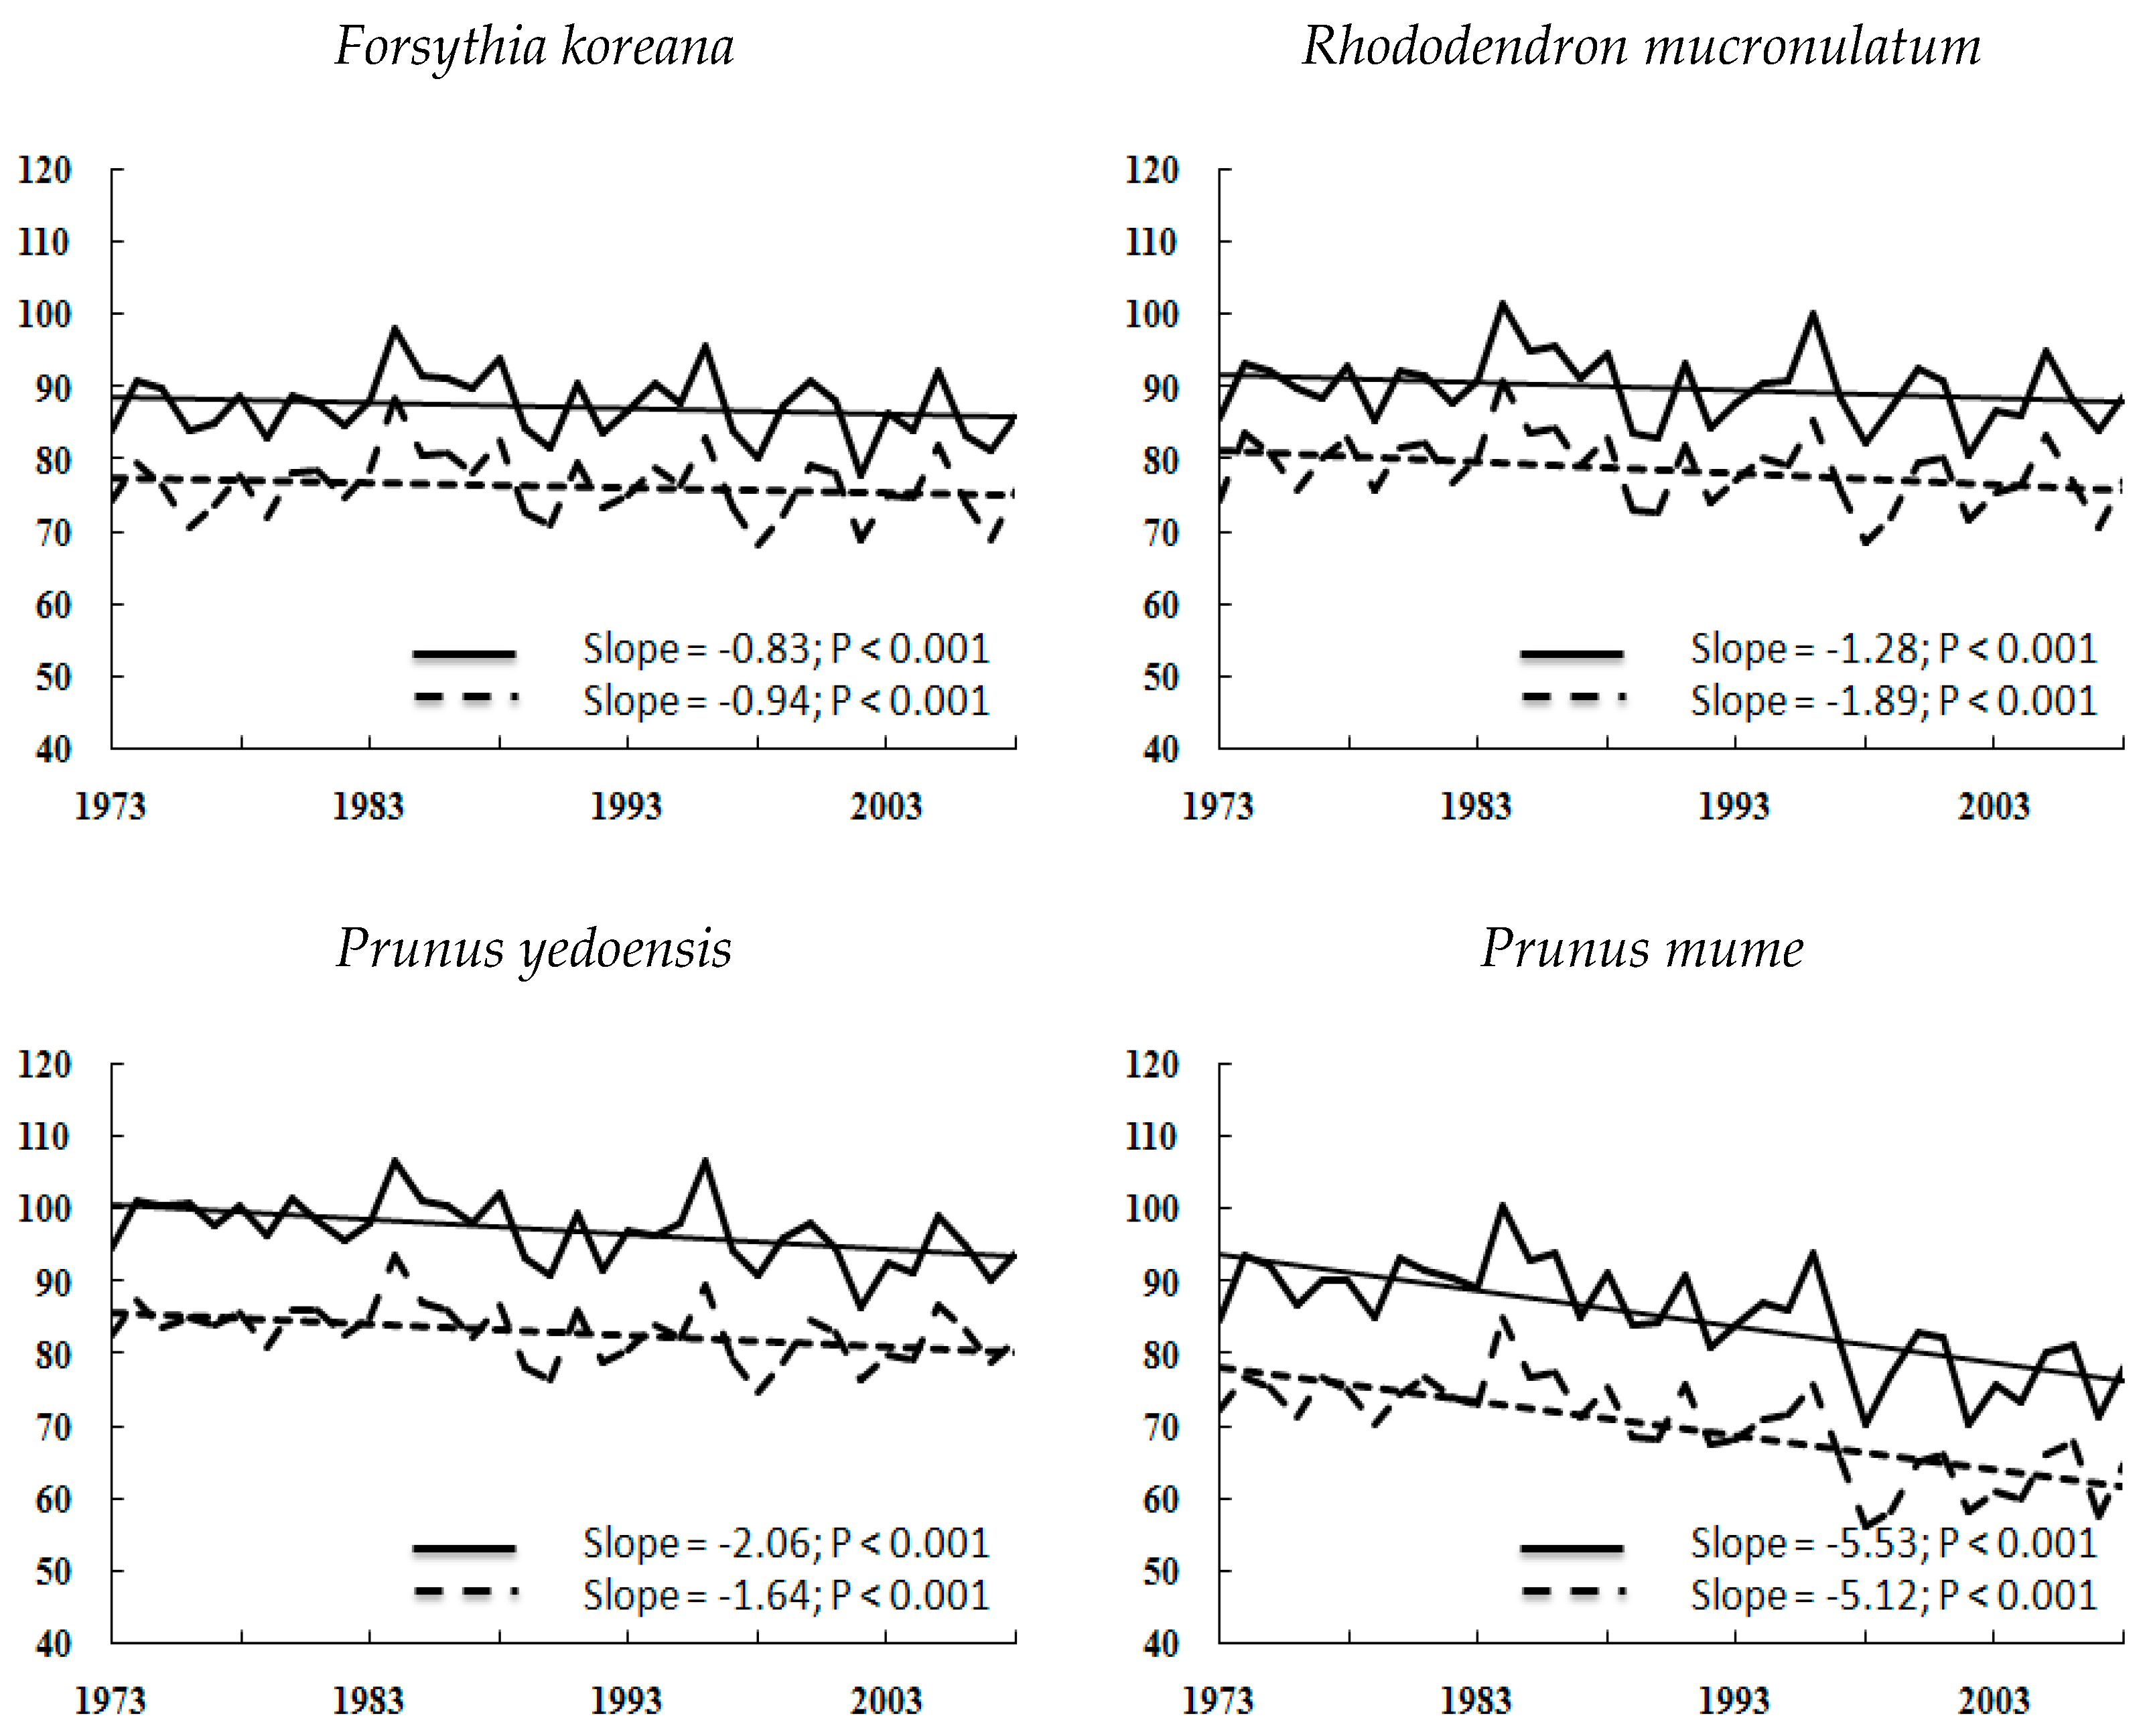
| Forsythia koreana | Rhododendron mucronulatum | Prunus yedoensis | Prunus mume | ||||||
|---|---|---|---|---|---|---|---|---|---|
| Budding | Flowering | B | F | B | F | B | F | ||
| All stations | −0.94 ** | −0.83 ** | −1.89 ** | −1.28 ** | −1.64 ** | −2.06 ** | −5.12 ** | −5.53 ** | |
| Type I | Cluster 1 | −0.86 ** | −1.59 ** | −1.65 ** | −5.50 ** | ||||
| Cluster 2 | −1.05 ** | −2.16 ** | −1.82 ** | −5.66 ** | |||||
| Type II | Cluster 1 | −0.90 ** | −1.34 ** | −1.55 ** | |||||
| Cluster 2 | −0.69 ** | −0.67 ** | −1.59 ** | ||||||
| Cluster 3 | −1.06 ** | −2.24 ** | −2.51 ** | ||||||
| Type III | Cluster 1 | −4.98 ** | |||||||
| Cluster 2 | −5.67 ** | ||||||||
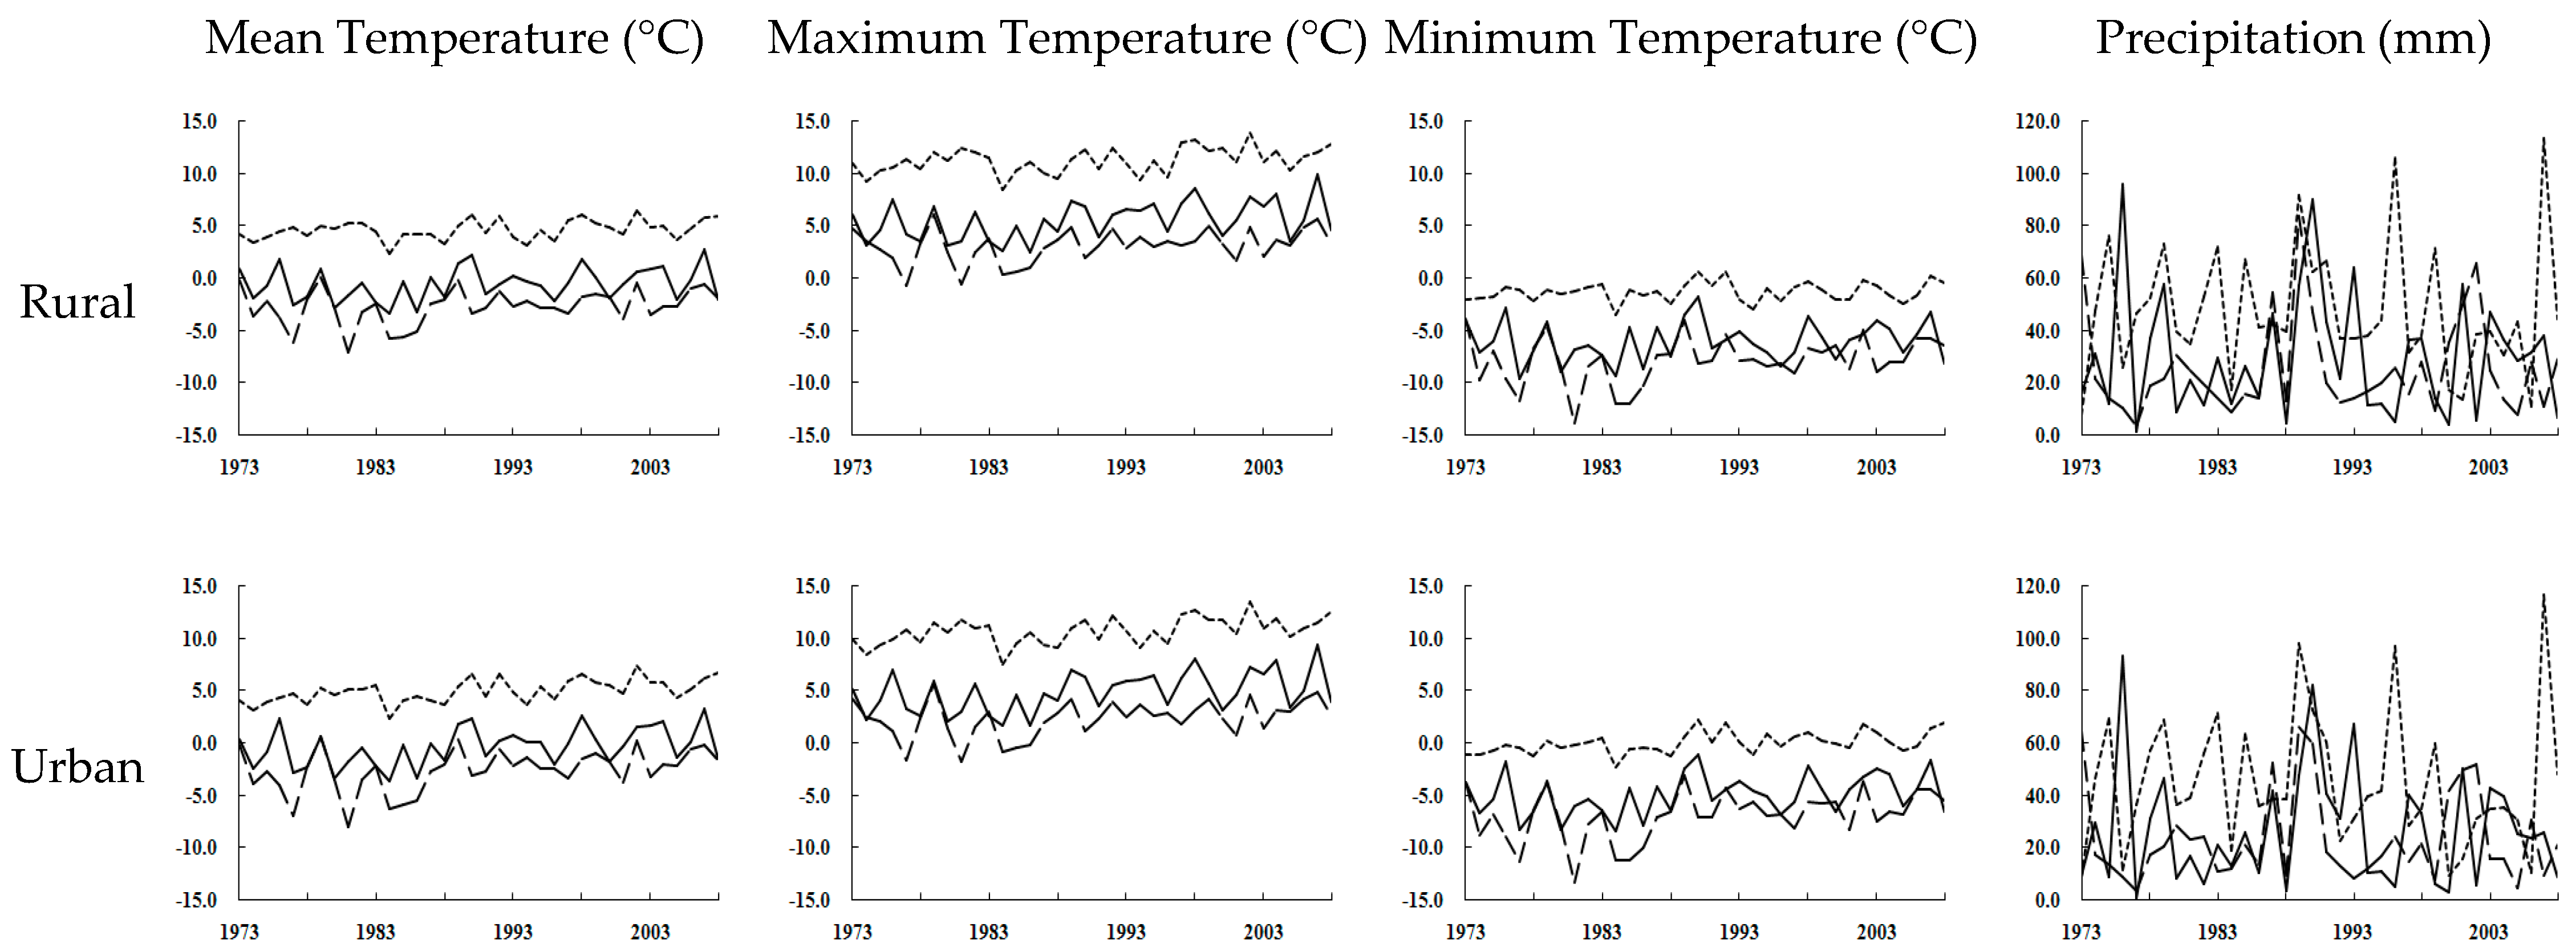
| Mean Temperature | Maximum Temperature | Minimum Temperature | Precipitation | |||||||||||
|---|---|---|---|---|---|---|---|---|---|---|---|---|---|---|
| January | February | March | January | February | March | January | February | March | January | February | March | |||
| All stations | Rural | 0.45 | 0.43 | 0.37 * | 0.44 | 0.68 * | 0.51 * | 0.53 | 0.29 | 0.25 | 1.01 | −2.25 | 0.93 | |
| Urban | 0.70 * | 0.72 * | 0.58 ** | 0.53 * | 0.75 ** | 0.54 * | 0.81 * | 0.65 * | 0.57 ** | 0.42 | −0.77 | 0.57 | ||
| Type I | Cluster 1 | R | 0.45 | 0.35 | 0.31 * | 0.46 | 0.68 * | 0.46 * | 0.54 | 0.20 | 0.16 | 0.48 | −0.85 | −0.32 |
| U | 0.78 * | 0.77 * | 0.64 ** | 0.57 | 0.78 * | 0.54 * | 0.87 * | 0.69 * | 0.62 ** | 0.14 | −0.59 | 0.00 | ||
| Cluster 2 | R | 0.37 | 0.44 | 0.36 * | 0.37 | 0.65 * | 0.50 * | 0.44 | 0.31 | 0.27 | 1.57 | −3.8 | 2.47 | |
| U | 0.62 * | 0.67 * | 0.53 ** | 0.50 * | 0.72 * | 0.54 * | 0.75 * | 0.61 * | 0.52 ** | 0.71 | −0.94 | 1.15 | ||
© 2017 by the author. Licensee MDPI, Basel, Switzerland. This article is an open access article distributed under the terms and conditions of the Creative Commons Attribution (CC BY) license (http://creativecommons.org/licenses/by/4.0/).
Share and Cite
Lee, S.-D. Global Warming Leading to Phenological Responses in the Process of Urbanization, South Korea. Sustainability 2017, 9, 2203. https://doi.org/10.3390/su9122203
Lee S-D. Global Warming Leading to Phenological Responses in the Process of Urbanization, South Korea. Sustainability. 2017; 9(12):2203. https://doi.org/10.3390/su9122203
Chicago/Turabian StyleLee, Sang-Don. 2017. "Global Warming Leading to Phenological Responses in the Process of Urbanization, South Korea" Sustainability 9, no. 12: 2203. https://doi.org/10.3390/su9122203
APA StyleLee, S.-D. (2017). Global Warming Leading to Phenological Responses in the Process of Urbanization, South Korea. Sustainability, 9(12), 2203. https://doi.org/10.3390/su9122203