Advanced Strategies for Net-Zero Energy Building: Focused on the Early Phase and Usage Phase of a Building’s Life Cycle

 ,
,
Abstract
:1. Introduction
1.1. Research Background
1.2. Outline
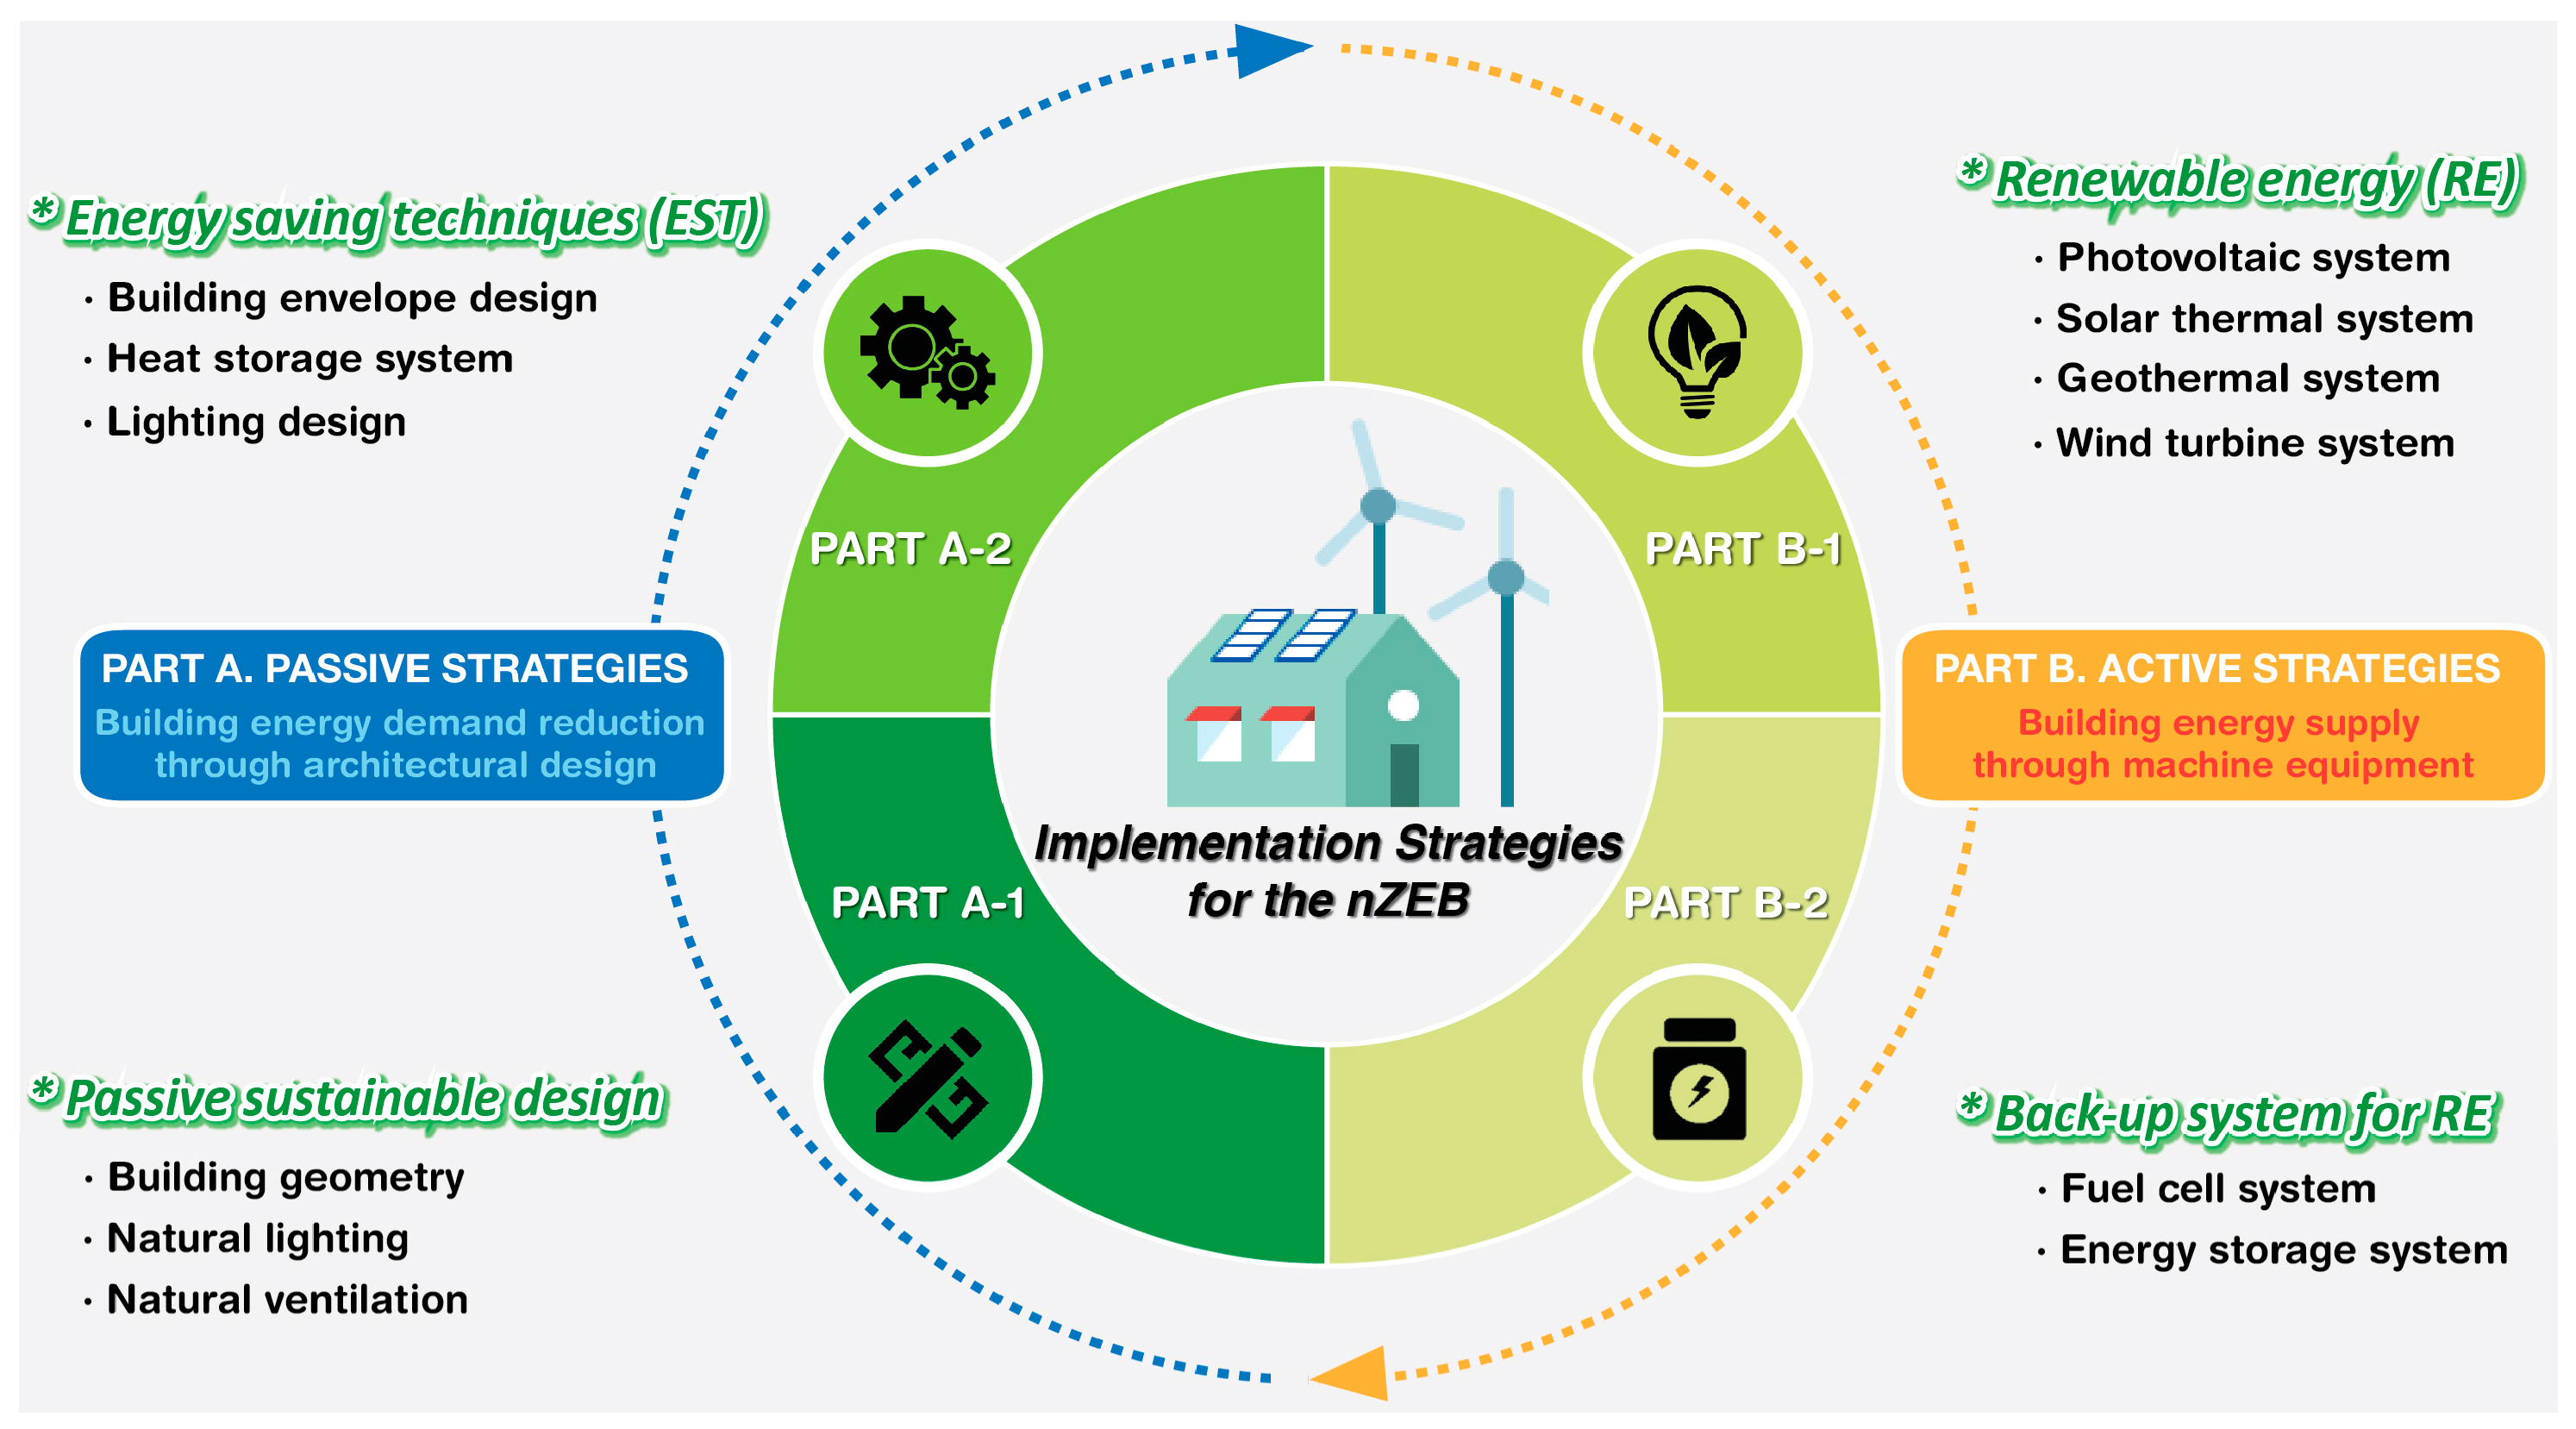
- (1)
- Part A—Passive strategies: To help realize nZEB through the reduction of the building energy demand (e.g., heating and cooling load, etc.) by introducing architectural design techniques in the early design stage [6]. Also, it can be divided into the following two categories: Part A-1: passive sustainable design; and Part A-2: energy-saving techniques (EST);
- (2)
- Part B—Active strategies: After reducing the building energy demand through passive strategies, the residual load can be saved via the active strategies, such as RE [6]. There are two categories of active strategies for implementing nZEB: Part B-1: RE; and Part B-2: a back-up system for RE.
2. A Holistic Review of the Implementation Strategies of nZEB
2.1. Part A: Passive Strategies
2.1.1. Part A-1: Passive Sustainable Design
- (1)
- Building geometry: Building energy demand is greatly influenced by a building’s composition and shape. Thus, almost all the previous studies related to building geometry evaluated building energy performance by focusing on the surrounding environment (i.e., site slope) and plan form (refer to Table 1) [8,9,10,11,12,13,14,15]. For example, De Castro and Gadi (2017) compared the annual energy savings according to the site slope within the range of 0~50° to find out the ideal design by considering the topography. As a result, it is shown that the 30° site slope and box-type design is the optimal design with the highest energy-saving potential via the ‘EnergyPlus’ software program [8]. Choi et al. (2012) investigated the energy consumption patterns according to four high-rise-apartment plan layouts (e.g., plate and tower type) and two living types (i.e., general-use, mixed-use) through questionnaires and a field study for evaluating the building energy performance (i.e., electricity consumption, gas consumption, and CO2 emissions). This study showed that the electricity consumption of plate-type buildings was lower than that of tower-type buildings, but their gas consumption was higher. In addition, from the perspective of a building’s living type, mixed-use buildings generated more CO2 emissions than the general residential buildings [10]. Asadi et al. (2014) and Mottahedi et al. (2015) evaluated the energy consumption using the multilinear regression analysis and Monte Carlo simulation by considering a total of 7 building shapes (i.e., L, U, T, H, triangle, rectangle, rectangle min-corner) and 17 design variables (e.g., orientation, insulation, occupant schedule, etc.). As a result of the analysis of the annual energy consumption according to the seven building shapes, it was determined that the H shape of the building in the Texas climate zone had the highest energy consumption among all the shapes studied [11,15].
- (2)
- Natural lighting: Through an in-depth analysis of the sun’s altitude, the amount of daylight, etc., many researchers have conducted various studies on how to determine the optimal orientation of a building and on designing the atrium from the perspective of introducing the natural light system for nZEB implementation (refer to Table 2) [16,17,18,19,20,21,22,23,24,25,26,27,28]. First, there are various studies related to determination of the optimal orientation of a building for reducing the building energy demand [16,17,18,19,20]. Abanda and Byer (2016) assessed the impact of the building orientation on building energy consumption using building information modeling according to the following three-step process: (i) building design through the Revit software program; (ii) conversion to a numerical value based on Green Building Studio, one of the leading energy simulation programs; and (iii) analysis of the effect of building orientations on the annual energy usage of a building. From the analysis results, the optimal building orientation in terms of the annual electricity and gas consumption was derived as south (i.e., building orientation of +180° from north), and the difference in energy cost savings throughout a 30 year period between the best and worst (i.e., the orientation of +45° from north) orientation was determined as £878 [17]. Hemsath (2016) aimed to analyze the impact of the building orientation on the building energy consumption and annual costs for four different geographical locations in U.S. (i.e., Lincoln, New York, Miami, and Phoenix) at the community and individual house levels. Compared to an individual house’s optimal orientation, the mean of planning that considers the optimal building orientation at a community level was analyzed to more effectively reduce the annual energy cost [19]. Second, various studies have been carried out for efficient atrium design because the atrium shape is a very important factor in natural lighting [21,22,23,24,25,26,27,28]. Nasrollashi et al. (2015) assessed the impact of the atrium-to-total building area ratio in terms of the energy efficiency and indoor environmental conditions, using the DesignBuilder software program. As a result of this study, setting the atrium-to-total building area ratio as 1/4 was determined to be the most effective in terms of energy performance, daylighting, and thermal comfort (i.e., predicted mean vote) [25]. Mohsenin and Hu (2015) evaluated the daylight of an office building according to the atrium type (i.e., central, attached, and semi-enclosed), atrium proportions (i.e., Well Index), and roof aperture designs (i.e., monitor roof and horizontal skylight) through the DIVA software program as the climate-based daylighting modeling tool [26].
- (3)
- Natural ventilation: To implement nZEB, an architectural design for inducing the reduction of the building energy demand through the effective influx of the outdoor air (i.e., natural ventilation) should be considered in the initial design stage. Generally, natural ventilation can be categorized based on two mechanisms: (i) buoyancy-driven ventilation by the vertical and horizontal temperature difference; and (ii) wind-driven ventilation by the pressure difference between the front and the back of the building (refer to Table 3) [29,30,31,32,33,34,35,36,37,38]. First, there are various previous studies related to buoyancy-driven ventilation [29,30,31,32,33,34]. Li and Liu (2014) focused on the thermal performance of phase-change-material (PCM)-based solar chimney within laboratory conditions with three different heat fluxes (500, 600, and 700 W/m2). Through this study, it was confirmed that PCM-based solar chimney can achieve the time-shifting of solar energy, which can induce more effective natural ventilation compared to the general solar chimney, based on the large thermal energy storage capacity of PCM [31]. Acred and Gary (2014) proposed a design strategy of stack effect ventilation for a multi-story atrium building based on a simplified mathematical model. The dimensionless charts that can determine the combination of design variables were developed as a guideline for realizing natural a ventilated building [30]. Second, there are various previous studies related to wind-driven ventilation [35,36,37,38]. Nejat et al. (2016) conducted a comparative analysis of the wind-catcher-integrated wing wall (i.e., new design) and the conventional wind catcher via the Computational Fluid Dynamics (CFD) software program and wind tunnel testing. As a result, the ventilation performance of the wind-catcher with a 30° wing wall angle was superior to the other designs (45° and 60°). Also, the ventilation performance of the new design was improved by 50% compared to the conventional wind catcher [37]. Mei et al. (2017) analyzed the ventilation performance according to the building density level in an urban residential neighborhood using the CFD software program. In addition, this study presented a strategy for establishing the optimal neighborhood building layout design in terms of ventilation performance (i.e., pollutant level) [38].
- (4)
- Discussion: In this study, research related to passive sustainable design was analyzed, focusing on building geometry, natural lighting, and natural ventilation. First, from the viewpoint of building geometry, previous studies have focused on energy savings according to the building shape and building density. Second, from the viewpoint of natural lighting, most previous studies centered on reducing the lighting, cooling, and heating load depending on the shape and size of the atrium and the building’s orientation. Finally, from the view point of natural ventilation, previous studies analyzed the energy-saving potential and ventilation performance focused on buoyancy-driven ventilation and wind-driven ventilation. In other words, if a building is designed with factors of building geometry, natural lighting, and natural ventilation being taken into consideration at the beginning of the process, the following effects can be obtained: 20% energy efficiency improvement, 25% heating, and 10–30% cooling load reduction [12,21,33]. However, it is still insufficient to consider only passive sustainable design in terms of implementing nZEB. Therefore, future studies from the perspective of nZEB need to be applied not only with passive sustainable design, but also with energy-saving techniques (EST) and active strategies.
2.1.2. Part A-2: Energy-Saving Techniques (EST)
- (1)
- Building envelope design: As the building envelope is directly against the external environment, it plays an important role in energy consumption (e.g., heating and cooling demand) [39]. Accordingly, a variety of studies have been carried out in relation to the reduction of the building energy demand through the envelope design. In this study, the above-mentioned past studies can be classified into heat insulation, opening design, and shading device (refer to Table 4) [40,41,42,43,44,45,46,47,48,49,50,51,52,53,54,55]. First, in terms of the heat insulation, the studies that have been carried out to reduce buidling energy demand are as follows [40,41,42,43,44,45]. Pomponi et al. (2015) evaluated CO2 emissions and energy consumptions in terms of building life cycle by comparing various façade strategies (i.e., double-skin facade, traditional up-to-standard, and single skin). As a result of the analysis, it was confirmed that applying the double-skin façade of building has the best carbon-saving potential [44]. Tam et al. (2016) assessed the technical performance and cost-effectiveness of the green roof as a heat insulation in Hong Kong through a questionnaire survey, interviews, and field studies. Also, the results showed that the room temperature can be lowered by 3.4 °C when the green roof is applied [45]. Second, in terms of the window design, most of the previous studies mainly focused on the derivation of an optimal design solution considering that the window is more vulnerable to heat gain and loss than the wall is [46,47,48,49,50,51]. Goia (2016) examined the optimal window-to-wall ratio (WWR) for four cities (i.e., Oslo, Frankfurt, Rome, and Athens) located in the mid-latitude region of Euroupe through the EnergyPlus software program. These cities all showed an optimal energy performance within the range of 30–45% of the WWR [49]. Wen et al. (2017) aimed to develop a guideline that would enable the designer to determine the suitability of the WWR in the early design stage. As a result, the distribution of the optimal WWR in Japan was mapped out by considering the window properties (e.g., U-value, visible transmittance, etc.) and meteorological factors (i.e., mean external temperature and mean global solar radiation) [50]. Finally, in terms of the shading device, several studies have been conducted to foind a way of lowering the building energy demand [52,53,54,55]. Kim et al. (2012) investigated the various type of external shading devices (e.g., overhang, blind, etc.) in terms of energy savings for heating and cooling, via the IES_VE software program. Through this study, it was concluded that the external shading device had a better technical performance than the internal shading device [52].
- (2)
- Heat storage system: Various studies associated with the heat storage system have been conducted because the heat capacity of a building is a very important factor from the point of view of nZEB. This study examined the previous studies that analyzed the energy reduction according to the building thermal performance, focusing on the thermal mass and trombe wall (refer to Table 5) [56,57,58,59,60,61,62,63,64,65,66]. First, there are many previous studies that focused on reducing the heating and cooling demand of a building through the heat storage function of the thermal mass [56,57,58,59,60,61]. Ma and Wang (2012) conducted a numerical analysis of the dynamic heat transfer performance of the interior planer thermal mass according to the thermal mass thickness (i.e., 0.025~0.70 m) and type (i.e., wood, concrete, and steel). It was found that the heat storage ability of the thermal mass relies on the thermal mass thickness for reaching a superlative value [58]. Chernounsov and Chan (2016) analyzed the thermal performance of the building-envelope-integrated PCM with a high specific heat capacity using the EnergyPlus software program for an office building in Hong Kong. Through this study, the relationship between the indoor thermal environment and the PCM’s thickness, placement, and orientation was analyzed [61] Second, the past studies related to the trombe wall, which functions as a heat storage system by applying a solar heating collector made of double glazing on the wall, are as follows [62,63,64,65,66]. Bojic et al. (2014) conducted a comparative analysis of the environmental performance (i.e., primary energy for heating during winter and annual energy consumption) according to the application of the trombe wall. As a result of the analysis, it was shown that 20% annual energy-saving is possible when the trombe wall is applied [64] Bajc et al. (2015) focused on the impact analysis of the building energy demand of a passive house with the trombe wall via CFD simulation considering the Belgrade weather. The results showed that the trombe wall increased the cooling demand in summer, but it is very suitable for the Belgrade climate because of its efficient heating energy-saving in winter [66].
- (3)
- Lighting design: From the perspective of nZEB implementation, this study analyzed the previous studies focused on the lighting emitting diode (LED), light shelves, and lighting control system as methods for reducing the lighting load (refer to Table 6) [67,68,69,70,71,72,73,74]. Principi and Fioretti (2014) conducted a comparative analysis of the compact fluorescent and LED in terms of their environmental performance, based on the experimental test results. Moreover, it is possible to save up to 41~50% global warming potential and cumulative energy demand by using LED rather than the compact fluorescent [68]. Meresi (2016) investigated the efficiency of daylight for the allocation of light shelves and movable semi-transparent external blind considering various design conditions, via the Radiance software program. As a result, the combination of a light shelf and semi-transparent movable external blinds can increase the daylight exploitation and can construct a uniform illuminance distribution in a room by increasing the light level at the back of the space and reducing the daylight near the window [72]. Byun et al. (2014) developed an intelligent LED control system considering the energy consumption and user satisfaction, based on multi-sensors and wireless communication technology. The proposed LED control system showed 21.9% energy savings by automatically adjusting the illuminance considering the energy efficiency [67].
- (4)
- Discussion: In this study, existing studies related to EST are analyzed focusing on the building envelope design, heat storage system, and lighting design. In particular, due to the characteristics of the building envelope directly facing the external environment, lots of studies related to building envelope design and energy demand have been carried out, taking into consideration heat insulation, window design, and shading device. Also, for the heat storage system, various studies are under way to increase the heat storage performance of a building by applying advanced materials such as PCM. Finally, leading on from studies regarding the introduction of LEDs, studies in terms of lighting design focusing on a reduction of the lighting load through the introduction of a control system considering daylight and shading devices are being carried out. As previously mentioned, various studies are underway to reduce building energy demands, but it is not enough to focus on only EST for practical nZEB implementation. In other words, to realize nZEB, active strategies must be considered together with EST as passive strategies.
2.2. Part B: Active Strategies
2.2.1. Part B-1: Renewable Energy (RE)
- (1)
- PV system: The previous studies related to the PV system mainly performed technical-economic-policy analysis in terms of two perspectives (i.e., rooftop PV system and building-integrated PV system (BIPV)) (refer to Table 7) [75,76,77,78,79,80,81,82,83,84,85,86,87,88,89,90,91,92,93,94,95]. First, there have been various studies on the rooftop PV system [75,76,77,78,79,80,81,82]. Ordóñez et al. (2010) investigated the energy capacity of the PV system in Andalusia, Spain considering the residential building characterization (e.g., detached house, townhouse, etc.), useful rooftop area, and PV panel installation design (i.e., distance between solar panels) using the Autodesk AutoCAD software program. According to this study, the amount of electricity generated from PV systems on a residential building’s rooftop (i.e., 265.52 km2 of the total roof surface area) is 9.73 GW/year, which is 78.89% of the total energy requirements [75]. Elibol et al. (2017) was carried out outdoor testing of the technical performance of PV panels for one year on the roof of Düzce university scientific and technology researches application and research center in Düzce Province, Turkey according to the PV panel’s type (i.e., mono-crystalline, polycrystalline, and amorphous silicon (a-Si)). As a result, the efficiencies of the PV panel were 4.79, 11.36, and 13.26% for the a-Si, polycrystalline, and monocrystalline PV panel, respectively. In addition, the external temperature correlated positively with the a-Si and polycrystalline PV panel, and negatively correlated with the monocrystalline PV panel [81]. Hong et al. (2017) developed a method for predicting the amount of electricity generated from the rooftop PV system through hill shade analysis, by assessing the potential of three perspectives (i.e., physical, geographic, and technical potential). As a result of applying the developed methodology to the Gangnam district in Seoul, South Korea, the physical, geographic (i.e., the available rooftop area), and technical potentials of Gangnam district were 9,178,982 MWh, 4,964,118 m2, and 1,130,371 MWh [82]. Second, there have been various studies on the BIPV [83,84,85,86,87,88,89,90,91,92,93,94,95]. Olivieri et al. (2014) evaluated the technical performance of the window-integrated semi-transparent PV system and general glazing via a package of specific software program (i.e., DesignBuilder, EnergyPlus, PVsyst, and COMFEM). It was confirmed that the window-integrated semi-transparent PV system showed 18–59% energy savings according to the façade opening compared with the reference glass [90]. Oh et al. (2017) developed a nine-node-based finite element model for estimating the techno-economic performance of building-integrated PV blind system (BIPB) through Microsoft-Excel based VBA. In addition, the economic analysis of BIPB was conducted focusing on the residential progressive electricity tariffs [95].
- (2)
- Solar thermal system: There have been various studies that utilize solar heat by absorbing, storing, and converting it for the heating and cooling of a building based on infinite solar energy (refer to Table 8) [96,97,98,99,100,101,102,103,104,105,106,107]. Anderson et al. (2010) analyzed the effect of the color (ranging from white to black) of the solar collector both theoretically and experimentally on the thermal performance of the building-integrated solar thermal system [96]. Mammoli et al. (2010) analyzed the techno-economic-environmental performance of a solar-thermal-assisted HVAC system by considering the season, operation time, temperature (e.g., tank temperature, solar array inlet/out let temperature, etc.), and solar heat data (e.g., solar flux, solar collector’s efficiency, etc.) through experiment evaluation [97]. Bornatico et al. (2012) developed a model that could represent the optimal capacity of the solar thermal system through the particle swarm optimization algorithm and genetic algorithm by considering the meteorological data, collector area, tank volume, and size of the auxiliary power unit [99]. Chialastri and Isaacson (2017) conducted tests for a prototype of a building-integrated PV/thermal air collector which can generate thermal and electrical energy based on experiments and two-dimensional models in COMSOL Multiphysics. As a result, the maximum temperature of the prototype was 31 °C, and the average thermal and electrical efficiencies were 31% and 7%, respectively [107].
- (3)
- Geothermal system: Many studies have been conducted on the geothermal system that can reduce the heating and cooling demand of a building based on a constant annual underground temperature of 15 °C (refer to Table 9) [108,109,110,111,112,113,114,115,116,117,118,119]. Kim et al. (2012) conducted an evaluation of the performance of the geothermal system installed in Pusan national university in South Korea based on the measured data (e.g., outdoor and indoor temperature, inlet and outlet temperature of circulating water, etc.). Towards this end, this study installed thermocouples under the ground for analyzing the characteristics of the geothermal heat exchanger’s thermal diffusion, and estimated the technical performance of the geothermal system according to the heating and cooling period [34]. Sivasakthivel et al. (2012) assessed the potential reduction in CO2 emissions and the potential for electricity-saving by introducing the geothermal system during winter in the northern region of India, considering the regional factors and the coefficient of performance of the geothermal system. This study indicated that applying the geothermal system can reduce the CO2 emissions and electricity consumption by 0.539 and 708 GW, respectively [111]. Kim et al. (2015) conducted a comprehensive analysis of the economic and environmental performance of the geothermal system according to the entering water temperature from life cycle perspective, using the GLHEPro software program [115].
- (4)
- Wind turbine system: As the wind speed is a very important factor for the wind turbine system, most of the previous studies on it analyzed its technical performance by applying it to the rooftop or to a high-rise building (refer to Table 10) [120,121,122,123,124,125,126,127,128]. Li et al. (2013) assessed the feasibility of implementing the wind turbine system in a tall building through wind tunnel tests. As a result, the building orientation, the bell-mounted shapes of the four tunnels with contracted inner sections, and the surrounding buildings were found to be important factors influencing the wind speed amplification and wind loads [124]. Lu and Sun (2014) analyzed the technical potential of wind power in urban high-rise buildings considering the wind data and building properties. Toward this end, a numerical analysis of the simulation results was conducted using the CFD and ANSYS FLUENT software program [125]. Cao et al. (2017) evaluated the wind power resource around the 1000-meter scale of mega-tall buildings in China based on the mesoscale meteorological model Weather Research and WRF v3.4 software program. According to the results of this study, the technical performance of the wind turbine system was seen to be the best when at distances of 300 and 200 m from the ground, and when the building orientation is north and south, in terms of the wind power density and the amount of electricity generated [128].
- (5)
- Discussion: The four RE (i.e., PV system, solar thermal system, geothermal system, and wind turbine system)-related researches in this study showed the following trends. First, studies related to the PV system were mainly focused on the techno-economic performance analysis according to the PV panel type (e.g., a-Si panel, polycrystalline panel, monocrystalline panel, and semi-transparent PV system) and the development of the prediction model of the amount of electricity generated according to the design variables of the PV system. Second, related studies of the solar thermal system focused primarily on the thermal performance of a building according to the characteristics of the solar collector (e.g., color, capacity, temperature, etc.). Third, for the geothermal system, the majority of studies carried out on energy savings and economic effects depend on design conditions (e.g., a given geothermal system’s coefficient of performance, location, borehole length, etc.). Lastly, for the wind turbine system applied to building, studies were conducted mainly on high-rise building in order to analyze the amount of electricity generated and optimal design conditions by considering climate (e.g., wind date), building layout, and so on. Various efforts such as the application of high efficiency PV panels and analysis on optimal design conditions of the RE system have been carried out to improve energy self-sufficiency rate of a building through RE-related studies, but it would be very difficult to implement nZEB with only RE.
2.2.2. Part B-2: Back-Up Systems for RE
- (1)
- Fuel cell system: The fuel cell system is an electricity power generator that utilizes electricity produced through the chemical reaction of hydrogen and oxygen. Furthermore, the fuel cell system can be more effectively used when applied with RE. This is because the electricity produced from RE can be used in the electrolysis of water in the fuel cell system [129]. The previous studies related to the fuel cell system are as follows (refer to Table 11) [130,131,132,133,134,135]. Hong et al. (2014) aimed to develop a framework for optimally applying the fuel-cell-based combined heat and power system to a multi-family housing complex. Also, in order to verify the feasibility of developed framework, this study evaluated the fuel-cell-based heat-and-power-combined system for ‘O’ apartment in Seoul, South Korea from the perspectives of primary energy savings, life cycle cost, and life cycle CO2 [130]. Ansong et al. (2017) conducted a techno-economic performance analysis of the hybrid electric power system (i.e., PV system, fuel cell system, and diesel generator) for an off-grid mine company using the HOMER software program to select the optimal energy system. As a result, it was shown that the optimal electric power system could produce 152.99 GWh electricity over a year when composed of 50 MW of PV system, 15 MW of fuel cell system, and 20 MW of diesel generator [135].
- (2)
- ESS: RE is heavily affected by electricity generation based on the outdoor environment conditions (e.g., solar radiation, wind strength, etc.). To solve this problem, various studies are being conducted on the ESS as a back-up system that can store the electricity generated from the RE. In this study, the previous studies related to ESS are classified into those on the thermal ESS and those on the electrical ESS depending on the type of stored energy (refer to Table 12) [136,137,138,139,140,141,142]. First, the previous studies conducted in terms of thermal ESS are as follows [136,137,138,139]. Alimohammadisagvand et al. (2016) aimed to find a cost-optimal solution for thermal ESS integrated with the geothermal system for a residential building in a cold climate based on the concept of demand response (DR) (i.e., a momentary DR control based on the real-time hourly electricity price, a backwards-looking DR control based on the previous hourly electricity price, and a predictive DR control based on future hourly electricity price). The analysis result showed that applying the predictive DR control algorithm is most effective in terms of the annual savings in the total delivered energy and cost [136]. Al Zahrani and Dincer (2016) conducted a performance evaluation of the aquifer thermal ESS considering the charging temperature, storing time, temperature during storing, discharging temperature, etc. To this end, this study analyzed focusing on the energy and exergy during the heating and cooling period using the Engineering Equation Solver software program [137]. Second, the previous studies that were conducted in terms of the electrical ESS are as follows [140,141,142]. Vieira et al. (2017) considered the ESS connected with the PV system of a residential building as a system for matching the energy production and consumption in Coimbra, Portugal. The results indicated that the ESS connected with the PV system can reduce the energy sent to and consumed from grid by 76 and 78.3%, respectively, as well as the energy bill by 87.2% [142].
- (3)
- Discussion: In this study, studies regarding the back-up system were analyzed focusing on the fuel cell system and ESS in terms of effective operation of the RE. First, from the perspective of the fuel cell system, the techno-economic performance analysis was conducted mainly based on simulation tools. Second, from the perspective of the ESS, various studies are underway so as to analyze the technical and economic effects based on DR strategies combined with RE. In terms of the back-up system, especially for ESS-related research, it is considered to be more effective in terms of energy savings because DR strategies are applied so as to analyze the technical performance by considering energy demand and supply. However, there will be limitations in obtaining optimal techno-economic effects because existing studies related to this are based on historical data (e.g., monthly or yearly data) rather than real-time data.
3. Future Directions and Challenges for Realizing nZEB
3.1. Integration and Optimization of the Passive and Active Strategies in the Early Phase of a Building’s Life Cycle
3.1.1. Integration of the Passive and Active Strategies
3.1.2. Optimization of the Passive and Active Strategies for Determining the Optimal Design Solution
- (1)
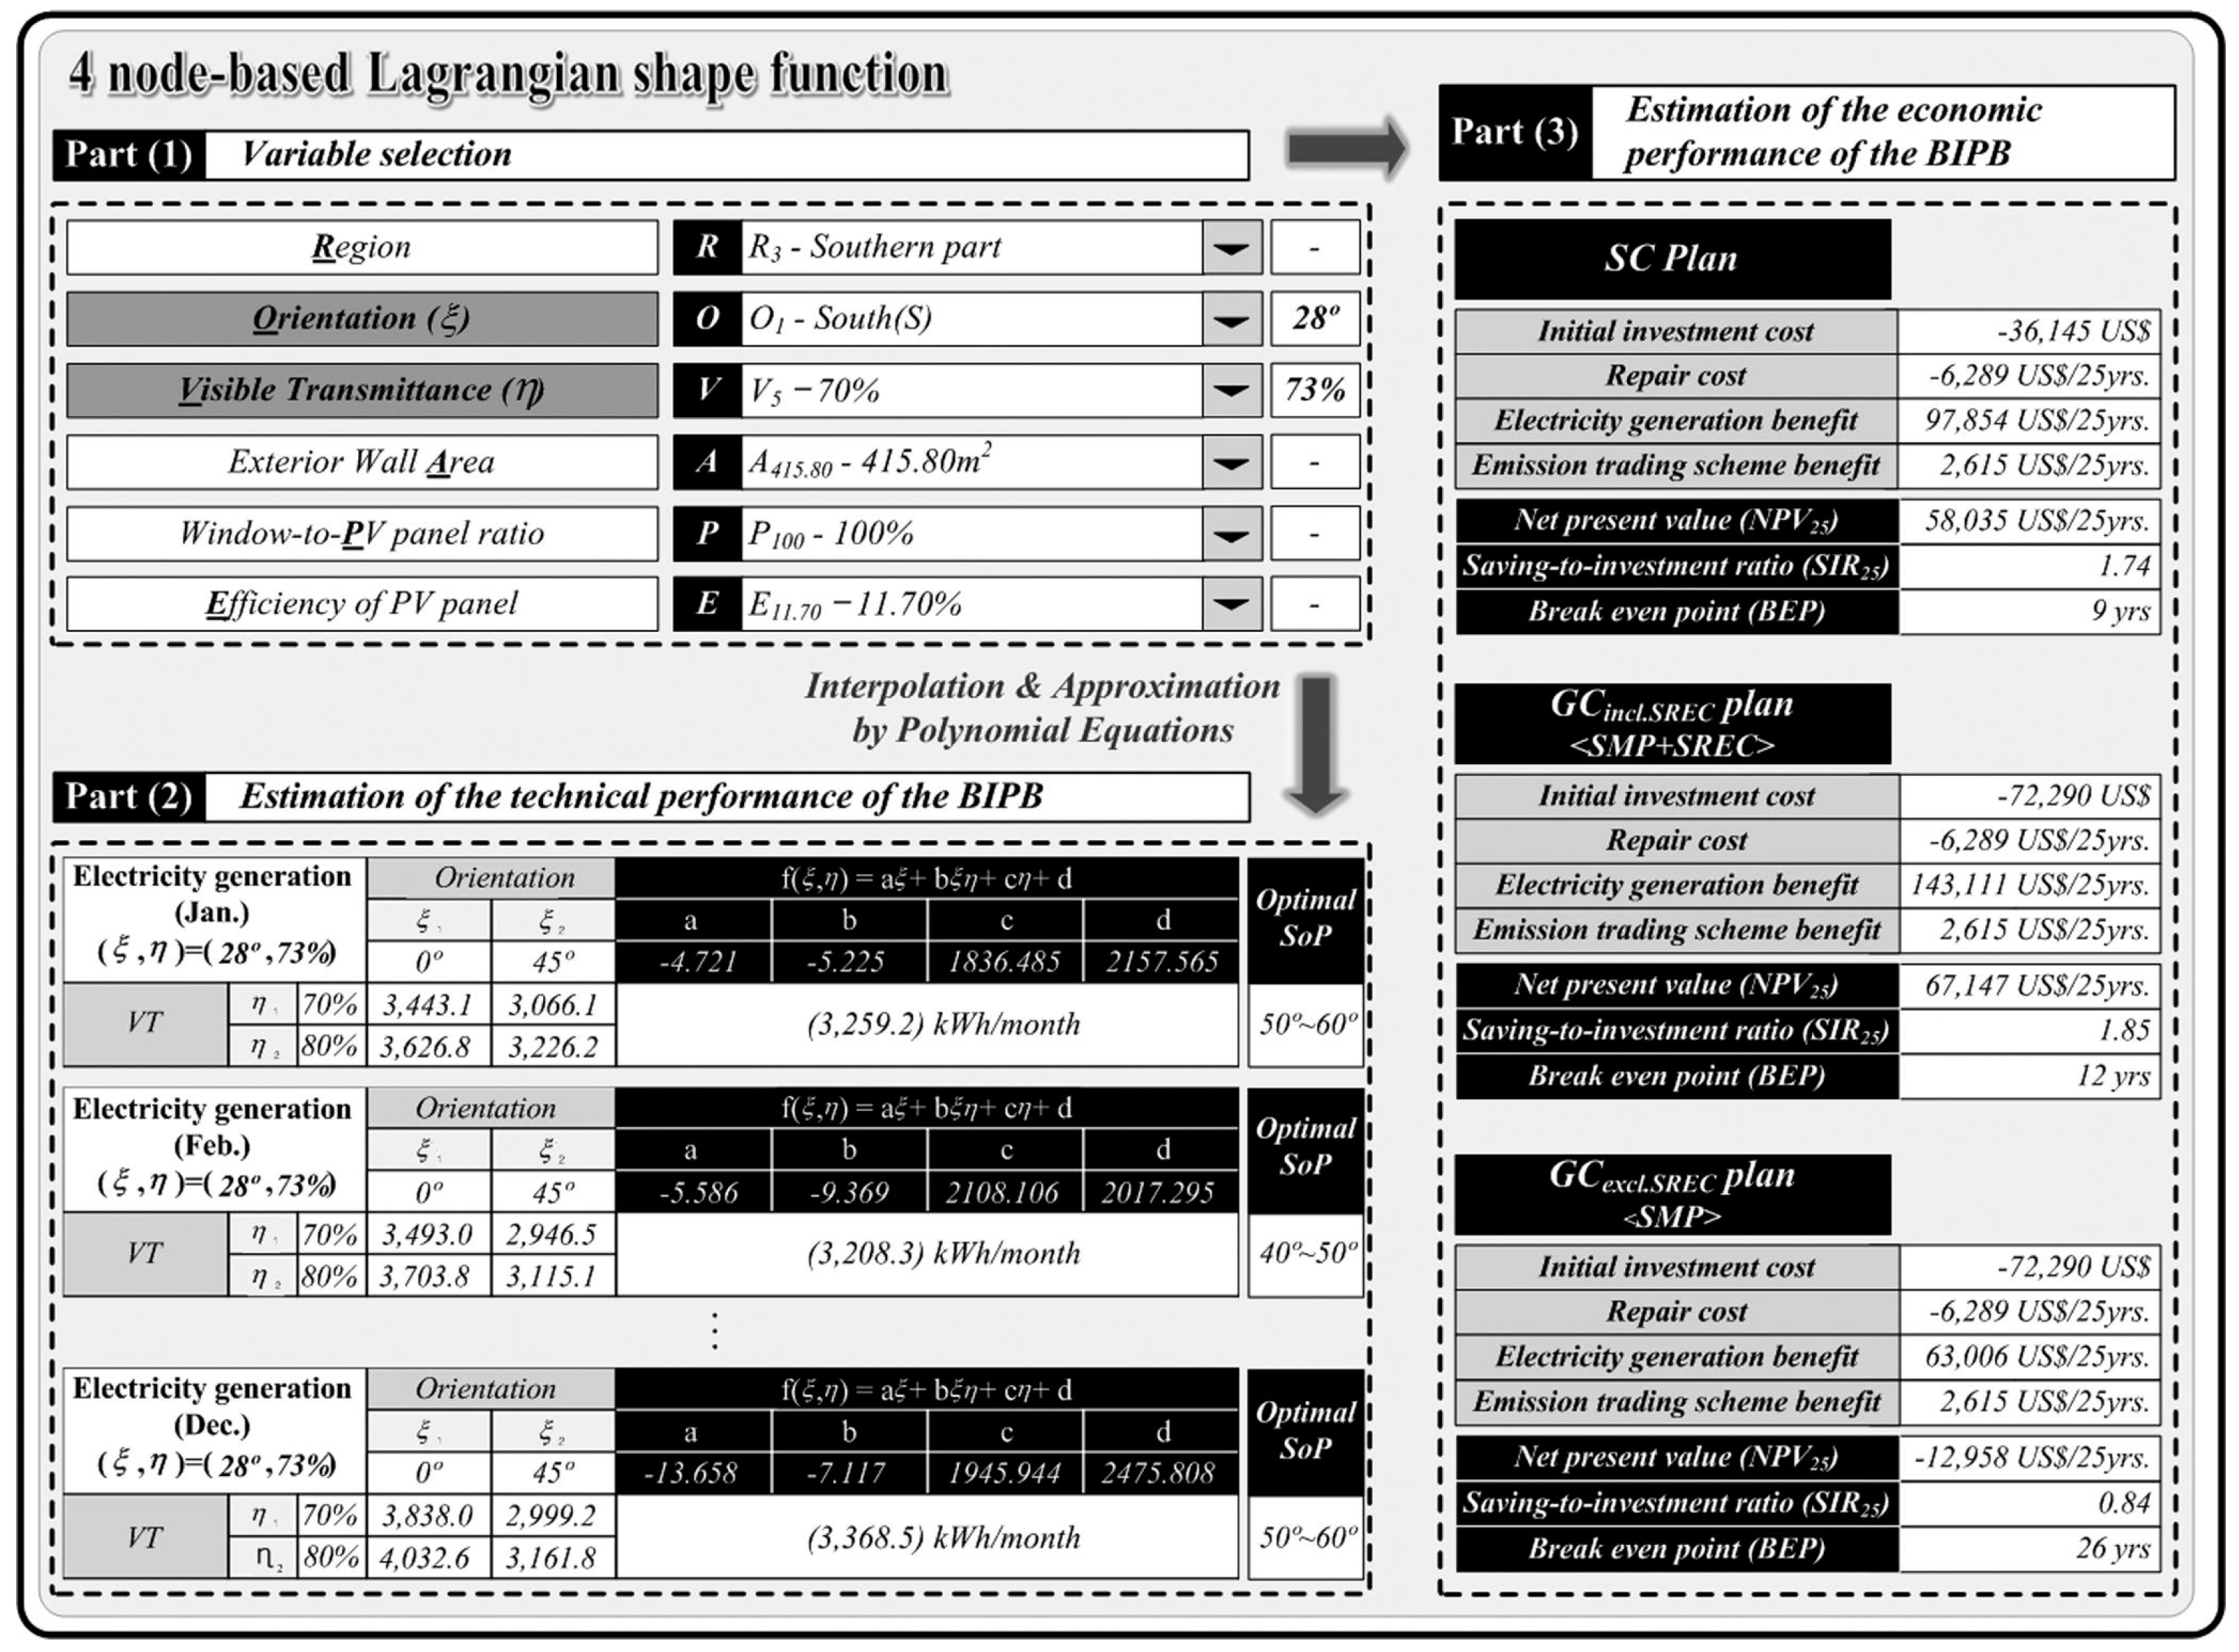
- Step 1—Development of an integrated analysis model for estimating the building energy demand and supply: Those who want to implement nZEB (e.g., CMr and designer) should be able to easily and quickly analyze the building energy demand and supply for the application of the passive and active strategies at the early phase of a building’s life cycle. An examination of the previous studies in this regard revealed that Koo et al. (2014) and Park et al. (2016) developed an estimation model for the building energy demand (i.e., heating and cooling demand) and supply (i.e., the amount of electricity generated from the distributed solar generation system) based on four-node-based Lagrangian shape function that is easy to use during the early design phase (refer to Figure 3, Figure A1 and Figure A2). These studies, however, also have limitations in evaluating the energy performance in terms of nZEB because the energy demand and supply were analyzed separately according to the building envelope design [39,91]. Therefore, developing an integrated-analysis model of energy demand and supply for applying the active and passive strategies’ technology in the early stage of a building’s life cycle remains a top-priority challenge for implementing nZEB as shown in Figure 4.
- (2)
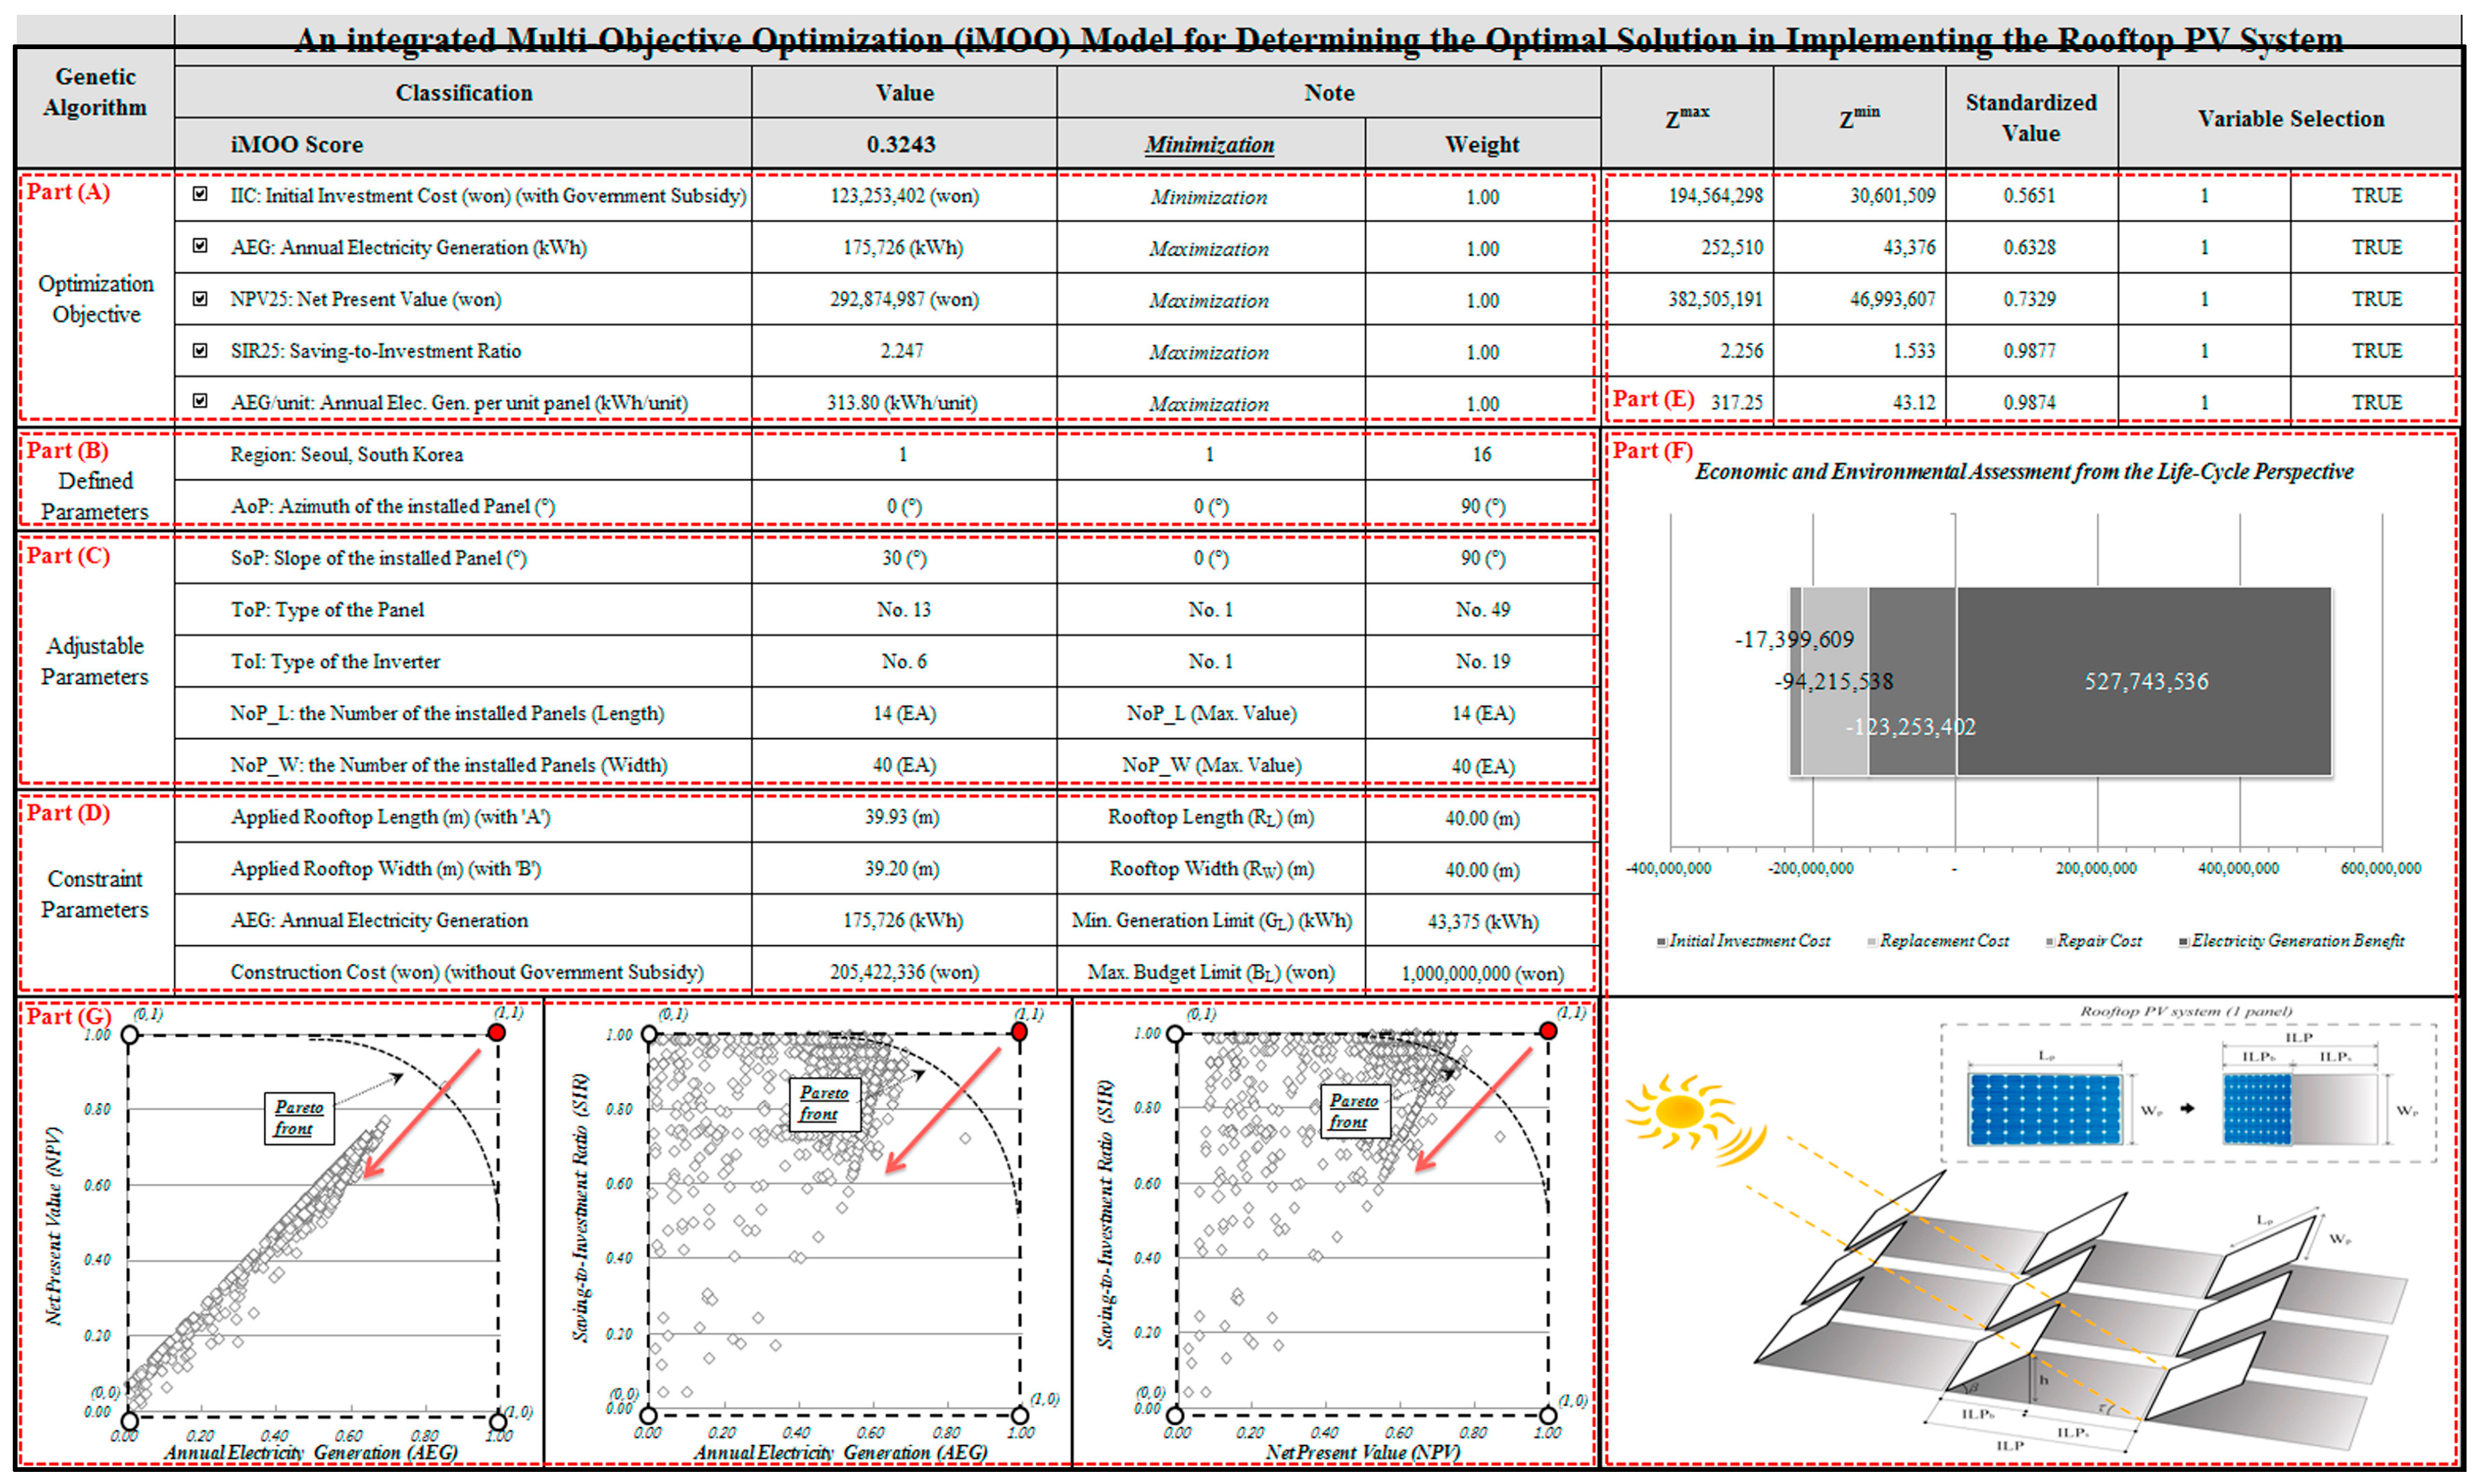
- Step 2—Development of an integrated multi-objective optimization (iMOO) model for determining the optimal design solution for the realization of nZEB: In the early stage of a building’s life cycle, the CMr and designer should take into account not only the building’s energy demand and supply, but also the building’s economic performance (e.g., NPV, SIR, and PP) depending on the design conditions (e.g., WWR, window type, window-to-PV panel ratio, etc.). As these considerations, however, have a trade-off relationship, it is very difficult for the CMr and designer to decide the optimal design plan by incorporating all the considerations at the initial stage of a building’s life cycle [105,153]. Therefore, it is necessary to develop an iMOO model to help in the CMr and designer’s decision-making and can implement a reasonable nZEB. In the previous studies, several methodologies have been developed to address the trade-off relationship between the building energy performance (e.g., energy demand and supply) and the building’s economic performance (e.g., NPV, SIR, and PP). Koo et al. (2015) proposed an iMOO model based on the concept of the Pareto front, which can provide the optimal design solution to the users by solving the trade-off problems between the construction time and cost, according to the following six processes: (i) problem statement; (ii) definition of the optimization objectives; (iii) establishment of the data structure; (iv) standardization of the optimization objective function; (v) definition of the fitness function; and (vi) implementation of the genetic algorithm (refer to Figure 5) [154]. In addition, based on this paper, Koo et al. (2016) and Kim et al. (2016) developed an iMOO model for determining the optimal solution in implementing RE, considering the techno-economic performance (refer to Figure A3) [105,153]. The iMOO model suggested in the aforementioned studies has the advantages of solving the trade-off problems between various optimization objectives (i.e., energy demand or supply, NPV, SIR, and PP) and deriving the optimal solution in a user-friendly design. When deriving the optimal design solution, however, the aforementioned studies had limitations in that they did not consider the building energy demand and supply simultaneously. In other words, from the standpoint of the effective implementation of nZEB, the iMOO model must be achieve in the direction of minimizing the building energy demand (e.g., heating and cooling demand) and optimizing the energy supply (e.g., the amount of electricity generated from PV system) and economic performance (e.g., NPV, SIR, and PP). Therefore, from the viewpoint of the integration of the passive and active strategies to implement nZEB, the development of the iMOO model considering the both energy demand and supply remains a challenge for many researchers (refer to Figure 6).
3.2. Real-Time Monitoring of the Energy Performance during the Usage Phase of a Building’s Life Cycle
3.2.1. Developing an Integrated Real-Time Monitoring System for Building Energy Performance
3.2.2. Analyzing the Energy-Saving Potential through the End-User Behaviors
4. Conclusions
- (1)
- Passive strategies: The passive strategies refer to reducing the building energy demands at the early stage of a building’s life cycle through an architectural design technique. In this study, passive strategies were classified as passive sustainable design and EST. Most studies related to the passive strategies (i.e., passive sustainable design and EST) were analyzed for building energy performance according to design variables via energy simulation tools. Analysis of these studies showed that applying passive strategies to buildings is effective in terms of energy savings, but it is not sufficient in terms of implementing nZEB.
- (2)
- Active strategies: The active strategies mainly represent ways to reduce building energy consumption through energy production. This study conducted an extensive literature review on these active strategies focusing on the RE and back-up system for RE. The studies regarding active strategies (i.e., RE and back-up system for RE) mostly analyzed building energy performance through experiments with energy simulation tools. The analysis of the previous studies showed that RE is still not enough to realize nZEB, and in case of the back-up system, especially ESS, the technical and economic effects may be lower because they complement the RE based on historical data.
- (1)
- Integration and optimization of the passive and active strategies in the early phase of a building’s life cycle: This study proposed integration and optimization of the passive and active strategies as the advanced strategies for implementing nZEB in order to overcome the limitations of previous studies by the following two perspectives: (i) there are very few studies evaluating buildings technical and economic performance by applying both passive and active strategies; (ii) the technical effects (e.g., energy savings) that occur through sequential application of passive and active strategies are far superior.
- (2)
- Real-time monitoring of the energy performance during the usage phase of a building’s life cycle: This study presented the following two aspects of real-time monitoring of the energy performance as advanced strategies so as to realize nZEB by considering the limitations of existing studies and diversification of buildings: (i) developing an integrated real-time monitoring system for buildings’ energy performance; and (ii) analyzing the energy-saving potential through the end-user behaviors.
Acknowledgments
Author Contributions
Conflicts of Interest
Abbreviations
| a-Si | Amorphous silicon |
| BIPB | Building-integrated photovoltaic blind system |
| BIPV | Building-integrated photovoltaic system |
| CFD | Computational fluid dynamics |
| CMr | Construction manager |
| DR | Demand response |
| ESS | Energy storage system |
| EST | Energy-saving techniques |
| GHG | Greenhouse gas |
| i-MOO model | Integrated multi-objective optimization model |
| LED | Lighting emitting diode |
| NPV | Net present value |
| nZEB | Net-zero energy building |
| PCM | Phase change material |
| PP | Payback period |
| PV | Photovoltaic |
| RE | Renewable energy |
| SIR | Saving-to-investment ratio |
| WWR | Window-to-wall ratio |
Appendix A


References
- Climate|National Oceanic and Atmospheric Administration. Available online: http://www.noaa.gov/climate (accessed on 16 October 2017).
- National Aeronautics and Space Administration (NASA). The Consequences of Climate Change. Available online: https://climate.nasa.gov/effects/ (accessed on 7 December 2017).
- Korea Meteorological Administration (KMA). Ground Observation Data. Available online: http://www.kma.go.kr/weather/observation/currentweather.jsp (accessed on 7 December 2017).
- Ministry of Environment (ME). Guide for 2016 Paris Agreement; Ministry of Environment: Incheon, Korea, 2016.
- The 1st Basic Plan for Response to Climate Change. Available online: http://www.mosf.go.kr/nw/nes/detailNesDtaView.do?menuNo=4010100&searchNttId1=MOSF_000000000006696&searchBbsId1=MOSFBBS_000000000028 (accessed on 16 October 2017).
- Ministry of Land, Infrastructure and Transport (MOLIT). Implementation of the Zero Energy Building. Available online: http://www.molit.go.kr/USR/WPGE0201/m_36421/DTL.jsp (accessed on 16 October 2017).
- Korea Energy Agency (KEA). New and Renewable Energy Center. Available online: http://www.knrec.or.kr/knrec/index.asp (accessed on 22 October 2017).
- De Castro, M.; Gadi, M.B. Effect of slope angle on energy performance of ground-integrated buildings on slope terrain. Int. J. Sustain. Dev. Plan. 2017, 12, 283–293. [Google Scholar] [CrossRef]
- Tuhus-Dubrow, D.; Krarti, M. Genetic-algorithm based approach to optimize building envelope design for residential buildings. Build. Environ. 2010, 45, 1574–1581. [Google Scholar] [CrossRef]
- Choi, I.Y.; Cho, S.H.; Kim, J.T. Energy consumption characteristics of high-rise apartment buildings according to building shape and mixed-use development. Energy Build. 2012, 46, 123–131. [Google Scholar] [CrossRef]
- Asadi, S.; Amiri, S.S.; Mottahedi, M. On the development of multi-linear regression analysis to assess energy consumption in the early stages of building design. Energy Build. 2014, 85, 246–255. [Google Scholar] [CrossRef]
- Parasonis, J.; Keizikas, A.; Endriukaitytė, A.; Kalibatienė, D. Architectural Solutions to Increase the Energy Efficiency of Buildings. J. Civ. Eng. Manag. 2012, 18, 71–80. [Google Scholar] [CrossRef]
- Parasonis, J.; Keizikas, A.; Kalibatiene, D. The relationship between the shape of a building and its energy performance. Archit. Eng. Des. Manag. 2012, 8, 246–256. [Google Scholar] [CrossRef]
- Hemsath, T.L.; Alagheband Bandhosseini, K. Sensitivity analysis evaluating basic building geometry’s effect on energy use. Renew. Energy 2015, 76, 526–538. [Google Scholar] [CrossRef]
- Mottahedi, M.; Mohammadpour, A.; Amiri, S.S.; Riley, D.; Asadi, S. Multi-linear Regression Models to Predict the Annual Energy Consumption of an Office Building with Different Shapes. Procedia Eng. 2015, 118, 622–629. [Google Scholar] [CrossRef]
- Fallahtafti, R.; Mahdavinejad, M. Optimisation of building shape and orientation for better energy efficient architecture. Int. J. Energy Sect. Manag. 2015, 9, 593–618. [Google Scholar] [CrossRef]
- Abanda, F.H.; Byers, L. An investigation of the impact of building orientation on energy consumption in a domestic building using emerging BIM (Building Information Modelling). Energy 2016, 97, 517–527. [Google Scholar] [CrossRef]
- Brandão de Vasconcelos, A.; Cabaço, A.; Pinheiro, M.D.; Manso, A. The impact of building orientation and discount rates on a Portuguese reference building refurbishment decision. Energy Policy 2016, 91, 329–340. [Google Scholar] [CrossRef]
- Hemsath, T.L. Housing orientation’s effect on energy use in suburban developments. Energy Build. 2016, 122, 98–106. [Google Scholar] [CrossRef]
- Valladares-Rendóna, L.G.; Schmid, G.; Lo, S.L. Review on energy savings by solar control techniques and optimal building orientation for the strategic placement of façade shading systems. Energy Build. 2017, 140, 458–479. [Google Scholar] [CrossRef]
- Assadi, M.K.; Dalir, F.; Hamidib, A.A. Analytical model of atrium for heating and ventilating an institutional building naturally. Energy Build. 2011, 43, 2595–2601. [Google Scholar] [CrossRef]
- Aldawoud, A. The influence of the atrium geometry on the building energy performance. Energy Build. 2013, 57, 1–5. [Google Scholar] [CrossRef]
- Chow, S.K.H.; Li, D.H.W.; Lee, E.W.M.; Lam, J.C. Analysis and prediction of daylighting and energy performance in atrium spaces using daylight-linked lighting controls. Appl. Energy 2013, 112, 1016–1024. [Google Scholar] [CrossRef]
- Taleghani, M.; Tenpierik, M.; van den Dobbelsteen, A. Energy performance and thermal comfort of courtyard/atrium dwellings in The Netherlands in the light of climate change. Renew. Energy 2014, 63, 486–497. [Google Scholar] [CrossRef]
- Nasrollahi, N.; Abdolahzadeh, S.; Litkohi, S. Appropriate Geometrical Ratio Modeling of Atrium for Energy Efficiency in Office Buildings. J. Build. Perform. 2015, 6, 95–104. [Google Scholar]
- Mohsenin, M.; Hu, J. Assessing daylight performance in atrium buildings by using Climate Based Daylight Modeling. Sol. Energy 2015, 119, 553–560. [Google Scholar] [CrossRef]
- Danielski, I.; Nair, G.; Joelsson, A.; Fröling, M. Heated atrium in multi-storey apartment buildings, a design with potential to enhance energy efficiency and to facilitate social interactions. Build. Environ. 2016, 106, 352–364. [Google Scholar] [CrossRef]
- Modirrousta, S.; Boostani, H. Analysis of Atrium Pattern, Trombe Wall and Solar Greenhouse on Energy Efficiency. Procedia Eng. 2016, 145, 1549–1556. [Google Scholar] [CrossRef]
- Hussain, S.; Oosthuizen, P.H. Numerical investigations of buoyancy-driven natural ventilation in a simple atrium building and its effect on the thermal comfort conditions. Appl. Therm. Eng. 2012, 40, 358–372. [Google Scholar] [CrossRef]
- Acred, A.; Hunt, G.R. Stack ventilation in multi-storey atrium buildings: A dimensionless design approach. Build. Environ. 2014, 72, 44–52. [Google Scholar] [CrossRef]
- Li, Y.; Liu, S. Experimental study on thermal performance of a solar chimney combined with PCM. Appl. Energy 2014, 114, 172–178. [Google Scholar] [CrossRef]
- Jing, H.; Chen, Z.; Li, A. Experimental study of the prediction of the ventilation flow rate through solar chimney with large gap-to-height ratios. Build. Environ. 2015, 89, 150–159. [Google Scholar] [CrossRef]
- He, Y.; Liu, M.; Kvan, T.; Peng, S. An enthalpy-based energy savings estimation method targeting thermal comfort level in naturally ventilated buildings in hot-humid summer zones. Appl. Energy 2017, 187, 717–731. [Google Scholar] [CrossRef]
- Tong, Z.; Chen, Y.; Malkawi, A. Estimating natural ventilation potential for high-rise buildings considering boundary layer meteorology. Appl. Energy 2017, 193, 276–286. [Google Scholar] [CrossRef]
- Afshin, M.; Sohankar, A.; Manshadi, M.D.; Esfeh, M.K. An experimental study on the evaluation of natural ventilation performance of a two-sided wind-catcher for various wind angles. Renew. Energy 2016, 85, 1068–1078. [Google Scholar] [CrossRef]
- Nejat, P.; Calautit, J.K.; Majid, M.Z.A.; Hughes, B.R.; Jomehzadeh, F. Anti-short-circuit device: A new solution for short-circuiting in windcatcher and improvement of natural ventilation performance. Build. Environ. 2016, 105, 24–39. [Google Scholar] [CrossRef]
- Nejat, P.; Calautit, J.K.; Majid, M.Z.A.; Hughes, B.R.; Zeynali, I.; Jomehzadeh, F. Evaluation of a two-sided windcatcher integrated with wing wall (as a new design) and comparison with a conventional windcatcher. Energy Build. 2016, 126, 287–300. [Google Scholar] [CrossRef]
- Mei, S.J.; Hu, J.T.; Liu, D.; Zhao, F.Y.; Li, Y.; Wang, Y.; Wang, H.Q. Wind driven natural ventilation in the idealized building block arrays with multiple urban morphologies and unique package building density. Energy Build. 2017, 155, 324–338. [Google Scholar] [CrossRef]
- Koo, C.; Park, S.; Hong, T.; Park, H.S. An estimation model for the heating and cooling demand of a residential building with a different envelope design using the finite element method. Appl. Energy 2014, 115, 205–215. [Google Scholar] [CrossRef]
- Daouas, N. A study on optimum insulation thickness in walls and energy savings in Tunisian buildings based on analytical calculation of cooling and heating transmission loads. Appl. Energy 2011, 88, 156–164. [Google Scholar] [CrossRef]
- Ottelé, M.; Perini, K.; Fraaij, A.L.A.; Haas, E.M.; Raiteri, R. Comparative life cycle analysis for green façades and living wall systems. Energy Build. 2011, 43, 3419–3429. [Google Scholar] [CrossRef]
- Sanjuan, C.; Suárez, M.J.; González, M.; Pistono, J.; Blanco, E. Energy performance of an open-joint ventilated façade compared with a conventional sealed cavity façade. Sol. Energy 2011, 85, 1851–1863. [Google Scholar] [CrossRef]
- Hong, T.; Kim, J.; Lee, J.; Koo, C.; Park, H.S. Assessment of seasonal energy efficiency strategies of a double skin façade in a monsoon climate region. Energies 2013, 6, 4352–4376. [Google Scholar] [CrossRef]
- Pomponi, F.; Piroozfar, P.A.E.; Southall, R.; Ashton, P.; Pirozfar, P.; Farr, E.R.P. Life cycle energy and carbon assessment of double skin façades for office refurbishments. Energy Build. 2015, 109, 143–156. [Google Scholar] [CrossRef]
- Tam, V.W.Y.; Wang, J.; Le, K.N. Thermal insulation and cost effectiveness of green-roof systems: An empirical study in Hong Kong. Build. Environ. 2016, 110, 46–54. [Google Scholar] [CrossRef]
- Su, X.; Zhang, X. Environmental performance optimization of window-wall ratio for different window type in hot summer and cold winter zone in China based on life cycle assessment. Energy Build. 2010, 42, 198–202. [Google Scholar] [CrossRef]
- Ma, P.; Wang, L.S.; Guo, N. Maximum window-to-wall ratio of a thermally autonomous building as a function of envelope U-value and ambient temperature amplitude. Appl. Energy 2015, 146, 84–91. [Google Scholar] [CrossRef]
- Seo, D.-Y.; Koo, C.; Hong, T. A Lagrangian finite element model for estimating the heating and cooling demand of a residential building with a different envelope design. Appl. Energy 2015, 142, 66–79. [Google Scholar] [CrossRef]
- Goia, F. Search for the optimal window-to-wall ratio in office buildings in different European climates and the implications on total energy saving potential. Sol. Energy 2016, 132, 467–492. [Google Scholar] [CrossRef]
- Wen, L.; Hiyama, K.; Koganei, M. A method for creating maps of recommended window-to-wall ratios to assign appropriate default values in design performance modeling: A case study of a typical office building in Japan. Energy Build. 2017, 145, 304–317. [Google Scholar] [CrossRef]
- Zenginis, D.G.; Kontoleon, K.J. Influence of orientation, glazing proportion and zone aspect ratio on the thermal performance of buildings during the winter period. Environ. Sci. Pollut. Res. Int. 2017. [Google Scholar] [CrossRef] [PubMed]
- Kim, G.; Lim, H.S.; Lim, T.S.; Schaefer, L.; Kim, J.T. Comparative advantage of an exterior shading device in thermal performance for residential buildings. Energy Build. 2012, 46, 105–111. [Google Scholar] [CrossRef]
- Cheng, C.L.; Liao, L.M.; Chou, C.P. A study of summarized correlation with shading performance for horizontal shading devices in Taiwan. Sol. Energy 2013, 90, 1–16. [Google Scholar] [CrossRef]
- Lin, Y.H.; Tsai, K.T.; Lin, M.D.; Yang, M.D. Design optimization of office building envelope configurations for energy conservation. Appl. Energy 2016, 171, 336–346. [Google Scholar] [CrossRef]
- Ye, Y.; Xu, P.; Mao, J.; Ji, Y. Experimental study on the effectiveness of internal shading devices. Energy Build. 2016, 111, 154–163. [Google Scholar] [CrossRef]
- Diaconu, B.M. Thermal energy savings in buildings with PCM-enhanced envelope: Influence of occupancy pattern and ventilation. Energy Build. 2011, 43, 101–107. [Google Scholar] [CrossRef]
- Weinlaeder, H.; Koerner, W.; Heidenfelder, M. Monitoring results of an interior sun protection system with integrated latent heat storage. Energy Build. 2011, 43, 2468–2475. [Google Scholar] [CrossRef]
- Ma, P.; Wang, L.S. Effective heat capacity of interior planar thermal mass (iPTM) subject to periodic heating and cooling. Energy Build. 2012, 47, 44–52. [Google Scholar] [CrossRef]
- Silva, T.; Vicente, R.; Rodrigues, F.; Samagaio, A.; Cardoso, C. Development of a window shutter with phase change materials: Full scale outdoor experimental approach. Energy Build. 2015, 88, 110–121. [Google Scholar] [CrossRef]
- Turner, W.J.N.; Walker, I.S.; Roux, J. Peak load reductions: Electric load shifting with mechanical pre-cooling of residential buildings with low thermal mass. Energy 2015, 82, 1057–1067. [Google Scholar] [CrossRef]
- Chernousov, A.A.; Chan, B.Y.B. Numerical simulation of thermal mass enhanced envelopes for office buildings in subtropical climate zones. Energy Build. 2016, 118, 214–225. [Google Scholar] [CrossRef]
- Stazi, F.; Mastrucci, A.; Munafò, P. Life cycle assessment approach for the optimization of sustainable building envelopes: An application on solar wall systems. Build. Environ. 2012, 58, 278–288. [Google Scholar] [CrossRef]
- Abbassi, F.; Dimassi, N.; Dehmani, L. Energetic study of a Trombe wall system under different Tunisian building configurations. Energy Build. 2014, 80, 302–308. [Google Scholar] [CrossRef]
- Bojić, M.; Johannes, K.; Kuznik, F. Optimizing energy and environmental performance of passive Trombe wall. Energy Build. 2014, 70, 279–286. [Google Scholar] [CrossRef]
- Briga-Sá, A.; Martins, A.; Boaventura-Cunha, J.; Lanzinha, J.C.; Paiva, A. Energy performance of Trombe walls: Adaptation of ISO 13790:2008(E) to the Portuguese reality. Energy Build. 2014, 74, 111–119. [Google Scholar] [CrossRef]
- Bajc, T.; Todorović, M.N.; Svorcan, J. CFD analyses for passive house with Trombe wall and impact to energy demand. Energy Build. 2015, 98, 39–44. [Google Scholar] [CrossRef]
- Byun, J.; Hong, I.; Lee, B.; Park, S. Intelligent household LED lighting system considering energy efficiency and user satisfaction. IEEE Trans. Consum. Electron. 2013, 59, 70–76. [Google Scholar] [CrossRef]
- Principi, P.; Fioretti, R. A comparative life cycle assessment of luminaires for general lighting for the office—Compact fluorescent (CFL) vs. Light Emitting Diode (LED)—A case study. J. Clean. Prod. 2014, 83, 96–107. [Google Scholar] [CrossRef]
- Xue, P.; Mak, C.M.; Cheung, H.D. New static lightshelf system design of clerestory windows for Hong Kong. Build. Environ. 2014, 72, 368–376. [Google Scholar] [CrossRef]
- Berardi, U.; Anaraki, H.K. Analysis of the impacts of light shelves on the useful daylight illuminance in office buildings in Toronto. Energy Procedia 2015, 78, 1793–1798. [Google Scholar] [CrossRef]
- Nagy, Z.; Yong, F.Y.; Frei, M.; Schlueter, A. Occupant centered lighting control for comfort and energy efficient building operation. Energy Build. 2015, 94, 100–108. [Google Scholar] [CrossRef]
- Meresi, A. Evaluating daylight performance of light shelves combined with external blinds in south-facing classrooms in Athens, Greece. Energy Build. 2016, 116, 190–205. [Google Scholar] [CrossRef]
- Caicedo, D.; Li, S.; Pandharipande, A. Smart lighting control with workspace and ceiling sensors. Light. Res. Technol. 2016, 49, 446–460. [Google Scholar] [CrossRef]
- Lee, H.; Kim, K.; Seo, J.; Kim, Y. Effectiveness of a perforated light shelf for energy saving. Energy Build. 2017, 144, 144–151. [Google Scholar] [CrossRef]
- Ordóñez, J.; Jadraque, E.; Alegre, J.; Martínez, G. Analysis of the photovoltaic solar energy capacity of residential rooftops in Andalusia (Spain). Renew. Sustain. Energy Rev. 2010, 14, 2122–2130. [Google Scholar] [CrossRef]
- Hong, T.; Koo, C.; Park, J.; Park, H.S. A GIS (geographic information system)-based optimization model for estimating the electricity generation of the rooftop PV (photovoltaic) system. Energy 2014, 65, 190–199. [Google Scholar] [CrossRef]
- Koo, C.; Hong, T.; Park, H.S.; Yun, G. Framework for the analysis of the potential of the rooftop photovoltaic system to achieve the net-zero energy solar buildings. Prog. Photovolt. Res. Appl. 2014, 22, 462–478. [Google Scholar] [CrossRef]
- Jeong, K.; Hong, T.; Ban, C.; Koo, C.; Park, H.S. Life cycle economic and environmental assessment for establishing the optimal implementation strategy of rooftop photovoltaic system in military facility. J. Clean. Prod. 2015, 104, 315–327. [Google Scholar] [CrossRef]
- Park, H.S.; Jeong, K.; Hong, T.; Ban, C.; Koo, C.; Kim, J. The optimal photovoltaic system implementation strategy to achieve the national carbon emissions reduction target in 2030: Focused on educational facilities. Energy Build. 2016, 119, 101–110. [Google Scholar] [CrossRef]
- Ban, C.; Hong, T.; Jeong, K.; Koo, C.; Jeong, J. A simplified estimation model for determining the optimal rooftop photovoltaic system for gable roofs. Energy Build. 2017, 151, 320–331. [Google Scholar] [CrossRef]
- Elibol, E.; Özmen, Ö.T.; Tutkun, N.; Köysal, O. Outdoor performance analysis of different PV panel types. Renew. Sustain. Energy Rev. 2017, 67, 651–661. [Google Scholar] [CrossRef]
- Hong, T.; Lee, M.; Koo, C.; Jeong, K.; Kim, J. Development of a method for estimating the rooftop solar photovoltaic (PV) potential by analyzing the available rooftop area using Hillshade analysis. Appl. Energy 2017, 194, 320–332. [Google Scholar] [CrossRef]
- Lu, L.; Yang, H.X. Environmental payback time analysis of a roof-mounted building-integrated photovoltaic (BIPV) system in Hong Kong. Appl. Energy 2010, 87, 3625–3631. [Google Scholar] [CrossRef]
- Radhi, H. Energy analysis of façade-integrated photovoltaic systems applied to UAE commercial buildings. Sol. Energy 2010, 84, 2009–2021. [Google Scholar] [CrossRef]
- Hong, W.H.; Kim, J.Y.; Lee, C.M.; Jeon, G.Y. Energy Consumption and the Power Saving Potential of a University in Korea: Using a Field Survey. J. Asian Archit. Build. Eng. 2011, 10, 445–452. [Google Scholar] [CrossRef]
- Hammond, G.P.; Harajli, H.A.; Jones, C.I.; Winnett, A.B. Whole systems appraisal of a UK Building Integrated Photovoltaic (BIPV) system: Energy, environmental, and economic evaluations. Energy Policy 2012, 40, 219–230. [Google Scholar] [CrossRef]
- Hwang, T.; Kang, S.; Kim, J.T. Optimization of the building integrated photovoltaic system in office buildings—Focus on the orientation, inclined angle and installed area. Energy Build. 2012, 46, 92–104. [Google Scholar] [CrossRef]
- Chae, Y.T.; Kim, J.; Park, H.; Shin, B. Building energy performance evaluation of building integrated photovoltaic (BIPV) window with semi-transparent solar cells. Appl. Energy 2014, 129, 217–227. [Google Scholar] [CrossRef]
- Lee, J.B.; Park, J.W.; Yoon, J.H.; Baek, N.C.; Kim, D.K.; Shin, U.C. An empirical study of performance characteristics of BIPV (Building Integrated Photovoltaic) system for the realization of zero energy building. Energy 2014, 66, 25–34. [Google Scholar] [CrossRef]
- Olivieri, L.; Caamaño-Martín, E.; Moralejo-Vázquez, F.J.; Martín-Chivelet, N.; Olivieri, F.; Neila-Gonzalez, F.J. Energy saving potential of semi-transparent photovoltaic elements for building integration. Energy 2014, 76, 572–583. [Google Scholar] [CrossRef]
- Park, H.S.; Koo, C.; Hong, T.; Oh, J.; Jeong, K. A finite element model for estimating the techno-economic performance of the building-integrated photovoltaic blind. Appl. Energy 2016, 179, 211–227. [Google Scholar] [CrossRef]
- Peng, J.; Curcija, D.C.; Lu, L.; Selkowitz, S.E.; Yang, H.; Zhang, W. Numerical investigation of the energy saving potential of a semi-transparent photovoltaic double-skin facade in a cool-summer Mediterranean climate. Appl. Energy 2016, 165, 345–356. [Google Scholar] [CrossRef]
- Hong, T.; Koo, C.; Oh, J.; Jeong, K. Nonlinearity analysis of the shading effect on the technical-economic performance of the building-integrated photovoltaic blind. Appl. Energy 2017, 194, 467–480. [Google Scholar] [CrossRef]
- Koo, C.; Hong, T.; Jeong, K.; Ban, C.; Oh, J. Development of the smart photovoltaic system blind and its impact on net-zero energy solar buildings using technical-economic-political analyses. Energy 2017, 124, 382–396. [Google Scholar] [CrossRef]
- Oh, J.; Koo, C.; Hong, T.; Jeong, K.; Lee, M. An economic impact analysis of residential progressive electricity tariffs in implementing the building-integrated photovoltaic blind using an advanced finite element model. Appl. Energy 2017, 202, 259–274. [Google Scholar] [CrossRef]
- Anderson, T.N.; Duke, M.; Carson, J.K. The effect of colour on the thermal performance of building integrated solar collectors. Sol. Energy Mater. Sol. Cells 2010, 94, 350–354. [Google Scholar] [CrossRef] [Green Version]
- Mammoli, A.; Vorobieff, P.; Barsun, H.; Burnett, R.; Fisher, D. Energetic, economic and environmental performance of a solar-thermal-assisted HVAC system. Energy Build. 2010, 42, 1524–1535. [Google Scholar] [CrossRef]
- Ampatzi, E.; Knight, I. Modelling the effect of realistic domestic energy demand profiles and internal gains on the predicted performance of solar thermal systems. Energy Build. 2012, 55, 285–298. [Google Scholar] [CrossRef]
- Bornatico, R.; Pfeiffer, M.; Witzig, A.; Guzzella, L. Optimal sizing of a solar thermal building installation using particle swarm optimization. Energy 2012, 41, 31–37. [Google Scholar] [CrossRef]
- Fong, J.; Alwan, Z. Modelling to predict future energy performance of solar thermal cooling systems for building applications in the North East of England. Appl. Therm. Eng. 2013, 57, 81–89. [Google Scholar] [CrossRef]
- Motte, F.; Notton, G.; Cristofari, C.; Canaletti, J.L. Design and modelling of a new patented thermal solar collector with high building integration. Appl. Energy 2013, 102, 631–639. [Google Scholar] [CrossRef]
- Lamnatou, C.; Notton, G.; Chemisana, D.; Cristofari, C. Life cycle analysis of a building-integrated solar thermal collector, based on embodied energy and embodied carbon methodologies. Energy Build. 2014, 84, 378–387. [Google Scholar] [CrossRef]
- Li, H.; Sun, L.; Zhang, Y. Performance investigation of a combined solar thermal heat pump heating system. Appl. Therm. Eng. 2014, 71, 460–468. [Google Scholar] [CrossRef]
- Maurer, C.; Cappel, C.; Kuhn, T.E. Simple models for building-integrated solar thermal systems. Energy Build. 2015, 103, 118–123. [Google Scholar] [CrossRef]
- Kim, J.; Hong, T.; Jeong, J.; Lee, M.; Koo, C.; Lee, M.; Ji, C.; Jeong, J. An integrated multi-objective optimization model for determining the optimal solution in the solar thermal energy system. Energy 2016, 102, 416–426. [Google Scholar] [CrossRef]
- Araya, R.; Bustos, F.; Contreras, J.; Fuentes, A. Life-cycle savings for a flat-plate solar water collector plant in Chile. Renew. Energy 2017, 112, 365–377. [Google Scholar] [CrossRef]
- Chialastri, A.; Isaacson, M. Performance and optimization of a BIPV/T solar air collector for building fenestration applications. Energy Build. 2017, 150, 200–210. [Google Scholar] [CrossRef]
- Wood, C.J.; Liu, H.; Riffat, S.B. An investigation of the heat pump performance and ground temperature of a piled foundation heat exchanger system for a residential building. Energy 2010, 35, 4932–4940. [Google Scholar] [CrossRef]
- Desideri, U.; Sorbi, N.; Arcioni, L.; Leonardi, D. Feasibility study and numerical simulation of a ground source heat pump plant, applied to a residential building. Appl. Therm. Eng. 2011, 31, 3500–3511. [Google Scholar] [CrossRef]
- Kim, E.; Lee, J.; Jeong, Y.; Hwang, Y.; Lee, S.; Park, N. Performance evaluation under the actual operating condition of a vertical ground source heat pump system in a school building. Energy Build. 2012, 50, 1–6. [Google Scholar] [CrossRef]
- Sivasakthivel, T.; Murugesan, K.; Sahoo, P.K. Potential Reduction in CO2 Emission and Saving in Electricity by Ground Source Heat Pump System for Space Heating Applications—A Study on Northern Part of India. Procedia Eng. 2012, 38, 970–979. [Google Scholar] [CrossRef]
- Kang, E.C.; Riederer, P.; Yeon, S.; Joon, E. New approach to evaluate the seasonal performance of building integrated geothermal heat pump system. Renew. Energy 2013, 54, 51–54. [Google Scholar] [CrossRef]
- Self, S.J.; Reddy, B.V.; Rosen, M.A. Geothermal heat pump systems: Status review and comparison with other heating options. Appl. Energy 2013, 101, 341–348. [Google Scholar] [CrossRef]
- Morrone, B.; Coppola, G.; Raucci, V. Energy and economic savings using geothermal heat pumps in different climates. Energy Convers. Manag. 2014, 88, 189–198. [Google Scholar] [CrossRef]
- Kim, J.; Hong, T.; Chae, M.; Koo, C.; Jeong, J. An environmental and economic assessment for selecting the optimal ground heat exchanger by considering the entering water temperature. Energies 2015, 8, 7752–7776. [Google Scholar] [CrossRef]
- Kharseh, M.; Al-khawaja, M.; Suleiman, M.T. Geothermics Potential of ground source heat pump systems in cooling-dominated environments: Residential buildings. Geothermics 2015, 57, 104–110. [Google Scholar] [CrossRef]
- Lee, J.U.; Kim, T.; Leigh, S.B. Applications of building-integrated coil-type ground-coupled heat exchangers—Comparison of performances of vertical and horizontal installations. Energy Build. 2015, 93, 99–109. [Google Scholar] [CrossRef]
- Hong, T.; Kim, J.; Chae, M.; Park, J.; Jeong, J.; Lee, M. Sensitivity Analysis on the Impact Factors of the GSHP System Considering Energy Generation and Environmental Impact Using LCA. Sustainability 2016, 8, 376. [Google Scholar] [CrossRef]
- Jeong, K.; Hong, T.; Chae, M.; Kim, J.; Lee, M.; Koo, C.; Ji, C. Development of the hybrid model for estimating the undisturbed ground temperature using the finite element method and geostatistical technique. Energy Build. 2017, 152, 162–174. [Google Scholar] [CrossRef]
- Sharpe, T.; Proven, G. Crossflex: Concept and early development of a true building integrated wind turbine. Energy Build. 2010, 42, 2365–2375. [Google Scholar] [CrossRef]
- Walker, S.L. Building mounted wind turbines and their suitability for the urban scale—A review of methods of estimating urban wind resource. Energy Build. 2011, 43, 1852–1862. [Google Scholar] [CrossRef]
- Ayhan, D.; Saǧlam, A. A technical review of building-mounted wind power systems and a sample simulation model. Renew. Sustain. Energy Rev. 2012, 16, 1040–1049. [Google Scholar] [CrossRef]
- Balduzzi, F.; Bianchini, A.; Carnevale, E.A.; Ferrari, L.; Magnani, S. Feasibility analysis of a Darrieus vertical-axis wind turbine installation in the rooftop of a building. Appl. Energy 2012, 97, 921–929. [Google Scholar] [CrossRef]
- Li, Q.S.; Chen, F.B.; Li, Y.G.; Lee, Y.Y. Implementing wind turbines in a tall building for power generation: A study of wind loads and wind speed amplifications. J. Wind Eng. Ind. Aerodyn. 2013, 116, 70–82. [Google Scholar] [CrossRef]
- Lu, L.; Sun, K. Wind power evaluation and utilization over a reference high-rise building in urban area. Energy Build. 2014, 68, 339–350. [Google Scholar] [CrossRef]
- Park, S.H.; Park, J.H.; Park, J.C.; Lee, E.T. The performance of small wind power generation systems on super high-rise buildings. Int. J. Steel Struct. 2014, 14, 489–499. [Google Scholar] [CrossRef]
- Yang, A.S.; Su, Y.M.; Wen, C.Y.; Juan, Y.H.; Wang, W.S.; Cheng, C.H. Estimation of wind power generation in dense urban area. Appl. Energy 2016, 171, 213–230. [Google Scholar] [CrossRef]
- Cao, J.; Man, X.; Liu, J.; Liu, L.; Shui, T. Preliminary assessment of the wind power resource around the thousand-meter scale megatall building. Energy Build. 2017, 142, 62–71. [Google Scholar] [CrossRef]
- Korea Energy Agency (KEA). New & Renewable Energy—Fuel Cell System. Available online: http://www.knrec.or.kr/knrec/11/KNREC110500.asp (accessed on 22 October 2017).
- Hong, T.; Kim, D.; Koo, C.; Kim, J. Framework for establishing the optimal implementation strategy of a fuel-cell-based combined heat and power system: Focused on multi-family housing complex. Appl. Energy 2014, 127, 11–24. [Google Scholar] [CrossRef]
- Adam, A.; Fraga, E.S.; Brett, D.J.L. Options for residential building services design using fuel cell based micro-CHP and the potential for heat integration. Appl. Energy 2015, 138, 685–694. [Google Scholar] [CrossRef]
- Kim, D.; Kim, J.; Koo, C.; Hong, T. An economic and environmental assessment model for selecting the optimal implementation strategy of fuel cell systems—A Focus on building energy policy. Energies 2014, 7, 5129–5150. [Google Scholar] [CrossRef]
- Sossan, F.; Bindner, H.; Madsen, H.; Torregrossa, D.; Chamorro, L.R.; Paolone, M. A model predictive control strategy for the space heating of a smart building including cogeneration of a fuel cell-electrolyzer system. Int. J. Electr. Power Energy Syst. 2014, 62, 879–889. [Google Scholar] [CrossRef]
- Elmer, T.; Worall, M.; Wu, S.; Riffat, S. Assessment of a novel solid oxide fuel cell tri-generation system for building applications. Energy Convers. Manag. 2016, 124, 29–41. [Google Scholar] [CrossRef]
- Ansong, M.; Mensah, L.D.; Adaramola, M.S. Techno-economic analysis of a hybrid system to power a mine in an off-grid area in Ghana. Sustain. Energy Technol. Assess. 2017, 23, 45–56. [Google Scholar] [CrossRef]
- Alimohammadisagvand, B.; Jokisalo, J.; Kilpeläinen, S.; Ali, M.; Sirén, K. Cost-optimal thermal energy storage system for a residential building with heat pump heating and demand response control. Appl. Energy 2016, 174, 275–287. [Google Scholar] [CrossRef]
- AlZahrani, A.A.; Dincer, I. Performance Assessment of an Aquifer Thermal Energy Storage System for Heating and Cooling Applications. J. Energy Resour. Technol. 2015, 138, 11901. [Google Scholar] [CrossRef]
- Jin, X.; Mu, Y.; Jia, H.; Wu, J.; Jiang, T.; Yu, X. Dynamic economic dispatch of a hybrid energy microgrid considering building based virtual energy storage system. Appl. Energy 2017, 194, 386–398. [Google Scholar] [CrossRef]
- Jradi, M.; Veje, C.; Jørgensen, B.N. Deep energy renovation of the Mærsk office building in Denmark using a holistic design approach. Energy Build. 2017, 151, 306–319. [Google Scholar] [CrossRef]
- Connolly, D.; Lund, H.; Mathiesen, B.V.; Pican, E.; Leahy, M. The technical and economic implications of integrating fluctuating renewable energy using energy storage. Renew. Energy 2012, 43, 47–60. [Google Scholar] [CrossRef]
- Ma, T.; Yang, H.; Lu, L. Development of hybrid battery-supercapacitor energy storage for remote area renewable energy systems. Appl. Energy 2015, 153, 56–62. [Google Scholar] [CrossRef]
- Vieira, F.M.; Moura, P.S.; de Almeida, A.T. Energy storage system for self-consumption of photovoltaic energy in residential zero energy buildings. Renew. Energy 2017, 103, 308–320. [Google Scholar] [CrossRef]
- Jeong, K.; Ji, C.; Koo, C.; Hong, T.; Park, H.S. A model for predicting the environmental impacts of educational facilities in the project planning phase. J. Clean. Prod. 2015, 107, 538–549. [Google Scholar] [CrossRef]
- Korea Energy Appliances Industry Association (KEAA). Reduction of Environmental Improvement Contribution Cost to Eco-Friendly Buildings. Available online: http://www.eaa.or.kr/new/05_community/index.php?vmode=view&idx=235&sch=&key=&keywd=&ad_mode=1&p=39&offset=380&PHPSESSID=703d252c57e500435f91d667db5912d8 (accessed on 24 October 2017).
- McDonald, S.S.; Chakradhar, S. Energy-Efficient Commercial Complex in Kathmandu, Nepal: Integrating Energy Simulations into the Design Process. J. Archit. Eng. 2017, 23, C4017001. [Google Scholar] [CrossRef]
- Wang, L.; Gwilliam, J.; Jones, P. Case study of zero energy house design in UK. Energy Build. 2009, 41, 1215–1222. [Google Scholar] [CrossRef]
- Lam, J.C.; Tsang, C.L.; Li, D.H.W.; Cheung, S.O. Residential building envelope heat gain and cooling energy requirements. Energy 2005, 30, 933–951. [Google Scholar] [CrossRef]
- Huang, Y.; Niu, J.L.; Chung, T.M. Study on performance of energy-efficient retrofitting measures on commercial building external walls in cooling-dominant cities. Appl. Energy 2013, 103, 97–108. [Google Scholar] [CrossRef]
- Hong, T.; Kim, H.; Kwak, T. Energy-Saving Techniques for Reducing CO2 Emissions in Elementary Schools. J. Manag. Eng. ASCE 2011, 28, 39–50. [Google Scholar] [CrossRef]
- Bahr, W. A comprehensive assessment methodology of the building integrated photovoltaic blind system. Energy Build. 2014, 82, 703–708. [Google Scholar] [CrossRef]
- Cucchiella, F.; Dadamo, I. Estimation of the energetic and environmental impacts of a roof-mounted building-integrated photovoltaic systems. Renew. Sustain. Energy Rev. 2012, 16, 5245–5259. [Google Scholar] [CrossRef]
- Hachem, C.; Athienitis, A.; Fazio, P. Evaluation of energy supply and demand in solar neighborhood. Energy Build. 2012, 49, 335–347. [Google Scholar] [CrossRef]
- Koo, C.; Hong, T.; Lee, M.; Kim, J. An integrated multi-objective optimization model for determining the optimal solution in implementing the rooftop photovoltaic system. Renew. Sustain. Energy Rev. 2016, 57, 822–837. [Google Scholar] [CrossRef]
- Koo, C.; Hong, T.; Kim, S. An integrated multi-objective optimization model for solving the construction time-cost trade-off problem. J. Civ. Eng. Manag. 2015, 21, 323–333. [Google Scholar] [CrossRef]
- McGlinn, K.; Yuce, B.; Wicaksono, H.; Howell, S.; Rezgui, Y. Usability evaluation of a web-based tool for supporting holistic building energy management. Autom. Constr. 2017, 84, 154–165. [Google Scholar] [CrossRef]
- Lee, D.; Cha, G.; Park, S. A study on data visualization of embedded sensors for building energy monitoring using BIM. Int. J. Precis. Eng. Manuf. 2016, 17, 807–814. [Google Scholar] [CrossRef]
- Chou, J.S.; Telaga, A.S.; Chong, W.K.; Gibson, G.E. Early-warning application for real-time detection of energy consumption anomalies in buildings. J. Clean. Prod. 2017, 149, 711–722. [Google Scholar] [CrossRef]
- Seong, C.M. Increasing Demand for Electric Power and Demand Management Policy. 2014. Available online: http://www.gtck.re.kr/com/file/pdfView.do?fileId=FILE0000000000000741&fileSn=1. (accessed on 6 November 2017).
- Menassa, C.; Kamat, V.; Lee, S.; Azar, E.; Feng, C.; Anderson, K. A Conceptual Framework to Optimize Building Energy Consumption by Coupling Distributed Energy Simulation and Occupancy Model. J. Comput. Civ. Eng. 2014, 28, 50–62. [Google Scholar] [CrossRef]
- Anderson, K.; Asce, S.M.; Lee, S.; Asce, A.M.; Menassa, C. Impact of Social Network Type and Structure on Modeling Normative Energy Use Behavior Interventions. J. Comput. Civ. Eng. 2014, 28, 30–39. [Google Scholar] [CrossRef]
- Anderson, K.; Lee, S.H. An empirically grounded model for simulating normative energy use feedback interventions. Appl. Energy 2016, 173, 272–282. [Google Scholar] [CrossRef]
- Anderson, K.; Song, K.; Lee, S.H.; Krupka, E.; Lee, H.; Park, M. Longitudinal analysis of normative energy use feedback on dormitory occupants. Appl. Energy 2017, 189, 623–639. [Google Scholar] [CrossRef]
- Anderson, K.; Song, K.; Lee, S.H.; Lee, H.; Park, M. Energy consumption in households while unoccupied: Evidence from dormitories. Energy Build. 2015, 87, 335–341. [Google Scholar] [CrossRef]
- Kemp-Hesterman, A.; Glick, S.; Eileen Cross, J. Reducing electrical energy consumption through behaviour changes. J. Facil. Manag. 2014, 12, 4–17. [Google Scholar] [CrossRef]
- Khosrowpour, A.; Xie, Y.; Taylor, J.E.; Hong, Y. One size does not fit all: Establishing the need for targeted eco-feedback. Appl. Energy 2016, 184, 523–530. [Google Scholar] [CrossRef]
- Ohnmacht, T.; Schaffner, D.; Weibel, C.; Schad, H. Rethinking social psychology and intervention design: A model of energy savings and human behavior. Energy Res. Soc. Sci. 2017, 26, 40–53. [Google Scholar] [CrossRef]
- Virote, J.; Neves-Silva, R. Stochastic models for building energy prediction based on occupant behavior assessment. Energy Build. 2012, 53, 183–193. [Google Scholar] [CrossRef]
- Endrejat, P.C.; Klonek, F.E.; Kauffeld, S. A psychology perspective of energy consumption in organisations: The value of participatory interventions. Indoor Built Environ. 2015, 24, 937–949. [Google Scholar] [CrossRef]


| Authors | Design Variables | Analysis Target | Simulation Tool or Method | Country | Main Finding |
|---|---|---|---|---|---|
| Tuhus-Dubrow et al. (2010) [9] | Total seven building shape (e.g., rectangle and cross shape) | Optimal building shape, life cycle cost/utility cost | Genetic algorithm | USA |
|
| Choi et al. (2012) [10] | Building type (i.e., mixed-use and general apartment), shape (i.e., tower and plate type) | Electricity/gas consumption | Survey and research | Korea |
|
| Parasonis et al. (2012) [12] | Building density, relative geometry efficiency (i.e., ratio of surface area to building volume) | Annual energy savings | Mathematical model | Lithuania |
|
| Parasonis et al. (2012) [13] | Building density, relative geometry efficiency (i.e., ratio of surface area to building volume) | Annual energy savings | Mathematical model | Lithuania |
|
| Asadi et al. (2014) [11] | Total seven building shapes (e.g., triangle and rectangle shapes) | Annual energy consumption | Multi-linear regression analysis | USA |
|
| Hemsath and Bandhosseini (2015) [14] | Ratio of plan’s length to width, stacking level | Annual energy consumption | Global sensitivity analysis | USA |
|
| Mottahedi et al. (2015) [15] | Total seven building shapes (i.e., triangle, rectangle, mincomer, L, U, T, and H Shapes) | Annual energy consumption | Multi-linear regression analysis | USA |
|
| De Castro and Gadi (2017) [8] | Total five slope-adaptive building designs (e.g., single-level and spilt-level), site slope level within the range of 0~50° | Monthly average load, annual energy saving | EnergyPlus | Portugal |
|
| Classification | Authors | Design Variables | Analysis Target | Simulation Tool or Method | Country | Main Finding |
|---|---|---|---|---|---|---|
| Orientation | Fallahtafti and Mahdavinejad (2015) [16] | Orientation, building geometry, window-to-wall ratio (WWR) | Heating gain/loss | Mathematical model | Iran |
|
| Abanda and Byer (2016) [17] | U.K electricity price, gas price, orientation (interval: 45°) | Annual CO2 emissions | Revit, BIM, Green Building Studio | UK |
| |
| de Vasconcelos et al. (2016) [18] | Orientation, discount rate | Global energy cost, energy consumption | Life cycle cost analysis | Portugal |
| |
| Hemsath (2016) [19] | Orientation, climate factors | Annual energy costs, optimal orientation | BEopt, EnergyPlus | USA |
| |
| Valladares-Rendon et al. (2017) [20] | Climate factors | Worldwide guide of azimuth angle | Case study, Ecotect | Hong Kong (China) |
| |
| Atrium | Assadi et al. (2011) [21] | Glass height and diameter | Thermal efficiency | Mathematical model | Iran |
|
| Aldawoud (2013) [22] | Atrium dimensions, atrium geometry ratio | Annual energy consumption | DOE2.1 | Saudi Arabia |
| |
| Chow et al. (2013) [23] | - | Energy savings of each floors | Field study | Hong Kong (China) |
| |
| Taleghani et al. (2014) [24] | Wind speed | Energy demand | EnergyPlus | The Netherlands |
| |
| Nasrollashi et al. (2015) [25] | Atrium ratio, internal heat load | Annual energy consumption, comfort indices | Mathematical model | Iran |
| |
| Mohsenin and Hu (2015) [26] | Well index (i.e., atrium proportion), atrium types (e.g., semi-enclosed), aperture types (e.g., horizontal skylight) | Useful daylight illuminance | DIVA | USA |
| |
| Danielski et al. (2016) [27] | Building design (e.g., atrium), envelope parameter (e.g., U-value) | Energy demand | Questionnaire, VIP-Energy software | Sweden |
|
| . | Authors | Design Variables | Analysis Target | Simulation Tool or Method | Country | Main Finding |
|---|---|---|---|---|---|---|
| Buoyancy-driven ventilation | Hussain and Patrick (2012) [29] | Solar intensity, floor property (e.g., depth, width, and height) | Volume flow rate, thermal comfort | CFD simulation | - |
|
| Acred and Gary (2014) [30] | Heat transfer parameter | Air flow rate | Mathematical method | UK |
| |
| Li and Liu (2014) [31] | Solar intensity (i.e., 500–700 W/m2), phase change material (PCM) thermos-physical properties | Air flow rate | Mathematical method | UK |
| |
| Jing et al. (2015) [32] | Solar intensity (i.e., heat flux), gap to height ratio (i.e., 0.2~0.6) | Air flow rate | Experiment | China |
| |
| He et al. (2017) [33] | Architectural design (e.g., orientation, building envelope), climate | Energy savings, thermal comfort | Mathematical method | China |
| |
| Tong et al. (2017) [34] | Weather (e.g., temperature, wind), season | Natural ventilation potential | Atmospheric boundary layer, meteorology model | USA |
| |
| Wind-driven ventilation | Afshin et al. (2016) [35] | Wind angle, inlet wind speed | Air flow rate | Mock up experiment | Iran |
|
| Nejat et al. (2016) [36] | Wind speed, wind-catcher angle (i.e., 30, 60, 90°) | Air flow rate, CO2 concentration | Experiment, CFD simulation | Malaysia |
| |
| Nejat et al. (2016) [37] | Wind speed, wing wall angle (i.e., 30, 45, 60°) | Air change hour, air flow rate | Mock up experiment | Malaysia |
| |
| Mei et al. (2017) [38] | Building densities (i.e., medium (0.25) and compact (0.44) urban development) | Wind flow | CFD simulation | China |
|
| Classification | Authors | Design Variables | Analysis Target | Simulation Tool or Method | Country | Main Finding |
|---|---|---|---|---|---|---|
| Heat insulation | Daouas (2011) [40] | Orientation, insulation property | Annual energy load, optimum insulation thickness | Mathematical model | Tunisia |
|
| Ottele et al. (2011) [41] | Green wall type (e.g., bare, direct, indirect) | Energy savings | Life cycle environmental analysis | The Netherlands |
| |
| Sanjuan et al. (2011) [42] | Open-joint ventilated façade, conventional façade | Heat flux, solar radiation | CFD simulation | Spain |
| |
| Hong et al. (2013) [43] | Double skin façade type (i.e., box, corridor, multistory, shaft) | Saving-to-investment ratio, break-even point | Life cycle cost analysis | Korea |
| |
| Pomponi et al. (2015) [44] | Façade type (i.e., double skin/mono), glass type (i.e., clear/coated) | Heating load, payback period | Life cycle energy and environmental analysis | UK |
| |
| Tam et al. (2016) [45] | - | Measured temperature, maintenance cost | Survey and research | Hong Kong (China) |
| |
| Opening design | Su and Zhang (2010) [46] | WWR, orientation, glass type (e.g., single, hollow) | Environmental impact | Life cycle environmental analysis | China |
|
| MA et al. (2015) [47] | WWR (i.e., 10~100% with interval 10%), U-value | Recommended WWR | Mathematical model | USA |
| |
| Seo et al. (2015) [48] | WWR, orientation, glazing type, shading type | Heating/cooling demand | DesignBuilder v3.0, Microsoft-Excel-based VBA | Korea |
| |
| Goia (2016) [49] | WWR, orientation, building geometry, façade material | Total energy consumption, Daylight autonomy | EnergyPlus | E.U. |
| |
| Wen et al. (2017) [50] | WWR (i.e., 10~70%, interval: 10%), orientation | Total CO2 emission, recommended WWR | EnergyPlus | Japan |
| |
| Zenginis and Kontoleon (2017) [51] | WWR, building aspect ratio (i.e., length and width dimensions) | Heat gain and loss | Mathematical model | Greek |
| |
| Shading device | Kim et al. (2012) [52] | Shading device type (i.e., overhang, blind, light-shelf), device slat angle | Energy saving, annual heating load | EnergyPlus | Korea |
|
| Cheng et al. (2013) [53] | Width/height of opening, ratio of length of shade device to window vertical length | Shading ratio | Mathematical model | Taiwan |
| |
| Lin et al. (2016) [54] | Sunshade style and size (i.e., horizontal, vertical, grid), envelope material | Optimal sunshade | TRNSYS | Taiwan |
| |
| Ye et al. (2016) [55] | Shading type (i.e., internal, external, and non-shading) | Indoor temperature, solar radiation intensity, cooling load | EnergyPlus | China |
|
| Classification | Authors | Design Variables | Analysis Target | Simulation Tool or Method | Country | Main Finding |
|---|---|---|---|---|---|---|
| Thermal mass | Diaconu (2011) [56] | PCM melting point, ventilation frequency, occupancy pattern | Indoor temperature, energy savings | TRNSYS | Romania |
|
| Weinlaeder (2011) [57] | Conventional/PCM integrated interior blind | Indoor/outdoor temperature | Experiment | Germany |
| |
| Ma and Wang (2012) [58] | Thermal mass thickness | Indoor temperature, maximum heat storage | Mathematical method | USA |
| |
| Silva et al. (2015) [59] | Daily average solar radiation, wind direction, and intensity | Indoor/outdoor temperature | Experiment | - |
| |
| Turner et al. (2015) [60] | Pre-cooling period | Energy consumption, peak load reduction | REGCAP | USA |
| |
| Chernousov and Chan (2016) [61] | Thermal mass property, internal load fraction | Indoor temperature, AC power demand | EnergyPlus | Hong Kong (China) |
| |
| Trombe wall | Stazi et al. (2012) [62] | Wall material (e.g., concrete), glazing type, wall thickness, frame material | CO2 emissions | EnergyPlus, Life cycle environmental analysis | Italy |
|
| Abbassi et al. (2014) [63] | Trombe wall area (i.e., 0~19 m2, interval: 1 m2) | Heating energy savings | TRNSYS | Tunisia |
| |
| Bojic et al. (2014) [64] | Real residential house description (e.g., wall material) | Primary energy use, energy saving | EnergyPlus | France |
| |
| Briga-Sa et al. (2014) [65] | Massive wall thickness (i.e., 15~40 cm, interval: 5 cm) | Heating load | Mathematical method | Portugal |
| |
| Bajc et al. (2015) [66] | Boundary condition (e.g., material density) | Indoor temperature, heat flux | CFD simulation | Servia |
|
| Authors | Design Variables | Analysis Target | Simulation Tool or Method | Country | Main Finding |
|---|---|---|---|---|---|
| Byun et al. (2014) [67] | Occupancy time, occupant movement detection | Lighting intensity | Experiment | Korea |
|
| Principi and Fioretti (2014) [68] | Life cycle inventory (e.g., land use, cumulative energy demand, etc.) | Environment impact | Life cycle environmental analysis | Italy |
|
| Xue et al. (2014) [69] | Distance from window | Illuminance, uniformity ratio (i.e., minimal illuminance/average illuminance) | Radiance, TracePro7.0 | Hong Kong (China) |
|
| Berardi and Anaraki (2015) [70] | Location of illuminance measurement, WWR | Useful daylight illuminance | Radiance | Canada |
|
| Nagy et al. (2015) [71] | Occupancy time, control mode (i.e., baseline, comfort, and savings) | Daily energy consumption | Experiment | Switzerland |
|
| Meresi (2016) [72] | Location of illuminance | Daylight level/factor | Radiance | Greek |
|
| Caicedo et al. (2017) [73] | Daylight factor, occupancy time, ceiling sensor position | Dimming level | Experiment | The Netherlands |
|
| Lee et al. (2017) [74] | Vent ratio (4, 6, 8, and 10 mm of diameter), angle of light-shelf | Indoor illumination, energy consumption | Experiment | Korea |
|
| Classification | Research | Analysis Target | Design Variables | Simulation Tool or Method | Country | Main Findings | ||
|---|---|---|---|---|---|---|---|---|
| Technical a | Economic b | Policy c | ||||||
| Rooftop PV system (Horizontal) | Ordóñez et al. (2010) [75] | ○ | - | - | Building properties, shading effect, PV installation type, solar irradiation loss from shading | AutoCAD, Google Earth | Spain |
|
| Hong et al. (2014) [76] | ○ | - | - | Geographical/meteorological information | RETScreen, ArcMap 10.1, Mathematical method | Korea |
| |
| Koo et al. (2014) [77] | ○ | ○ | ○ | Building information, PV panel’s properties, region | Mathematical method, RETScreen | Korea |
| |
| Jeong et al. (2015) [78] | ○ | ○ | - | Military building’s information, PV panel/inverter type | Mathematical method, RETScreen, PBECAS | Korea |
| |
| Park et al. (2016) [79] | ○ | - | ○ | Building/PV system/region information | RETScreen, Mathematical method | Korea |
| |
| Ban et al. (2017) [80] | ○ | ○ | - | Information of the PV panels/inverters/region, roof’s properties | Mathematical method RETScreen | Korea |
| |
| Elibol et al. (2017) [81] | ○ | - | - | PV panel type (e.g., mono-crystalline and polycrystalline), amount of radiation, panel temperature | Experiment, statistical analysis | Turkey |
| |
| Hong et al. (2017) [82] | ○ | - | - | Building data, region (e.g., altitude), shaded area, fixed-tilt system, tracker system | Mathematical method, Vworld | Korea |
| |
| Building-integrated PV system (Vertical) | Lu and Yang (2010) [83] | ○ | ○ | - | Weather data, solar radiation, orientation, inclined angle of PV | Mathematical method, LCA | Hong Kong (China) |
|
| Radhi (2010) [84] | ○ | - | - | Regional factors, design, and performance of BIPV system | MeteoNorm software, Energy-10 software | UAE |
| |
| Hong et al. (2011) [85] | ○ | ○ | - | Energy consumption, energy consumption/per occupant | Mathematical method | Korea |
| |
| Building-integrated PV system (Vertical) | Hammond et al. (2012) [86] | ○ | ○ | ○ | PV installation/electricity cost, financial support policy | Eco-indicator 99, Mathematical method | UK |
|
| Hwang et al. (2012) [87] | ○ | - | - | Weather data, building information, details of PV panels | Building management system of Samsung, CAD, Equest | Korea |
| |
| Chae et al. (2014) [88] | ○ | ○ | - | U-factor, solar heat gain coefficient, visible transmittance, source energy unit price | Mathematical method, EnergyPlus | Korea |
| |
| Lee et al. (2014) [89] | ○ | - | - | PV panel’s efficiency, building load | Mathematical method | Korea |
| |
| Olivieri et al. (2014) [90] | ○ | ○ | - | Glazing properties, climate data, building information | DeignBuilder, EnergyPlus, PVSyst, COMFEN | Spain |
| |
| Park et al. (2016) [91] | ○ | ○ | ○ | Region, visible transmittance, exterior window area, window-to-PV panel ratio, PV panel’s efficiency | Finite element method, Microsoft excel based VBA | Korea |
| |
| Peng et al. (2016) [92] | ○ | - | - | Semi-transparent PV’s properties, infrared thermal emissivity and thermal conductivity | EnergyPlus, mathematical model, sensitivity analysis | USA |
| |
| Hong et al. (2017) [93] | ○ | ○ | ○ | Architectural design variables, window design variables, building-integrated PV blind (BIPB) design variables | Autodesk Ecotect Analysis, mathematical method | Korea |
| |
| Koo et al. (2017) [94] | ○ | ○ | Type of PV panel/tracking system, building data | RETScreen, ArcMap 10.3, mathematical method | Korea |
| ||
| Oh et al. (2017) [95] | ○ | ○ | ○ | Electricity rate in South Korea, region, orientation, visible transmittance, PV panel efficiency, wall and window area, WWR, window-to-PV panel ratio | Finite element method, Microsoft excel based VBA | Korea |
| |
| Research | Analysis Target | Design Variables | Simulation Tool or Method | Country | Main Findings | |
|---|---|---|---|---|---|---|
| Technical a | Economic b | |||||
| Anderson et al. (2010) [96] | ○ | - | Color of building integrated solar collector | Mathematical method | New Zealand |
|
| Mammoli et al. (2010) [97] | ○ | ○ | Solar flux, flow rate and input/output, solar collector’s efficiency, absorption chiller’s performance, heating/cooling system operation time | TRNSYS | Mexico |
|
| Ampatzi and Knight (2012) [98] | ○ | - | Building information, weather data, infiltration/ventilation rates, internal gains, hot water consumption | TRNSYS, TRNbuild, ECOTECH | Wales (UK) |
|
| Bornatico et al. (2012) [99] | ○ | - | Meteorological data, collector area, tank volume, auxiliary power unit size | MATLAB, Polysun, PSO algorithm, mathematical method | Switzerland |
|
| Fong and Alwan (2013) [100] | ○ | - | Weather data, cooling profile | TRNSYS, IES, mathematical method | UK |
|
| Motte et al. (2013) [101] | ○ | - | Solar irradiance, ambient temperature, wind speed, input/output water temperature | Mathematical method, MATLAB | France |
|
| Lamnatou et al. (2014) [102] | ○ | - | Characteristic of the building integrated solar thermal system, life cycle inventory | Mathematical method | France |
|
| Li et al. (2014) [103] | ○ | - | Operation control parameters, storage characteristics, matching degree between solar collector area and system integral capacity | TRNSYS, mathematical method | China |
|
| Maurer et al. (2015) [104] | ○ | - | U-value , ambient temperature, room temperature, zero-g-value | Mathematical method | - |
|
| Kim et al. (2016) [105] | ○ | - | Region, azimuth/slope/type of collector, storage type, rooftop area, minimum heat generation limit, maximum budget limit | Mathematical method, Microsoft Excel based VBA | Korea |
|
| Araya et al. (2017) [106] | ○ | ○ | Solar flat-plate collector arrangement, water tank, auxiliary system, energy demand | Genetic algorithms, MATLAB, LCC | Chile |
|
| Chialastri and Isaacson (2017) [107] | ○ | ○ | Glazing type (e.g., uncoated, Low-e double), material (e.g., aluminum), air speed, temperature | Experiment, two-dimensional model in COMSOL Multiphysics | USA |
|
| Research | Analysis Target | Design Variables | Simulation Tool or Method | Country | Main Findings | |
|---|---|---|---|---|---|---|
| Technical a | Economic b | |||||
| Wood et al. (2010) [108] | ○ | - | Date, average air temperature, season | EED, GLHEPRO, Mathematical method | UK |
|
| Desideri et al. (2011) [109] | ○ | - | Design of underground heat exchangers, soil type, number/total length/distance between the boreholes, energy demand, heating/cooling plant installation cost | TRNSYS 16 | Italy |
|
| Kim et al. (2012) [110] | ○ | ○ | Heat pump type (e.g., inverter type), outdoor/indoor temperature, relative humidity | Experiment | Korea |
|
| Sivasakthivel et al. (2012) [111] | ○ | ○ | Region (e.g., several/moderate cold), COP of GSHP | Mathematical method | India |
|
| Kang et al. (2013) [112] | ○ | - | Season, climate weather data | Mathematical method, MATLAB/Simulink | France, Korea |
|
| Self et al. (2013) [113] | ○ | ○ | Variable of geothermal heat pump | - | Europe |
|
| Morrone et al. (2014) [114] | ○ | ○ | Ground characteristic, building information, performance of heat pump/cooling machine, loading conditions for heating and cooling | Mathematical method, DOCET, PILESIM2 | Italy |
|
| Kim et al. (2015) [115] | ○ | ○ | Region, geothermal heat exchanger properties, heating/cooling loads, entering water temperature | Mathematical method, LCI & LCC Analysis, GLHEPro | Korea |
|
| Kharseh et al. (2015) [116] | ○ | ○ | Building/GSHP specification, driving energy of A/C system | Earth energy designer, HAP | Qatar |
|
| Lee et al. (2015) [117] | ○ | ○ | Specifications of the vertical/horizontal GCHE, outdoor temperature, electric power, energy consumption | TRNSYS | Korea |
|
| Hong et al. (2016) [118] | ○ | - | Borehole length/spacing/diameter, grout thermal conductivity, U-pipe diameter/spacing | Mathematical method, GLHEPro | Korea |
|
| Jeong et al. (2017) [119] | ○ | - | Geographic, annual average temperature, annual heating days, ground heat exchanger’s characteristics, threshold fluid temperature | FEM, G.POT, Kriging method | Korea |
|
| Research | Input Data | Output Data | Simulation Tool or Method | Country | Main Findings |
|---|---|---|---|---|---|
| Sharpe and Proven (2010) [120] | Blade design, pitch control/angle, pitch control of rotor rpm | Development of true building integrated wind turbine | Stream tube model, Mathematical method, μ-wind | UK |
|
| Walker (2011) [121] | Wind speed, theoretical power curves, turbine performance | Measurement of power production | Mathematical method, CFD, BREV-e | UK |
|
| Ayhan and Sağlam (2012) [122] | Geometry scenarios and building layout, assembly forms to the building of wind turbines | Feasibility of wind power utilization | CFD, mathematical method | Turkey |
|
| Balduzzi et al. (2012) [123] | Wind turbine’s characteristics, city data (e.g., building height) | Flow velocity modulus and direction, attended capacity factor, new turbine model | CFD, Reynolds-averaged Navier–Stokes (RANS) | Europe |
|
| Li et al. (2013) [124] | Wind tunnel tests, wind climate data analysis | Wind loads on tall buildings, wind speed up factors in the tunnels for wind-power generation | Mathematical method, real model test | China |
|
| Lu and Sun (2014) [125] | Wind/building data | Wind power utilization into or on urban high-rise buildings | CFD, ANSYS/FLUENT, UDF | Hong Kong (China) |
|
| Park et al. (2014) [126] | Region, building information, characteristic of small wind power generation system | Noise and vibration, amount of power generated by the small wind power system | CFD, mock-up test | Korea |
|
| Yang et al. (2016) [127] | Climate data, wind velocity and direction, turbulence intensity, complex urban topography of the studied site | Maximum power density with optimum height | ANSYS/Fluent, SIMPLEC, CFD, RANS | Taiwan |
|
| Cao et al. (2017) [128] | Building information, wind data, heights of the first five layers in the meteorological data | Annual average power output/electric power yield of building integrated wind turbine system | Mathematical method, CFD, WRF Model | China |
|
| Research | Analysis Target | Design Variables | Simulation Tool or Method | Country | Main Findings | |
|---|---|---|---|---|---|---|
| Technical a | Economic b | |||||
| Hong et al. (2014) [130] | ○ | ○ | Fuel cell combined heat and power system’s operating scheme and size, energy demand/supply | Mathematical method, Crystal Ball | Korea |
|
| Adam et al. (2015) [131] | ○ | - | Building information, region, occupancy schedule | IES VE, Mathematical method | UK |
|
| Kim et al. (2014) [132] | ○ | ○ | Building type, operating scheme, operating size, energy demand/supply | Mathematical method, Microsoft-Excel-based VBA | Korea |
|
| Sossan et al. (2014) [133] | ○ | ○ | Building indoor temperature, fuel cell and tank’s properties, optimization horizon length, maximum fuel cell off–on cycles | CTSM, LabView, mathematical method | - |
|
| Elmer et al. (2016) [134] | ○ | ○ | Tri-generation system energetic performance | Mathematical method | UK |
|
| Ansong et al. (2017) [135] | ○ | ○ | Site location, electrical load, solar resource, diesel fuel’s information | HOMER software | Ghana |
|
| Classification | Research | Analysis Target | Input Data | Simulation Tool or Method | Country | Main Findings | |
|---|---|---|---|---|---|---|---|
| Technical a | Economic b | ||||||
| Thermal energy storage system | Alimohammadisagvand et al. (2016) [136] | ○ | ○ | Indoor/storage tank temperature set point, hourly electricity price, weather, building information, HVAC system | IDA ICE, Monte-Carlo simulation, NIDAQ | Finland |
|
| Al Zahrani and Dincer (2016) [137] | ○ | - | Dis/charging temperature, mass flow rate, storing time, temperature drop/rise during storing, ambient temperature | Mathematical method, EES | Canada |
| |
| Jin et al. (2017) [138] | ○ | ○ | External walls and windows’ heat transfer, internal heat gains, heat contribution, solar radiation, cooling power generated | Mathematical method | USA |
| |
| Jradi et al. (2017) [139] | ○ | ○ | Monthly global solar irradiation in Odense and PV system yield, heating energy satisfied by PV-driven heat pump, electrical energy demand/supply | Mathematical method, MATLAB | Denmark |
| |
| Electrical energy storage system | Connolly et al. (2012) [140] | ○ | ○ | Electricity demands, energy storage system’s capacities/efficiencies, regulation strategies, fuel cost, distribution data (e.g., heat, electric) | Energy PLAN, mathematical method | Ireland |
|
| Ma et al. (2015) [141] | ○ | - | The presence or absence of supercapacitor | MATLAB/Simulink, mathematical method | - |
| |
| Vieira et al. (2017) [142] | ○ | - | Solar radiation, energy consumption, PV panel, and battery information | MATLAB/Simulink, mathematical method, PVSyst | Portugal |
| |
© 2017 by the authors. Licensee MDPI, Basel, Switzerland. This article is an open access article distributed under the terms and conditions of the Creative Commons Attribution (CC BY) license (http://creativecommons.org/licenses/by/4.0/).
Share and Cite
Oh, J.; Hong, T.; Kim, H.; An, J.; Jeong, K.; Koo, C. Advanced Strategies for Net-Zero Energy Building: Focused on the Early Phase and Usage Phase of a Building’s Life Cycle. Sustainability 2017, 9, 2272. https://doi.org/10.3390/su9122272
Oh J, Hong T, Kim H, An J, Jeong K, Koo C. Advanced Strategies for Net-Zero Energy Building: Focused on the Early Phase and Usage Phase of a Building’s Life Cycle. Sustainability. 2017; 9(12):2272. https://doi.org/10.3390/su9122272
Chicago/Turabian StyleOh, Jeongyoon, Taehoon Hong, Hakpyeong Kim, Jongbaek An, Kwangbok Jeong, and Choongwan Koo. 2017. "Advanced Strategies for Net-Zero Energy Building: Focused on the Early Phase and Usage Phase of a Building’s Life Cycle" Sustainability 9, no. 12: 2272. https://doi.org/10.3390/su9122272