Challenges for the Resilience Capacity of Romanian Shrinking Cities

1
Faculty of Geography and Geology, Alexandru Ioan Cuza University, 700505 Iasi, Romania
2
Romanian Academy, Department of Iasi, Geography Group, 700505 Iasi, Romania
*
Author to whom correspondence should be addressed.
Sustainability 2017, 9(12), 2289; https://doi.org/10.3390/su9122289
Submission received: 6 November 2017
/
Revised: 3 December 2017
/
Accepted: 4 December 2017
/
Published: 9 December 2017
(This article belongs to the Special Issue Sustaining the Shrinking City: Concepts, Dynamics and Management)
Abstract
:In the context of deindustrialization and desurbanization, Romanian cities are confronted with issues related to natural demographic decline and out-migration, inducing apparently opposite, but complementary phenomena: slow-burn shrinkage and urban sprawl, which create peripheralisation processes both inside and outside the cities. The current approach acknowledges urban shrinkage within the context of post-communist transformations, but also as a “natural” process in the (adaptive) life cycle of cities. In this context, the study aims to explore the interdependencies between the causes and effects of shrinkage, on the one hand, and the operating feedback mechanisms which might lead to adaptation, on the other. It highlights the changes incurred by the territorial (un)balance combining the spatial analysis of urban shrinkage in relation to the diffused structures imposed by sub-urbanization or metropolisation processes. Using multi-criteria and time series analysis methods, the aim of the assessment is to determine and analyse the significant correlations and trends taking into account relevant demographic, social–economic as well as infrastructural and environmental indicators, in order to describe typologies of urban shrinkage in Romania and their adaptation potential. The results are interpreted in correlation with the need for sustainable strategies and planning, in order to tackle the issue of urban shrinkage in Romania.
1. Introduction
1.1. Shrinking Cities—Theoretical Background
Shrinking cities are considered those with a smaller population or economy if compared to their past [1] The steady population decline is often accompanied by economic downturn and a certain loss of urban functions, mainly in the range of social, transport and utility infrastructures [2].
The Berlin-based “Shrinking Cities” project reports that during the 1990s more than a quarter of the world’s large cities saw population declines, mainly in post-socialist Europe and America, but also in Japan, Russia and China, as the population shifts to major, thriving cities, leaving many of the smaller cities. The concept of shrinking cities is more common and established in Europe, where the phenomenon has been taken into consideration for a longer period [3].
There are numerous approaches to understanding the concept of urban shrinkage. This complex problem requires a multidisciplinary research that covers different areas (architecture, environmental sciences, economy, geography and politics) in an attempt to find the best diagnosis and strategies for declining cities.
Wiechmann defines a shrinking city as a densely populated urban area with a minimum population of 10,000 residents that has undergone population losses in large parts for more than two years and is facing economic transformations showing certain symptoms of a structural crisis [4]. Taking into account the definition proposed by COST-Action CIRES project carried out under European Cooperation in Science and Technology framework, a shrinking city can be defined as an urban area with more than 3000 residents, which underwent a population decline for at least ten years in the last 20 years [3]. For Sako Munsterd, a shrinking city is a functional urban area having at least 5000 residents in its core city, that has faced significant population loss for at least five years (in recent years or in some former period) which correlates with a long-term or episodic economic, social or cultural transformation inducing symptoms of a structural crisis [5].
In all cases, the shrinkage is a form of “negative development” reflected by different “effect” indicators such as demographic deficit (natural and migratory (un)balance) and economic problems (labour force affected by the fleeing of highly skilled, young population towards other cities/countries offering better opportunities with many of the cities being located abroad) [6].
In other words, shrinking cities can also be defined as “urban areas that have experienced population loss, economic downturn, employment decline and social problems as symptoms of a structural crisis” [7]. In this regard, crisis refers to losses of inhabitants, jobs, attractiveness to investments, property value, social bonds and, overall, a loss of design potential [8].
At the symposium held at UC Berkeley in February 2007, organized by the Center for Global Metropolitan Studies and the Institute of Urban and Regional Development at UC Berkeley, shrinking cities were broadly defined as a category of cities, parts of cities or metropolitan areas that are experiencing a dramatic decline in their economic and social bases. There are numerous negative influences on these cities, including globalization, the post-industrial shift from manufacturing to service industries and the “second generation” of the high-tech sector after the bursting of the dot-com bubble [9].
Shrinking cities have two main dimensions: the population decline and the symptoms of structural crisis. The first is easier to register and analyse by the episodic or continuous demographic change caused by environmental events, wars or socio-political challenges or, in the second case, by low fertility rate, suburbanization, settlement system uneven development and age and gender selective migration. The structural symptoms are usually more complex being sometimes driven by episodic crisis of economic, social or cultural phenomena (closing activities, deindustrialisation, financial crisis and policies at regional and national level). They can also emerge as a consequence of long-term transformation phenomena such as restructuring industry-based economies or hostile attitude towards innovation, learning and adaptation [5]. The effect refers to long term loss of population by natural and migratory deficit, declining investments, loss of jobs and higher unemployment rates, issues related to the housing market, public transport, service and urban utilities (Figure 1).
Taking into account the causes of the phenomenon, Thorsten Wiechmann identifies certain types of shrinking: suburbanization (including hollowing out, segregation and sprawl), industrial transformation/decline (old industrial areas, “rust belts” of steel or coal industry, textile industry, and harbours), selective collapses driven by crises (that can be economical, environmental or political) and political strategies (controlled resettlement, depopulation areas, colonisation areas etc.) [10].
By the same criteria, Wolff et al. classify French cities into five types: impacted by demographic change, lacking attractiveness and young people, lacking activities/employment, with ageing population and strong migration deficit and, at last, affected by structural unemployment [11].
C. Cottineau takes into account the natural and migratory balance in order to highlight three types of shrinking cities in Russia: shrinking cities per se (with simultaneously negative natural balance and net migration), drifting cities (positive natural balance, but losing population based on the people migrating out of the city), depopulating cities (positive net migration, but not compensating for a high negative natural balance) [12].
In fact shrinking cities are studied as urban areas in a critical stage of a transition process which demands new approaches that integrate urban ecology in the planning processes [13]. Rocak et al. [14] analyse the relation between urban shrinkage and social capital of cities, by highlighting the contribution of the second to increasing the social sustainability in declining urban areas. Nevertheless, the assessments of resilience paths of shrinking cities should integrate a wide variety of possible feedbacks within the social–economic infrastructural and ecological subsystems that are responsible for currently inducing an unsustainable path [15].
1.2. Urban Resilience—A Different Approach to Shrinking Cities and Sustainability
Cities are complex, adaptive, self-organizing (eco)systems. One could apply, within cities, both metaphorically and quantitatively, different models such as equilibrium, trophic chains, successive cycles, adaptive cycles, etc. [16]. Similarly, shrinkage can be understood by taking into account both causes and effects only in the context of the integrated interactions that take place in the city, with the surrounding area and with other cities, and considering certain paths and phases that are faced by the analysed cities. The resilience theory offers a good filter for explaining and interpreting shrinkage in direct connection to certain “natural” phases in the process of adaptation.
The term “resilience” is used to describe the ability of a system to absorb or withstand changes inflicted onto the system from the outside, to reorganize and persist, still retaining essentially the same functions, structure, identity and feedbacks [17,18]. In the case of cities, resilience capacity does not focus on the performance in facing a certain crisis, but on the general ability to resist shocks, on the structural preparedness and the general capacity to bounce back in the wake of any stress or pressure. Martin [19] argues that there are four different dimensions of this capacity: resistance, renewal, recovery and re-orientation. In fact there are many different concepts of resilience, beginning with a rather narrow interpretation—first engineering, then ecological resilience based on efficiency in withstanding shocks and maintaining functions, buffer capacity, return time, and ending with the broader context of social–ecological resilience that also integrates reorganization, transformability and development, by increasing learning and innovation capacities [20].
In the current approach, resilience is seen as a dynamic attribute associated with a process of continuous development [21]. Resilience, in this case, is not a return to a state of “prior normality”, but a creative change and adaptation in order to support long-term positive dynamics.
Meanwhile, the evolution of urban systems is not linear, but rather circular: the components of the urban system are interlinked in continuing adaptive cycles of growth (exploitation), accumulation (conservation), restructuring (collapse) and renewal (reorientation) [22]. It is important to emphasize that the adaptive cycle is neither immutable nor absolute, while the most diverse socio–economic and/or ecological systems have different evolutions. Thus, a growth phase, although usually followed by a conservation phase, can sometimes be directly followed by a release phase. A conservation phase often precedes the release phase but it is also possible to switch, after small disturbances, directly to a new phase of growth [18]. Understanding the phases of these cycles, their temporal and spatial extent and succession, it is important to identify the points in which the system is capable of accepting positive change and the points where it is vulnerable, or can become subjected, to regime shifts [22].
Regime shifts can be defined as large, abrupt and persistent modifications in the structure and function of a system. An external shock can trigger completely different system behaviours, but regime shifts are also induced by slow changes in external drivers and internal feedbacks that are able to change the domains of attraction of the regime: from a resilient state to a less resilient state, when attaining a certain tipping point. The (temporary) loss of system resilience changes the thresholds and the system is pushed into a new regime [23].
From the viewpoint of the resilience theory, cities are crossing, in various rhythms, different phases in the adaptive cycle. Declining cities are confronting certain constraints, confusion and crisis, having limited options as they are in conservation phase or facing breakdowns [16]. The actions needed in order to break this trend and regain an ascendant path are envisioning the meaningful changes and then promoting creative networks and investments in sustainable activities (Figure 2).
Shrinkage is, by itself, a period of crisis when the system finds itself in a conservation phase or during the release phase. For all shrinking cities it is important to capitalize on the opportunities of the new situation when they have the chance to renew, restructure and become more attractive and functional by taking into account the new context and the territorial potential.
In this regard, shrinking cities find themselves in a stage far from a continuous socio–economic growth, in a point in the cycle where the future has to be re-imagined based on the changing context and on their capabilities and assets that are different from those that maybe assured its prosperity in the past [24].
The essential relation between shrinking cities and resilience capacity is represented by the “learning” segment of the cycle (dotted line in Figure 2) in a period governed by uncertainty, constraint, confusion and crisis when there is a tension between the actual state and the possible alternatives [24]. There are terms such as “creative shrinkage” [25], “smart decline” [26] and “resilient shrinkage” [27], which integrate naturally (although sometimes indirectly) shrinking in the release phase of the adaptive cycle while imagining intelligent adaptive strategies of growing smaller and in a more sustainable manner.
The present approach heavily relies on an evolutionary perspective on urban resilience that connects shocks to the elements that determine a city to develop new growth paths [28]. In this regard, the “evolutionary resilience” is the capacity of cities, in this case, to “bounce forward”, rather than “bounce back” [29,30].
Based on this framework, all phases of adaptation and the adaptive mechanisms themselves are depending on the reference context and historical events. The path dependency reflects both the capacity of self-organization, but also the innovation potential of cities [31]. The legacy of the temporal remote events and past developments influences present and future trajectories [32]. Even though the initial conditions do not completely determine the present state, they interplay with the perturbations during the process; therefore they highly influence the actual direction [33].
Analysing the paths/trajectories of different cities reveals the “natural” connections between resilience thinking and sustainability as being both conditioned by the capability to maintain natural and social resources, while effectively responding to stresses and shocks [34].
1.3. The Situation in Eastern Europe, with a Focus on the Case of Romania
After 1989, the deindustrialisation of Eastern European countries took place much more abruptly than in Western countries, more nuanced and stretched over a longer period. This is why a much stronger discourse about shrinking cities only emerged in the 2000s, after the effects of the fall of the iron curtain were felt. Other elements such as urban sprawl, poor infrastructure and massive migration for work abroad contributed to shrinkage. The onset of deindustrialization represented for many old industrial cities and regions the lowest point of what had been a dominant mode of urban-economic development and the beginning of a painful shift towards a new pattern of unequal and unstable growth [35].
Eastern Europe is one of the key laboratories for shrinking cities [36] while Romania is a particular case-study, being confronted with a systemic crisis generated by a powerful disturbance of the structures inherited from the totalitarian period.
This process is closely linked to the urban transition that was incomplete in Romania, with a degree of urbanization hardly surpassing the 50% threshold. Intensive urbanization, largely based on the urban network inherited from the totalitarian regime period, calls for a step towards an extensive phase, partially explaining phenomena such as peri-urbanization or rural retreat/counter urbanization (even in highly ruralized areas).
The socialist ideology was extremely biased towards urbanization, which was considered a value per se. Secondary activities, and especially heavy manufacture industry, were considered a key element in defining the urban development policy in general and were given priority over primary as well as over tertiary activities [37,38].
There was a significant development of Romania’s industry between 1970 and 1989, as a result of a centralized economic approach, allocating 50–60% of all investments to the industrial sector [39]. Nevertheless, there is a clear contrast between communist industrialization and urbanization on the one hand, and the urban decline after 1989, on the other.
Deindustrialization meant the disintegration of the economic structure [40], and industrial cities and regions entered a downsizing spiral of population loss after the breakdown of traditional industries, out-migration and suburbanization [41]. It was based on a sudden and brutal transition from a centrally-planned economy and authoritarian regime to a market-oriented economy and democracy, followed by a state-level fiscal crisis, massive privatization and commercialization [42]. The demographic decline was mostly due to the migratory loss of the population and not due to a natural loss (which is common for the last stage of the demographic transition).
The industry decline and the transformation after 1989 happened at a much more rapid pace in Romania, compared to Western Europe. The combined effects of deindustrialization, suburbanization, political/administrative and demographic factors have produced a hitherto unknown model for decline [43]. These changes had a big impact on Romanian cities and surrounding areas by redefining the spatial patterns of growth and decline and combining with emergent forms of social and economic inequality [41]. In the case of Romania, the old industrial cities were not the only ones to suffer from these effects, as also the newer ones were affected by them (such as Vaslui, Zalau, Targoviste, etc.).
The increasing rates of residential decentralization resulted in the growth of existing villages and towns in the metropolitan periphery, seldom inhabited by high-income suburban communities, but also increased local differentiation among urban neighbourhoods based on the centralization of investments. The rampant suburbanization was not only related to the residential sector, but also included an expansion of economic activities (big shopping centres, new industry, warehouses, office parks, etc.) made possible by the liberalized land market and the decentralised planning regulations [36,44].
There are two rather opposite processes that are manifested simultaneously. First, peri-urbanization, “commercialization” of cities and surrounding areas which did not involve only the spreading of the city but rather a gradual urbanization of the proximal rural areas similar to a percolation process [45]. It is a new phase in the evolution of cities, when urban concentration and suburbanization are replaced by dispersion and development of metropolitan areas that become socio-spatial entities grounded by various interdependencies. Secondly, one can identify a high level of geographic complexity both inside and outside the core city, which was encapsulated in the term of “perforated city” [46], suggesting a heterogeneous urban landscape that agglutinates both declined areas and developed neighbourhoods. The model is illustrated in the case study of Bucharest by Ianos et al. [42] who come to a generalised pattern showing a certain decreasing urbaneness in a large central area of the capital and increasing urbanisation both within the city core and along corridors or in urbanisation fronts outside, in the metropolitan area.
The general scenario in the shrinking cities issue in Romania could be synthesized following three stages. First, one could highlight the loss of the main economic engine of the city (usually industrial). Secondly, the decline can be seen concerning the urban endowments with utilities and services. Finally, the abandoned houses and people migrating are a decisive sign of urban shrinking [47].
There is a growing number of studies discussing Romanian urban resilience; while some focus on the actual causes and consequences of shrinkage [48,49,50], only a few represent explicit analyses of the interconnections induced by their simultaneousness and the consequent hierarchical changes, functional restructuring and spatial reconfiguration, against the background of globalization.
2. Objectives and Methodology
In the first place, the present paper proposes a typology of shrinking cities in Romania. It is a prerequisite in order to follow the main objective of the current paper which is to identify the mechanisms of resilience that are still available for the shrinking cities of Romania. An assumption of the present study is that urban shrinking is an adaptation to the new social-economic context, therefore different types of decline reflect the dynamics of various sub-systems integrated by the cities (society, economy, infrastructure, environment, etc.). “Path dependency” is a framework that can be used in order to identify trends, thresholds and actual trajectories for each type of shrinking citiy in order to highlight their different development paths. Finally, the results are used to draw strategic direction for shrinking cities’ regeneration in order to increase their resilience capacity.
Fifty Romanian cities surpassing 50,000 inhabitants were analysed, based on their functional specificity within the national urban system, given by a long-term urban status and administrative role (which differentiate them from small towns). An exception is Miercurea Ciuc that has never surpassed 45,000 inhabitants, but that was considered because of its administrative function in Harghita county, which does not include other bigger cities.
In the case of one indicator—the population in the metropolitan area—we took into consideration either the official metropolitan area (if that were the case) or the theoretical influence areas of the cities, calculated in a previous study as the surrounding territory within a distance of 20 km outside the core city built-up area, where socio–economic relations are stronger if one refers to workforce flows and daily services [51].
The first stage of the methodological approach was the identification of shrinking citiy categories taking into account some important markers of urban decline (Table 1).
The indicators were included in a multi-criteria assessment in order to highlight certain categories of cities according to their phase in the urban transition process and to their relative resilience capacity. First, the data were normalised and standardised by using Z scores. Secondly, a principal component analysis (PCA) was applied for exploring the connection between indicators. Finally, agglomerative hierarchy clustering (AHC) was used in order to differentiate between certain categories of shrinking cities in Romania that represent the five types of shrinkage. Except for the last class, where the least shrinking and the non-shrinking cities are included, the other four classes are balanced and show certain distinctive patterns (within-class variance of 40.8%, between-classes variance of 59.2%).
For the statistical analysis, XLStat 2016 Trial version was helpful in order to complete PCA and AHC.
The second stage included time series analysis in order to highlight the five classes of shrinking cities identified in the first stage.
The indicators taken into account reflect demographic, social–economic, infrastructural and environmental aspects that could create resilience capacity of the cities or, on the contrary, illustrate the existing vulnerabilities and lack of adaptability of Romanian shrinking cities: total population (1990–2016), the aging index (1992–2016), the number of employees (1991–2015), employees in education (1992–2015), the number of houses built (1990–2015), the number of beds in hospitals (1990–2015), quantities of distributed water (2000–2015) and the share of modernised streets (1990–2015). In other, previous, approaches these indicators (and others) were not used as time series, but as mean values for a certain period in order to illustrate the momentary resilience capacity [51,52]. Linear graphics of all the indicators listed above, taking the first year of the analysed period as the reference year and calculating the percentage of annual growth/decrease, was helpful to draw the timeline and to roughly identify the main trends and thresholds.
The evolution of the three main indicators taken into account—total population, number of employees and number of constructions built—was illustrated by their trajectory in the last 25 years (on the y-axis, the standardized value of the indicator in a given year, and on the x-axis, the value in the previous year). The trajectories we chosen for their readability and clearly show the effect of adapting cycles in the case of these cities [53]. The three indicators that were chosen for reasons of readability highlight the effects of adaptation processes in the case of the cities that were taken into account.
The main source of data for both stages was Tempo Database from the National Institute of Statistics of Romania, a free-access time-series database. Complementarily, additional databases (provided upon request also by National Institute of Statistics of Romania) were used, for example, for the total number of employers.
3. Results
The main results of the current approach of Romanian shrinking cities’ resilience capacity are, in the following order: the identification of shrinking cities typology, the time series analysis of the resilience capacity for each category and, finally, a trajectory analysis by taking into account the adaptive cycle(s) model in order to lay the groundwork for comprehensive measures aiming to increase urban resilience in Romania.
3.1. Typology of Romanian Shrinking Cities
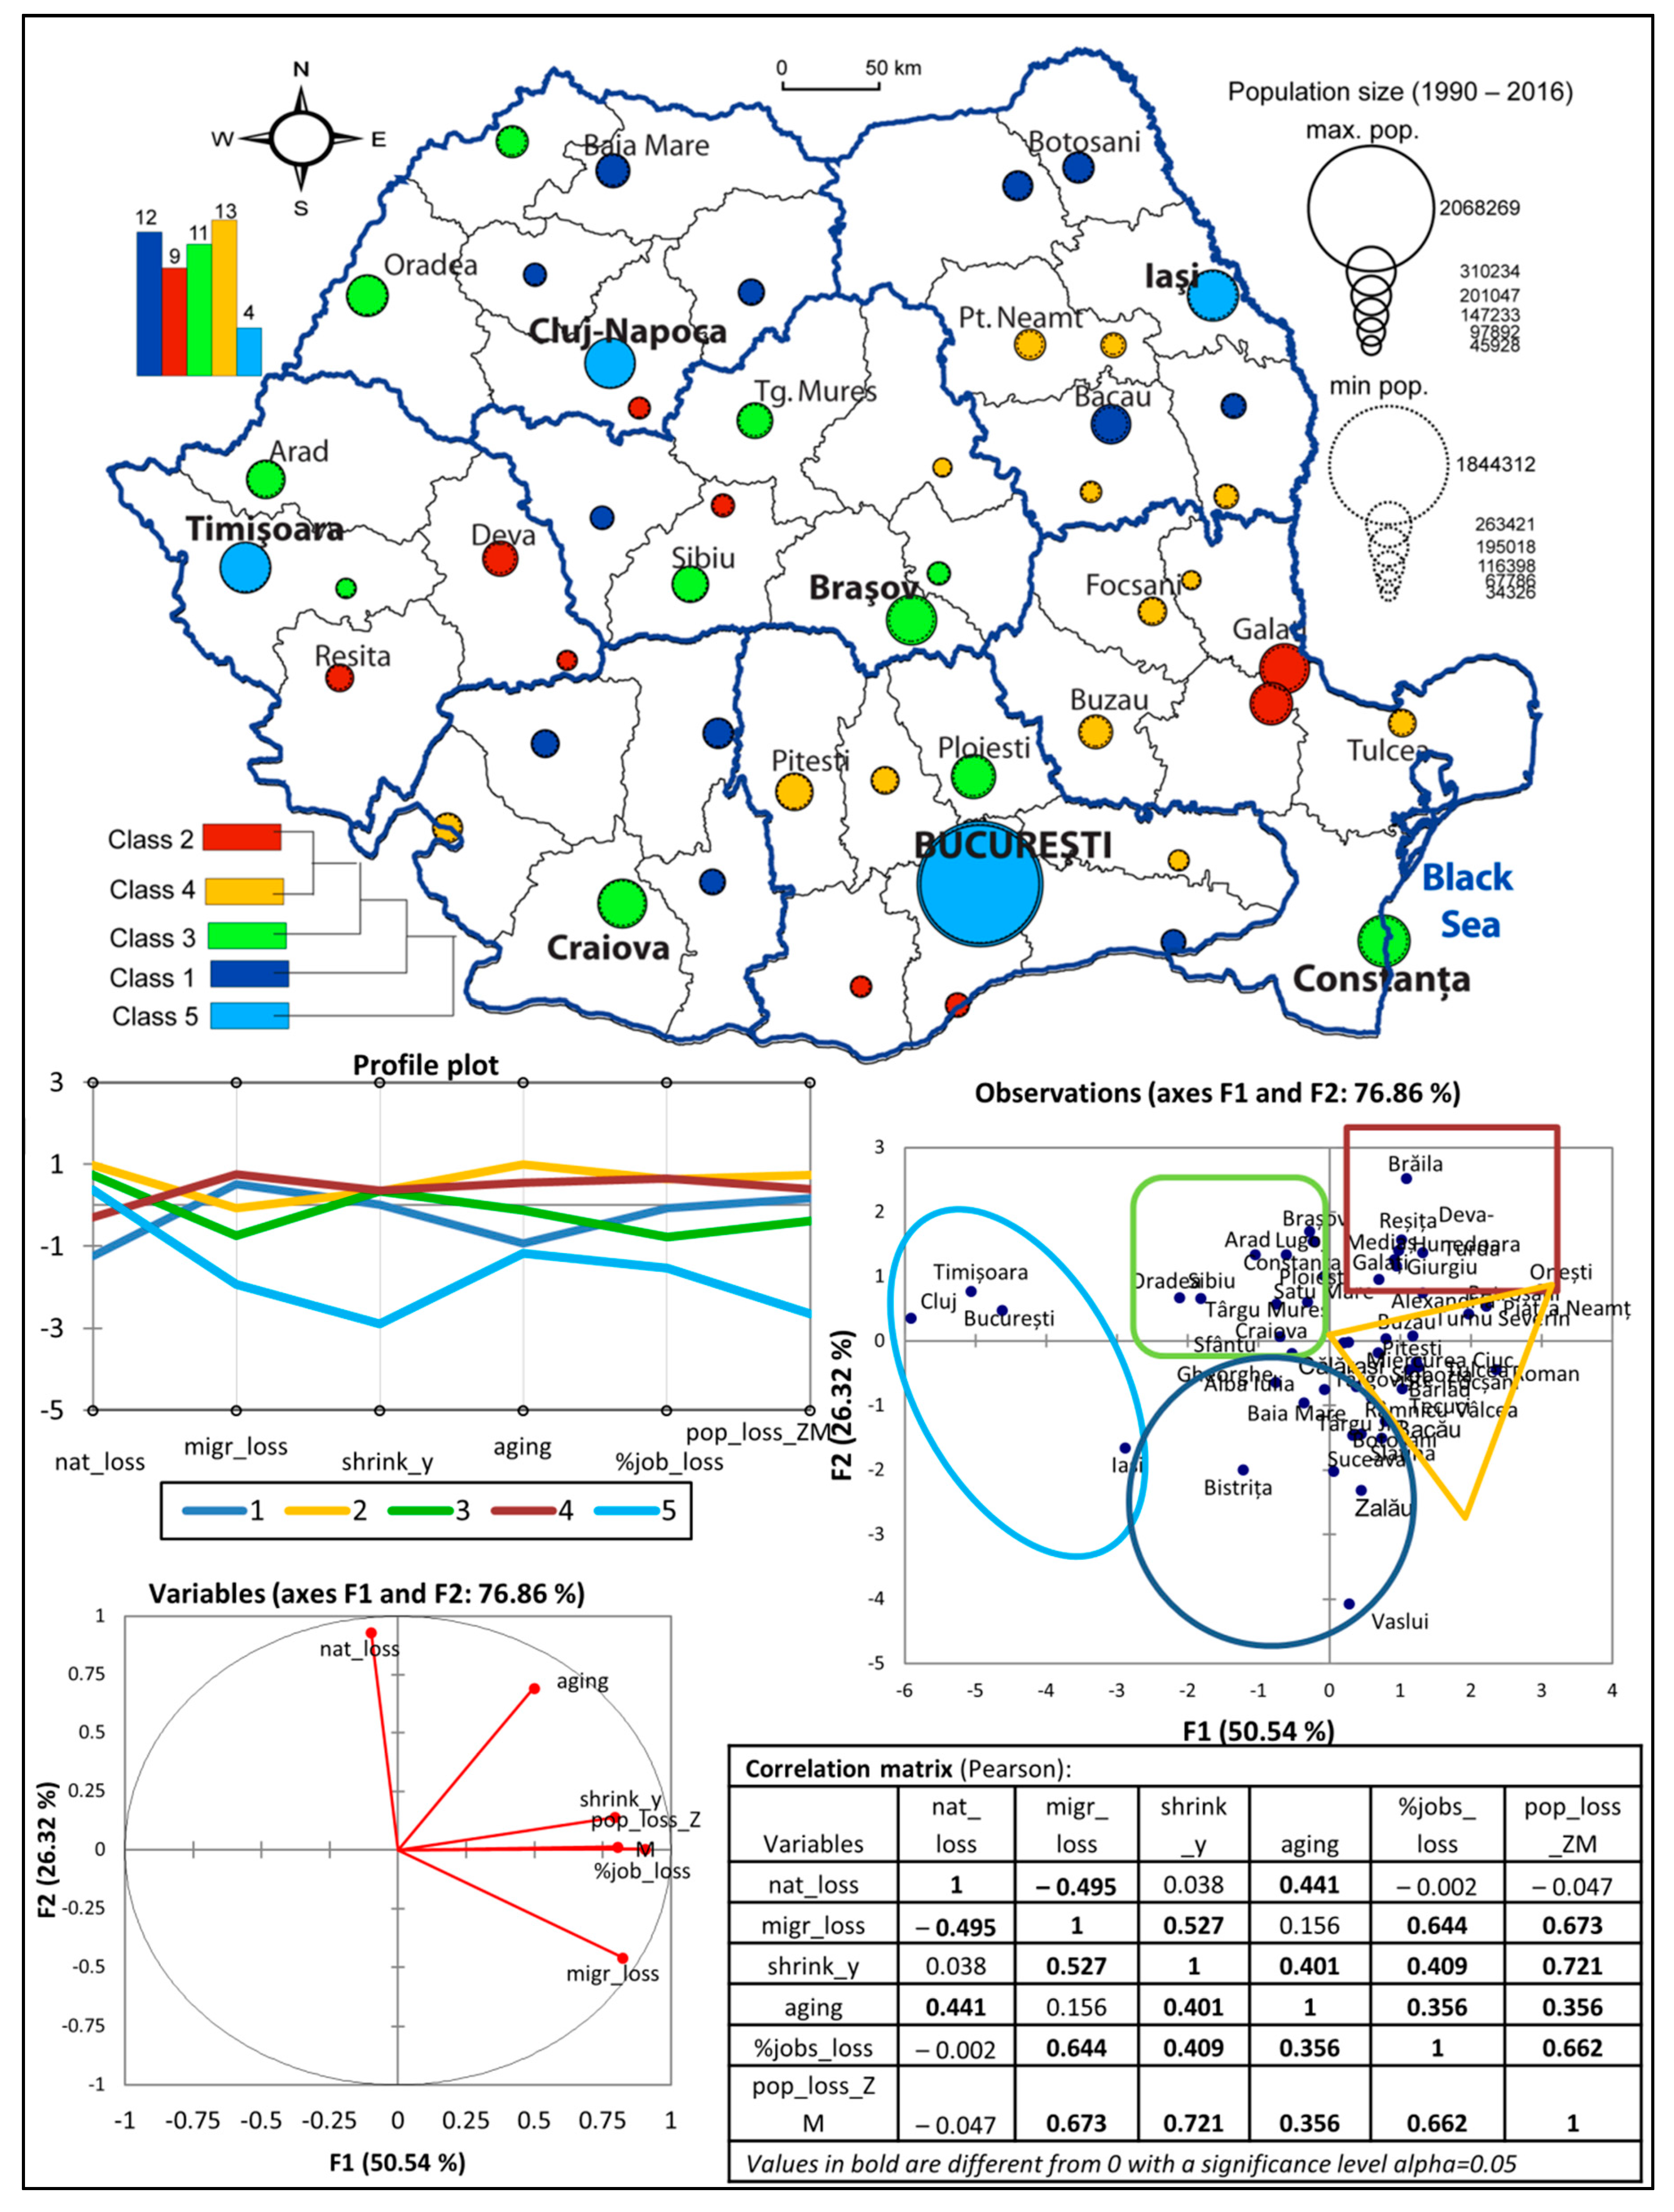
The values and multiannual dynamics of the six selected indicators that highlight the extent and the characteristics of shrinkage in Romanian cities were correlated in a principal component analysis. One can notice some basic interconnections that could help in describing the actual individuality of shrinking cities.
First, the natural loss of population, mainly due to decreasing birth rate, has a significant positive correlation coefficient with an aging index (0.441) and a negative correlation with the migration loss (−0.491).
More important, migration loss—which is the main demographic factor of shrinkage—is therefore very well correlated with the number of years with shrinking population (0.527), the number of jobs (0.644), but also with the population loss in the metropolitan areas (0.673). The last relation shows that attractive and dynamic cities that succeeded in maintaining a high number of available jobs have also developed in most functional and spatially coherent metropolitan areas [54].
Meanwhile, the number of years with a decreasing population, an aspect which actually defines shrinkage in the first place, is well correlated to the increasing aging index (0.401) and the decreasing number of jobs (0.409).
Last, but not least, the most extreme forms of shrinkage appear when we encounter both a significant population loss in the metropolitan area and a strong decrease in the number of employees (0.633) because of the lack of investments and the reduced intensity of economic activities [54].
The identified classes (Figure 3) correspond to different types of shrinkage and can be described in the following manner:
CLASS 1 (Episodically shrinking cities): natural growth and periodical shrinkage induced by migratory deficit. Although the aging index dynamics was highly positive, they all present certain vitality and high social–demographic resources that could be capitalized in the future. The cities—mainly the ones in the southern and northern regions—are of different sizes. Sometimes the positive natural balance hides shrinkage processes, at least for certain periods of time. These cities registered certain development trends (especially in industry and housing) during the communist period. The systematic pumping of significant funds led to a quasi-continuous growth of these cities within the national urban hierarchy (Slatina, Zalau, Vaslui) [55].
After 1989, they experienced a major break in their dynamics, which is shown by a decrease in their population. Many are polarizing urban centres, artificially developed in the communist period with oversized production capacities that were only partially used, implying an oversized work force. The closure of these production units has triggered chain reactions within the urban social– economic system.
CLASS 2 (Fast shrinking cities): facing natural deficit, significant growth of aging index, and a rather steep population decline after a positive balance in the 1990s. The former industrial, highly specialized cities have the highest decline of the number of employees and also do not have the necessary dynamic influence for sustaining their future development. This category includes Resita and Turda, both cities known as old industrial centres, with continuous development overtime, but without recent spectacular development.
There are also more specialised mining centres (Petrosani), steel industries (Galati, Hunedoara) or Danube ports (Galati, Braila, Giurgiu). The reduction in production capacities led to the dismissal of a significant part of the labour force in the late 1990s, when the privatization took place [41]. The situation was even worse in the economically mono-structured cities (Petrosani, Hunedoara), which continue to show certain numerous dysfunctions two decades after the fall of communism: low levels of development in the public infrastructure, environmental pollution, low attractiveness for investment [56].
CLASS 3 (Stabilized shrinking cities): also exhibit a higher natural deficit, but they are more attractive (they still have an important number of jobs and a reduced migratory deficit); however, they show the second largest population deficit compared to all the other classes, but only because they did now know a significant population growth in the 1990s. The category includes large cities that are also regional development poles (Constanta, Craiova, Ploiesti, Oradea, Brasov and Sibiu), as well as urban centres of local influence (Lugoj, Sfantu Gheorghe). Industrialized in the first part of socialist construction, subsequently diversifying on the basis of industry and (or) services. Brasov or Constanta, with a demographic decline especially justified by natural causes, and disadvantaged compared to other regional metropolises, are surrounded by a dense network of small towns that have not lost their own population.
CLASS 4 (Deep shrinking cities): are in the worst decline situation and include three poles of inadaptability—the medium-sized industrialized cities from the Moldova Region, the quasi-agrarian cities from the South and the industrial-mining towns from the West. Although in the 1990s they witnessed a very important, but inertial population growth, lately the shrinkage has become obvious—an important growth of the aging index, the smaller real estate expansion after 1990, a poor endowment with certain services (the most important decrease of number of beds in hospitals and distributed water) [51] and a steep decrease in the total number of employees compared to 1990. Shrinkage, in this case, is due, in a larger extent, to migratory deficits, while the natural growth hided the real dimension of the shrinkage. It is more reflected in structural effects such as diminishing tertiary function and ruralisation processes [55].
CLASS 5 (Least shrinking/non-shrinking cities): are big cities, including the capital, that faced a significant decline mainly because of natural negative balance (except for Iasi where the deficit was mainly migratory), but which are very attractive on national and regional level (positive migratory balance due to the attractiveness of the competitive economic environment and the high number of jobs). They have the lowest number of years with a population decline and smaller values of aging index because of the continuous “injections” of a young adult population coming for studying and/or working. Bucharest and Ilfov county reveal one of the most striking features of the economic growth in Romania: the hypertrophy of the country capital city (a characteristic which is specific to East European countries). It concentrates 8.8% of the national population, but gives 21% of the national GDP, 20% of the small and medium enterprises being located here and attracting 51.1% of the total foreign investments, bringing about the highest level of wages, services and prices and a large demand for skilled labour force [57].The three other cities (Cluj-Napoca, Iasi and Timisoara) are county capitals and are important regional poles with complex functions (administrative, economic, tourism and university) and a highly skilled labour force, which although confronted with periods of decline, have preserved their economic success. Nevertheless, inside all these cities that are in the strongest position in the Romanian urban system there are shrinking neighbourhoods with significant losses of population and economic activities [42].
3.2. Resilience Capacity in a Time Series Analysis of Romanian Shrinking Cities
A time-series analysis of indicators that reveal a certain capacity of resilience or vulnerability of urban areas was made in order to identify trends, thresholds and regime shifts.
A simple linear chronological evolution of right indicators was first taken into account (Figure 4).
The population loss (1) presents a rather similar path in case of the middle classes (2, 3 and 4) with a certain growth of population until 1996—as an inertial continuation of the demographic trends during the later communist period. These tendencies can be observed in the case of the first and last class, but, after 2006, the population stabilised at a higher level (because of the natural growth), in the first case, and at a slightly lower level in case of the second (mainly because of the migratory growth).
The aging index (2) shows rather similar patterns of continuous growth in the case of all the analysed cities, but with an accelerated rhythm in the case of the first and forth classes. The aging population affects, by default, cities with high migratory deficit (mainly the young population left), but also those that were more stable from this viewpoint, but witnessed a drop in the fertility rates in a relatively short time following the transition process.
Opposed to this, the number of employees (3) presents a significant decrease compared to 1991 in the case of all cities except for Bucharest—the only city with absolute growth. The phenomenon was based on the deindustrialisation process, but also on the general decline of population. Nevertheless, the decrease was not continuous and there was a significant increase from 2001 to 2009, but then, when the economic crisis affected Romania, the number of jobs was significantly reduced.
If one takes into consideration the green area per inhabitant (6) the recent dynamics are much more irregular because of administrative modifications of build-up areas and the lack of homogeneity in including/not including certain land uses in this category. Overall, a certain positive dynamic can be noticed, but the values are still lower than the EU recommendations. Nevertheless, in this case, the Capital and the other non-shrinking cities have the lowest values as the economic dynamism is an advantage to the other uses of the land inside these cities. The stabilised shrinking cities and the deep shrinking cities have the highest values and positive trends. It demonstrates that shrinking is sometimes an opportunity of a more sound environment, lowering densities and human impact.
More relevant for explaining shrinkage and adaptation processes, the number of houses built (4) reveals a general decrease in the 1990s and a revitalisation in the 2000s. The most dynamic seem to be the non-shrinking cities from the last class (Bucharest, Cluj-Napoca, Timisoara, Iasi), but also the stabilized shrinking cities from the third class (especially between 2005 and 2009). Nevertheless, outmigration in the short term and the drop of fertility in the medium term sometimes lead to substantial mismatches between the housing stock and the demand for it [36]. For most of the cities, the suburban expansion increased the total number of houses built in the metropolitan area, while in other cases, there was also an extension of residential areas in situ (Cluj-Napoca and, recently, in Timisoara, Iasi, Sibiu and Oradea).
A general decrease is also obvious in what concerns the number of beds in hospitals (5) which is an indicator of the urban resilience capacity. If compared to 1990, the values are nowadays lower with almost 40% in the case of second and forth classes, but only with less than 15% in the case of the last class. One single important moment of increasing capacity was in the first part of the 2000s, but the descendant path started again in 2004 and mostly during the crisis.
The same descendant path is also shown by the multiannual values for de quantities of distributed water (8). Although the data cover only the last 16 years, the tendencies are obvious and are the consequences of the lower population and the closing of many large industrial facilities that were also big consumers. The adaptation of drinking water distribution and wastewater systems to this evolution is highly needed to reduce losses in the system and the environmental impact.
The only resilience capacity indicator that shows a general positive evolution (although not at the extent and the rhythm that is demanded by population and authorities) is the share of modernised streets (7). The evolution is discontinuous and shows big inter-class differences. In the best position, there are the cities from the last class—the capital and the regional poles of development that knew significant investments in road infrastructure. Secondly, the cities from the third class showed, in the 1990s, a certain decrease on the basis of the lack of investments but also by including former rural areas that had a low percent of modernised roads, but which knew a sustained positive path during the 2000s.
Conversely, the first and the second class include cities where investments were not sustained in the last 15 years; therefore, they remained at values that are only 10% higher compared to the 1990s. At last, the forth class was the most disadvantaged during the first 15 years after the chute of communism, but since 2005, they have been included in investment projects so that they are at the same level with the last two classes mentioned above.
3.3. Adaptive Cycles—Key Moments, Trajectories, Thresholds and Strategies for Romanian Shrinking Cities
In Romania, one can notice certain moments of threshold that marked the urban evolution in alternative periods of order and turbulence [55]. The different trajectories of the cities included in the shrinking classes show certain key moments and regime shifts that, in some cases, overlay while in others they are offset.
The year 1989 represented the moment when the Romanian revolution took place in December which meant the chute of the communist regime and the beginning of a long transition process.
The period 1990–1997 can be assimilated to the conservation phase and in some cases the beginning of the release phase. After the revolution, the year 1990 was crucial, turning around the entire social and economic system and marking a shift in the process of urbanization. Even though the process of transition to the market economy and deindustrialization and consequently unemployment were being stared, initially many of the communist towns’ features were maintained. The migration from the city to the rural area that became dominant for the internal migration (counter-urbanization) acted in direct connection with the severe economic crises that affected the welfare of the population [58].
Between 1997 and 1999 (2000) an extensive privatization process took place (after a long delay), but also counter-urbanisation and tertiarisation that changed the urban structures and functions. Thus, the unemployment rate increased dramatically, the income level of the population decreased, and labour conflicts multiplied. Overall, Romania faced major macroeconomic problems, being on the brink of cessation of payments. This period can also be included in the release phase illustrated above, although in many cities this phase begun earlier.
The year 2000, with the beginning of the procedures for adhering to UE, is considered the beginning of economic recovery for Romania, with a growth that continued until 2008 when GDP peaked in real terms. Also, in 2001 the first metropolitan areas appear. After shifting the focus on the private sector and reforming the corporate tax system, real economic growth began. The whole period between 2000 and 2007, marked by the effort to attain the European acquis, can be assimilated to reorganisation (2004–2004) and exploitation phases (2004–2008). Nevertheless, in 2007, UE demanded certain new adaptation measure to a novel context, and this also meant significant investments, higher emigration and consumption.
The external global context of the economic crisis created a shortcut within the cycle and induced another, more or less unexpected, release phase (2008–2011) a period of vulnerability and reduced resilience capacity. The end of the crisis, after 2011, meant another beginning for a reorganisation phase with real opportunities to rebuild, reorganize and reindustrialize that were capitalized by certain cities. After shifting the emphasis on the private sector and reforming the tax system of companies, a consistent economic growth was registered.
The factors behind these trends are very diverse, pointing to the difficult period Romania has experienced on its way from a socialist centralized economy to a free-market and the efforts it had to make in order to adapt to the rigour and commitments imposed by the EU accession. These processes have involved not only significant efforts on behalf of the cities/counties/regions in order to adjust to the new economic environment, but also high social and economic costs, the cities/counties/regions that have failed to adapt effectively lagging behind as urban peripheries.
In this wider picture of overall evolution of Romania in the last 27 years, we included the trajectories of the identified classes of shrinking cities in order to identify features that individualize them in order to draw certain strategic directions for increasing their resilience capacity. If the first and the last class are quite particular, the other three (middle) classes show certain common paths (Figure 5 and Figure 6):
Class 1 shows a turbulent evolution at the beginning of the analysed period, but also at the end, while the 2000s were a period of constant and sustained growth, upset only by the economic crisis that was felt from 2008. They are less vulnerable to shrinking because of the recent economic diversification and the external remittances, but still lack important capacities that create jobs and attract population.
Class 2 and Class 4 had short moments of transformation and improvement, but showed a continuous process of shrinking. The moments of growth were short, like “false” phases of reorganisation, while the decline continued shortly afterwards. Taking into account the second class, the turbulences after 2004 were more consistent, showing certain signs of revitalization, but the crises stroke with the same intensity in both cases. Promoting diversification and innovation, on the basis of their former strong industrial profile and programs of adapting the workforce to new requirements are highly necessary in order to accelerate adaptation processes.
After an inertial population growth in the early 1990s, the shrinking cities from Class 3 confronted a constant decline of population, but from the economic and built infrastructure points of view, certain important investments and innovations were responsible for moments of turbulence that induced positive attributes and an emerging balanced development. In most cases these cities already have a leading role in diffusing, to a certain degree, innovation and within their regions and counties (Brasov, Constanta, Craiova, Targu Mures or even Sfantu Gheorghe).
Class 5 is the most turbulent one, crossing more cycles of adaptation, which is reflected especially by the number of employees and the number of constructions built per year, more sensitive to the transformations induced by national and European politics, using these perturbations for increasing its resilience. The fast cycles represent, for this city, a threat (as certain internationally induced crisis could strike them first and produce rapid damages), but also a real advantage for capitalising the higher social and economic resources, learning capacities and innovative potential.
The dynamics of the third and the last class demonstrates the emergence of regional metropolises that tend to become competitors of the capital, in a globalized economy that can lead to the reduction of national centralism. Meanwhile, the hierarchical position is not always a guarantee for a higher resilience capacity, nor the demographic size, when essential elements for adapting to the new paradigm of new economic geography are missing (i.e., primarily, the innovative environment, creative industries, etc.). On the contrary, we have evidence that cities of secondary rank (such as Sibiu or Oradea or even Targu Mures) are adapting faster than bigger ones, formerly more industrialized cities like Galati, Craiova or even Brasov.
A cause of the delay in completing the adaptation cycle in most of the analysed cities can also be found in the defective ways in which the privatization took place. Where the insertion of large international capital has been effective (Pitesti, to a certain extent, Arad and Ploiesti), the cycle appears to be shorter, at least on some levels, which is not the case in other situations (Galati, Resita, Onesti, etc.).
Another reason for the unjustified prolongation of shrinking, with effects that could lead to desurbanization or re-ruralisation in the case of small towns (not discussed here, but with effects in the urban peripheries of those taken into account), is the inability of public policies to produce an adequate infrastructure. The information taken into account largely demonstrates the slow rate of transformations when considering both intra-urban and inter-urban infrastructure.
Shrinking cities should redefine their social and economic basis and manage transitions towards new forms of social-economic and spatial organisation [59]. The shrinking itself can create certain advantages by decreasing urban densities and reducing the environmental impact. The response to urban shrinking is strongly influenced by the territorial context, the policies being directed towards reacting to demographic change (by proper targeted policies), reversing trends in economic indicators, adapting to the process of contracting and, finally, reinventing the city [10].
Possible strategies for Romania are linked to finding solutions for inducing economic development, diminishing the peripheralisation process both within urban system and inside cities, encouraging these areas to become attractive both residentially and from the viewpoint of job opportunities and leisure areas in a clean and sound environment. Actually, if taking into account the practices in Poland [60] and other former communist countries were the transition was shorter, the strategies can be applied “in situ” oriented towards reducing unemployment by stimulating entrepreneurship or by revitalisation programmes (e.g., mining heritage conservation, urban core renewal, reuse of industrial buildings for culture and education projects or even for tourist activities etc.) or by empowering network strategies oriented towards polycentrism or improvement of transport accessibility.
4. Discussion and Conclusions
Analysing urban resilience is not only relevant for assessing the potential progress made after dealing with natural hazards, but also to other growing concerns, such as demographic changes and their impact on critical infrastructure, general services or transportation, which also influence urban vitality and liveability. By consequence, shrinking cities and resilient cities are two major themes that should be studied and included in policies in an integrated manner. The shrinkage of Romanian cities is an important issue that has to be effectively managed by national, regional and local authorities, but it is also an opportunity to gain more resilience, to re-structure the whole urban system and the individual cities as functional systems.
The analysis shows that out-migration, reducing number of employees, jobs loss and, in the long run, ageing are the most important factors of urban shrinkage in Romania.
The five types of shrinkage demonstrate the existence of different adaptation speeds/rhythms and trajectories that make it difficult to apply uniform measures. Meaningful policies by implementing customized actions are required, depending on the profile of each category (class) or city, the territorial capital and the path they have taken in the last decades.
The challenge that remains is to create flexible urban strategies in highly uncertain environments that can accommodate population changes, as well as changes in socio–economic composition. The idea is to introduce a paradigm shift from growth-oriented planning to “smart shrinking”, focusing on the remaining assets and possible innovations.
In order to be effective, all these strategies need to take into account not only the local scale but also the regional, national and international context while promoting regional cooperation and cross-scale interactions (described by the panarchy model of resilience theory, which is the key in driving essential changes and pushing urban systems across thresholds [22,61].
Meanwhile, a key-point of any strategy for shrinking cities is the involvement of the community in order to promote more effectively the principles of re-growing smaller, more resilient and more sustainable. According to the current trends in territorial planning, it is appreciated that it is not advisable to oppose the natural evolution of cities, but rather to induce certain conditions in order to delay particular moments while preparing the system for adapting the new phases and regimes.
Acknowledgments
This work has been financially supported by the Department of Geography from the “Alexandru Ioan Cuza” University of Iasi, Romania.
Author Contributions
All three authors equally contributed to the development of the framework and writing of the manuscript. Alexandru Bănică managed the coordination process, and worked on the literature review, methodology, statistical analysis and results interpretation. Marinela Istrate and Ionel Muntele contributed to creating the statistical database, literature review, theoretical background and interpretation of results.
Conflicts of Interest
The authors declare no conflict of interest.
References
- Herrmann, D.; Shuster, W.; Mayer, A.; Garmestani, A. Sustainability for Shrinking Cities. Sustainability 2016, 8, 911. [Google Scholar] [CrossRef]
- Chelleri, L.; Olazabal, M. Multidisciplinary Perspectives on Urban Resilience. 2013. Available online: https://www.researchgate.net/file.PostFileLoader.html?id=5500525dd4c118f27c8b45c2&assetKey=AS%3A273739982278661%401442276105477 (accessed on 6 December 2017).
- COST. Cities Regrowing Smaller, COST Action TU0803, 2012. Available online: http://www.shrinkingcities.eu (accessed on 15 August 2017).
- Wiechmann, T. Conversion strategies under uncertainty in post–socialist shrinking cities—The example of Dresden in Eastern Germany. In The Future of Shrinking Cities—Problems, Patterns and Strategies of Urban Transformation in a Global Context; Center for Global Metropolitan Studies: Berkeley, CA, USA, 2009. [Google Scholar]
- Musterd, S. A Conceptual Framework for Shrinking Cities Research. In Proceedings of the Shrinking Cities in Europe—Final Conference of the COST Action “Cities Regrowing Smaller” (CIRES), Zeche Zollverein, Essen, Germany, 12–13 September 2013. [Google Scholar]
- Bailesteanu, A.A. A loosing combination for Romanian Cities? 2005. Available online: http://www.pub.incd.ro/PP/Arhiva/v1-8a05.pdf (accessed on 6 December 2017).
- Martinez-Fernandez, C.; Audirac, I.; Fol, S.; Cunningham-Sabot, E. Shrinking cities: Urban challenges of globalization. Int. J. Urban Reg. Res. 2012, 36, 213–225. [Google Scholar] [CrossRef] [PubMed]
- Grossman, K. Declining Cities—Rising Futures? City Futures: Chicago, IL, USA, 2004. [Google Scholar]
- Pallagst, K.; Aber, J.; Audirac, I.; Cunningham-Sabot, E.; Fol, S.; Martinez-Fernandez, C.; Moraes, S.; Mulligan, H.; Vargas-Hernandez, J.; Wiechmann, T. The Future of Shrinking Cities—Problems, Patterns and Strategies of Urban Transformation in a Global Context. 2009. Available online: http://iurd.berkeley.edu/catalog/Other/Future_Shrinking_Cities_Problems_Patterns_and_Strategies_Urban_Transformation_Global (accessed on 6 December 2017).
- Wiechmann, T. Types of Shrinking Cities—Introductive Notes on a Global Issue International Symposium “Coping with City Shrinkage and Demographic Change—Lessons from Around the Globe. 2006. Available online: http://archiv.schader-stiftung.de/docs/wiechmann_presentation.pdf (accessed on 6 December 2017).
- Wolff, M.; Fol, S.; Roth, H.; Cunningham-Sabot, E. Shrinking Cities: Measuring the Phenomenon in France, 2013. Available online: https://cybergeo.revues.org/28033 (accessed on 6 December 2017).
- Cottineau, C. A Multilevel Portrait of Shrinking Urban Russia. 2016. Available online: https://eps.revues.org/6123 (accessed on 6 December 2017).
- Burkholder, S. The New Ecology of Vacancy: Rethinking Land Use in Shrinking Cities. Sustainability 2012, 4, 1154–1172. [Google Scholar] [CrossRef]
- Rocak, M.; Hospers, G.-J.; Reverda, N. Searching for Social Sustainability: The Case of the Shrinking City of Heerlen, The Netherlands. Sustainability 2016, 8, 382. [Google Scholar] [CrossRef]
- Allen, C.R.; Birge, H.E.; Bartelt-Hunt, S.; Bevans, R.A.; Burnett, J.L.; Barbara Cosens, A.; Cai, X.; Garmestani, A.S.; Linkov, I.; Scott, E.A.; et al. Avoiding Decline: Fostering Resilience and Sustainability in Midsize Cities. Sustainability 2016, 8, 844. [Google Scholar] [CrossRef]
- Petrisor, I.A.; Meita, V.; Petre, R. Resilience: Ecological and Socio-Spatial models evolve while understanding the equilibrium. Urban. Arhit. Constr. 2016, 7, 341–348. [Google Scholar]
- Holling, C.S. Resilience and Stability of Ecological Systems. Annu. Rev. Ecol. Syst. 1973, 4, 1–23. [Google Scholar] [CrossRef]
- Walker, B.; Salt, D. Resilience Thinking. Sustaining Ecosystems and People in a Changing World; Island Press: Washington, DC, USA, 2006. [Google Scholar]
- Martin, R. Regional Economic Resilience, hysteresis and recessionary shocks. J. Econ. Geogr. 2012, 12, 1–32. [Google Scholar] [CrossRef]
- Folke, C. Resilience: The emergence of a perspective for social–ecological systems analyses. Glob. Environ. Chang. 2006, 16, 253–267. [Google Scholar] [CrossRef]
- Pendall, R.; Foster, K.A.; Cowell, M. Resilience and regions: Building understanding of the metaphor. Camb. J. Reg. Econ. Soc. 2010, 3, 71–84. [Google Scholar] [CrossRef]
- Gunderson, L.H.; Holling, C.S. Panarchy. In Understanding Transformations in Human and Natural Systems; Island Press: Washington, DC, USA, 2002. [Google Scholar]
- Rocha, J.C.; Peterson, G.D.; Biggs, R. Regime Shifts in Anthropocene: Drivers, Risks and Resilience. 2015. Available online: http://journals.plos.org/plosone/article/file?id=10.1371/journal.pone.0134639&type=printable (accessed on 6 December 2017).
- Schlappa, H.; Neill, W.J.V. Cities of Tomorrow—Action Today. URBACT II Capitalisation. In Crisis to Choice: Re-Imagining the Future in Shrinking Cities; URBACT: Saint-Denis, France, 2013. [Google Scholar]
- Peterson, G. Creative Shrinkage, 2006. Available online: http://rs.resalliance.org (accessed on 15 August 2017).
- Heins, P. Embracing Smart Decline. Agora J. Urban Plan. Des. 2012, 1–6. Available online: http://hdl.handle.net/2027.42/120384 (accessed on 6 December 2017).
- Enserink, M. Resilient Shrinking, 2014. Available online: www.toposonline.nl (accessed on 20 July 2017).
- Boschma, R. Towards an evolutionary perspective on regional resilience. Reg. Stud. 2015, 49, 733–751. [Google Scholar] [CrossRef]
- Simmie, J.; Martin, R. The economic resilience of regions: Towards an evolutionary approach. Camb. J. Reg. Econ. Soc. 2010, 3, 27–43. [Google Scholar] [CrossRef]
- Martin, R.; Sunley, P. On the Notion of Regional Economic Resilience: Conceptualisation and Explanation. J. Econ. Geogr. 2015, 15, 1–42. [Google Scholar] [CrossRef]
- Gigante, A.A. Reviewing Path Dependence Theory in Economics: Micro–Foundations of Endogenous Change Processes, Munich Personal RePEc Archive (MPRA), Paper No. 75310, 2016. Available online: https://mpra.ub.uni-muenchen.de/75310/ (accessed on 6 December 2017).
- Martin, R.; Simmie, J. Path dependence and local innovation systems in city-regions. Innovation 2008, 10, 183–196. [Google Scholar] [CrossRef]
- Antonelli, C. The Economic Complexity of Technological Change. Interactions, Knowledge Interaction and Path Dependence. In Handbook on the Economic Complexity of Technological Change; Antonelli, C., Ed.; Edward Elgar Publishing: Cheltenham, UK, 2011. [Google Scholar]
- Romero-Lankao, P.; Gnatz, M.D.; Wilhelmi, O.; Hayden, M. Urban Sustainability and Resilience: From Theory to Practice. Sustainability 2016, 8, 1224. [Google Scholar] [CrossRef]
- Doussard, M.; Peck, J.; Nik, T. After Deindustrialization: Uneven Growth and Economic Inequality in “Postindustrial” Chicago. Econ. Geogr. 2009, 85, 183–207. [Google Scholar] [CrossRef]
- Olsen, A. Shrinking cities: Fuzzy concept or useful framework? Berkeley Plan. J. 2013, 26, 107–132. [Google Scholar]
- Ronnås, P. Centrally-planned Urbanization: The Case of Romania. Geogr. Ann. Ser. B Hum. Geogr. 1982, 64, 143–151. [Google Scholar] [CrossRef]
- Enyedi, G. Urbanisation in East Central Europe: Social processes and societal responses in the state socialist systems. Urban Stud. 1992, 29, 869–880. [Google Scholar] [CrossRef]
- Popescu, C.R. The Romania’s Industry in the 20th Century. Geographical Analysis; Oscar Print: Bucharest, Romanian, 2000; p. 280. (In Romanian) [Google Scholar]
- Koritz, D. Restructuring or destructuring: Deindustrialization in two industrial heartland cities. Urban Aff. Q. 1991, 26, 497–511. [Google Scholar] [CrossRef]
- Popescu, C. Deindustrialization and urban shrinkage in Romania. What lessons for the spatial policy? Trans. Rew. Adm. Sci. 2014, 10, 181–202. [Google Scholar]
- Ianos, I.; Sirodoev, I.; Pascariu, G.; Henebry, G. Divergent patterns of built-up urban space growth following post-socialist changes. Urban Stud. 2016, 53, 3172–3188. [Google Scholar] [CrossRef]
- Oswalt, P. Shrinking Cities. Hypotheses on Urban Shrinking in the 21st Century, Project Shrinking Cities. 2009. Available online: http://www.shrinkingcities.com/hypothesen.0.html?&L=1 (accessed on 4 August 2017).
- Hirt, S.; Stanilov, K. Twenty Years of Transition: The Evolution of Urban Planning in Eastern Europe and the Former Soviet Union, 1989–2009; Human Settlements Global Dialogue Series; UN HABITAT: Nairobi, Kenya, 2009. [Google Scholar]
- Diappi, L. (Ed.) Evolving Cities: Geocomputation in Territorial Planning; Routledge: Abington, UK, 2004. [Google Scholar]
- Florentin, D. The ‘Perforated City’: Leipzig’s Model of Urban Shrinkage Management. Berkeley Plan. J. 2010, 23, 83–101. [Google Scholar]
- Paun Constantinescu, I. O Arhitectă a Mers în 60 de orașe Românești Abandonate ca să Caute un Tratament la Depresia Postcomunistă. 2016. Available online: https://republica.ro/o-arhitecta-a-mers-in-60-de-orase-romanesti-abandonate-ca-sa-caute-un-tratament-la-depresia-postcomunista (accessed on 15 August 2017). (In Romanian).
- Șerban, P.R.; Tălângă, C. Is social resilience an economic structure issue or just the ability of communities to cope with external stress? J. Urban Reg. Anal. 2015, 7, 59–68. [Google Scholar]
- Benedek, J.; Lembcke, A.C. Characteristics of recovery and resilience in the Romanian regions. EJES 2017, 8. forthcoming. [Google Scholar]
- Gaman, M.S.; Bica, S.; Badescu, Ș.; Branea, A.M. Sustainability Analysis of Romanian Shrinking Cities. In Proceedings of the Conference Paper, International Multidisciplinary Scientific Conferences on Social Sciences & Arts—SGEM Conference on Arts, Architecture and Design 2014, Book 4: Arts, Performing Arts, Architecture and Design, Albena, Bulgaria, 2–7 September 2014. [Google Scholar] [CrossRef]
- Banica, A.; Muntele, I. Romanian Functional Urban Areas. Between Polarization and Spatial Resilience. In Proceedings of the Resilient Cities 2013 Congress, Bonn, Germany, 31 May–2 June 2013; Available online: http://resilient-cities.iclei.org/fileadmin/sites/resilient-cities/files/Images_and_logos/Resilience_Resource_Point/RC2013_Banica_Muntele_01.pdf (accessed on 4 August 2017).
- Banica, A.; Muntele, I. Urban Vulnerability and Resilience in Post-Communist Romania (Comparative Case Studies of Iasi and Bacau Cities and Metropolitan Areas). Carpathian J. Earth Environ. Sci. 2015, 10, 157–169. [Google Scholar]
- Bretagnolle, A.; Pumain, D.; Vacchiani-Marcuzzo, C. Les formes des systemes de villes dans le monde. Antrhopos-Economica 2007, 5, 301–314. [Google Scholar]
- Ionescu-Heroiu, M.; Burduja, S.; Sandu, D.; Cojocaru, Ș.; Blankespoor, B.; Iorga, E.; Moretti, E.; Moldovan, C.; Man, T.; Rusu, R.; et al. Competitive Cities—Reshaping the Economic Geography of Romania; The World Bank: Washington, DC, USA, 2013; p. 247. [Google Scholar]
- Ianos, I. Dinamica Urbana. Aplicatii la Orasul si Sistemul Urban Romanesc; Editura Tehnica: Bucharest, Romanian, 2004. (In Romanian) [Google Scholar]
- Benedek, J. Spatial differentiation and core-periphery structures in Romania. East. J. Eur. Stud. 2015, 6, 49–61. [Google Scholar]
- Istrate, M.; Horea-Serban, R. Economic Growth and Regional Inequality in Romania. Available online: http://geografie-uoradea.ro/Reviste/Anale/Art/2016-2/10.AUOG_717_Istrate.pdf (accessed on 9 December 2017).
- Sandu, D. Urbanizarea in Romania; University of Bucharest: Bucharest, Romanian, 2007. (In Romanian) [Google Scholar]
- Kommission, E. Cities of Tomorrow: Challenges, Visions, Ways Forward; Publication Office of the European Office: Rue Mercier, Luxembourg, 2001. [Google Scholar]
- Stryjakiewicz, T.; Ciesiółka, P.; Jaroszewska, E. Urban shrinkage and the postsocialist transformation: The case of Poland. In Proceedings of the Amsterdam Conference, Amsterdam, The Netherlands, 16–17 February 2011. [Google Scholar]
- Ernstson, H.; van der Leeuw, S.E.; Redman, C.L.; Meffert, D.J.; Davis, G.; Alfsen, C.; Elmqvist, T. Urban Transitions: On Urban Resilience and Human-Dominated Ecosystems. AMBIO 2010, 39, 531–545. [Google Scholar] [CrossRef] [PubMed]

Figure 2.
Adaptive cycle in the evolution of cities (Source: [24]).
Figure 2.
Adaptive cycle in the evolution of cities (Source: [24]).

Figure 3.
The shrinking cities of Romania, a multi-criteria analysis.

Figure 4.
The dynamics of certain resilience capacity indicators for each category of shrinking cities. Indicators: (a):Total population (% of number of inhabitants in 1990), (b): Age index (% of age index value in 1992), (c): Employment (% of number of employees in 1991), (d): Built houses (% of number of built houses in 1990), (e): Beds in hospitals (% of number of beds in hospitals in 1990), (f): Green areas per capita (% of hectares of green areas/no. of inhabitants in 1993), (g): Modernised streets (% of the share of modernised streets in 1990), (h): Distributed water (% of water distributed in 2000 in cubic meters), (Data source: INS of Romania).

Figure 5.
The trajectories of Romanian shrinking cities—the evolution of total population (a–e) and total number of employees (f–j) by each class (on x–axis—standardized value at time t, on y-axis—standardized value at time t + 1) (Data source: INS). (Data source: INS of Romania).
Figure 5.
The trajectories of Romanian shrinking cities—the evolution of total population (a–e) and total number of employees (f–j) by each class (on x–axis—standardized value at time t, on y-axis—standardized value at time t + 1) (Data source: INS). (Data source: INS of Romania).

Figure 6.
The trajectories of Romanian shrinking cities—changes in the number of built-up houses by each class (a–e) (on x–axis—standardized value at time t, on y–axis—standardized value at time t + 1) (Data source: INS).
Figure 6.
The trajectories of Romanian shrinking cities—changes in the number of built-up houses by each class (a–e) (on x–axis—standardized value at time t, on y–axis—standardized value at time t + 1) (Data source: INS).


Table 1.
Variables used for identifying the types of shrinking cities.
| Variables | Description |
|---|---|
| NAT_Loss | The natural loss of population in the last 20 years (1996–2015) |
| Migr_Loss | The migratory loss of population in the last 20 years (1996–2015) |
| Shrink_y | Number of years with decreasing population in the last 20 years |
| Aging | The difference between the value of ageing index at the end and at the beginning of the period (1996–2015) |
| %Jobs_Loss | The decrease in total number of employees in the last 20 years (1996–2015) |
| Pop_Loss_ZM | The decrease in total population of metropolitan areas in the last 20 years (1996–2015) |
© 2017 by the authors. Licensee MDPI, Basel, Switzerland. This article is an open access article distributed under the terms and conditions of the Creative Commons Attribution (CC BY) license (http://creativecommons.org/licenses/by/4.0/).
Share and Cite
MDPI and ACS Style
Bănică, A.; Istrate, M.; Muntele, I. Challenges for the Resilience Capacity of Romanian Shrinking Cities. Sustainability 2017, 9, 2289. https://doi.org/10.3390/su9122289
AMA Style
Bănică A, Istrate M, Muntele I. Challenges for the Resilience Capacity of Romanian Shrinking Cities. Sustainability. 2017; 9(12):2289. https://doi.org/10.3390/su9122289
Chicago/Turabian StyleBănică, Alexandru, Marinela Istrate, and Ionel Muntele. 2017. "Challenges for the Resilience Capacity of Romanian Shrinking Cities" Sustainability 9, no. 12: 2289. https://doi.org/10.3390/su9122289
Note that from the first issue of 2016, this journal uses article numbers instead of page numbers. See further details here.