Article

Ecosystem Services Value Assessment and Uneven Development of the Qingjiang River Basin in China

1
School of Environmental Studies, China University of Geosciences (Wuhan), Wuhan 430074, China
2
School of Arts Communication, China University of Geosciences (Wuhan), Wuhan 430074, China
3
Department of Geography, Kent State University, Kent, OH 44242, USA
4
School of Economics and Management, Guangxi Normal University, Guilin 541004, China
5
School of Public Administration, China University of Geosciences (Wuhan), Wuhan 430074, China
6
School of Information, Kent State University, Kent, OH 44242, USA
*
Authors to whom correspondence should be addressed.
Sustainability 2017, 9(12), 2356; https://doi.org/10.3390/su9122356
Submission received: 11 August 2017 / Revised: 7 December 2017 / Accepted: 8 December 2017 / Published: 18 December 2017

Abstract

:
As an important ecological barrier in Southwest China, the Qingjiang river basin plays a vital role in shaping the mountainous terrain. This paper analyzes the Ecosystem Services Value (ESV) using a series of methods based on the data of changes in land use from 2000 to 2015 and the statistical yearbook. The changes in land use between 2000 and 2015 were dominated by forest land, which accounted for 60.63% of the total area, followed by arable landwhich accounted for about 22.26%, while grassland and other land use contribution rates were the lowest, accounting for only about 17.11%. Environmental changes and economic development were uneven. The regional comprehensive strength of En’shi City, Changyang County, and Yidu City were among the highest, while Badong County, Hefeng County, and Wufeng County were among the lowest in the area under study. In addition, the ESV in 2035 was estimated to be 1.56 billion dollars, a decrease of 27.64% when compared with the year 2000. The ESV of Yidu City, Lichuan City, Jianshi County, and Hefeng County grew faster, at the rates of 94.76%, 65.12%, 96.96%, and 92.38%, respectively. However, the ESV of En’shi City, Badong County, Wufeng County and Xuan’en County showed a downward trend, at the rates of −32.53%, −487.80%, −368.07%, and −181.52%, respectively.

1. Introduction

The physical environment provides ecological goods and services for human beings. The increasing pace of industrialization and urbanization today has challenged the ecosystem, resulting in an increasing scarcity of ecosystem services (ES). The protection of the ecosystem, and the enhancement of ES, has become a pressing issue around the world. In 1976, Bailey [1] proposed a ranking system for the eco-region in the USA, dividing the country into several eco-regions based on domain, division, provincial, and section. Researchers have conducted studies around the world on the division of eco-regions and ES functions [2,3,4,5,6,7,8]. Nevertheless, few studies have analyzed the function and effects using ecological assets, ES function, ecological vulnerability, and ecological sensitivity [9,10]. Chinese scholars have intensively examined the ecosystem services value (ESV) measurement in many regions, and the ESV calculation proposed by Ouyang et al. [11,12,13,14,15] is among the most influential. However, these studies did not consider the spatial heterogeneity due to the spatial variation of land use change. At the same time, there has been a paucity of research on the classification of regional ecological systems, apart from such cases as that by Li et al. [16], who analyzed the effect of ecological vulnerability and sensitivity in the ESV of Shiyang river basin in Northwest China. In addition, current studies on spatial and temporal variations of ESV have not fully explored the impact of the coupled human-environment impact on the ESV [17].
The watershed ecosystem provides a variety of services: it provides human beings with clean water; helps irrigate farmland; maintains biodiversity; and promotes economic development with hydro-electric power. However, with the acceleration of industrialization and urbanization, the basin suffers from vegetation deterioration, water loss, expansion of erosion areas, serious degradation of ES functions, and adds to the intense dilemma between economic development and environmental protection [18]. Meanwhile, the urgency for coordination between maintaining basin integrity and cross-regional environmental management is increasing [19]. The watershed ecosystem is a huge compound ES made up of social, economic and natural elements [20]. Due to the regional distribution differences in the river basin, the subsystems differ in the size, shape, number, and type, which affect the energy flow, materials conveyance, and species change in the basin [21]. The watershed ecosystem is maintained through the cycling process of water, carbon, oxygen, nitrogen, and other substances, of which the water resource is the key element in retaining the health of the entire ecosystem and providing for the sustainable development of social economy. Since most ESVs cannot be reflected in the conventional commodity market, it “weighs” less or attracts less attention when making social development decisions. If the value can be quantified, it can make people have a full understanding of the status and role of the watershed ecosystem in supporting economic development, maintaining a healthy ecosystem, and improving human well-being [22]. This awareness is also conducive to helping decision-makers seek reasonable methods of basin resources allocation and ecosystem management [23]. The quantitative assessment of ecosystem services is an important and scientific basis for formulating the ecological compensation mechanism and implementing ecological restoration.
The ecological pollution in the Qingjiang river basin not only restricts economic development, but also produces a negative effect on the ecological safety and economy of the middle and lower reaches of the Qingjiang river basin. From March 2016 to early March 2017, our research team investigated the middle and lower reaches of the Qingjiang river basin four times via interviews, as well as online and offline questionnaires. The following facts were revealed:
  • According to the investigation and statistics of Hubei Provincial Bureau of Land and Resources in recent years, due to the expansion of cities in Qingjiang river basin and the large-scale cultivation of cash crops by farmers, the vegetation coverage of these cities decreased from 61.05% in 2000 to 49.41% in 2015, far lower than that of the entire river basin.
  • The water and soil erosion are severe in the Qingjiang river basin due to such natural disasters as floods, droughts, landslides, and collapses, and its ecosystem comprehensive index is 0.95 [16], with 0 and 1 being the thresholds; the greater the value, the higher the overall risk, thus indicating that it is a high-risk area.
Taking the Qingjiang river basin as the case study area, this paper utilizes the weighted sum model, the Analytic Hierarchy Process (AHP) method, and the location entropy method to examine the space-time dynamics of ESV between 2000 and 2015 and makes predictions on the ESV from 2016 to 2035. At the same time, it takes the natural and social factors of each administrative unit into consideration, which has made this research more operable [24]. This is conducive to the establishment and improvement of the ecological compensation mechanism in the study area and is helpful to promote sustainable development of the ecological environment in the Qingjiang river basin, as well as provide reference for other similar work.

2. Study Area

The Qingjiang river is located in Southwest China (108°35′–111°35′ E, 29°33′–30°50′ N), and originates in Miaowan Village on the west of Qiyue Mountain at Lichuan City in Hubei province. It flows into the Qingjiang river basin at Lucheng Town in Yidu City and covers 10 counties/cities from the west to the east, with the upper reaches in Lichuancity, Jianshi County, and Xianfeng County, the middle reaches in En’shi City, Xuan’en County, Badong County, and Hefeng County, and the lower reaches in Changyang County, Wufeng County, and Yidu City. According to the statistics in 2014, the arable area in the Qingjiang river basin is 4.39 million ha, which accounts for 12.4% of the total land area. Moreover, the total population is 4.31 million with a density of 0.69 ha per person and arable land per capita of 0.01 ha. The main stream in the Qingjiang river basin is 423.32 km long, with a drainage area of 1.7 million ha2 and a natural fall of 1430.71 m. The Tujia people and Miao people live in the basin, accounting for 35.01% of total population (Figure 1) in the area.

3. Materials and Methods

3.1.Data Collection

Landsat Thematic Mapper Plus TM/ Enhanced Thematic Mapper Plus (ETM+) multispectral Remote Sensing (RS) images from 2000 to 2015 in the study area were divided into four equal time periods (2000, 2005, 2010, 2015) and the image resolution is 30 m. The WG 84 geographic coordinate system was selected and, after image fusion and enhancement, vegetation information could be extracted from where the best bands overlapped. The training samples were constructed using the prior knowledge, the remote sensing images were classified and supervised, and the initial classification results were obtained. The use of ENVI 5.1 geometric correction controlled the error to within 0.5 pixels. Combined with China’s Land and Resources Bureau second land use survey data (1:10,000), eight groups of land use types were extracted in each of the four periods. The types included irrigated land, dry land, forest land, shrub land, orchard land, high grassland, low cover land, and other land (Table 1).
The index of water and soil loss, floods, rocky desertification, disaster hazard, ecological loss, water system map, slope map, and administrative boundary map of Qingjiang river basin were extracted according to the 12th Five-Year Plan for Prevention and Control of Geological Disasters in Hubei Province and the En’shi Economic and Social Development Plan for the 12th Five-Year Plan. Other data was acquired from the Hubei Statistical Yearbook.

3.2. Introducing Ecosystem Services Value Model

The researchers first introduced the correction factor of the ecosystem service value (ESV). Then, according to the output of grain per unit area of farmland in 2015 and the average grain purchase price ($1.80/kg) recorded in the Statistical Yearbook of Hubei Province, combined with the definition of ecosystem services in China [5,25], the area revision coefficient of ecosystem service equivalence of the study area and the ecosystem service value of eight land use types were calculated (Table 2). Then the ESV model [16] was introduced to reflect the variance in the ESV per unit area under the different vegetation coverage types. The model is represented as:
E S V = i n j m A i j K i j V j π i j η i
where Aij stands for the area of the ecological community in category j in region i; Kij is the revised coefficient of ESV per unit area of category i in the first-level ecological community and category j in the second-level ecological community; Vj represents the non-revised ESV per unit area for an ecological community of category j; πij stands for the natural difference coefficient of type j of an ES in region i; and ƞi is the social development difference coefficient in region i.

3.3. Determining the Impact Factors of Ecosystem Services

The diversity in ES among the different regions and the spatial heterogeneity in the same ecosystem within a single region are mainly shown in the location differences among inter-regional geological factors. Such location diversity occurs not only under different natural conditions but also in the various social development levels. This paper calculated ESV in the Qingjiang river basin mainly using natural and social factors.

3.3.1. Analysis of Geographical Factors of Ecosystem Services

● Analysis of Dynamic Land Use Change
The dynamic degree of single land use change (K) refers to the change in the quantity of land use in a given time [26]:
K = U b U a U a × T × 100 %
In the above formula, Ua and Ub are the amounts of a certain type of land use at the beginning and the end of the study period, respectively, and T is the length of the study period. When the period for T is set to 1 year, the K value is the annual rate of change for a certain land use change type in the study area.
● Analysis of Disaster Risk Sources for an Ecosystem
According to the statistics from the Environmental Protection Agency of the Qingjiang river basin, the most frequent disaster risk sources are water and soil loss, floods, and desertification. Specifically, the area of water and soil loss refers to the places with desertification and its incline of 25°; floods refer to the pre-warning value in the past, and desertification refers to the wet land and rocky desertification land. A comprehensive analysis of disaster weight in the study area is achieved by the analytic hierarchy process according to the frequency, strength, and degree of disasters [27] in the study area. First, the disaster index of one disaster in different regions must be determined, followed by the comprehensive weight of different disasters. By multiplying the two, we can calculate the comprehensive disaster risk index (Ri) (Table 3):
R i = j = 1 3 r i j × w j
where Ri is the comprehensive disaster risk index of area i; rij is the disaster hazard index j of area i; and wj is the weight of disaster j in the Qingjiang river basin [24,28].
In this paper, the range of influence of three types of risk sources is superimposed by ArcGIS to map the various types of risk areas. Each type of risk area has the same risk type and intensity. However, due to the differences in the region, the three types of risk sources cannot be directly calculated, and so we need to superimpose the ecosystem distribution area map in order to obtain the different risk units. The various types of risks within these risk units and ecosystems are homogeneous and can be used to analyze the risk value and calculate the integrated ecologicalrisk index as follows:
E R I i j = R i × E L I i j
where ERIij is the integrated ecological risk index [28] j of area i (Table 4); Ri is the comprehensive disaster risk index [29] of area i; and ELIij is the vegetation ecological loss index [30] j of area i (Table 5).

3.3.2. Analysis of Social Factors of Ecosystem Services Location

A correlation alanyls is applied to explore the relations between the regional economic differences and the ESV. Social comprehensive strength is used to determine the social and economic influence on the ES.
● Location Quotient (LQ)
To better reflect the impact of various social factors on regional ecological compensation, the researchers introduce the LQ to analyze the variables. The LQ is similar to the revealed comparative advantage, an analytical tool that measures the relative weight of an industry in a given area by measuring its relative weight in a wider area. In this paper, the LQ method examines the regional comparative advantage based on regional comprehensive strength and natural resource allocation results [31,32]. The advantage or relative position of the region can be judged according to the relative conception of economic and natural elements in a given area [16]. The formula is:
L Q i = ( Q i Q ) ÷ ( V C i V C )
where LQi is the location quotient in area i; Qi is the location comprehensive strength in area i; Q is the location comprehensive strength in the Qingjiang river basin; VCi is the vegetation coverage ratio in area i; and VC is the vegetation coverage ratio in the Qingjiang river basin.
● Estimation of the Comprehensive Strength of the Social Development of an Ecosystem
In order to analyze the comprehensive strength index of social factors in the Qingjiang river basin, 15 regional factors were determined from four aspects including economic strength, infrastructure, ecological environment, and social development. Then, the 15 regional factors were integrated into four comprehensive indices using the entropy weight method. The four comprehensive indices refer to the economic index [33,34], infrastructure index [35,36], ecological environment index [37,38], and social development index [39,40]. When the mean value of the original data is normalized, it can minimize the influence of dimensions when SPSS.21 is used for the regional factor analysis. According to the results from the Bartlett test of Sphercity, the concomitant probability is 0.001, which is less than the significance level of 0.05. The relative test value Kaiser Meyer Olkin (KMO) Coefficient of simple correlations and partial correlations of the sample data is 85.62%, which can be considered as suitable for factor analysis. The main factors must match the conditions such that the eigenvalue is more than 1, and the Accumulated Variance Contribution Rate is more than 86.04%. Consequently, the location comprehensive strength index (Qi) is calculated as:
Q i = k = 1 m [ p k × j = 1 n ( C k j × M i j ) ]
In this formula, Qi is the location comprehensive strength index of area i; m is the number of principal components whose eigenvalues are greater than 1; pk is the contribution rate of principal component k; Ckj is the load of principal component k on index j; n is the number of indicators involved in the evaluation; and Mij is the normalized value of region i, index j.

3.4. Methods of Estimating the Ecosystem Services Value

3.4.1. Quantitative Analysis of Natural and Social Factors

This paper introduces the natural variation index [41] and social variation index [42]. The natural variation index refers to the variation which results from the various natural disaster indices of regional natural factors. It may result in spatial heterogeneity. The social variation index mainly represents the economic and geographical differences among three reaches. In addition, the variation of regional social development also shows the heterogeneity, which generates different needs of ESV [16]. The formula is:
{ π i j = E R I i j E R I j η i = L Q i
E R I j = ( i = 1 3 E R I i j ) × a r e a j
At the same time, the regional natural factors and social factors should meet the following conditions:
{ 1 / n i = 1 n η = 1 1 / n i = 1 n π = 1
In this formula, π is variation coefficient of regional natural factors; η is the variation coefficient of regional social factors; LQi is the location quotient at reach i; and areaj is the ecological area ratio j.

3.4.2. Estimation of Ecosystem Services Value

A qualitative analysis of the impact factors of ES was conducted. In this section, we will quantitatively analyze the mathematical relationship between each influencing factor and explain the influences of natural and social factors on the ES [43,44]. Assuming that the ESV is only affected by natural conditions and social conditions [45,46], the following equation is established:
E i j = π i j K i j V j η i
In this formula, Eij is the ESV in the ecosystem unit area j at reach i; Vj is the ESV in the ecosystem unit area j in the study area; πij is the variation coefficient of regional natural factors j at reach i; ηi is the variation coefficient of regional social factors at reach i; Kij is the land use change in the dynamic degree j at reach i. After inserting Formula (10) into Formula (1), the result is:
E S V = i 3 j 8 A i j E i j

3.5. Prediction of Ecosystem Services Value

A grey prediction is used to forecast feature variation of a given system behavior. It predicts the grey process of a time series within a certain variation scope. This paper utilizes some original time series (from 2000 to 2015) for the experiment. New time series are developed for time accumulation, and its parameters can be analyzed using first order linear differential equations. The results show that the original time series presents an index variation law [47]. Therefore, the grey prediction method is used to forecast the ESV of the secondary ecological communities from 2016 to 2035 in the study area [48,49]. The formula is:
{ E S V ( 1 ) ( t + 1 ) = ( E S V ( 0 ) ( 0 ) u a e a t ) + u a E S V ( 0 ) ( t ) = E S V ( 1 ) ( t ) E S V ( 1 ) ( t 1 )
where a and u are constants; t = 0, 1, 2, ···, n represent different times; ESV(0)(0) is the ESV in 2000; E S V ( 1 ) ( t ) is the predicted cumulative value; and E S V ( 0 ) ( t ) is the predicted ESV.

3.6. Research Technology Road

This paper firstly introduces the ESV measurement model. Secondly, based on the natural factors and location differences factors in the study area, the analyses are made on the two impact factors. Thirdly, the coefficient values of these two factors are inserted into Formula (11) to calculate the ESV of the administrative unit in the study area. Fourthly, the ESV from 2016 to 2035 is developed by a grey prediction model (Figure 2).

4. Results

4.1. Analysis of the Land Use Change Results

The results show that the land use change type in 2000–2015 was dominated by forest land—accounting for 60.63% of the total area, followed by arable land—accounting for about a total area of 22.26%, while grassland and other land use contribution rates were the lowest—accounting for only about 17.11%. As showed in Table 6, the coverage of forest land increased sharply because many farmers moved to the urban areas, so some arable land was converted into grassland and forest land. The ecological environment was improved owing to the implementation of the west region development strategy, grain for green project, and ecological poverty alleviation. The coverage of arable land showed the greatest volatility; due to the low prices in this area since 2005, many farmers abandoned their land for other jobs, leaving arable land uncultivated. Land use change in the middle reaches was the largest from 2000–2015, as arable land area decreased 27.23%, and grassland and other land area increased 11.56% and 13.17%, respectively. However, forestland area exhibited no change because En’shi City is located at the center of this area, thus the level of urbanization is high, and economic growth accelerated urban expansion, resulting in the conversion of a large amount of arable land to urban greening grassland and construction land. Land use change in the lower reaches was small, as arable land area decreased 21.58%, other land increased 14.13%, and forestland increased 2.41%. The urbanization centered on Changyang County has been developing rapidly, and some arable land has been changed into forestland because of the Changyang County government’s eco-tourism construction policy—Qingjiang Gallery has been constructed as an international tourism brand. Land use change in the lower reaches was not obvious because the area is located at the border of Wuling mountain range and Daba mountain range, and development is limited by landforms (Figure 3).

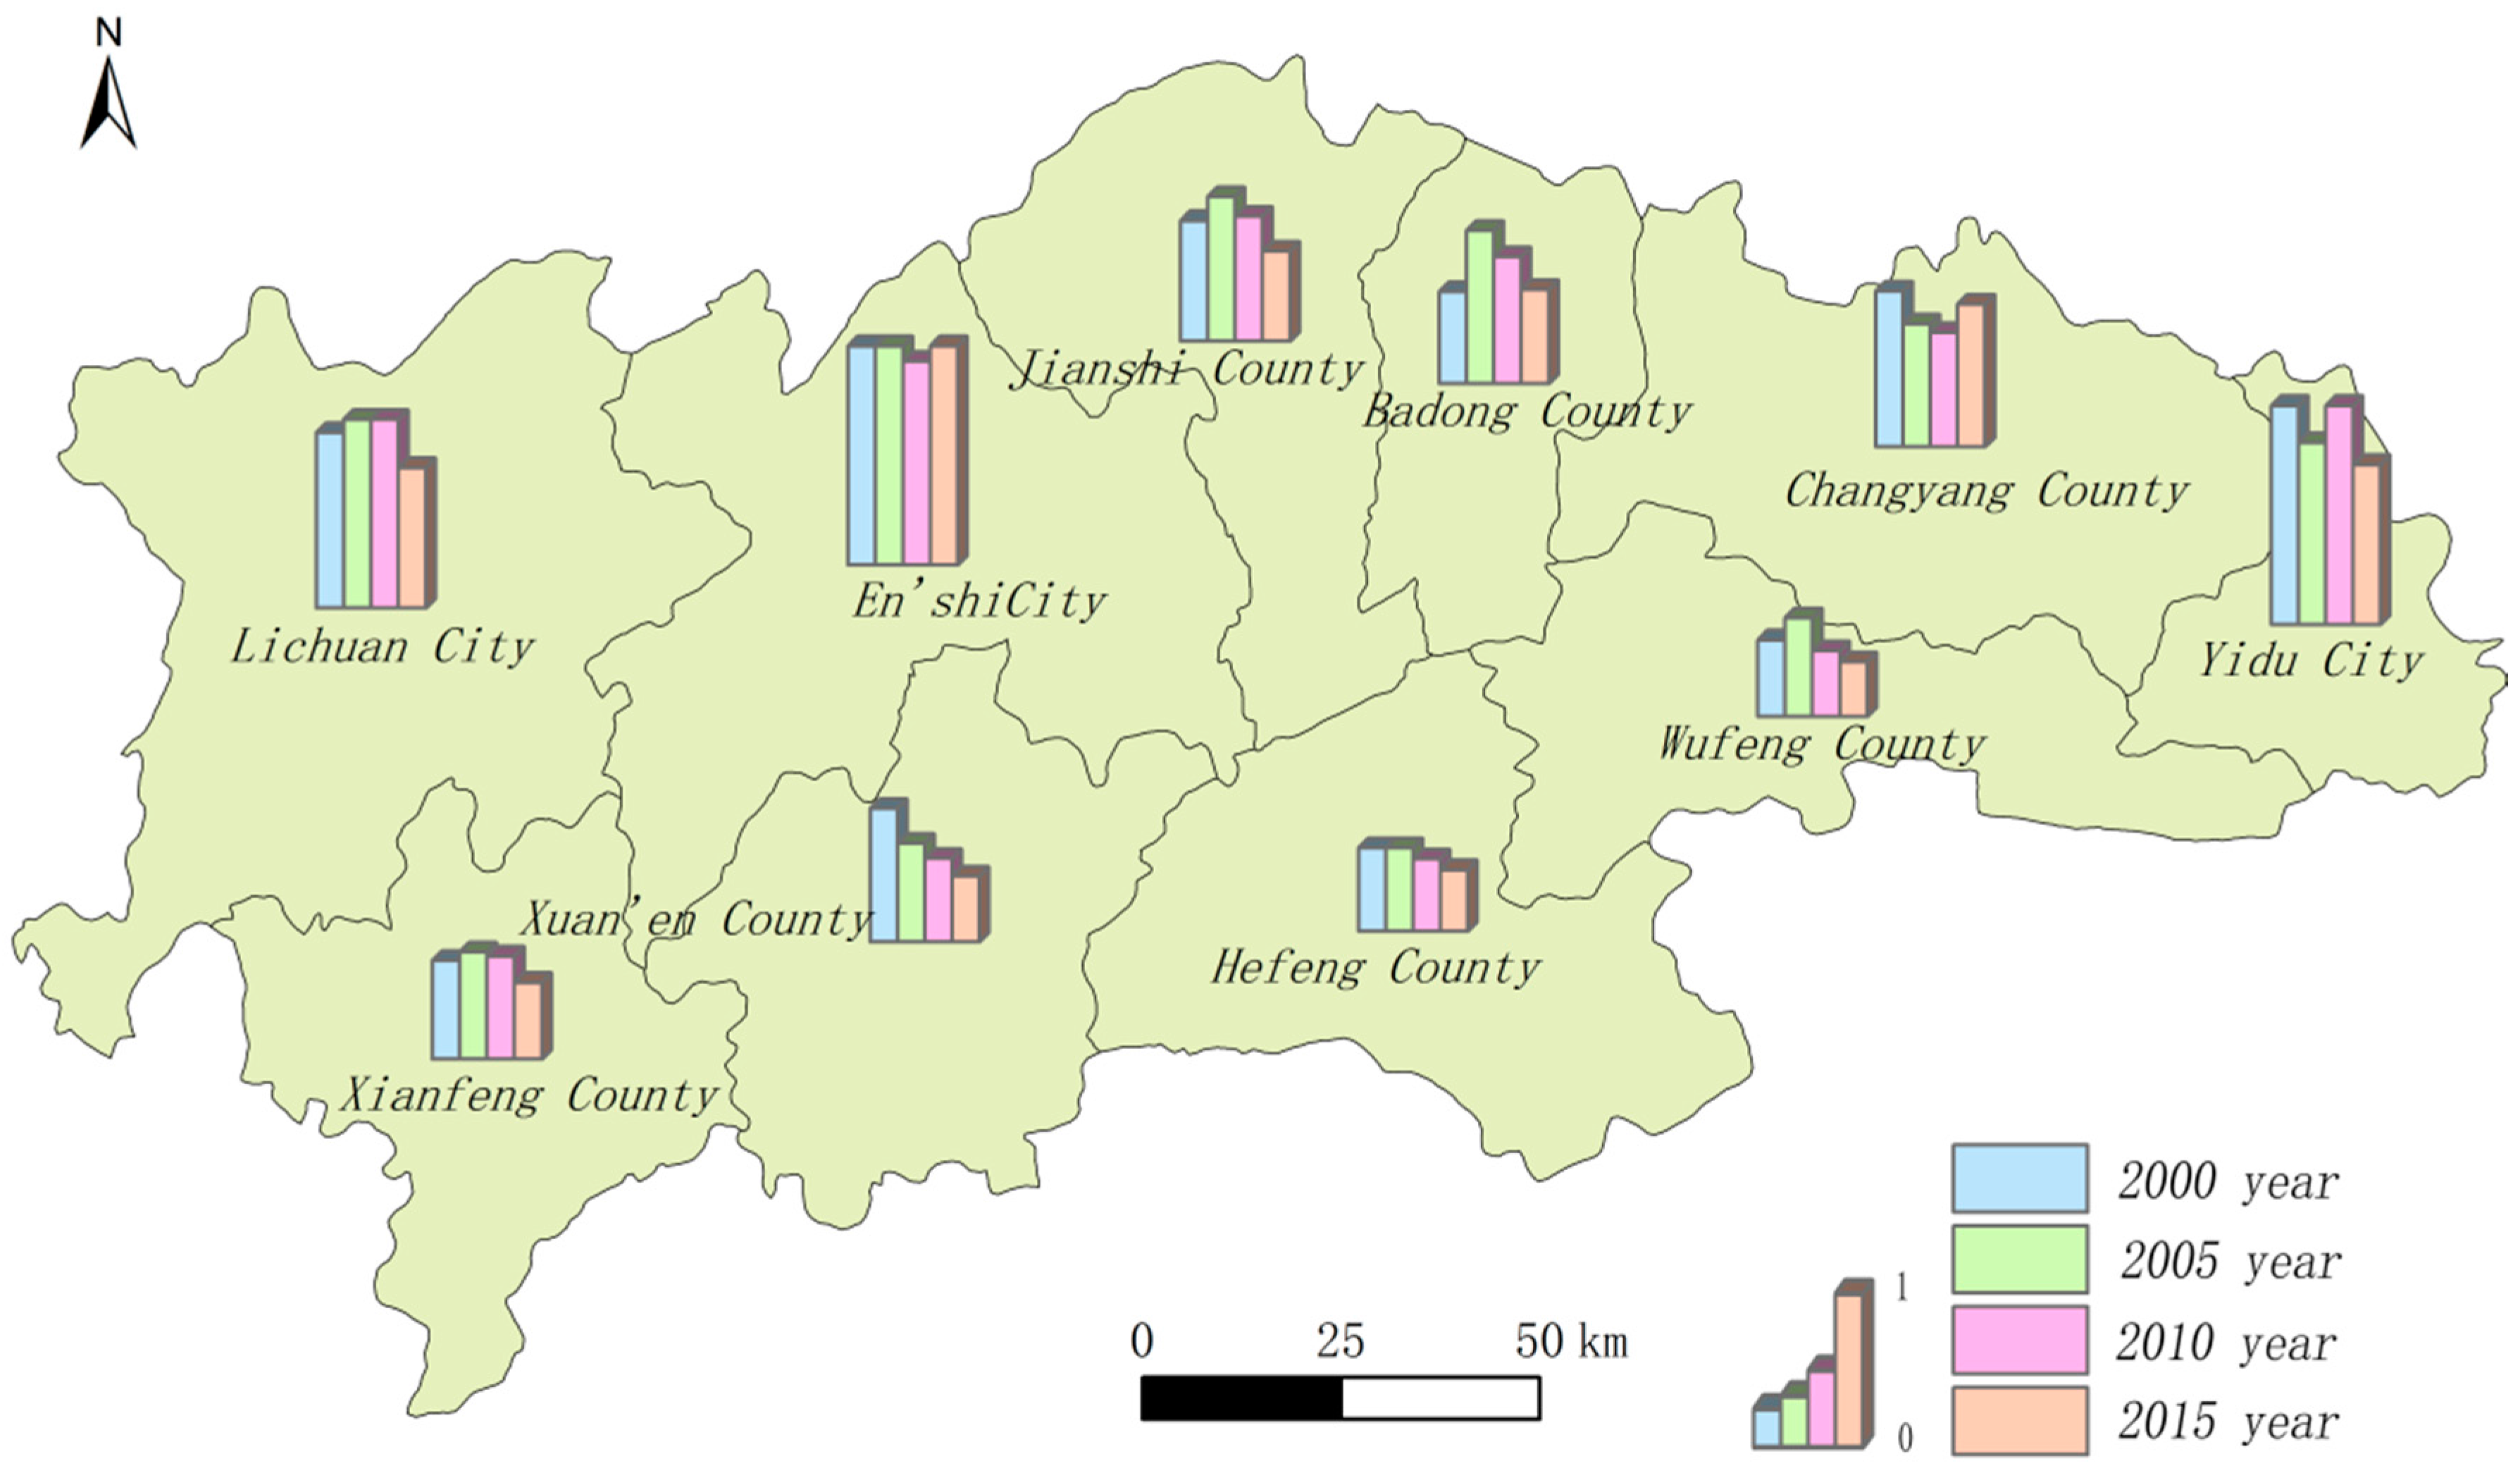
4.2. Analysis of Regional Comprehensive Strength in Different Locations

According to Formulas (3)–(6), the distribution trends of the regional comprehensive strength in the study areas were determined and normalized (Table 7). Figure 4 displays the distribution of the regional comprehensive strength and the spatial heterogeneity of vegetation coverage during four periods from 2000 to 2015. The results show the imbalance between the ecological environment and economic distribution in the Qingjiang river basin. There are four obvious spatial distributions: (1) A low-high distribution (Lichuan City and Jianshi County show low economic development and high vegetation coverage levels)—resulting from a great deal of water conservation forests and terrain limits which drag down the agricultural and industrial development in this area. (2) A high-low distribution (Xiangfeng County and Xuan’en County show high economic development and low vegetation coverage levels)—resulting from the resource-based enterprises in this area. The rapid development of these enterprises has increased the comprehensive economic strength in this area immediately. Also, the rising industrial and domestic water pollution have threatened the local ecological water, making the ecological environment more vulnerable. (3) A low-low distribution (Badong County, Hefeng County, and Wufeng County show low economic development and low vegetation coverage levels)—due to the natural disasters such as landslides, water and soil loss, as well as poor natural economic conditions in the border area of the upper and middle reaches which are regarded as an important area. (4) A high-high distribution (En’shi City, Changyang County, and Yidu City show high economic development and high vegetation coverage levels), resulting from its beneficial location. This area is located in the upper reaches of the Three Gorges project, which has garnered some preferential policies and relocation projects. Both the population and arable land areas have continued to grow, which has improved the quality of life but brought ecological disturbances.

4.3. The Results of the Ecosystem Services Value

The results calculated by Formulas (7)–(11) reveal that the ESV of the Qingjiang river basin from 2000 to 2015 was 1.8 billion dollars, accounting for 62.20% of the gross national product in the Qingjiang river basin. The ESV results are 26.02%, 44.06%, and 29.92%, respectively, in the upper reaches, middle reaches, and downstream basins (Table 8). The results showed that in recent years, the strong economic growth in the study area was not balanced with the development of the ecological environment. The upper reaches basin is the resource output type (except Xuan’en) and the demand for ecosystem services in Lichuan County and Xianfeng County has been increasing. However, the demand for ecosystem services in Xuan’en County has been decreasing, so policy guiding has become one of the major drivers. The high comprehensive strength of the middle reaches basin promoted strong economic growth, but moisture regulation and land formation have not made the coordination function, resulting in great pressure for the sustainable development of the ecological environment. The demand for ecosystem services in Badong County decreased because of the contribution from the Three Gorges project. In the lower reaches basin, ecological environment sustainable development in Changyang County and Wufeng County has had good effect, especially in Wufeng County, because the implementation of ecotourism construction in 2010, gas regulation, and climate regulation have made great contributions.

4.4. 2016–2035 Ecosystem Services Value Prediction

According to Formula (12), we can predict the ESV in the Qingjiang river basin from 2016 to 2035: it is estimated at 1.73 billion dollars in 2020; 1.67 billion dollars in 2025; 1.62 billion dollars in 2030; and 1.56 billion dollars in 2035, showing a continuous decrease in the total ESV. After an error analysis of the prediction, the maximum relative error is 6.75%, which indicates that the prediction achieved credible results. The result of the evaluation (Table 9) shows distribution trends of the ESV from the administrative units in the study area.
The results show that the ESV in the study area will decrease to 1.56 billion dollars in 2035, a total decrease of 27.64% from 1.99 billion dollars in 2000. Compared to 2015, this is a decrease of 11.02%, and the annual decrease between 2015 and 2035 is 246.01 million dollars. From 2000 to 2035, the ESV in Yidu City, Lichuan City, Jianshi County, and Hefeng County will achieve rapid growth, respectively increasing by 94.76%, 65.12%, 96.96%, and 92.38%, which shows that the ecological and environment resources in the area are in oversupply, and that the output of resources is still the main factor. Ecological compensation transfer payments continue to increase, and the effect of implementing ecological environment sustainable development is not obvious. Government decision-makers need further scientific and rational planning of the eco-tourism construction program. The ESV in En’shi City, Xuan’en County, Wufeng County, and Badong County will experience a decline—a reduction of 32.53%, 487.80%, 181.52, and 368.07%—which shows that the supply and demand of ecological environment resources in this area tend to balance, and the ecological compensation transfer payments decrease. The implementation of eco-tourism construction by government policymakers improves the quality of the local eco-environment and almost achieves the sustainable development of the eco-environment. Xianfeng County and Changyang County show slow growth in the future, indicating that the effect of sustainable development of the ecological environment implemented by local government policymakers is not obvious, and more scientific and rational planning of eco-tourism construction is needed. The change trends of ecosystem services value in administrative units in the study area are shown in Figure 5.

5. Discussions and Suggestions

The core of sustainable development is to maintain a sustainable biosphere to protect the human living environment and the earth’s life support system [50]. ES is the foundation of human survival and modern civilization; science and technology can influence the function of ES, but cannot substitute the service function of natural ecosystems. Maintaining the function of ES is the foundation of sustainable development. In this paper, the ESV is measured and predicted only from the aspects of natural and social location [51], and the following points still need further study and discussion.
Human activities are one of the direct causes of biodiversity destruction. Social and economic development, the population explosion has led to the development of human society at an unprecedented scale and speed [52], and the development and utilization of the natural environment and natural resources have destroyed all kinds of natural ecosystems and led to the loss of wildlife habitats, which in turn has affected plant pollination [53]. Therefore, government policymakers plan to increase research funding for breeding animals and plants between 2016 and 2035, cultivate public awareness of biodiversity protection, strengthen the legal system and international cooperation on the policy level, and realize sustainable development of biodiversity [54,55].
According to the land use change data from 2000 to 2015, the area of arable land and grassland has decreased by 20.52 ha and 21.46 ha, respectively. As human activities in the research area have increased, the depletion of land resources has increased, further affecting the sustainable development of the environment. Therefore, the use of remote sensing technology to dynamically monitor land use, strengthening the management of basic farmland, realizing garden and ecological optimization, and achieving the dynamic balance of gross farmland are the grand goals of the sustainable development of land use that should be realized between 2016 and 2035.
The ESV is closely related to social labor, and the total value of society in general determines the value of ecosystem products. At the same time, investment in ES also affects the total value of society [56]. According to the statistics of Hubei Provincial Bureau, the per unit area of ESV in 2015 in food production, raw material production, and entertainment culture was 3823.64 dollars, 16,372.17 dollars, and 12,524.41 dollars, respectively, which shows that the growth of the total value can meet human needs for the increasing use of ES products [57]. Therefore, it is an important measure of sustainable development to improve the service products of ecosystems and accelerate the transfer of rural surplus labor.

6. Conclusions

The economic center of the Qingjiang river basin is located in the middle and lower reaches of the basin, while the upstream basin belongs to the resource output region. The ecological resources of the upper, middle, and lower reaches can implement internal transfer, thus making it convenient for policymakers to build the payment of use transfer of ecological resources and establish the rational allocation of ecological compensation resources. Extending the work conducted by Xie et al. [4,5,6], Ouyang et al. [8,11], and Li et al. [16], this paper measures the ESV of the study area from within the context of the coupled human-environmental context. The measurement of ESV is only the foundation of the ES function. Establishing a sound regulatory mechanism of the ecological balance development is key to sustainable development. To achieve such goals, we need to balance the biodiversity environment impacted by human activities, protect forest systems at upstream of the Qingjiang river basin, and monitor disaster risks.

Acknowledgments

We would like to extend our thanks to the 5th International Conference on Eco-Compensation and Payments for Ecosystem Services. This research was supported by funding from the Evaluation Index of Resources and Environmental Carrying Capability (No. 1212011220096), the Pilot Project of Evaluation of Resources and Environmental Carrying Capacity in Typical Area of Qinling Resource Type (No. DD2016042), the National Natural Science Foundation of China (41430637, 41329001), and Humanities and Social Science Foundation of Ministry of Education in China (17XJC790001).

Author Contributions

Zhengsong Lin designed the research and wrote the paper; Xinyue Ye co-designed the research and extensively updated the paper; Qian Wei and Fan Xin performed the research, analyzed the data and co-wrote the paper; and Zhang Lu performed part of the literature review and checked the statistical results; Sonali Kudva extensively updated the paper; Qiwen Dai co-designed the research. All authors read and approved the final manuscript.

Conflicts of Interest

The authors declare no conflict of interest.

References

  1. Bailey, R.-G. Ecoregions of the United States Map (Scale 1:7,500,000); Ogden, M., Ed.; US Department of Agriculture, Forest Service, Int. Region: Ogden, UT, USA, 1976; pp. 23–27.
  2. Cai, Y.; Li, H.; Ye, X.; Zhang, H. Analyzing Three Decadal Patterns of Land Use/Land Cover Change and Regional Ecosystem Services at Landscape Level: Study on Two Coastal Metropolitan Regions, Eastern China. Sustainability 2016, 8, 773. [Google Scholar] [CrossRef]
  3. Wan, L.; Ye, X.; Lee, J.; Lu, X.; Zheng, L.; Wu, K. Effects of Urbanization on Ecosystem Service Values in a Mineral Resource-Based City. Habitat Int. 2015, 46, 54–63. [Google Scholar] [CrossRef]
  4. Xie, G.-D.; Lin, Z.; Lu, C. Supply, Consumption and Valuation of Ecosystem Services in China. Resour. Sci. 2008, 30, 93–99. [Google Scholar]
  5. Xie, G.-D.; Zhang, L.; Lu, X. Study on valuation of range land ecosystem services of China. J. Nat. Resour. 2001, 16, 47–53. [Google Scholar]
  6. Xie, G.-D.; Cao, S.; Leng, Y. Targeted Zoning in China according to Sustainable Development Principles. Resour. Sci. 2015, 37, 1740–1746. [Google Scholar]
  7. Qi, Z.; Ye, X.; Zhang, H.; Yu, Z. Land Fragmentation and Variation of Ecosystem Services in the Context of Rapid Urbanization: The Case of Taizhou City, China. Stoch. Environ. Res. Risk Assess. 2014, 28, 843–855. [Google Scholar] [CrossRef]
  8. Ouyang, Z.-Y.; Zhang, L.; Wu, B. An ecosystem classification system based on remote sensor information in China. Acta Ecol. Sin. 2015, 35, 219–226. [Google Scholar] [CrossRef]
  9. Fu, B.-J.; Chen, L.; Liu, G. The objectives, tasks and characteristics of China ecological regionalization. Acta Ecol. Sin. 1999, 19, 591–595. [Google Scholar]
  10. Ping, Z.; Liang, H.; Fan, X. Ecosystem Service Value Assessment and Contribution Factor Analysis of Land Use Change in Miyun County, China. Sustainability 2015, 7, 7333–7356. [Google Scholar]
  11. Jiang, B.; Ouyang, Z.; Miao, H. Ecosystem services valuation of the Haihe river basin wetlands. Acta Ecol. Sin. 2011, 31, 2236–2244. [Google Scholar]
  12. Guo, Z.; Xiao, X.; Gan, Y.; Zheng, Y. Ecosystem functions, services and their values—A case study in Xingshan County of China. Ecol. Econ. 2001, 38, 141–154. [Google Scholar] [CrossRef]
  13. Li, T.; Li, W.; Qian, Z. Variations in ecosystem service value in response to land use changes in Shenzhen. Ecol. Econ. 2010, 69, 1427–1435. [Google Scholar]
  14. Zhang, B.; Li, W.; Xie, G.-D.; Xiao, Y. Water conservation of forest ecosystem in Beijing and its value. Ecol. Econ. 2010, 69, 1416–1426. [Google Scholar]
  15. Zhou, H.-X.; Liu, J.-E.; Qin, P. Impacts of an alien species (Spartinaalterniflora) on the macrobenthos community of Jiangsu coastal inter-tidal ecosystem. Ecol. Eng. 2009, 35, 521–528. [Google Scholar] [CrossRef]
  16. Li, B.; Shi, P.; Jin, S. Theory and Quantitative Methodology of Spatial Heterogeneity Analysis of Ecosystem Service Value for the Shiyanghe River Basin, Gansu, China. J. Desert Res. 2013, 33, 943–951. [Google Scholar]
  17. Chen, N.; Wang, L.; Lu, T. Watershed Scale Ecosystem Services: Progress and Prospective. J. Ecol. Rural Environ. 2012, 28, 113–119. [Google Scholar]
  18. Guo, R.-Z.; Shen, H.-J.; Yang, M.-M. Studies on ecosystem service value and ecological compensation strategy in Lishui River Basin. Res. Environ. Sci. 2016, 29, 774–782. [Google Scholar]
  19. Silvertown, J. Have Ecosystem Services Been Oversold? Trends Ecol. Evol. 2015, 30, 641–648. [Google Scholar] [CrossRef] [PubMed]
  20. Chen, M.-Q.; Zhao, B.-P.; Luo, Z.-J. The ecosystem services value change in the upper reaches of Ganjiang River Based on RS and GIS. Acta Ecol. Sin. 2013, 33, 2761–2767. [Google Scholar] [CrossRef]
  21. Wu, J. Landscape sustainability science: Ecosystem services and human well-being in changing landscapes. Landsc. Ecol. 2013, 28, 999–1023. [Google Scholar] [CrossRef]
  22. Fu, B.-J.; Liu, S.-L.; Ma, K.-M. The contents and methods of integrated ecosystem assessment (IEA). Acta Ecol. Sin. 2001, 21, 1885–1892. [Google Scholar]
  23. Wu, J. Urban ecology and sustainability: The state-of-the-science and future directions. Landsc. Urban Plan. 2014, 125, 209–221. [Google Scholar] [CrossRef]
  24. En’shi City Geological Survey Bureau. En’shi City Geological Disaster Prevention Planning (2013–2020); Geological Survey Bureau: En’shi, China, 2013; Volume 5, pp. 8–13.
  25. Zhang, C.-S.; Xie, G.-D.; Cao, S.-Y. The Distribution Patterns of China’s County Ecological Function. Resour. Sci. 2012, 34, 1636–1646. [Google Scholar]
  26. Yan, N.-P.; Lin, H.; Wang, X. Analysis of evolution and driving force of ecosystem values in the Three Gorges Reservoir region during 1990–2011. Acta Ecol. Sin. 2014, 34, 5962–5973. [Google Scholar]
  27. Wang, S.-W.; Huang, G. Study on index system of ecological security assessment in Qingjiang River Basin and management measures. Yangtze River 2016, 47, 5–10. [Google Scholar]
  28. Jian, F.; Wang, Y.; Zhou, Z. Dynamic Ecological Risk Assessment and Management of Land Use in the Middle Reaches of the Heihe River Based on Landscape Patterns and Spatial Statistics. Sustainability 2016, 8, 536–542. [Google Scholar]
  29. Xu, G.-C.; Kang, M.-Y.; He, L.-N. Advances in research on ecological vulnerability. Acta Ecol. Sin. 2009, 29, 2578–2588. [Google Scholar]
  30. Zong, L.; Jiang, T. GIS Based risk zoning and assessment of flood disaster in the middle and lower reaches of the Yangtze River Basin. J. Nat. Dis. 2005, 14, 5–11. [Google Scholar]
  31. Qian, L.; Mao, J.; Wu, J. Ecological Security Pattern Analysis Based on Invest and Least-Cost Path Model: A Case Study of Dongguan Water Village. Sustainability 2016, 8, 172–181. [Google Scholar]
  32. Yin, H.; Qing, H.; Guo, T. Measurement Method and Empirical Research on the Sustainable Development Capability of a Regional Industrial System Based on Ecological Niche Theory in China. Sustainability 2014, 6, 8485–8509. [Google Scholar] [CrossRef]
  33. Lee, J.-A.; Chon, J.; Ahn, C. Planning Landscape Corridors in Ecological Infrastructure Using Least-Cost Path Methods Based on the Value of Ecosystem Services. Sustainability 2014, 6, 7564–7585. [Google Scholar] [CrossRef]
  34. Chong, Z.; Qin, C.; Ye, X. Environmental Regulation, Economic Network and Sustainable Growth of Urban Agglomerations in China. Sustainability 2016, 8, 467. [Google Scholar] [CrossRef]
  35. Qiang, T.; He, C.; He, X. Farmers’ Sustainable Strategies for Soil Conservation on Sloping Arable Lands in the Upper Yangtze River Basin, China. Sustainability 2014, 6, 4795–4806. [Google Scholar]
  36. Luo, S.-W.; Zhang, Y.; Chen, W.-H. Study on Land form of Qingjiang River Basin on the System of Land form Hydrological of Basin. J. Anhui. Agric. Sci. 2010, 38, 1646–1649. [Google Scholar]
  37. Cheng, J.; Dai, S.; Ye, X. Spatiotemporal heterogeneity of industrial pollution in China. Chin. Econ. Rev. 2016, 40, 179–191. [Google Scholar] [CrossRef]
  38. Joseph, N.; Stephanie, B.; Mark, R. A Practical Approach for Demonstrating Environmental Sustainability and Stewardship through a Net Ecosystem Service Analysis. Sustainability 2013, 5, 2152–2177. [Google Scholar]
  39. Wang, H.-B.; Li, J.-F.; Wang, B.-G. The Multilevel Gray Evaluation of Tourism Resources in the Qingjiang River Basin. Syst. Eng. Theory Pract. 2000, 20, 127–131. [Google Scholar]
  40. Hu, Y.-J.; Chen, X. Threat of Human Activities to Hydrological Regime in Central Asia. Acta Ecol. Sin. 2011, 28, 189–197. [Google Scholar]
  41. Zhang, R.; Wang, B.; Lin, J. GIS Based Measurement and Regulatory Zoning of Urban Ecological Vulnerability. Sustainability 2015, 7, 9924–9942. [Google Scholar] [CrossRef]
  42. Yu, Z.-Y.; Li, B.; Zhang, X.-S. Social ecological system and vulnerability driving mechanism analysis. Acta Ecol. Sin. 2014, 34, 1870–1879. [Google Scholar]
  43. Westley, F.-R.; Tjornbo, O.; Schultz, L. A Theory of Transformative Agency in Linked Social-Ecological Systems. Ecol. Soc. 2013, 18, 378–380. [Google Scholar] [CrossRef]
  44. Ostrom, E.; Ostrom, E. A General Framework for Analyzing Sustainability of Social-Ecological Systems. Science 2009, 325, 419–422. [Google Scholar] [CrossRef] [PubMed]
  45. Ring, I.; Klauer, B.; Wätzold, F.; Watzold, B.-A. Mansson Regional Sustainability: Applied Ecological Economics Bridging the Gap between Natural and Social Sciences. Dep. Energy Environ. Build. Technol. 2013, 1, 597–608. [Google Scholar]
  46. Khan, M. Effects of changes in land-use and natural disasters on social-ecological resilience and vulnerabilities in coastal Bangladesh. AntikeAbendl. 2012, 59, 126–144. [Google Scholar]
  47. Zheng, F.; Zang, Z.; Sun, Z. Prediction and analysis of the transition to green economy in China based on the theory of ecosystem services. Acta Ecol. Sin. 2014, 34, 7137–7147. [Google Scholar] [CrossRef]
  48. Tang, C.; Ma, Y.; Li, J. Trend Prediction and Decomposed Driving Factors of Carbon Emissions in Jiangsu Province during 2015–2020. Sustainability 2016, 8, 1018. [Google Scholar] [CrossRef]
  49. Guo, Z.; Yang, H. Ecosystem service value analysis and trend prediction in Chang-Zhu-Tan region. Trans. Chin. Soc. Agric. Eng. 2014, 30, 238–246. [Google Scholar]
  50. Levin, S.; Xepapadeas, T.; Crépin, A.-S. Social-ecological systems as complex adaptive systems: Modeling and policy implications. Environ. Dev. Econ. 2013, 18, 111–132. [Google Scholar] [CrossRef]
  51. Mcginnis, M.-D.; Ostrom, E. Social-Ecological System Framework: Initial Changes and Continuing Challenges. Ecol. Soc. 2014, 19, 253–265. [Google Scholar] [CrossRef]
  52. Smith, A.; Stirling, A. The Politics of Social-ecological Resilience and Sustainable Socio-technical Transitions. Ecol. Soc. 2010, 15, 11–22. [Google Scholar] [CrossRef]
  53. Bryan, B.-A.; Raymond, C.-M.; Crossman, N.-D. Comparing Spatially Explicit Ecological and Social Values for Natural Areas to Identify Effective Conservation Strategies. Conserv. Biol. J. Soc. Conserv. Biol. 2011, 25, 172–186. [Google Scholar] [CrossRef] [PubMed]
  54. Enticott, G. The Ecological Paradox: Social and Natural Consequences of the Geographies of Animal Health Promotion. Trans. Inst. Br. Geogr. 2010, 33, 433–446. [Google Scholar] [CrossRef]
  55. Persha, L.; Agrawal, A.; Chhatre, A. Social and ecological synergy: Local rulemaking, forest livelihoods, and biodiversity conservation. Science 2011, 331, 1606–1608. [Google Scholar] [CrossRef] [PubMed]
  56. Jiang, W. Construction of Efficient Chain, Comprehensive Value-added Exploration and Research of Ecological Village—Ecological Village of Lao Hutan in Huzhou City. Anhui Agric. Sci. Bull. 2012, 5, 23–31. [Google Scholar]
  57. Barnthouse, L. The strengths of the ecological risk assessment process: Linking science to decision making. Int. Environ. Assess. Manag. 2008, 4, 299–311. [Google Scholar] [CrossRef] [PubMed]
Figure 1. Study area.
Sustainability 09 02356 g001
Figure 2. The analytical framework.
Sustainability 09 02356 g002
Figure 3. Land use change of spatial distribution from 2000 to 2015 in the Qingjiang river basin.
Sustainability 09 02356 g003
Figure 4. The spatial distribution of the regional comprehensive strength index from 2000 to 2015.
Sustainability 09 02356 g004
Figure 5. The ecosystem services value prediction of change trends from 2000 to 2035.
Sustainability 09 02356 g005aSustainability 09 02356 g005b
Table 1. Explanation of land use types.
Land Use TypesTypesDefinition
Crop landIrrigated landSingle-cropping rice, double-cropping rice.
Dry landSingle-cropping wheat, wheat/corn, corn, greenhouses.
Forest landForest landEvergreen broadleaf, deciduous broadleaf, evergreen needleleaf, deciduous needle leaf, mixed forests.
Shrub landOrnamental tree and shrub, spinney, public benefit wood.
Orchard landTerrace garden, pear garden, other garden.
GrasslandHigh grasslandScrub grasslands, midlatitude grasslands, C4 grasslands, scrub grasslands.
Low cover landMarsh, forested wetlands, pasture, meadowy land, wetland.
Other landOther landDevelopment land, land for roads, salt and alkali, rock, temporallybare croplands, biological crust.
Table 2. Ecosystem types and ecosystem services value per unit in Qingjiang River Basin (USD ha).
Unit Area ESVIrrigated LandDry LandForest LandShrub LandOrchard LandHigh GrasslandLow Cover LandOther Land
873.474620.324143.002210.893314.401372.821006.74749.57
Table 3. Data of water and soil loss, floods, and rocky desertification from Hubei Provincial Land and Resources Bureau.
RegionsWater and Soil LossFloodsRocky DesertificationIntegrated Disaster Risk Index
Upper reaches0.160.100.150.41
Middle reaches0.210.130.080.42
Lower reaches0.070.040.010.12
Table 4. The integrated ecological index in the Qingjiang river basin.
RegionsIrrigated LandDry LandForest LandShrub LandOrchard LandHigh GrasslandLow Cover LandOther Land
Upper reaches0.050.060.430.240.180.020.110.29
Middle reaches0.180.210.310.190.050.070.090.17
Lower reaches0.180.220.340.080.070.060.080.24
Table 5. Different vegetation ecological loss index in the Qingjiang river basin.
RegionsIrrigated LandDry LandForest LandShrub LandOrchard LandHigh GrasslandLow Cover LandOther Land
Upper reaches0.030.050.190.280.310.240.330.17
Middle reaches0.070.080.210.290.330.270.360.19
Lower reaches0.060.080.210.290.330.280.360.21
Table 6. Land use change from 2000 to 2015 in the Qingjiang river basin.
TypesArea Percentages (%)Change in Area (104 ha)Annual Change Rate (%)
20002005201020152000–20052005–20102010–20152000–20052005–20102010–2015
Irrigated land0.117.4915.7018.7425.99−64.119.3123.63−139.7716.87
Dry land0.045.4113.763.52−10.8224.33−29.82−6.8260.54−287.53
Forest land0.0610.0916.4110.503.0518.33−17.0110.3038.20−55.05
Shrub land0.0423.9413.4539.3517.35−30.9576.5624.70−78.7866.09
Orchard land0.117.658.6810.78−4.012.916.40−17.8811.4720.16
High grassland0.204.4611.574.19−16.6720.72−21.46−127.4361.31−173.80
Low cover land0.232.386.212.26−5.1211.17−11.48−73.5261.58−172.60
Otherland0.192.036.667.38−3.5113.492.27−58.8969.3310.43
Table 7. The regional comprehensive strength in the Qingjiang river basin.
Regions2000 Year2005 Year2010 Year2015 Year
Before NormalizationAfter NormalizationBefore NormalizationAfter NormalizationBefore NormalizationAfter NormalizationBefore NormalizationAfter Normalization
Lichuan City5.050.805.100.865.220.862.900.64
Xianfeng County2.820.452.940.492.830.471.560.35
Xuan’en County3.850.612.690.452.320.381.330.30
En’shi City6.301.005.951.005.650.934.501.00
Jianshi County3.510.553.900.663.470.571.840.41
Hefeng County2.410.382.290.382.020.331.280.28
Badong County2.630.424.180.703.500.581.920.43
Changyang County4.520.713.340.563.170.522.930.65
Wufeng County2.210.352.670.451.830.301.120.25
Yidu City6.321.004.910.836.041.003.270.73
Table 8. The statistics of ecosystem services value calculation in 2000–2015 (106 USD).
RegionsEcosystem Services Value2000–2015 Variation in 5 YearsValue Change Rate (%)
2000200520102015
Lichuan City51.0159.2968.9280.1129.1036.33
Xianfeng County15.3416.5617.8719.293.9520.48
Xuan’en County17.3413.4610.458.12−9.22−113.55
En’shi City74.1571.2268.4165.72−8.43−12.83
Jianshi County6.7314.1529.7562.5455.8189.24
Hefeng County7.6311.0215.9223.0115.3866.84
Badong County47.7936.7215.366.42−31.37−191.05
Changyang County9.6710.1910.7511.331.6614.65
Wufeng County28.189.393.131.04−17.14−155.25
Yidu County12.0323.3045.1387.4075.3786.24
Table 9. The summary of ecosystem services value prediction from 2016–2035 (106 USD).
RegionsEcosystemServices Value2016–2035 Variationin 5 YearsThe Value Change Rate (%)
2020202520302035
Lichuan City93.12108.24125.82146.2653.1436.33
Xianfeng County20.8322.4824.2726.205.3720.50
Xuan’en County6.304.893.802.95−3.35−113.56
En’shi City63.1360.6458.2555.95−7.18−12.83
Jianshi County131.46176.35180.93221.2189.7540.57
Hefeng County33.2147.9769.29100.0766.8666.81
Badong County12.6911.1210.4710.21−2.48−24.29
Changyang County11.9412.5813.2613.982.0414.59
Wufeng County10.3510.1210.0410.01−0.34−3.40
Yidu County69.27127.84134.95229.75160.4869.85

