Article

The Extent and Implications of the Microclimatic Conditions in the Urban Environment: A Vienna Case Study

Department of Building Physics and Building Ecology, Vienna University of Technology Karlsplatz, 1040 Vienna, Austria
*
Author to whom correspondence should be addressed.
Sustainability 2017, 9(2), 177; https://doi.org/10.3390/su9020177
Submission received: 12 December 2016 / Revised: 16 January 2017 / Accepted: 23 January 2017 / Published: 25 January 2017
(This article belongs to the Special Issue Urban Heat Island)

Abstract

:
Recent challenges in the realm of urban studies concern better understanding of microclimatic conditions. Changes in urban climate affect cities at local and global scales, with consequences for human health, thermal comfort, building energy use, and anthropogenic emissions. The extent of these impacts may vary due to different morphologies and materials of the built environment. The present contribution summarizes the results of a multi-year effort concerned with the extent and implications of urban heat in Vienna, Austria. For this purpose, high-resolution weather data across six locations are obtained and analyzed. This allowed for an objective assessment of urban-level climatic circumstances across distinct low-density and high-density typologies. Subsequently, a systematic framework was developed for identification of essential properties of the built environment (geometric and material-related) that are hypothesized to influence microclimate variation. Results point to a number of related (positive and negative) correlations with microclimatic tendencies. Additionally, the impact of this location-specific weather data on building performance simulation results is evaluated. The results suggest that buildings' thermal performance is significantly influenced by location-specific microclimatic conditions with variation of mean annual heating load across locations of up to 16.1 kWhm−2·a−1. The use of location-independent weather data sources (e.g., standardized weather files) for building performance estimations can, thus, result in considerable errors.

1. Introduction

The urban-level climatic circumstances are considered to be of particular relevance to the domain of environmental sciences. Microclimatic variations within urban domains are found to affect metropolitan areas at local and global scales, with immediate effects on the health of people living in cities [1,2,3,4,5,6,7]. The extent of these impacts may vary considerably due to global urbanization, different structural morphologies, land cover, materials of the built environment, and the presence and density of industrial or commercial buildings [8,9,10,11,12,13,14,15,16,17,18,19,20,21]. Erell et al. [13] discussed the positive consequences of anthropogenic heat flux on external temperature, specifically the consequential outdoor temperature rise during summer. They noted that densely developed cities may have significant summertime anthropogenic heat flux due to the extensive use of air-conditioning systems. Furthermore, Krpo et al. [14] stressed that building materials with high thermal conductivity and low heat capacity require more cooling energy in order to maintain internal comfort conditions, thus increasing the energy use for cooling. This also might lead to an increase of outdoor temperature due to corresponding anthropogenic emissions. As discussed by Grimmond and Oke [8], the stored heat in the physical mass of the city varies based on synoptic-scale climates, distinct surface cover, urban morphology, and is greater at densely built urban areas and industrial sites. Generally, with the abundance of impervious surfaces and a small fraction of vegetative cover that characterize central urban areas, a greater fraction of energy will be stored within the urban fabric and eventually be re-emitted back into the environment. The resulting implications of these adverse thermal circumstances for issues such as human well-being (especially related to thermal stress), mortality rate, local air quality, and energy use in buildings are evident and subject to numerous research efforts [22,23,24,25,26,27,28,29]. Green et al. [24] pointed to the dramatic increase of heat-attributable mortality in a majority of US cities. They further analyzed the health impacts with regard to different emission scenarios and noted that if well-coordinated intervention scenarios are not initiated and implemented, heat-related deaths might double. Furthermore, Wong et al. [25] examined the impact of the surrounding urban morphology on the energy consumption of buildings in the city of Singapore. In particular, they noted that urban morphology plays an important role in microclimatic development. With varying building density, building height, and vegetation fraction, the air temperature deviation may be found in the range of 0.9 K to 1.2 K. They further stressed that distinct changes in site configuration (i.e., the height of surrounding buildings, green and sealed area fraction, sky view factor) may result in 5–10 percent cooling load reduction of a single building. The cumulative effect, when observed on a meso-scale, may be even greater. In addition, Colombert et al. [30] studied the effect of different urban parameters (thermal characteristics of walls, roofs, and roads, but also urban geometry and density) on urban energy balance. They found that, in the case of a study domain in Paris, roof albedo and emissivity of walls have the strongest effect on urban energy balance during summer by lowering the total heat stored in the urban fabric. Furthermore, they noted that the building height appears to affect the heat storage flux, where by increasing the height of the buildings, the heat storage flux may increase as well. For these reasons, the study of urban microclimate is recognized as one of the prime areas of investigation and further requires a global commitment and a global effort.
Given the far-reaching negative effects of excessive urban heat, it becomes apparent that further research efforts are needed to foster a broad understanding of microclimate and its implications. One way to explore the distinctive climatic circumstances of the urban realm is to compare the urban climate with that of the surrounding rural terrain. This difference, which appears in temperature records, is referred to as the urban heat island (UHI). UHI occupies a unique position in the realm of microclimatic studies and has been extensively studied [31,32,33,34,35,36,37,38]. The magnitude of the UHI phenomenon is usually expressed in terms of the urban heat island intensity. This term denotes the temperature difference between simultaneously measured urban and rural temperatures. Empirical observations suggest that the magnitude of the UHI effect generally falls in the range of 1 K to 3.5 K [39]. However, this is expected to increase by approximately 1 K per decade [40].
Currently, there is an ongoing discussion within the scientific community concerning the very nature of the UHI, as it may be potentially a problematic concept [41,42,43]. One of the problems of this concept is related to the fact that urban-level microclimatic peculiarities may, and do, vary considerably across the city. Thus, the UHI concept is considered to be too general, as the assessment of its magnitude should be more location-specific than global. Further challenges have to be addressed when selecting the rural domain, as it should be situated outside the urban influence [41]. In light of this, there is a critical need for diverging from the UHI concept and, instead, focus on the extent of intra-urban microclimate variation.
In this context, the present contribution summarizes the results of a multi-year effort concerned with the extent and implications of urban heat and microclimatic variation in the city of Vienna, Austria. For this purpose, the following steps were envisioned:
  • High-resolution data streams across six key locations are obtained, structured, and analyzed. This facilitated the search for location-dependent manifestations of urban-level climatic circumstances across distinct low-density and high-density typologies in Vienna.
  • Subsequently, a systematic framework was developed for the identification of the essential properties of the built environment that are hypothesized to influence the intra-urban microclimate variation. These properties pertain to both geometric (morphological) and semantic (material-related) urban features. Generally, there is a lack of practical assessment approaches focusing on microclimatic development while considering a relatively wide range of built environment attributes. Related assessments frequently focus on a few specific urban features instead of exploring the cumulative effect of the urban fabric on resulting urban heat.
  • Once these features are derived, the existence and extent of the possible correlations between intra-urban microclimate variation and the urban features are explored. The resulting correlations can serve as the starting point toward developing empirically-based predictive models for prediction of local differences in the urban climate.
  • Furthermore, the impact of this location-specific weather data streams on building performance simulation results is evaluated. For this purpose, systematic thermal performance simulations were carried out for a distinct sample of buildings using the obtained weather information as boundary conditions. The computed performance indicators were then analyzed across all locations.

2. Methodology

2.1. Urban Climate Diversity

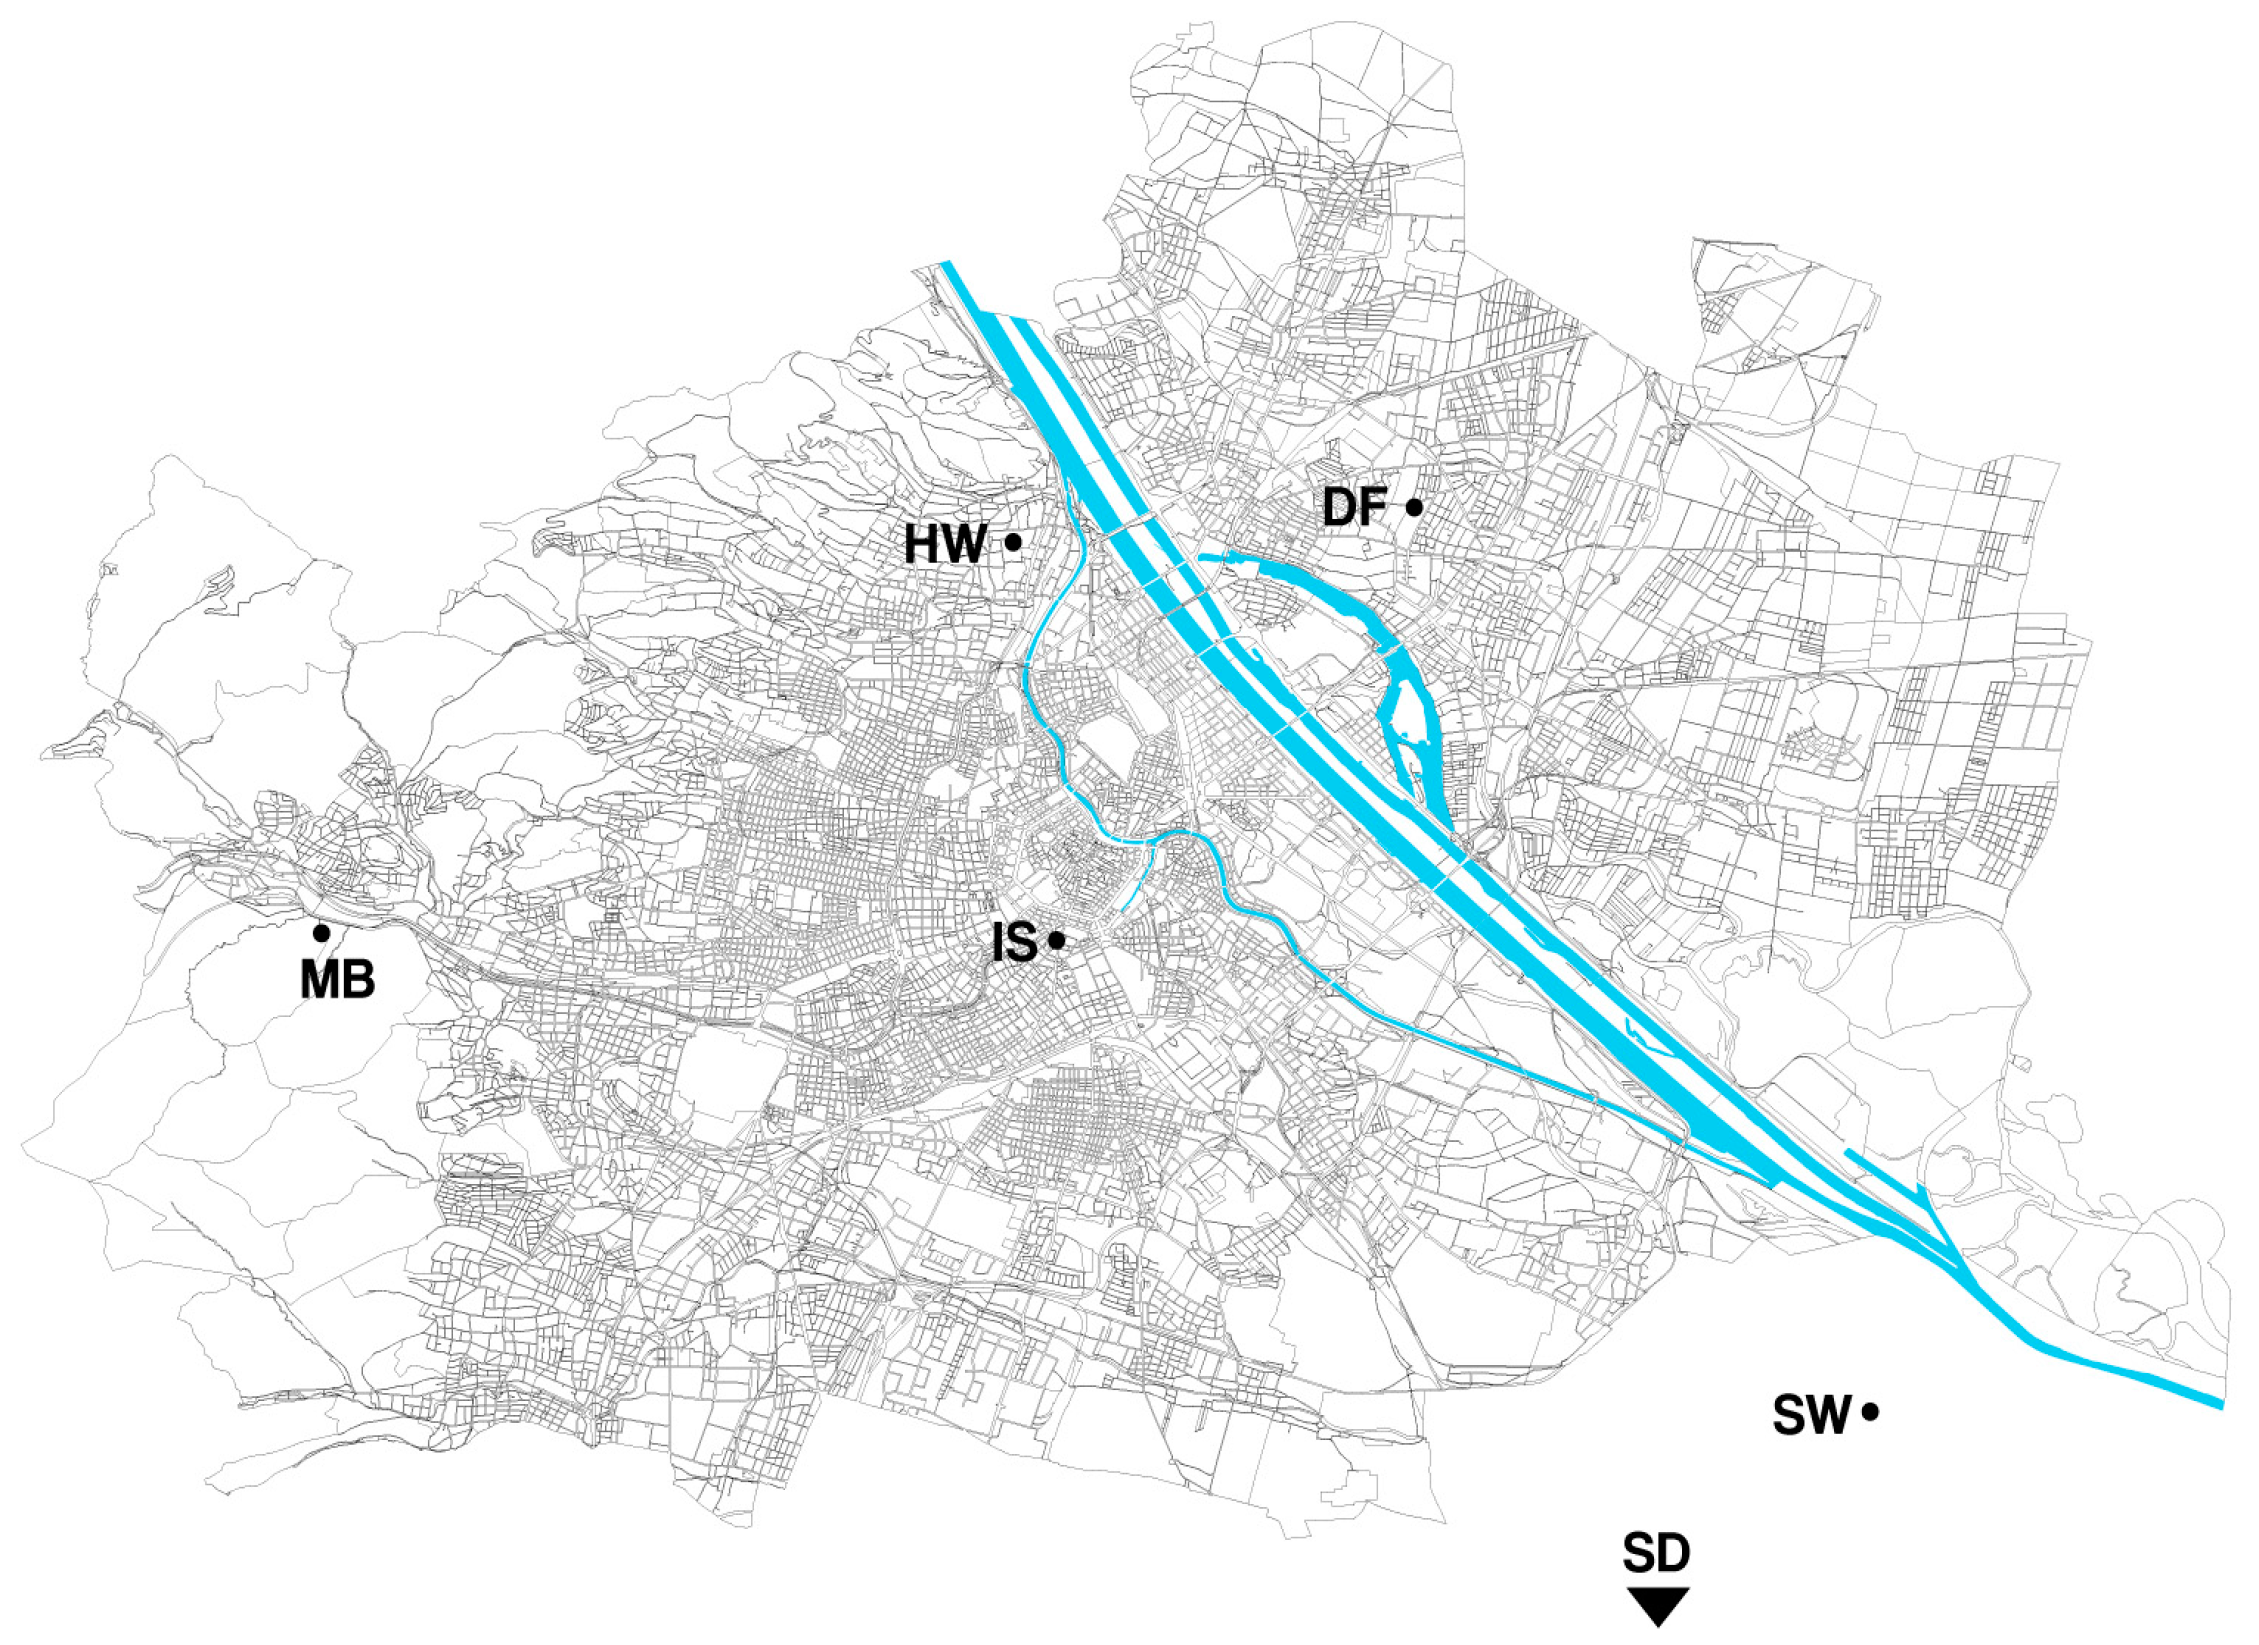
This research is informed by the insight that microclimatic conditions can vary considerably due to the features of the surrounding urban fabric. To illustrate this point, consider a case study for the city of Vienna, Austria. For this purpose, the notion of “Urban Unit of Observation” (U2O) is introduced to systematically address the extent of microclimatic diversity within the urban domains [44,45,46,47]. U2Os represent clearly bounded spatial segments of the urban domain. The size and features of an U2O were determined following insights formulated in previous research [44]. Stewart [42] further stressed the role of scale in microclimate investigations. Thus, for measured microclimatic parameters (e.g., air temperature, wind speed, humidity) to be spatially representative, the size of a sample area should not exceed a few hundred meters in radius. Therefore, a spatial dimension (diameter) of approximately 400 m was targeted for this study. The selected U2Os include both low-density and high-density typologies in and around Vienna (see Figure 1 and Table 1).
Each U2O contains a stationary weather station centrally positioned within the observed domain. A height of 2 m above ground is typically suggested for the elevation of air temperature sensors [48]. However, deviations from this reference height might be occasionally unavoidable due to practical reasons, such as safety issues in the urban context (as seen in Table 1). This circumstance is not seen as problematic, as all air temperature sensors are positioned within the urban canyon and the vertical gradients are small [49]. All stations are operated by the Central Institution for Meteorology and Geodynamics (Zentralanstalt für Meteorologie und Geodynamik, ZAMG). The ZAMG network comprises of approximately 250 semi-automatic weather stations (Teil Automatisches Wetter Erfassungs System—TAWES), which are classified according to the SYNOP (surface synoptic observations) numerical codes [50]. The weather stations records are stored in 10-min resolution. Once stored, quality control of meteorological observations is done using QualiMET system [51] and according to the WMO guidelines, following five test steps: completeness check, climatological consistency check, temporal consistency check, internal consistency check, and spatial consistency check. Additionally, the correction of the hourly-based data is performed using GEKIS (Geografisches Klimainformationssystem—Geographic Climate Information System). After examining and correcting the measured data, they are stored into the main database and archived.
The collected information (air temperature, wind speed, solar radiation, and precipitation) from the aforementioned six weather stations was used to illustrate temporal and spatial variation of microclimatic conditions. To facilitate the representation, visualization, analysis, and processing of the data, we opted to represent the main prevailing “overheating” tendencies (i.e., characteristic location-dependent atmospheric warmth) for the summer season (representing meteorological summer) in terms of two distinct reference days. This intention may be realized via different methods. As there is neither a unique nor a standardized statistical method to achieve this, we opted for the following two-step procedure. In a first step, both warmest and coldest continuous one-week periods were identified for meteorological summer in 2014 (Table 2). Thereby, “warmest” denotes that this period included the highest number of days with maximum hourly temperatures, whereas “coldest” denotes the period of minimum hourly temperatures. In a second step, data from these two one-week periods was further processed to derive respective reference days. Once the one-week period is selected, hourly temperature data is averaged over each day to derive the hourly reference day temperatures of aforementioned one-week period. It should be noted that the above mentioned data evaluation processing was conducted for the central urban area (IS) as it is the most developed part of a city. Hence, the same time frame was then applied for the other areas.

2.2. The Essential Features of an Urban Unit of Observation

The study of the variables relevant to the formation of urban climates holds great potential in generating urban resilience via the realization of effective mitigation measures. As a contribution to ongoing research efforts in this direction, we introduced a systematic framework for the representation of the urban environment and the assessment of its microclimatic variation [44,45,46,47]. The proposed methodology aims to identify essential features of the built environment that are hypothesized to influence urban microclimate variation, thus supporting the development of explanatory theories and predictive models toward the prediction of local differences in the urban climate. To realize this framework, we defined an essential set of geometric (morphological) and semantic (material-related) urban features, hereafter referred to as the U2O variables. The geometric properties (e.g., sky view factor, aspect ratio, built area fraction, built surface fraction, effective mean compactness, etc.) are applied for identification of the urban morphology in an U2O. The physical properties (e.g., albedo, emissivity, specific heat capacity, etc.) describe the thermal characteristics of urban surfaces. A more detailed description of the candidate U2O variables can be found in [44,52].
Once defined, U2O variables must be numerically expressed to make them comparable and accessible for further analysis. In this context, we employed the GIS technology [53] as an operational solution for comprehensive urban form analysis. Comprehensive DEMs with non-spatial text-based attribute information (e.g., land use type, number of building floors, building construction age) provided by the city of Vienna were used as a basis for this analysis. Extensive collaborative efforts have been made to develop a Python-based framework incorporated into the GIS tool for the automated calculation of the salient geometric and physical features of an urban environment, as described in [54,55,56]. It should be noted that detailed urban databases containing comprehensive spatial information are, at times, difficult to obtain. Currently, a number of local municipalities and commercial vendors provide digital datasets. However, the number of such data repositories is expected to increase in the future. Subsequently, we explored the potential relationships between U2O variable values and urban-level microclimatic patterns.

2.3. The Implications for the Buildings

Advancing the understanding of complex urban-level physical phenomena and resulting implications requires, amongst other things, the deployment of sophisticated numeric models and computational platforms [57]. In this context, we focus on comprehensive building thermal performance simulations conducted using Thermal Analysis Simulation Software—EDSL TAS (EDSL, Milton Keynes, Buckinghamshire, United Kingdom) [58]. This tool was selected as it has the capability to systematically asses the thermal behaviour of buildings, while considering a relatively comprehensive range of factors, such as complex building shapes, the shadow effect between buildings, multizone building modelling, and integrated natural and forced airflow [59,60]. To address the issue of model reliability, we have documented the potential of model calibration and validation based on empirical data in [61,
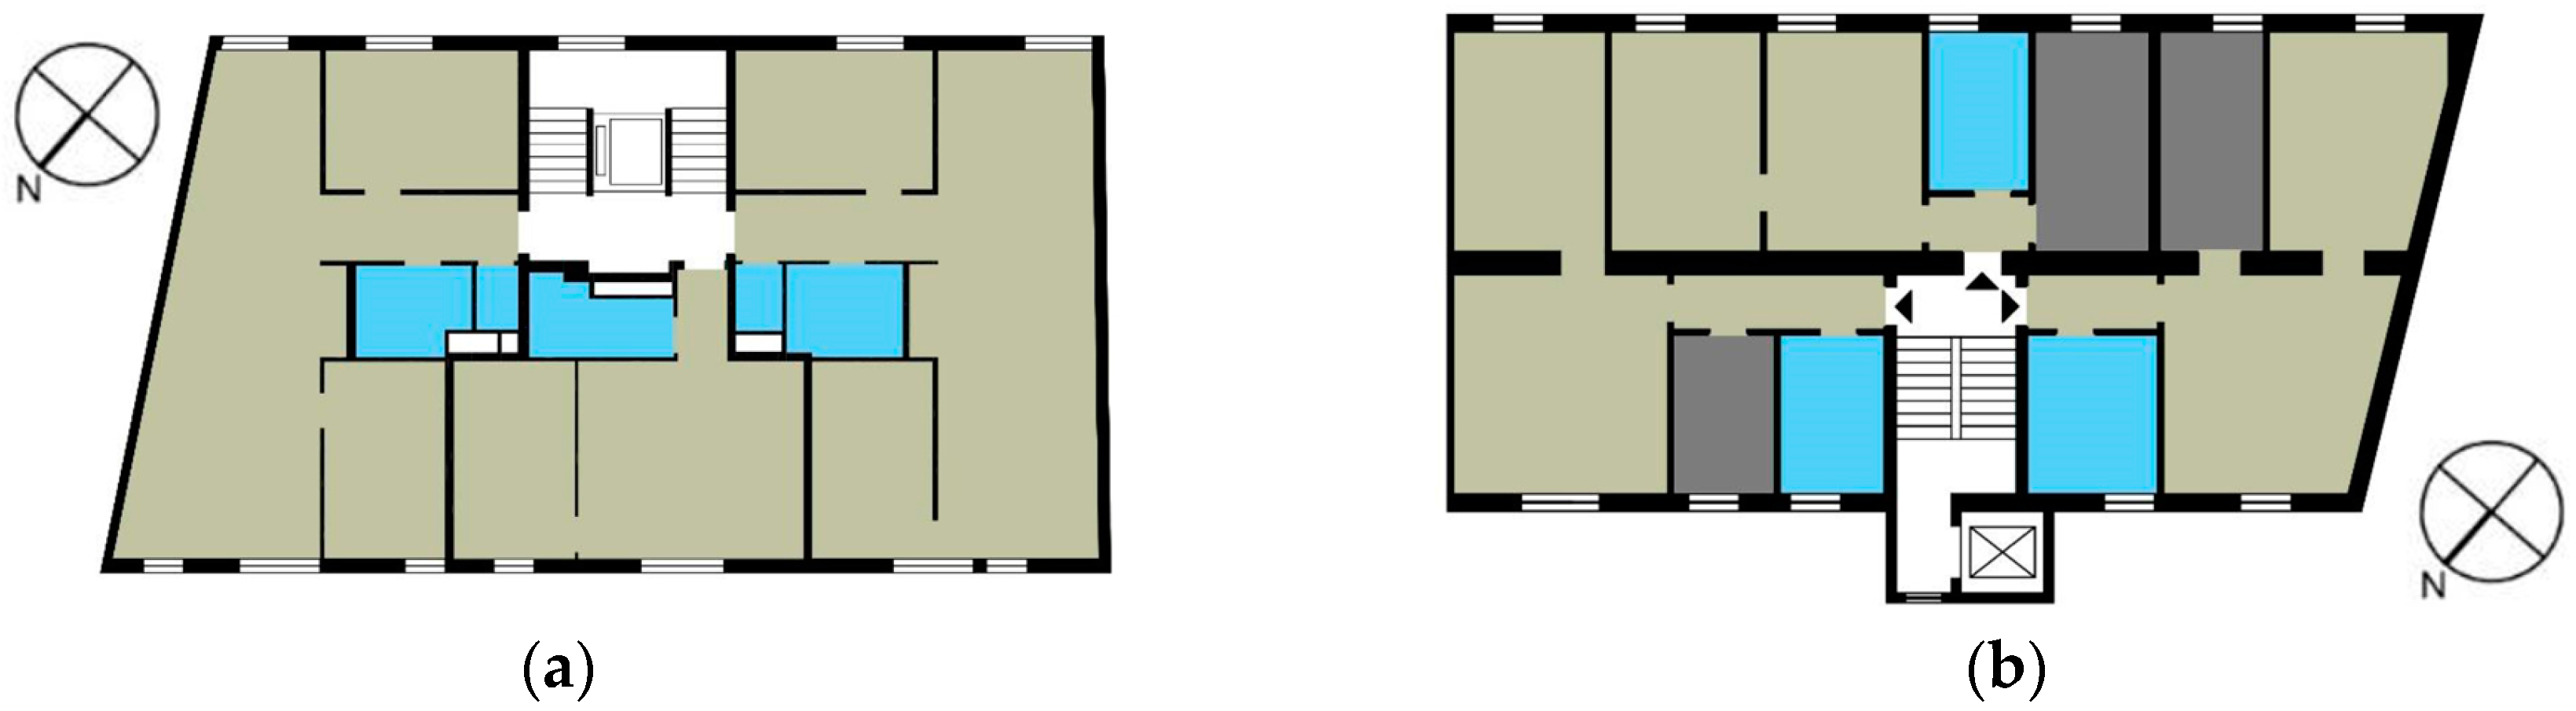
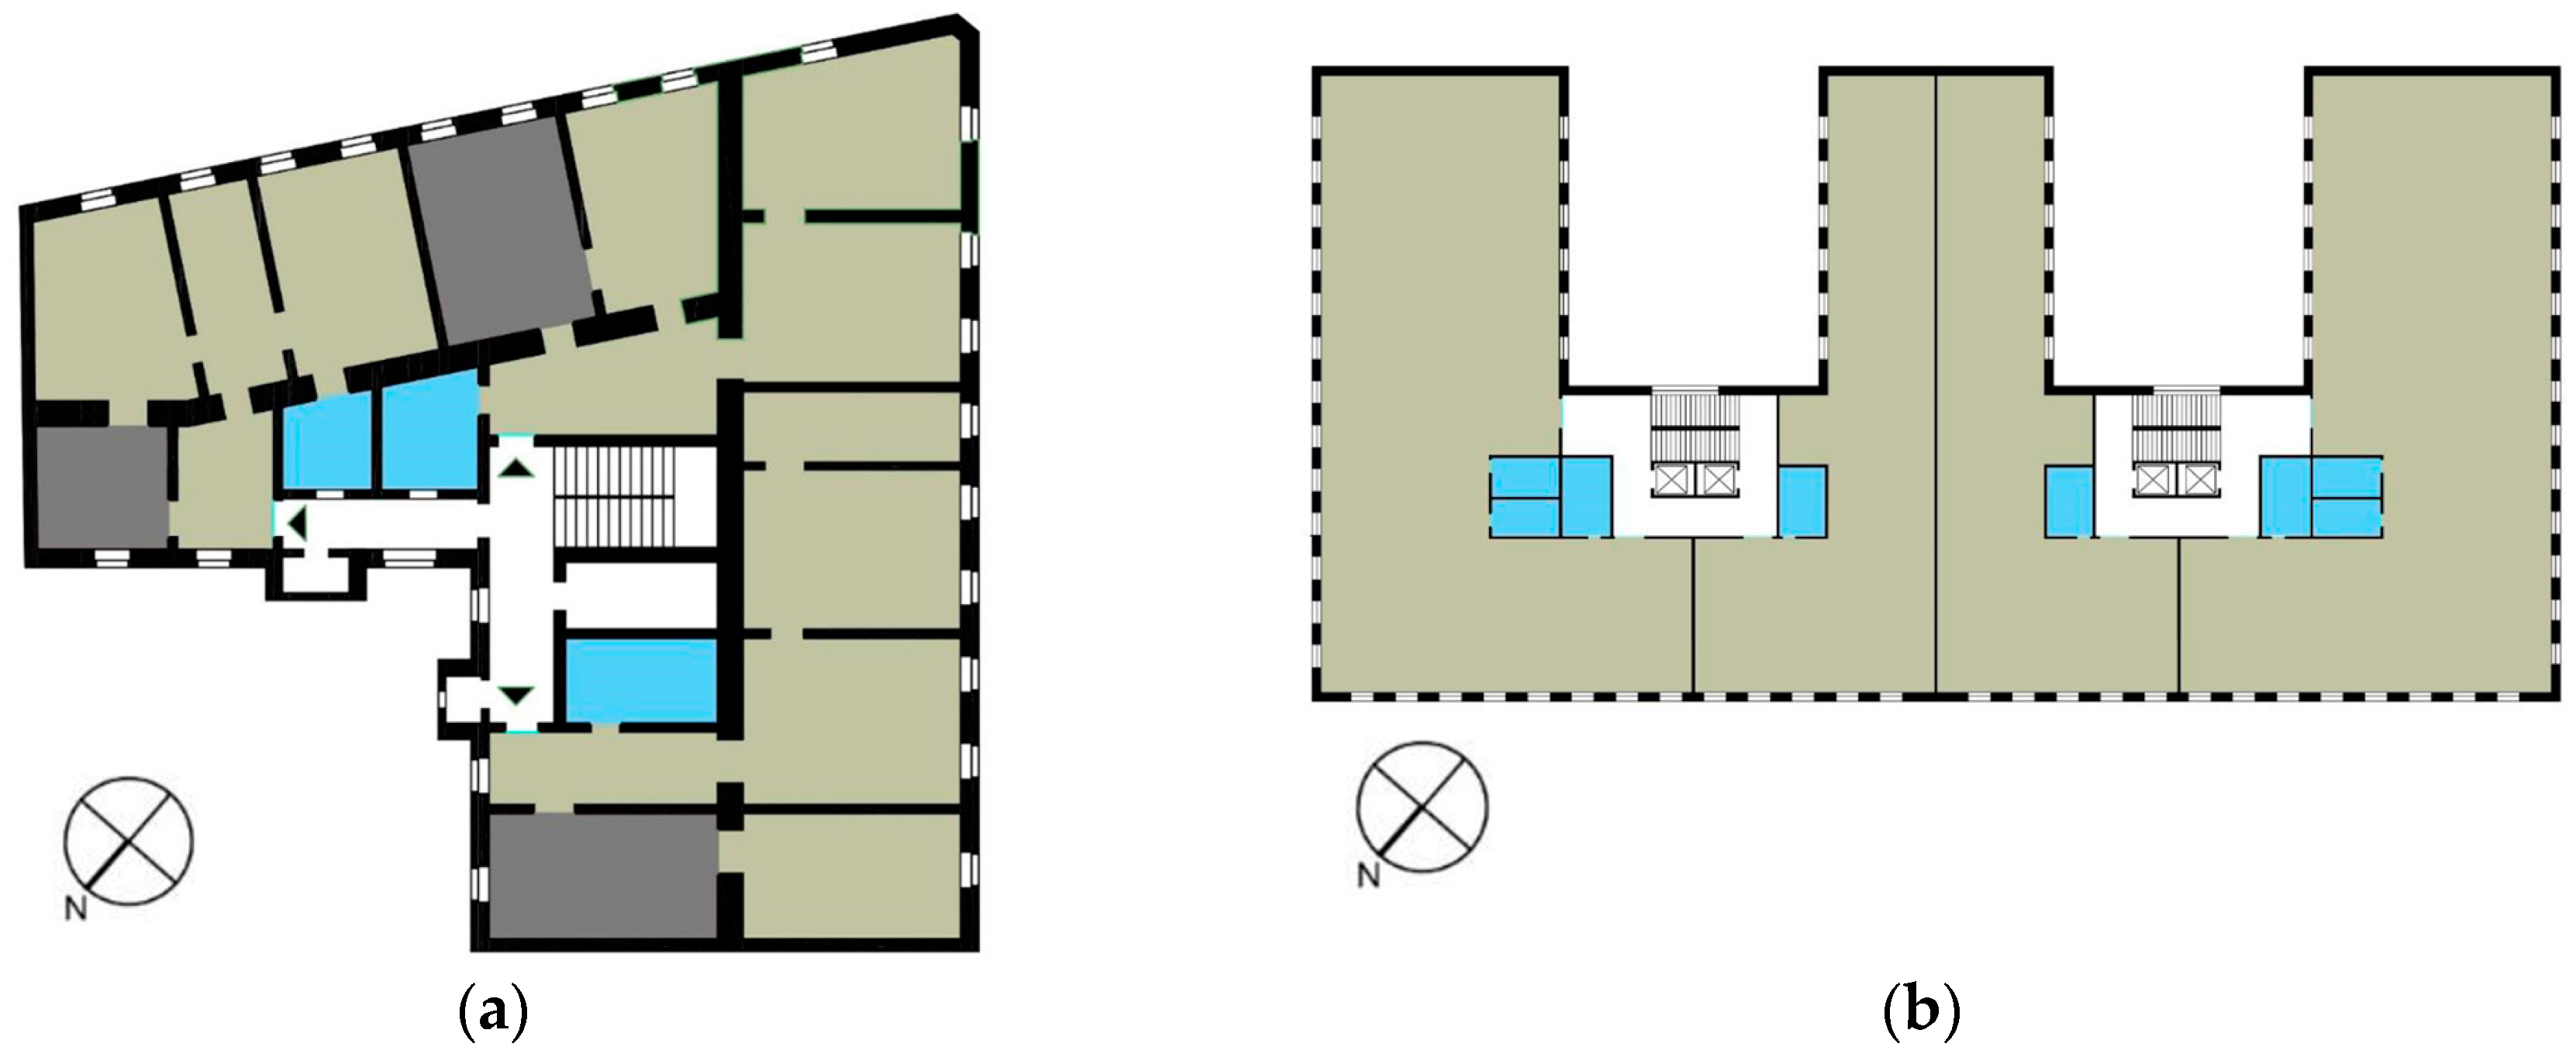
62]. Therefore, the tool represents a valuable resource for the assessment of the building’s energy consumption, carbon emissions from buildings, operating costs, and occupant comfort. Four different buildings were selected and made subject to a systematic inquiry (Figure 2 and Figure 3). These buildings constitute a large fraction of total building stock in Vienna [63] and are selected to represent different building typologies (as seen in Table 3). Namely, MFH 1 represents a multi-family house built using todays design and standards, MFH 2 represents a multi-family house as a typical building of this category from the 1960s, MFH 3 represent a multi-family house of the “Gründerzeithaus” period (from around 1910), and an office building representing todays design and standards. The office building is freestanding, while residential buildings have adjacent buildings on both sides. All buildings have unconditioned basements, while MFH 2 and MFH 3 have unconditioned attics, as well.
Six sets of simulation runs were conducted for each building: A building was virtually placed within each location, and its performance evaluated using six obtained location-specific weather files as boundary conditions. Input assumptions, such as occupancy, internal gains, solar gains, ventilation, and thermostat settings, were based on Austrian standards: ÖNORM B 8110-3, B 8110-5, and B 8110-6 [64,65,66]. The occupancy profiles were defined according to the building typology: For the residential buildings the occupancy was set on 365 days per year and 24 h per day. For the office building, a standard calendar and occupancy schedule were generated based on weekday/weekend schedules, with occupancy hours from 8 a.m. to 8 p.m. on weekdays. All simulations were conducted twice: first in a passive mode (UNCON) to investigate overheating tendencies during summer months, and then in an active operation mode (COND), with an upper and lower limit for the indoor temperature, to investigate heating and cooling loads. Internal gains are divided into equipment gains (Eg), lighting gains (Lg), and latent and sensible occupancy gains (Ol and Os), as seen in Table 4, Table 5 and Table 6. It should be noted that in case of residential buildings, the summer overheating in UNCON mode was computed with an air change rate of 1.5 h−1 (from 9 p.m. to 9 a.m.) and 0.4 h−1 (from 9 a.m. to 9 p.m.).
For the office building, different input assumptions were considered for the office rooms, lobby, and bathroom areas. However, the COND and UNCOND simulations for office rooms and lobby areas differ in air change rates only, thus having an air change rate of 1.5 h−1 during the summer night hours (from 9 p.m. to 9 a.m.). The air change rate for the bathroom area was assumed to be 1 h−1.
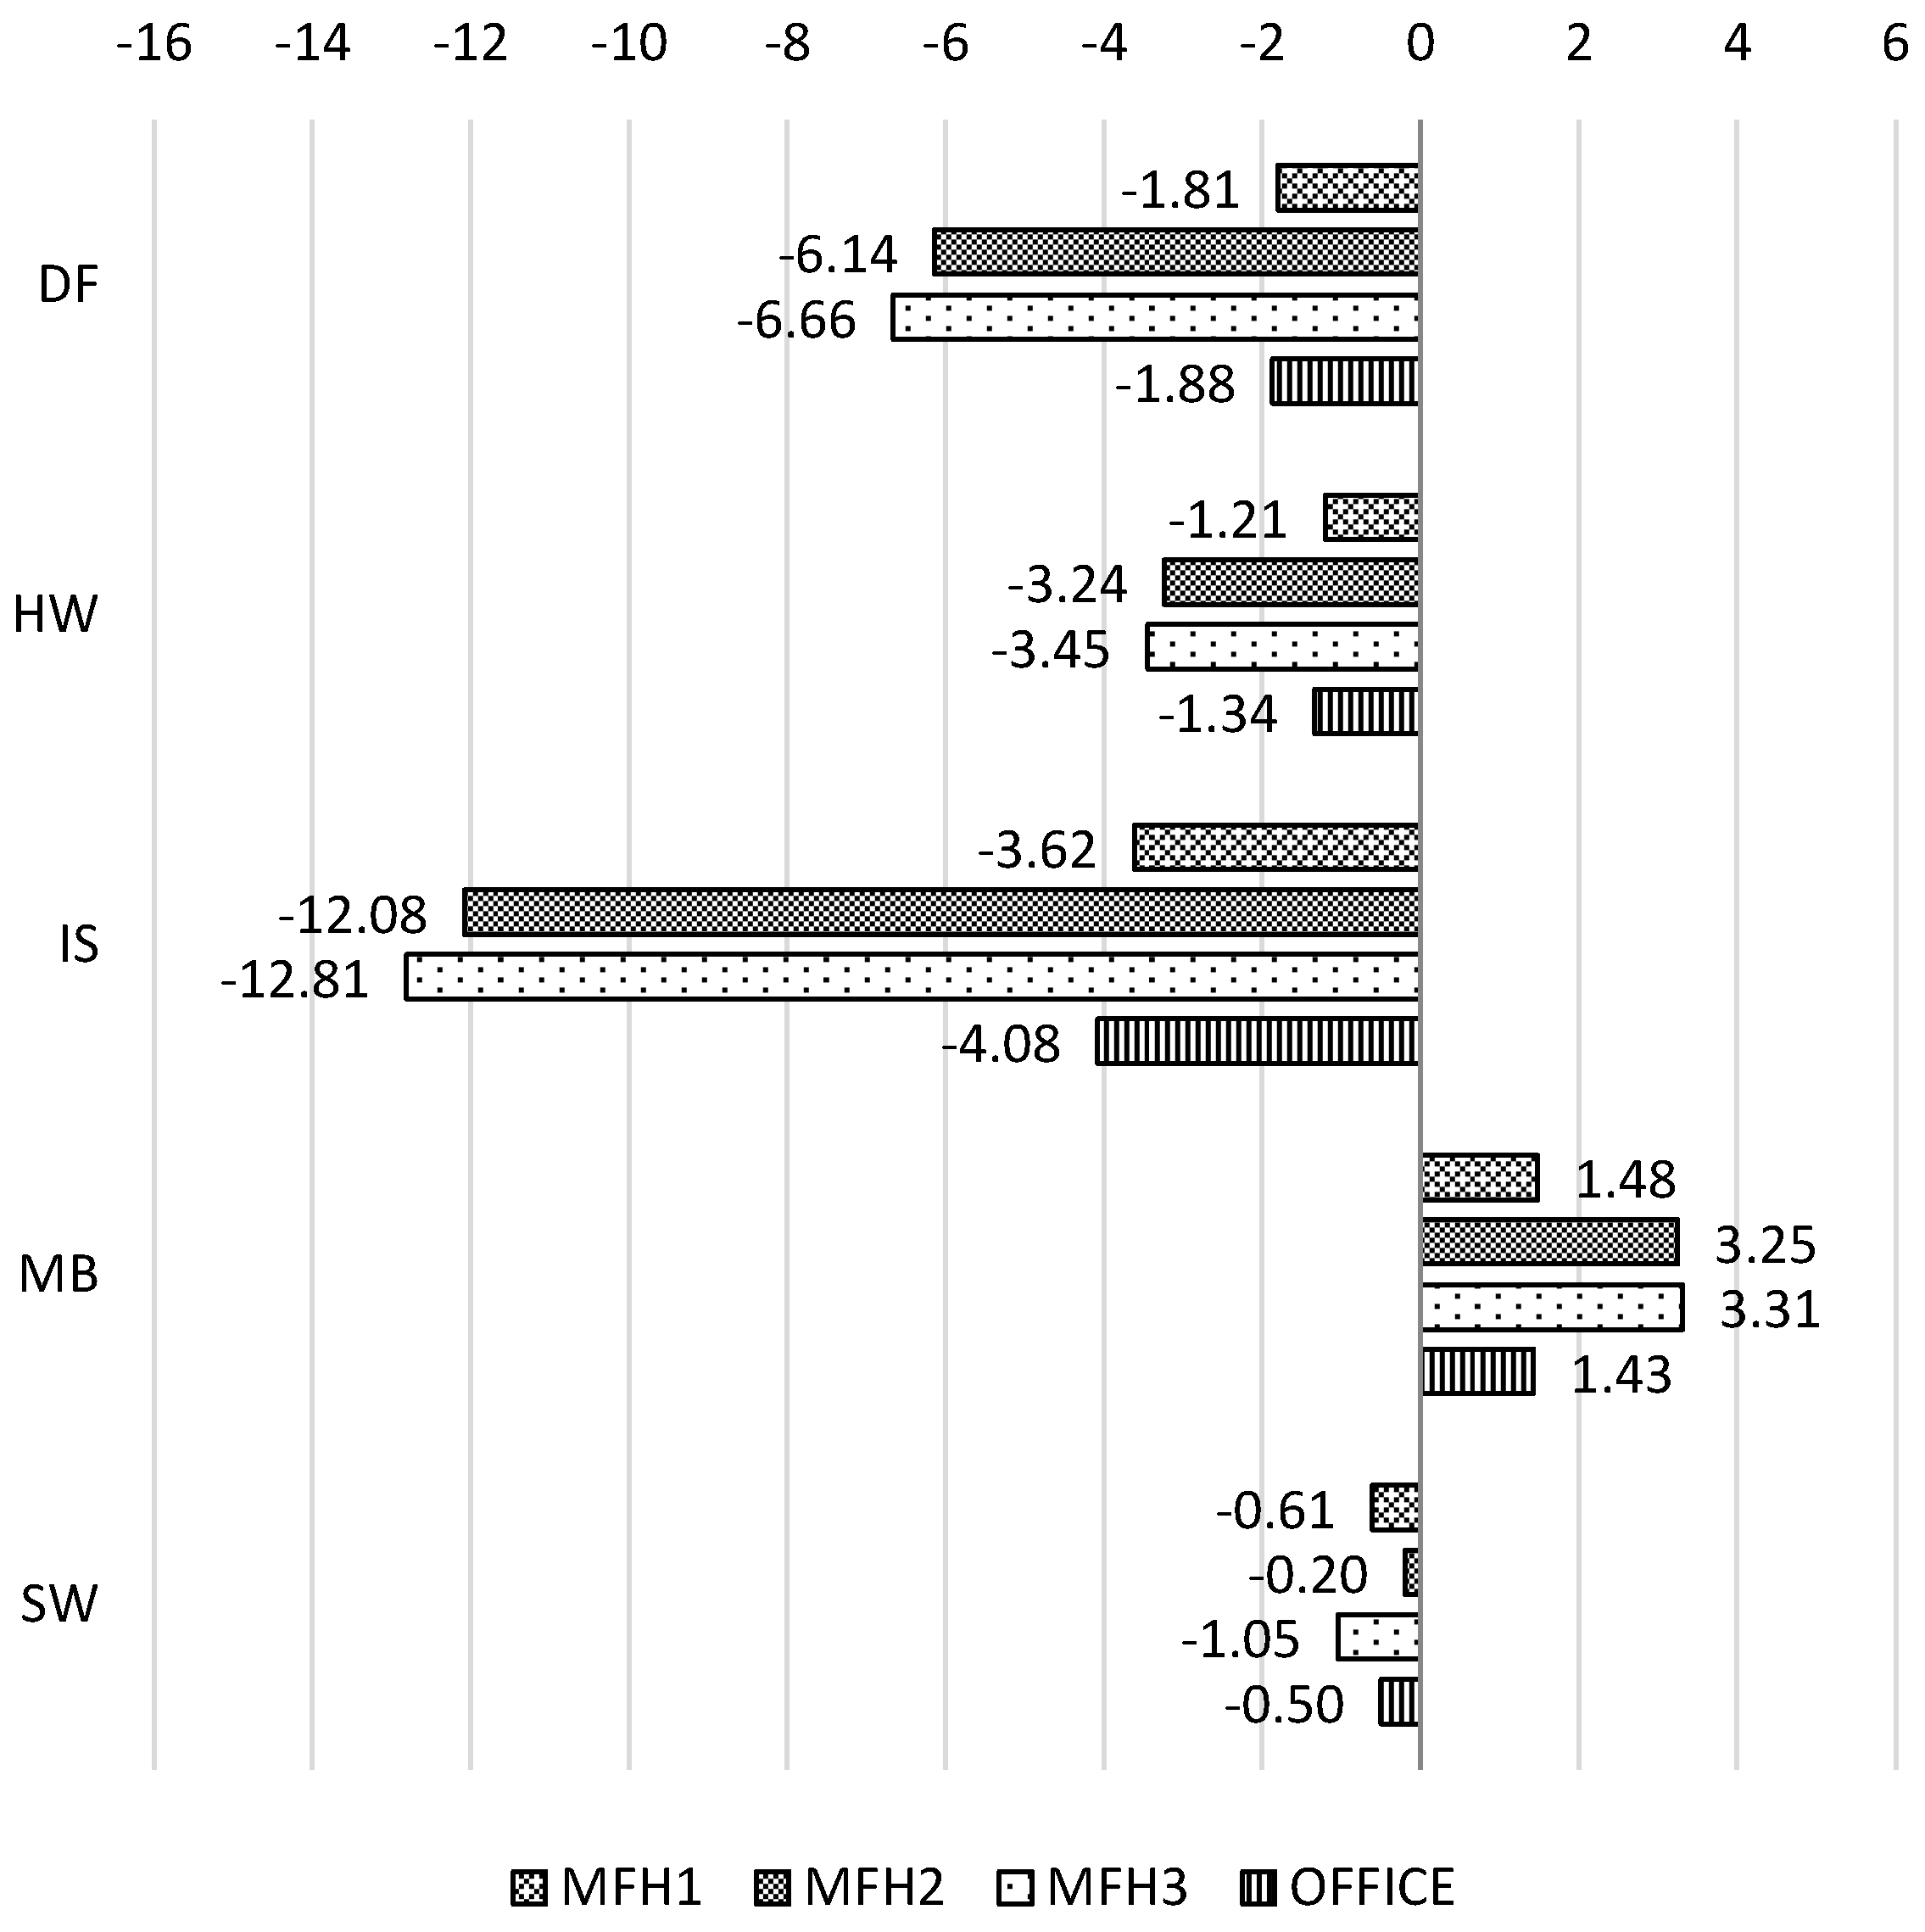
To systematically address the role of microclimatic development in thermal performance of buildings, computed performance indicators were compared and analysed across all locations. Firstly, the mean annual cooling and heating loads for the COND mode were computed with respect to the heated net floor area. Cooling and heating loads of each building were further investigated with respect to the corresponding simulations conducted with weather file obtained at non-urban location SD, thus accounting for the urban influence on thermal performance of buildings [41]. Additionally, in order to determine the differences between locations, spatial variance (VS,l) was calculated for the annual heating and cooling loads, as follows:
V S , l = L max L min
Herein, Lmax denotes maximum annual heating/cooling load for a building for each location, and Lmin denotes the corresponding minimum annual heating/cooling load.
Lastly, the overheating tendencies were analysed in terms of cooling degree hours (CDH), as follows:
C D H b = i = 1 n ( T i T b ) ,  for all cases when  T i > T b
Herein, Ti denotes the temperature in the room, and Tb denotes the base temperature. The reference base temperature for the residential buildings is 27 °C and, for the office building, 26 °C. However, in order to make this information comparable, the weighted mean overheating (OHm) for each building was calculated as follows:
O H m = ( C D H R 1 × A R 1 + + C D H R n × A R n ) A R 1 + + A R n
Herein, ARn denotes the area of the room (m2), and CDHRn denotes the corresponding cooling degree hours (Kh).

3. Results and Discussion

3.1. Representation of Microclimatic Variance

Figure 4 illustrates, for both one-week periods, the mean hourly air temperature for the selected locations. These results demonstrate the significant extent of the urban ambient temperature differences across time (day, within-season) and space (location). Generally, the central urban location (IS) displays the highest air temperature values, during both the cool and the hot period. The results suggest more pronounced temperature differences (up to 5 K) between the locations during the night hours. This may be explained with regard to the factors such as the thermal inertia of the building masses, the abundance of impervious surfaces, and the reduced night-time skyward radiation. However, during the day, temperature differences are significantly reduced (up to 1 K) as all locations show a similar warming trend. Results further revealed the lowest diurnal fluctuations of air temperature at the central urban location (IS), of 11 K and 6 K, during hot and cool periods, respectively. This further stresses impeded potential for night-time long-wave radiative heat loss.

3.2. Influence of Independent Variables

Once the air temperature values are computed, they can be analysed in the context of the respective U2O attributes. Figure 5 illustrate the explanatory potential of the derived U2O values in an original differential profile format, in which the scales are arranged in a manner so as to bring out the characteristics of specific urban locations and highlight their differences. Distinct clusters observed in this figure highlight the differences between highly developed densely built-up areas (right side of the graph) and less developed areas (left side of the graph). One important aspect of further inquiry is to empirically test the specific role of U2O variables in view of the heat balance of urban systems. Despite the presently very small number of instances, we undertook such an inquiry for the selected hot summer week, due to the severe risks of heat waves in Central Europe in the summer period [67]. Specifically, we investigated how the surrounding urban fabric affects the night-time cooling potential. In general, the initial results suggest a positive or a negative correlation between the values of selected U2O variables and minimum night-time air temperatures computed for the selected hot week period. Thus, U2O variables, such as aspect ratio, built area fraction, equivalent building height, and effective mean compactness are observed to obstruct night-time skyward radiation, whereas sky view factor, unbuilt area fraction, pervious surface fraction, and albedo may enhance the potential for night-time cooling. Figure 6 illustrates a number of these correlations. The highest positive correlation (R-squared equals to 0.93) was noted between minimum night-time air temperature and impervious cover within an area. The highest negative correlation (R2 = 0.90) was noted between the minimum night-time air temperature and albedo. As stressed before, six data points are undoubtedly insufficient to offer statistically meaningful correlations. Nonetheless, our findings so far are promising and encourage further explorations in this direction. We are, thus, currently collecting data from a larger network of public and private weather stations to be deployed toward future research and improvement activities.

3.3. Implications for the Buildings

Finally, the impact of above-mentioned location-specific weather data on building’s energy use can be estimated. The computed mean annual heating and cooling load data point to a significant location-dependent differences between the performance of the buildings (Figure 7, Figure 8 and Figure 9). Thereby, MFH3 displays the highest deviation of mean annual heating loads across locations of 16.1 kWhm−2·a−1 (Figure 7). The mean annual cooling load data show less variation, with maximum reaching 4.7 kWhm−2·a−1 for the office building. The highest deviation in heating loads for all buildings, in respect to the corresponding SD case, can be observed in location IS (Figure 8). It can be further observed that all buildings have a tendency toward a lower heating load than the SD case when positioned within locations with a higher built area fraction, higher impervious cover, and lower sky view factor (from 3.62 kWhm−2·a−1 to 12.81 kWhm−2·a−1 lower). Furthermore, the mean annual cooling load data at same locations (IS, HW, and DF) is higher than the respective SD case (Figure 9). Additionally, the highest values were again noted in location IS. This might be due to the impeded cooling regimes and corresponding higher air temperatures of respective urban domains.
Additionally, simulation results reveal substantial variation in overheating values across different building typologies (Figure 10). The highest overheating was noted in MFH1 and OFFICE (as seen in Figure 10). This might be due to the higher fraction of window area of these buildings, with 16.8% in MFH1 and 27.2% in OFFICE, compared to the 9.4% in MFH2 and 11.8% in MFH3. Looking at different locations, the highest values can clearly be seen for IS in all four buildings, followed by location DF.
It can be concluded that deployment of location-independent weather data sources (e.g., standardized weather files) in the thermal performance of buildings involves various sources of errors and may lead to considerable misestimations of energy use in buildings. In other words, simulation-based assessment of buildings’ thermal behavior can be expected to face considerable additional uncertainties if the deployed representations of microclimatic boundary conditions are: (i) indifferent to complex geometry and material properties of the surrounding urban domain; and (ii) ignore the dynamic variability of microclimatic conditions around the designated location of a building.

4. Conclusions

We presented the results of a multi-year effort concerned with the extent and resulting implications of the microclimatic variation in the city of Vienna, Austria. The objectives of this research effort were to contribute to a deeper understanding of the location-dependent microclimatic conditions and related implications for thermal performance of buildings. The systematic study of the intra-urban microclimatic variation was conducted across a number of low-density and high-density typologies. The main findings may be summarized as follows:
  • Empirical observations revealed certain time-dependent (diurnal, nocturnal, and within-season) patterns implying larger temperature differences (up to 5 K) between locations during the night hours of a hot week in summer.
  • The results further suggested that local climatic context can vary considerably depending on the site features such as the urban density and morphology, surface properties, extent of vegetation, etc. To further analyze this circumstance, we defined and computed the values of a number of morphological and physical features of urban settlements that influence the formation of urban microclimates. The obtained data further allowed for the exploration of plausible correlations between the night-time cooling potential and specific urban attributes. For example, it was noted that a higher impervious surface fraction noticeably correlated with higher night-time air temperature in the urban canyon (R2 = 0.93). Likewise, higher albedo may reduce the night-time air temperature in the urban canyon (R2 = 0.90). These findings offer a promising starting point for further explorations toward developing empirically-based predictive models that can improve the understanding and prediction of local differences in the urban climate.
  • Furthermore, we investigated the ramifications of observed microclimatic variation for the simulation-based assessment of buildings' thermal performance. Our findings point to the significant deviations in computed heating and cooling loads, as well as in overheating levels, with regard to both the location and input data (weather file). Thereby, the variation of mean annual heating load across locations may be as high as 16.1 kWhm−2·a−1 for residential building typology. This issue is especially critical given the potential for additional uncertainties when conducting simulations using standardized (location-independent) representations of the microclimatic boundary conditions.

Acknowledgments

The research work presented in this paper was supported in part within the framework of the EU-Project “Development and application of mitigation and adaptation strategies and measures for counteracting the global Urban Heat Island phenomenon” (Central Europe Program, No. 3CE292P3). The authors also acknowledge the TU Wien University Library for financial support through its Open Access Funding Program.

Author Contributions

Milena Vuckovic, Kristina Kiesel and Ardeshir Mahdavi equally contributed to the paper. Ardeshir Mahdavi further revised the paper critically prior the final submission. Milena Vuckovic processed and analyzed the empirically obtained microclimate data. Kristina Kiesel conducted the building thermal performance simulations.

Conflicts of Interest

The authors declare no conflict of interest.

References

  1. Gulyás, A.; Unger, J.; Matzarakis, A. Assessment of the microclimatic and human comfort conditions in a complex urban environment: Modelling and measurements. Build. Environ. 2006, 41, 1713–1722. [Google Scholar] [CrossRef]
  2. Nikolopouloua, M.; Lykoudisb, S. Thermal comfort in outdoor urban spaces: Analysis across different European countries. Build. Environ. 2006, 41, 1455–1470. [Google Scholar] [CrossRef]
  3. Alcoforado, M.J.; Andrade, H. Global Warming and the Urban Heat Island. In Urban Ecology. An International Perspective on the Interaction between Humans and Nature; Marzluff, J.M., Shulenberger, E., Endlicher, W., Alberti, M., Bradley, G., Ryan, C., Simon, U., ZumBrunnen, C., Eds.; Springer: Berlin, Germany, 2008; pp. 249–262. [Google Scholar]
  4. Codrington, S. Planet Geography, 7th ed.; Solid Star Press: Sydney, Australia, 2013. [Google Scholar]
  5. Nuruzzaman, Md. Urban Heat Island: Causes, Effects and Mitigation Measures—A Review. Int. J. Environ. Monit. Anal. 2015, 3, 67–73. [Google Scholar] [CrossRef]
  6. Yow, D.M. Urban Heat Islands: Observations, Impacts, and Adaptation. Geogr. Compass 2007, 1, 1227–1251. [Google Scholar] [CrossRef]
  7. Hatuka, T.; Saaroni, H. Resilience of outdoor spaces in an era of climate change: The problem of developing countries. Sustainability 2013, 5, 90–99. [Google Scholar] [CrossRef]
  8. Grimmond, C.S.B.; Oke, T.R. Heat Storage in Urban Areas: Local-Scale Observations and Evaluation of a Simple Model. J. Appl. Meteorol. 1999, 38, 922–940. [Google Scholar] [CrossRef]
  9. Golden, J.S. The Built Environment Induced Urban Heat Island Effect in Rapidly Urbanizing Arid—A Sustainable Urban Engineering Complexity. Environ. Sci. 2004, 1, 321–349. [Google Scholar] [CrossRef]
  10. Grimmond, C.S.B. Urbanization and global environmental change: Local effects of urban warming. Cities Glob. Environ. Chang. 2007, 173, 83–88. [Google Scholar] [CrossRef]
  11. Gartland, L. Heat Islands: Understanding and Mitigating Heat in Urban Areas, 1st ed.; Earthscan: London, UK, 2008. [Google Scholar]
  12. Brown, R. Design with Microclimate—The Secret to Comfortable Outdoor Space, 1st ed.; Island Press: Washington, DC, USA, 2010. [Google Scholar]
  13. Erell, E.; Pearlmutter, D.; Williamson, T.J. Urban Microclimate: Designing the Spaces between Buildings, 1st ed.; Earthscan: London, UK, 2011. [Google Scholar]
  14. Krpo, A.; Salamanca, F.; Martilli, A.; Clappier, A. On the Impact of Anthropogenic Heat Fluxes on the Urban Boundary Layer: A Two-Dimensional Numerical Study. Bound.-Layer Meteorol. 2010, 136, 105–127. [Google Scholar] [CrossRef]
  15. Silva, H.R.; Phelan, P.E.; Golden, J.S. Modeling effects of urban heat island mitigation strategies on heat-related morbidity: A case study for Phoenix, Arizona, USA. Int. J. Biometeorol. 2010, 54, 13–22. [Google Scholar] [CrossRef] [PubMed]
  16. Ellis, K.N.; Hathaway, J.M.; Mason, L.R.; Howe, D.A.; Epps, T.H.; Brown, V.M. Summer temperature variability across four urban neighborhoods in Knoxville, Tnnessee, USA. Theor. Appl. Climatol. 2015. [Google Scholar] [CrossRef]
  17. Jeganathan, A.; Andimuthu, R.; Prasannavenkatesh, R.; Kumar, D.S. Spatial variation of temperature and indicative of the urban heat island in Chennai Metropolitan Area, India. Theor. Appl. Climatol. 2016, 123, 83–95. [Google Scholar] [CrossRef]
  18. Chatzidimitriou, A.; Yannas, S. Microclimate development in open urban spaces: The influence ofform and materials. Energy Build. 2015, 108, 156–174. [Google Scholar] [CrossRef]
  19. Berardi, U.; Wang, Y. The effect of a denser city over the urban microclimate: The case of Toronto. Sustainability 2016, 8, 822. [Google Scholar] [CrossRef]
  20. Ambrosini, D.; Galli, G.; Mancini, B.; Nardi, I.; Sfarra, S. Evaluating mitigation effects of urban heat islands in a historical small center with the ENVI-Met® climate model. Sustainability 2014, 6, 7013–7029. [Google Scholar] [CrossRef]
  21. Liu, H.-L.; Shen, Y.-S. The impact of green space changes on air pollution and microclimates: A case study of the taipei metropolitan area. Sustainability 2014, 6, 8827–8855. [Google Scholar] [CrossRef]
  22. Jamei, E.; Rajagopalan, P.; Seyedmahmoudian, M.; Jamei, Y. Review on the impact of urban geometry and pedestrian level greening on outdoor thermal comfort. Renew. Sustain. Energy Rev. 2016, 54, 1002–1017. [Google Scholar] [CrossRef]
  23. Edussuriya, P.; Chan, A.; Ye, A. Urban morphology and air quality in dense residential environments in Hong Kong. Part I: District-level analysis. Atmos. Environ. 2011, 45, 4789–4803. [Google Scholar] [CrossRef]
  24. Greene, S.; Kalkstein, L.S.; Mills, D.M.; Samenow, J. An Examination of Climate Change on Extreme Heat Events and Climate—Mortality Relationships in Large U.S. Cities Weather Clim. Soc. 2011, 3, 281–292. [Google Scholar] [CrossRef]
  25. Wong, N.H.; Jusuf, S.K.; Syafii, N.I.; Chen, Y.; Hajadi, N.; Sathyanarayanan, H.; Manickavasagam, Y.V. Evaluation of the impact of the surrounding urban morphology on building energy consumption. Sol. Energy 2011, 85, 57–71. [Google Scholar] [CrossRef]
  26. Moonen, P.; Defraeye, T.; Dorer, V.; Blocken, B.; Carmeliet, J. Urban Physics: Effect of the micro-climate on comfort, health and energy demand. Front. Archit. Res. 2012, 1, 197–228. [Google Scholar] [CrossRef]
  27. Rode, P.; Keim, C.; Robazza, G.; Viejo, P.; Schofield, J. Cities and energy: Urban morphology and residential heat-energy demand. Environ. Plan. B 2014, 41, 138–162. [Google Scholar] [CrossRef] [Green Version]
  28. Pisello, A.L.; Pignatta, G.; Castaldo, V.L.; Cotana, F. The impact of local microclimate boundary conditions on building energy performance. Sustainability 2015, 7, 9207–9230. [Google Scholar] [CrossRef]
  29. Salamanca, F.; Georgescu, M.; Mahalov, A.; Moustaoui, M.; Wang, M. Anthropogenic heating of the urban environment due to air conditioning. J. Geophys. Res. Atmos. 2014, 119, 1–17. [Google Scholar] [CrossRef]
  30. Colombert, M.; Diab, Y.; Salagnac, J.-L.; Morand, D. Sensitivity study of the energy balance to urban characteristics. Sustain. Cities Soc. 2011, 1, 125–134. [Google Scholar] [CrossRef]
  31. Oke, T.R. City size and the urban heat island. Atmos. Environ. 1973, 7, 769–779. [Google Scholar] [CrossRef]
  32. Arnfield, A.J. Two decades of urban climate research: A review of turbulence, exchanges of energy and water, and the urban heat island. Int. J. Climatol. 2003, 23, 1–26. [Google Scholar] [CrossRef]
  33. Blazejczyk, K.; Bakowska, M.; Wieclaw, M. Urban heat island in large and small cities. In Proceedings of the 6th International Conference on Urban Climate, Göteborg, Sweden, 12–16 June 2006; pp. 794–797.
  34. Gaffin, S.R.; Rosenzweig, C.; Khanbilvardi, R.; Parshall, L.; Mahani, S.; Glickman, H.; Goldberg, R.; Blake, R.; Slosberg, R.B.; Hillel, D. Variations in New York City’s urban heat island strength over time and space. Theor. Appl. Climatol. 2008, 94, 1–11. [Google Scholar] [CrossRef]
  35. Giridharan, R.; Kolokotroni, M. Urban heat island characteristics in London during winter. Sol. Energy 2009, 83, 1668–1682. [Google Scholar] [CrossRef]
  36. Solecki, W.D.; Rosenzweig, C.; Parshall, L.; Pope, G.; Clark, M.; Cox, J.; Wiencke, M. Mitigation of the heat island effect in urban New Jersey. Environ. Hazards 2005, 6, 39–49. [Google Scholar] [CrossRef]
  37. O'Malley, C.; Piroozfarb, P.A.E.; Farr, E.R.P.; Gates, J. An investigation into minimizing urban heat island (UHI) effects: A UK perspective. Energy Procedia 2014, 62, 72–80. [Google Scholar] [CrossRef]
  38. Santamouris, M. Analyzing the heat island magnitude and characteristics in one hundred Asian and Australian cities and regions. Sci. Total Environ. 2015, 512–513, 582–598. [Google Scholar] [CrossRef] [PubMed]
  39. Santamouris, M. Heat Island Research in Europe: The State of the Art. Adv. Build. Energy Res. 2007, 1, 123–150. [Google Scholar] [CrossRef]
  40. Voogt, J.A. Urban Heat Island. In Encyclopedia of Global Environmental Change; Munn, T., Ed.; Wiley: Chichester, UK, 2003; Volume 3, pp. 660–666. [Google Scholar]
  41. Lowry, W.P. Empirical Estimation of Urban Effects on Climate: A Problem Analysis. J. Appl. Meteorol. 1977, 16, 129–135. [Google Scholar] [CrossRef]
  42. Stewart, I.D. A systematic review and scientific critique of methodology in modern urban heat island literature. Int. J. Climatol. 2011, 31, 200–217. [Google Scholar] [CrossRef]
  43. Stewart, I.D.; Oke, T.R. Local Climate Zones for Urban Temperature Studies. Bull. Am. Meteorol. Soc. 2012, 93, 1879–1900. [Google Scholar] [CrossRef]
  44. Mahdavi, A.; Kiesel, K.; Vuckovic, M. A framework for the evaluation of urban heat island mitigation measures. In Proceedings of the SB13 Munich Conference, Munich, Germany, 24–26 April 2013.
  45. Mahdavi, A.; Kiesel, K.; Vuckovic, M. Empirical and computational assessment of the urban heat island phenomenon and related mitigation measures. Geogr. Polonica 2014, 87, 505–516. [Google Scholar] [CrossRef]
  46. Mahdavi, A.; Kiesel, K.; Vuckovic, M. Empirical and computational assessment of the urban heat island phenomenon and related mitigation measures. In Proceedings of the 10th Nordic Symposium on Building Physics, Lund, Sweden, 15–19 June 2014.
  47. Vuckovic, M.; Kiesel, K.; Mahdavi, A. Toward advanced representations of the urban microclimate in building performance simulation. Sustain. Cities Soc. 2016, 27, 356–366. [Google Scholar] [CrossRef]
  48. World Meteorological Organization. Guide to Meteorological Instruments and Methods of Observation, WMO-No. 8, 7th ed.; World Meteorological Organization: Geneva, Switzerland, 2008. [Google Scholar]
  49. Oke, T.R. Towards better scientific communication in urban climate. Theor. Appl. Climatol. 2006, 84, 179–190. [Google Scholar] [CrossRef]
  50. ZAMG. Zentralanstalt für Meteorologie und Geodynamik. Available online: http://www.zamg.ac.at (accessed on 1 September 2016).
  51. Svensson, P.; Björnsson, H.; Samuli, A.; Andresen, L.; Bergholt, L.; Tveito, O.E.; Agersten, S.; Pettersson, O.; Vejen, F. Quality Control of Meteorological Observations, Description of Potential HQC Systems; Norwegian Meteorological Institute: Oslo, Norway, 2004. [Google Scholar]
  52. Mahdavi, A.; Kiesel, K.; Vuckovic, M. Methodologies for UHI Analysis. In Counteracting Urban Heat Island Effects in a Global Climate Change Scenario; Musco, F., Ed.; Springer: Berlin, Germany, 2016; pp. 71–91. [Google Scholar] [CrossRef]
  53. QGIS 2.10. Available online: www.qgis.org/ (accessed on 1 September 2016).
  54. Glawischnig, S.; Kiesel, K.; Mahdavi, A. Feasibility analysis of open-government data for the automated calculation of the micro-climatic attributes of Urban Units of Observation in the city of Vienna. In Proceedings of the 2nd ICAUD International Conference in Architecture and Urban Design, Tirana, Albania, 8–10 May 2014.
  55. Glawischnig, S.; Hammerberg, K.; Vuckovic, M.; Kiesel, K.; Mahdavi, A. A case study of geometry-based automated calculation of microclimatic attributes. In Proceedings of the 10th European Conference on Product and Process Modelling, Vienna, Austria, 17–19 September 2014.
  56. Hammerberg, K.; Mahdavi, A. GIS-based simulation of solar radiation in urban environments. In Proceedings of the ECPPM 2014, eWork and eBusiness in Architecture, Engineering and Construction, Vienna, Austria, 17–19 September 2014.
  57. Mirzaei, P.A.; Haghighat, F. Approaches to study Urban Heat Island—Abilities and limitations. Build. Environ. 2010, 45, 2192–2201. [Google Scholar] [CrossRef]
  58. Thermal Analysis Simulation Software—EDSL TAS. Available online: www.edsl.net/ (accessed on 1 September 2016).
  59. Zoras, S.; Dimoudi, A. Modelling and Bioclimatic Interventions in Outdoor Spaces. In Energy Performance of Buildings, Energy Efficiency and Built Environment in Temperate Climates; Boemi, S.-N., Irulegi, O., Santamouris, M., Eds.; Springer: Berlin, Germany, 2016; pp. 523–540. [Google Scholar]
  60. Abdullah, A.H.; Wang, F. Modelling Thermal Stratification in Atrium Using TAS Program and Verification of Prediction Results. Int. J. Integrated Eng. (Issue Civ. Environ. Eng.) 2009, 1, 79–93. [Google Scholar]
  61. Mahdavi, A.; Orehounig, K.; Mikats, N.; Lambeva, L.; El-Habashi, A. Analyzing Traditional Buildings via Empirically Calibrated Building Performance Models. In Proceedings of the 10th International Building Performance Simulation Association Conference and Exhibition, Beijing, China, 3–6 September 2007.
  62. Kiesel, K.; Orehounig, K.; Mahdavi, A. Model assumptions and their influence on the predicted heating load of an office building. Bauphysik 2010, 32, 359–364. [Google Scholar] [CrossRef]
  63. Statistics Austria. Available online: https://www.statistik.at/ (accessed on 5 January 2017).
  64. ASI (Austrian Standards Institute). ÖNORM B8110-5: Thermal Insulation in Building Construction—Part 5: Model of Climate and User Profiles; Austrian Standards Institute: Vienna, Austria, 2011. [Google Scholar]
  65. ASI (Austrian Standards Institute). ÖNORM B8110-3: Thermal Protection in Building Construction—Part 3: Prevention of Overheating; Austrian Standards Institute: Vienna, Austria, 2012. [Google Scholar]
  66. ASI (Austrian Standards Institute). ÖNORM B8110-6: Thermal Insulation in Building Construction—Part 6: Principles and Verification Methods—Heating Demand and Cooling Demand—National Application, National Specifications and National Supplements to ÖNORM EN ISO 13790; Austrian Standards Institute: Vienna, Austria, 2014. [Google Scholar]
  67. IPCC (Intergovernmental Panel on Climate Change). Climate Change 2013: The Physical Science Basis; Contribution of Working Group I to the Fifth Assessment Report of the Intergovernmental Panel on Climate Change; Stocker, T.F., Qin, D., Plattner, G.-K., Tignor, M., Allen, S.K., Boschung, J., Nauels, A., Xia, Y., Bex, V., Midgley, P.M., Eds.; Cambridge University Press: Cambridge, UK; New York, NY, USA, 2013. [Google Scholar]
Figure 1. General position of selected locations in and around Vienna.
Sustainability 09 00177 g001
Figure 2. Typical floor plans of selected buildings: (a) MFH 1; (b) MFH 2.
Sustainability 09 00177 g002
Figure 3. Typical floor plans of selected buildings: (a) MFH 3; (b) office building.
Sustainability 09 00177 g003
Figure 4. Mean hourly air temperature for a reference summer day: (a) hot week; (b) cold week.
Sustainability 09 00177 g004
Figure 5. Values of selected U2O variables for locations around six weather stations.
Sustainability 09 00177 g005
Figure 6. Minimum night-time air temperature computed for the selected hot week period as a function of selected U2O variables: (a) aspect ratio of urban canyon; (b) built area fraction; (c) impervious surface fraction; and (d) albedo.
Sustainability 09 00177 g006
Figure 7. Spatial variance of the mean annual heating and cooling loads for each building across all urban locations.
Sustainability 09 00177 g007
Figure 8. Differences (kWhm−2·a−1) in mean annual heating load for all buildings in all locations compared to the corresponding SD case.
Sustainability 09 00177 g008
Figure 9. Differences (kWhm−2·a−1) in mean annual cooling load for all buildings in all locations compared to the corresponding SD case.
Sustainability 09 00177 g009
Figure 10. Percentage of time when the air temperature in the most critical room was above the predefined limit (27 °C for residential and 26 °C for office building).
Sustainability 09 00177 g010
Table 1. Overview of the weather stations representing the selected U2Os.
NameLCZ ClassificationCoordinatesStation Elevation (above Ground) (m)Site Elevation (m)
ISInnere StadtLCZ 2Lat 48°11′54.00′′9.3177
Long 16°22′1.00′′
HWHohe WarteLCZ 6Lat 48°14′55.00′′1.9198
Long 16°21′23.00′′
DFDonaufeldLCZ 6Lat 48°15′27.00′′2161
Long 16°26′0.00′′
MBMariabrunnLCZ 9Lat 48°12′0.00′′2.1225
Long 16°13′59.88′′
SWSchwechatLCZ DELat 48°06′39.0′′2.2184
Long 16°34′15.0′′
SDSeibersdorfLCZ 8DLat 47°58′35.00′′2.1185
Long 16°30′18.00′′
Table 2. Overview of the dataset used for analysis with additional information regarding climatic circumstances during the observed period.
Hot Week 7–13 June 2014Cold Week 20–26 August 2014
ISHWDFMBSW 1SDISHWDFMBSW 1SD
Max temperature (°C)34.73334.433.126.934.623.522.322.622.423.922.4
Min temperature (°C)1613.212.99.79.91112.2109.889.78
Total precipitation (mm)0001-249584426-22
Mean wind speed (m/s)221142332242
1 Weather station SW did not record precipitation data.
Table 3. General information about the selected buildings.
TypeMFH 1MFH 2MFH 3OFFICE
Residental, Multi-FamilyOffice Building
Year of construction20141960s1900s2010
Height (m)1824.323.326.5
Heated floor area (m2)14071434194915,472
Gross volume (m3)40624307735758,412
Mean floor height (m)2.893.003.783.78
Gross floor area/Gross building volume0.290.360.230.17
Table 4. Input assumptions for residential buildings (COND).
Internal Gains (Wm−2)Ach (h−1)
EgLgOsOl
24 h1.51.50.60.150.4
Thermostat settings
Upper limit27 °C24 h
Lower limit20 °C24 h
Table 5. Input assumptions for office building, offices (COND).
Internal Gains (Wm−2)Ach (h−1)
EgLgOsOl
Occupied5.02.50.61.50.7
Unoccupied1.00.5000.4
Thermostat settings
OccupiedUnoccupied
Upper limit26 °C29 °C
Lower limit20 °C17 °C
Table 6. Input assumptions for office building, lobby (COND).
Internal Gains (Wm−2)Ach (h−1)
EgLgOsOl
Occupied03.00.60.150.4
Unoccupied01.0000.4
Thermostat settings
OccupiedUnoccupied
Upper limit29 °C29 °C
Lower limit17 °C17 °C

