1. Introduction
Energy efficiency is the most cost saving policy to address climate change. The International Energy Agency (IEA) proposed a set of 25 policy recommendations geared towards energy efficiency in different fields including industry. Such strategies are crucial to identifying gaps and achieving CO2 reduction targets. On a top-down level, the IEA estimates that if the recommendations are implemented, the benefits would be significant: the reduction in energy demand in 2010 represents 17% of the current annual worldwide energy consumption and 7.6 gigatonnes (Gt) of CO2 a year by 2030 could be avoided. This corresponds to almost 1.5 times the current annual CO2 emissionsof the US.
In November 2009, Korea presented its mid-term greenhouse gas (GHG) emissions reduction target which aimed at reducing its emissions by 30% below the business as usual (BAU) levels by 2020. Further, Korea submitted the Intended Nationally Determined Contributions (INDC) to the UN in 2015 according to Paris Agreement. This INDC contains Korea’s new plans to reduce its GHG emissions by 37% from the BAU level by 2030.
In 2011, GHG emissions of the energy sector accounted for 86% of Korea’s total GHG emissions; in particular, the GHG emissions of manufacturing sector accounted for 50% of the total energy sector emissions. Thus, the sustainable growth and GHG emission reduction target cannot be reached without reasonable energy policy on manufacturing industry. The share of manufacturing sector in Korea’s total final energy consumption has been increased steadily over the periods and the growth rate of energy consumption in this sector surpassed the growth rate of total final energy consumption in Korea. According to Korea Energy Statistics, the share of manufacturing sector in total final energy consumption was 53.7% in 2011, whereas the share was 46.6% in 1991. The energy consumption of manufacturing sector has increased an annual average growth rate of 5.35% from 1991 to 2011, whereas Korea’s total final energy consumption has increased by an annual average growth rate of 4.60% over the same period. In particular, energy consumption of the fabricated metal industry, and the petroleum and chemical industry grew by an annual average of 7.59% and 7.63%, respectively, which is higher than the average growth rate of manufacturing sector.
Several efforts have been made to improve energy intensity in the manufacturing sector. Specifically, in 2012, the Korean government introduced the “Greenhouse Gas and Energy Target Management Scheme” to manage the demand for energy consumption in the industrial sector. This scheme imposes energy saving targets on large-scale facilities that emit a substantial quantity of greenhouse gases and consume a high level of energy. Most of the energy-intensive manufacturing industry falls under this scheme. The proportion of energy-intensive industries in Korea is particularly high compare to other countries. Moreover, the structural characteristics of these industries are likely to have a significant impact on energy consumption patterns in the manufacturing sector, which itself has a unique structure. However, the goal of this target is insignificant, and is insufficient to meet the GHG reduction target. Thus, it is difficult to establish a reasonable energy policy to address climate change in the long run without an accurate analysis of the characteristics of energy consumption in this sector.
The popular decomposition methods can be divided into two parts; the Laspeyres and Divisia indexes. The logarithmic mean Divisia index (LMDI) method, which is one of Divisia Indexes, has been largely preferred because of its advantages in meeting the factor-reversal test as well as leaving no unexplained residual. LMDI methods can be grouped into either additive or multiplicative decomposition. The former, introduced in Ang et al. [
1], decomposes the difference in the amount yielded at two points in time, while the latter, suggested in Ang and Liu [
2], decomposes the ratio of change with respect to the base year. Both methods are applied to the decomposition analysis inthis paper.
Many recent studies on the characteristics of energy consumption used logarithmic mean Divisia index (LMDI) factor decomposition analysis. These studies include Lee and Oh [
3], Han and Shin [
4], Liu et al. [
5], Zhao et al. [
6], Oh et al. [
7], Zhang et al. [
8], Baležentis et al. [
9], Wang et al. [
10], Xu et al. [
11], Xu et al. [
12], Tian et al. [
13], Jeong and Kim [
14], González et al. [
15,
16], Ren et al. [
17], Wang et al. [
18], and Lin and Long [
19]. Among these, Baležentis et al. [
9], Zhang et al. [
8], Lin and Long [
19], González et al. [
15] and Wang et al. [
18] focused on the analysis of energy consumption. Wang et al. [
18] presented a new LMDI method and analyzed China’s energy consumption for the period from 1991 to 2011 on the basis of five effects: investment, energy intensity, economic structure, energy mix, and labor effects. They found that the energy intensity effect played a dominant role in decreasing energy consumption. González et al. [
15] analyzed the factors underlying changes in aggregate energy consumption for the period from 2001 to 2008 at three levels in EU-27 using LMDI. They found that improvements in energy efficiency were not enough to overcome the pressure of European economic activity on aggregate energy consumption. Baležentis et al. [
9] explored energy intensity trends in the Lithuanian economy and in separate economic sectors from 1995 to 2009 and decomposed energy consumption on the basis of LMDI into three effects—production, structure, and intensity effects—as presented by Ang [
20]. He found that energy efficiency falls during an economic downturn and suggested policy measures to improve energy intensity in Lithuania. Lin and Long [
19] adopted the factor decomposition and the Engle–Granger cointegration methods to investigate the factors influencing fossil energy consumption in China’s chemical industry and measured the saving potential of fossil fuel. The study suggested that the influencing factors can be divided into positive driving factors (labor productivity and sector scale) and negative driving factors (energy intensity and structure). Zhang et al. [
8] identified a relationship between transportation energy consumption and the factors it affects. They found that the production effect is the most important contributor to increasing energy consumption, while the intensity effect plays a dominant role in decreasing it.
Some studies also conducted a factor decomposition analysis on the characteristics of GHG emissions. Research that focuses on particular industries includes Jeong and Kim [
14], Ren et al. [
17], Xu et al. [
11], Zhao et al. [
6], and Tian et al. [
13]. Jeong and Kim [
14] analyzed GHG emissions in Korea’s manufacturing sector, while Ren et al. [
17] examined those in China’s manufacturing industry. Xu et al. [
11] studied CO2 emissions in China’s cement industry. Zhao et al. [
6] decomposed the factors influencing industrial carbon emissions in Shanghai using the LMDI method. Tian et al. [
13] analyzed energy-related GHG emissions in China’s iron and steel industry.
Studies that have conducted LMDI decomposition analyses specifically in the context of South Korea include Jeong and Kim [
14], Jin and Hwang [
21,
22], Na and Lee [
23], and Oh et al. [
7]. Jin and Hwang [
22], Oh et al. [
7], and Jeong and Kim [
14] analyzed GHG emissions in Korea. On the other hand, Jin and Hwang [
21], and Na and Lee [
23] examined energy consumption, particularly the characteristics of energy consumption in local regions. They divided Korea into 16 local autonomous regions and conducted a time series analysis for the period of 1990–2006. They decomposed the energy consumption of local regions into energy source unit, production per capita, and population. Na and Lee [
23] extended the LMDI factor decomposition of industrial sectors by adding an econometric model; however, they limited their LMDI analysis to the decomposition of additive factors and adopted a rolling base year instead of a fixed one. More recently, Jeong and Kim [
14] decomposed, both multiplicatively and additively, GHG emissions from Korea’s industrial manufacturing into five factors using the LMDI method but focused on GHG emissions.
Although the previous studies in Korea adopted the LMDI method, they each considered slightly different factors. In addition, only Jin and Hwang [
21,
22], Na and Lee [
23], and Jeong and Kim [
14] conducted a time series analysis which indicates cumulative year-by-year trends of each effect. Furthermore, most studies used only additive methods rather than multiplicative factor decomposition methods, except Jeong and Kim [
14].
This study decomposes the factors that influence energy consumption in the manufacturing sector which has never been analyzed in the previous literature using the LMDI method, and also aims to analyze the specific characteristics of energy consumption by industry over the past 20 years from 1991 to 2011. Furthermore, this paper use not only with additive LMDI methods but also multiplicative methods to see which factor influences on energy consumption. In particular, it provides implications for effective energy-saving measures and policies based on this factor decomposition on energy consumption in the manufacturing sector. This decomposition of the factors is mainly associated with the activity, structure, and intensity effects. This paper also decomposes the factors for the energy consumption of each industry, into two factors, activity and intensity effects and determines the effect that had the most impact on the increase in energy consumption and which industry’s energy intensity is most improved by this factor decomposition.
The remainder of this paper is organized as follows.
Section 2 presents the LMDI decomposition analysis method and explains the data used. In addition, it elaborates on Korea’s manufacturing sector in terms of energy consumption and the factors affecting it.
Section 3 presents the results for the LMDI factor decomposition analysis on energy consumption in Korea’s manufacturing sector.
Section 4 concludes the paper and suggests policy implications.
2. Materials and Methods
This study analyzes the characteristics of energy consumption in Korea’s manufacturing sector using data for the period from 1991 to 2011. This study is restricted to the manufacturing industry because the well-established energy-related data for each sector make it easy to analyze the effects of industrial restructuring. The main analysis method adopted is the LMDI, which uses the Divisia index and logarithmic mean weighted value to decompose energy consumption. It also has the benefit of leaving no residual results after decomposition. Furthermore, the method is known to be better than others in terms of its theoretical basis and applicability as well as the convenience it offers in analyzing results.
To do so, it adopts the LMDI decomposition analysis developed by Boyd et al. [
24], Liu et al. [
25], Ang and Lee [
26], Ang and Choi [
27], Ang et al. [
1], Ang and Liu [
2], and Ang et al. [
28]. In particular, Ang [
29] compared various index decomposition analysis methods and concluded that the LMDI method is the preferred method because it satisfies the factor reversal test and tackles unexplainable residuals in the results. Ang [
20] also provided a practical guide that included the general formulation process and summary tables for easy reference.
In line with Ang [
20,
29], and Ang et al. [
30], this paper analyzes the characteristics of energy consumption based on the activity, intensity, and industrial structure effect. Note that in this study, an additive as well as a multiplicative factor decomposition analysis were conducted. The additive decomposition analysis estimates absolute changes in energy consumption, while the multiplicative decomposition analysis measures relative changes. Thus, both methods are useful in interpreting the factors. According to the interpretation of Ang [
20], in some cases, additive factor decomposition can take priority over multiplicative factor decomposition. In other cases, the opposite can be more appropriate. Which method we should choose depends on which is more useful in interpreting the results and identifying sectors that should be focused on when implementing future policies, such as those related to energy saving. In addition, the activity and intensity effects for each industrial sector were analyzed separately to determine how factors in each sector affect the structure of the manufacturing sector as a whole.
As mentioned earlier, the changes in total energy consumption in the manufacturing industry were decomposed based on three elements. The first element is the activity effect, in which energy consumption increases with an increase in production (
Q). The second element is the industrial structure effect, which describes the changes in total energy consumption as the proportion of each industry in total production changes (
. It implies that an increase or decrease in the relative size of sectors can affect the energy consumption of the manufacturing sector. The third element is the intensity effect, which is caused by an improvement in the proportion (
) of energy used for production in industry
i.
where,
: Energy consumption by the manufacturing sector
: Energy consumption of industry i
: Production in the manufacturing sector
Production in industry i
Proportion of industry i in the total production of the manufacturing sector
Energy intensity of industry i
The structural formula for the LMDI multiplicative factor decomposition analysis used in this research is adopted from Ang [
20] and presented in Equation (2). In a multiplicative factor decomposition, the increase in energy consumption from period 0 to
T can be decomposed on the basis of the activity effect (
, structure effect (
), and intensity effect (
). Therefore, the total increase (
Dtot) is calculated by multiplying the rates of each individual effect.
The structural formula for the LMDI additive factor decomposition analysis is shown in Equation (3). Here, the increase in energy consumption from period 0 to
T is also decomposed as per the activity effect (
, structure effect (
, and intensity effect (
). To obtain the change in total energy consumption (
), the changes caused by each individual effect are added.
The structural formulae of the multiplicative and additive factor decomposition have a simple but useful theoretical relationship with each other, as shown in Equation (4):
The present research is confined to manufacturing industry because the energy consumption data in this industry have been compiled consistently. The data include the energy consumption, production, and producer prices of each industry in the manufacturing sector. The businesses in the manufacturing industry are classified into nine industries, as presented in the Korea Energy Economics Institute (KEEI)’s
Yearbook of Energy Statistics [
31]: food and tobacco, textile and apparel, wood and wood products, pulp and publications, petroleum and chemical, non-metallic, primary and nonferrous metal, fabricated metal, and other manufacturing industries (
Table 1).
Table 1 presents the data for energy consumption by industry from the KEEI
Yearbook of Energy Statistics [
31]. The production-level data by industry were adopted from the
Report on Mining and Manufacturing Survey of Korean Statistical Information Service (KOSIS) [
32]. Data from the eighth revision of the report were used for the period from 1991 to 1998, and data from the ninth revision were used for 1999 onward. The production data for each industry were calculated as per the 2010 constant prices, again reflecting the producer prices by industry.
Table 2 presents the changes in energy consumption, production, and energy intensity in the Korean manufacturing sector for the period from 1991 to 2011, which are further subdivided for each industry. Note that they are all related directly to the factor analysis.
The overall manufacturing sector indicated an average annual increase of 5.35% in energy consumption, with a total change of 183.33%. In terms of the average annual increase by industry, the petroleum and chemical industry indicated the highest rate of 7.63%, followed by the fabricated metal industry with 7.59%. Other manufacturing industry and the primary and nonferrous metal industry increased by 4.57% and 4.66% per year. These average annual increases resulted in the following total changes. Between 1991 and 2011, energy consumption increased by 334.90% in the petroleum and chemical industry, 331.96% in the fabricated metal industry, and 144.36% in other manufacturing industry. However, energy consumption of the textile and apparel industry decreased by 0.90% per annum, resulting in an overall decrease of 16.46%.
The average annual increasing rate in production of the overall manufacturing industry was 7.72%, resulting in a total change of 342.58%. Therefore, it is estimated that the production increase in the manufacturing industry strongly influenced the increase in energy consumption. By industry, fabricated metal showed an average annual increase of 14.21%, with a total change of 1326.34%. Next, the petroleum and chemical industry showed an average annual increase of 6.62%, with a total change of 260.06%. Finally, the primary and nonferrous metal industry showed an average annual increase of 5.82%, with a total change of 209.83%.
The energy intensity of the overall manufacturing sector has decreased by 35.98%. In particular, fabricated metal indicated the largest decrease. Other industries that recorded a decrease include the nonmetallic, primary and nonferrous metal, food and tobacco, textile and clothing, and pulp and publications industries. By contrast, wood and wood products, petroleum and chemical, and other manufacturing industries indicated an increase in energy intensity.
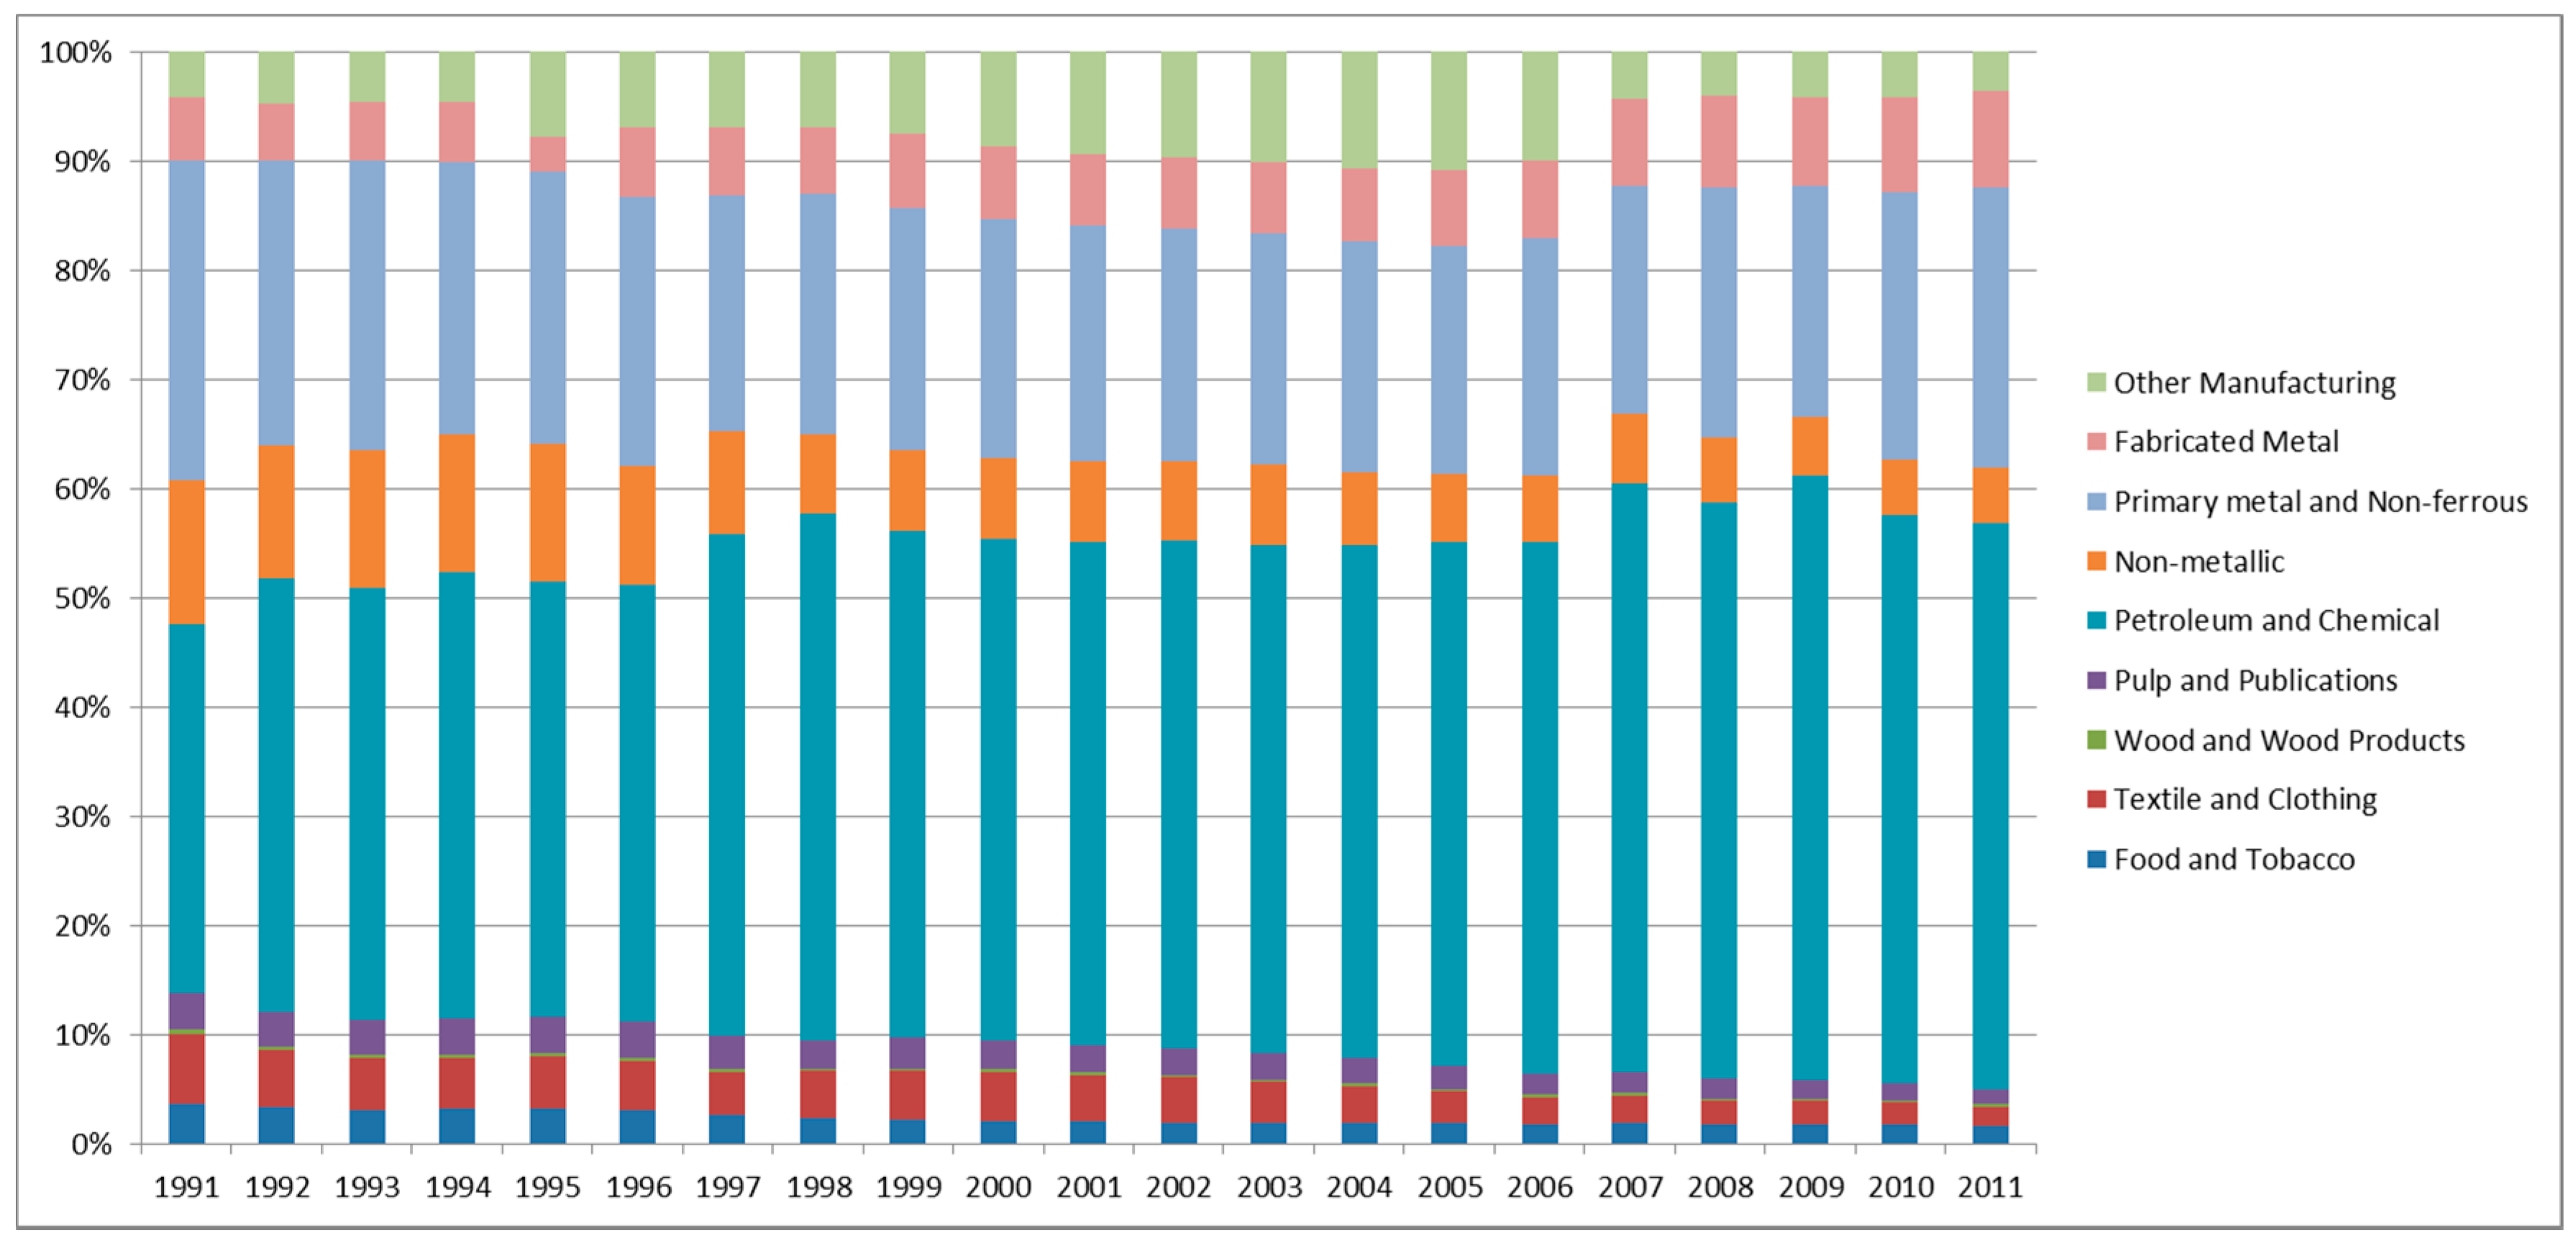
Figure 1 shows the proportion of changes in energy consumption for each industry in Korea’s manufacturing sector for the period of 1991–2011. Petroleum and chemical accounted for the largest share of energy consumption, followed by primary and nonferrous metal, fabricated metal, and non-metallic. By 2011, petroleum and chemical and primary and nonferrous metal accounted for 52.01% and 24.55% of the total energy consumption by the manufacturing sector, which is a total of 76.56%.
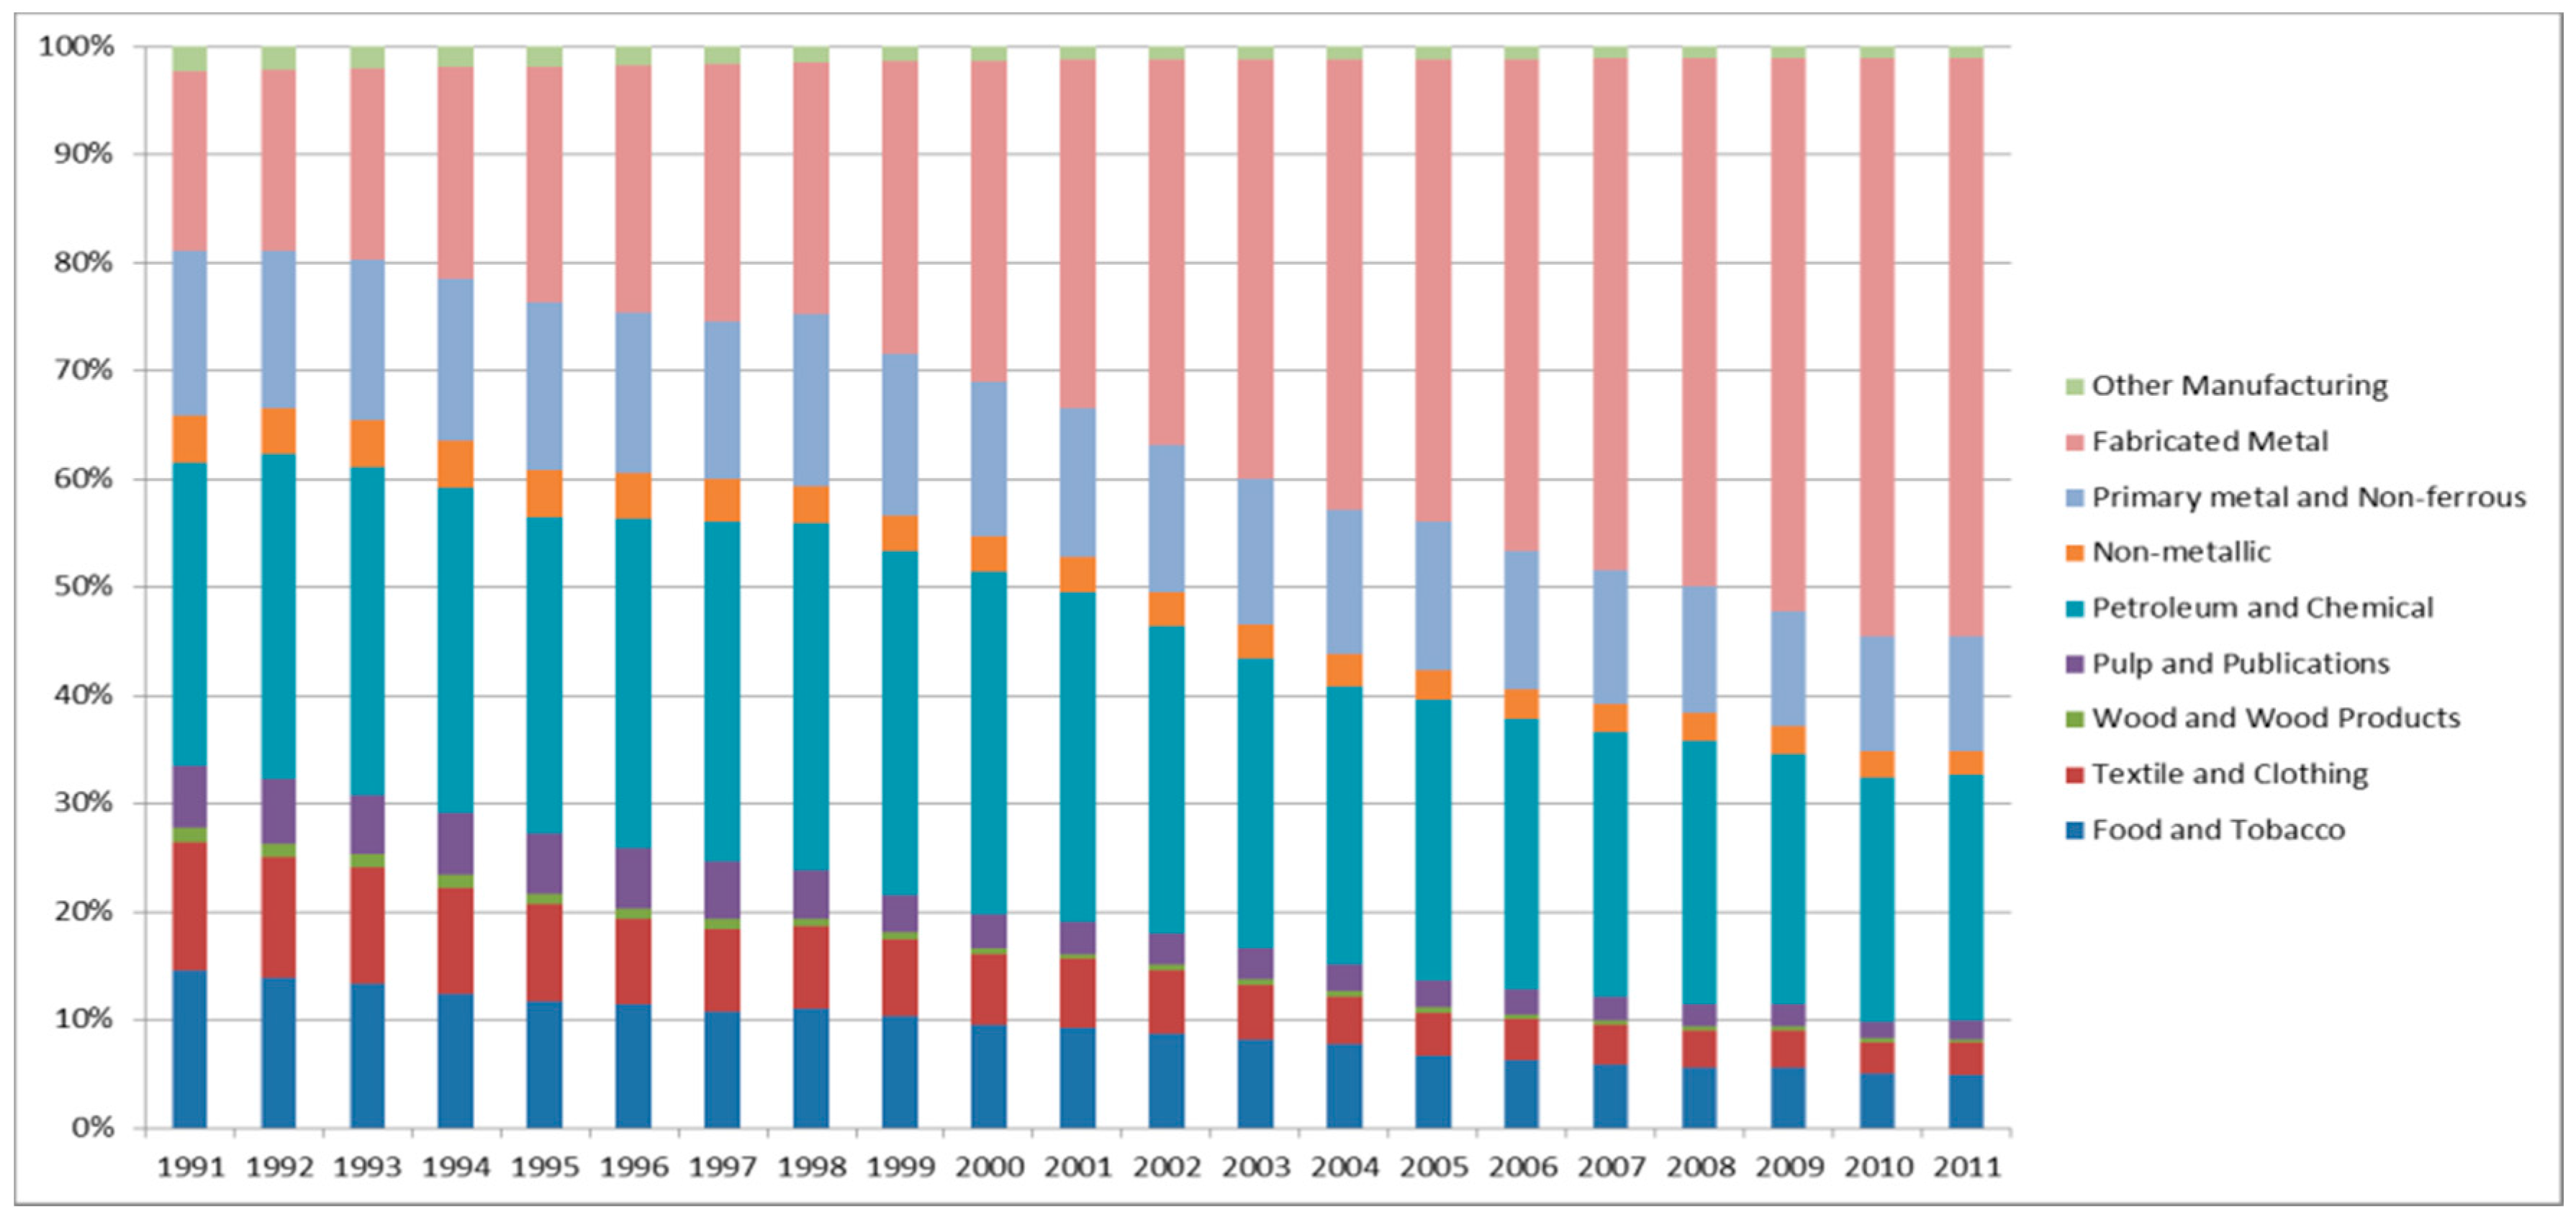
Figure 2 depicts the structure of Korea’s manufacturing sector for production. The most remarkable change is the rapid increase in the proportion of fabricated metal, caused by the exponential growth in Korea’s electronics and auto industries. The second noteworthy change is the decrease in the proportion of the petroleum and chemical industry. It is because that the share of fabricated metal in manufacturing production has been rapidly increased over the years. The annual growth rate of Petroleum and chemical industry was 6.62%, whereas the rate of fabricated metal industry was 14.21% (See
Table 2). In addition, the proportion of Korea’s textile and clothing industry significantly decreased and became less competitive owing to increased wages, China’s reforms and open market policy, and the economic growth in Southeast Asia. Furthermore, the proportion of the pulp and publications and the food and tobacco industries also decreased and that of primary and nonferrous metal industry, which is a typical energy-intensive industry, and the non-metallic industry, with cement as its main industry, also decreased to an extent. Evidently, Korea’s industries in manufacturing sector have been gradually restructured over the past 21 years.
A comparison of
Figure 1 and
Figure 2 reveals certain differences between energy consumption and production structures. The petroleum and chemical industry accounted for the largest proportion of energy consumption but is followed by the fabricated metal industry in the proportion in production for 2011. The fabricated metal industry accounts for the largest share of production, but is followed by the petroleum and chemical and primary and non-ferrous metal industries in terms of energy consumption. In other words, energy intensity varies by industry, and the industrial structure has undergone several changes over the past 20 years. The LMDI analysis suggests that these changes may have resulted from changes in the structure, intensity, and activity effects.
3. Results
In general, the results of the factor decomposition use the indicators for the base and closing years. This has an advantage of not requiring large volumes of data, but is prone to interpretational errors when there are large discontinuities in the indicators. On the other hand, a time series analysis has the advantage of providing information by year as well as reducing the number of interpretational errors, even in the presence of large discontinuities. Thus, this study presents the results of the decomposition analysis based on the rolling base years to reveal and quantify the factors underlying the changes and decomposes it on the basis of the three effects: activity, structure, and intensity effect.
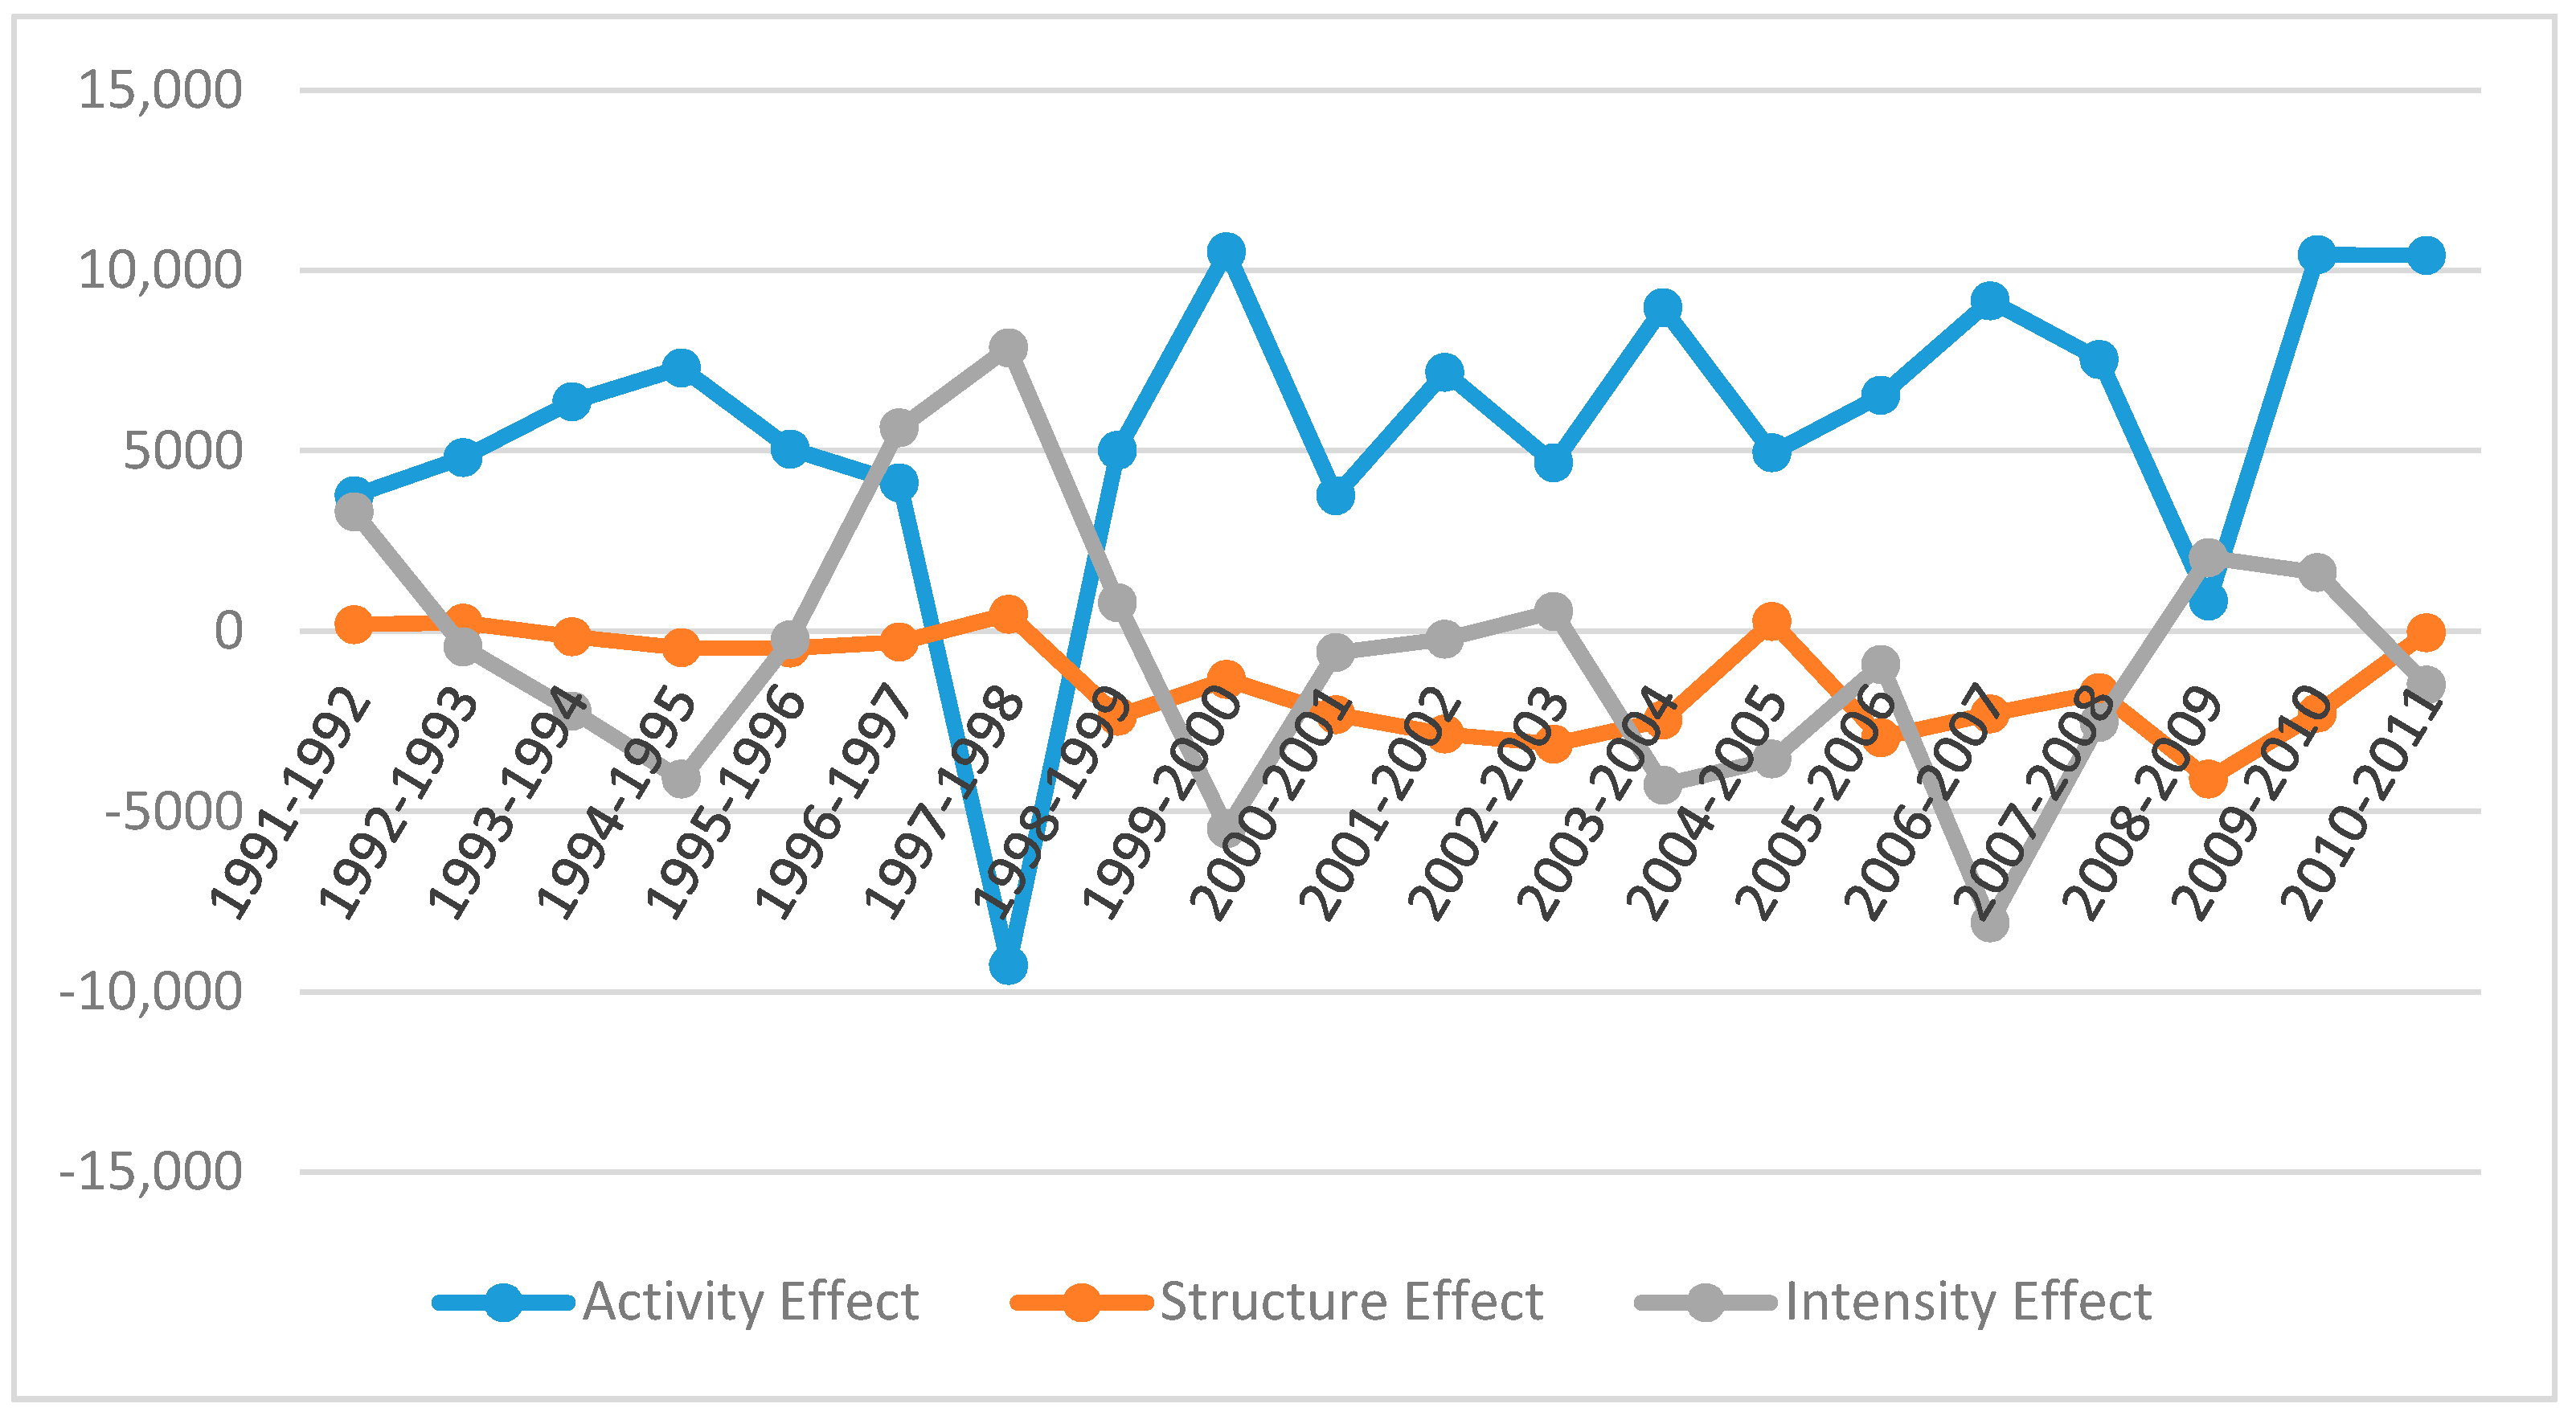
Table 3 presents the results of an additive LMDI factor decomposition analysis for energy consumption in the manufacturing sector by rolling base year. It indicates that energy consumption by the manufacturing sector in 2011 increased by 8874 thousand tonne of oil equivalent (TOE) as compared to 2010. As for the decomposition, energy consumption increased by 10,411 thousand TOE due to the activity effect and reduced by 41 and 1496 thousand TOE, respectively, due to under the structure and intensity effect. Therefore, from 2000 to 2011, the activity effect played a significant role in increasing energy consumption, whereas the intensity and structure effect decreased energy consumption in Korea’s manufacturing sector. In 1998, 2007, and 2009, the energy consumption by the manufacturing sector decreased in comparison to their respective previous years. In 1997–1998, energy consumption due to the activity effect reduced by 9263 thousand TOE, whereas the structure and intensity effects increased energy consumption. However, in 2006–2007, the activity effect increased energy consumption, while the structure and intensity effect played a role in reducing it. In 2006–2007, as energy consumption resulting from the two effects (structure and intensity effect) exceeded that due to the activity effect, the overall energy consumption decreased in comparison to that in the previous year. In 2008–2009, the structure effect contributed to the reduction of energy consumption; whereas the activity and intensity effect increased energy consumption. However, the overall energy consumption decreased compared to that in the previous year since the consumption under the structure effects exceeds that under the activity and intensity effect. Therefore, the production decline contributed to the reduction of energy consumption in 1997–1998, whereas the improvement in energy intensity in 2006–2007, and the changes in industrial structure in 2008–2009 contributed to lower energy consumption. Production in manufacturing declined significantly in 1997–1998, but in 2006–2007 and 2008–2009, production growth rate slowed but production did not decline. This is why the activity effect shows a huge negative in 1997–1998 while shows positive in 2006–2007 and 2008–2009. Excluding these three periods, the contribution of the activity effect exceeds those of the structure and intensity effect; particularly, the activity effect contributed the increase of energy consumption in the manufacturing sector.
Figure 3 depicts the results under each effect. The activity effect largely contributed to the increase in energy consumption, except for in 1997–1998 owing to the 1997 Asian financial crisis. The structure effect indicates positive values from 1991 to 1993. During this period, a large investment was made in the petrochemical industry, resulting in the industry’s transition to energy-intensive industries. In other words, the structure effect induced the increase of energy consumption in this period. After 1994, the structure effect played a role in reducing energy consumption except in1997–1998 and 2004–2005, although with scale is different over the periods. However, after 1999, energy consumption due to the structure effect substantially reduced energy use because the industrial structure was transformed to one with relatively low energy consumption industry—an example of the fabricated metal industry.
The energy consumption due to the intensity effect fluctuates across periods, depicting an inconsistent pattern. However, the intensity effect indicates large negative values in 1999–2000 and 2006–2007. After the economic crisis, the energy intensity substantially improved.
The cumulative results of the additive factor decomposition during the entire periods are given in the last low of
Table 3. As compared to 1991, energy consumption in 2011 increased by 71,599 thousand TOE, of which 100,067 thousand TOE increased due to the activity effect, 19,519 thousand TOE decreased due to the structure effect, and 8949 thousand TOE decreased due to the intensity effect. Over the periods, the activity effect and intensity effect moved in opposite directions. The activity effect decreased when the intensity effect increased and vice versa (see
Figure 3).
Our results indicate several characteristics of energy consumption in Korea’s manufacturing sector. First, the increase in energy consumption in Korea’s manufacturing sector is largely caused by the activity effect. By contrast, the structure and intensity effect play a role in reducing energy consumption. However, the activity effect is much larger than the structure and intensity effects. Therefore, energy consumption due to this total effect has gradually increased over time. The reduction in energy consumption due to the structure effect is larger than that of the intensity effect for the period from 1991 to 2011. The improvement in energy intensity of the overall manufacturing sector (
Table 2) is due to the intensity and structure effects.
Second, changes in the patterns of energy consumption are observed over time. The energy consumption due to the activity effect temporarily slowed down around 1997 and 2008 because of the Asian financial crisis and the global financial crisis respectively. Korea’s industrial production also temporarily slowed down during these periods. The structure effect contributed to the decrease in energy consumption between 1995 and 1997, but this decrease temporarily slowed down in 1998 because of the restructuring of Korea’s manufacturing sector under the International Monetary Fund (IMF) management regime at that time. This period was characterized by large-scale industrial restructuring, including the merger and acquisition of steel and auto companies, leading to unusual production activities. From 1997 to 2004, the intensity effect increased energy consumption over the periods; however, after 2005, both the structure and intensity effect contributed towards reducing energy consumption. In particular, the decrease in energy consumption due to the intensity effect is noticeable since 2006 and can be attributed to Korea’s attempts to improve energy intensity in the industrial sector. In addition, the changes in the industrial structure since then have led to a rapidly growing fabricated metal industry. This structural change, in turn, led to a significant reduction in energy consumption. After 2009, the production and structure effect began to increase again, although the intensity effect remains stagnant. This trend is expected to continue for the time being.
Table 4 indicates the results of the additive LMDI decomposition for energy consumption of each industry from 1991 to 2011 and decomposes it into two factors, production and intensity effects. The energy consumption of each industry is decomposed into the activity and intensity effect because of the unavailability of subsector data for each industry in Korea’s manufacturing sector, rendering it difficult to identify the structure effect in the decomposition for each industry. The energy consumption data for Korea’s manufacturing sector is classified based on nine industries. Therefore, the decomposition equation by industry is as follows:
where
is energy consumption of industry
i,
is production of industry
i, and
is energy intensity of industry
i. According to the results, the patterns of change resulting from the activity and intensity effects differ by industry. The production effect of each industry by rolling base year is presented in
Table A1 and the intensity effect of each industry by rolling base year is presented at
Table A2. The production and intensity effects are different for each industry. The increase of energy consumption by the activity effect is largest in the petroleum and chemical industry, followed by the primary metal and non-metallic industry, and the fabricated metal industry. The intensity effect shows negative values in most industries that the intensity improved, except in wood and wood products and petroleum and chemical. The decrease of energy consumption by intensity effect is largest in the fabricated metal industry, followed by the primary metal and non-metallic industry. In other words, the energy consumption by intensity effect in the petroleum and chemical industry has increased, which means the energy intensity has deteriorated over years. These differences between the industries also play an important role in determining the structure effect of the overall manufacturing sector. The factor decomposition analysis indicates that energy consumption in energy-guzzling industries such as the petroleum and chemical industry, and the primary and non-ferrous metal industry has been increased by the activity effect. It contributed to the increase of energy consumption due to the structure effect.
Next, this study compares the results in
Table 4 with those of the intensity effect in
Table 2. Energy intensity improved from 1991 to 2011 in the fabricated metal, primary and nonferrous metal, non-metallic, and textile and clothing industries (
Table 2). Further, energy savings as a result of the intensity effect improved in the fabricated metal, non-metallic, primary and nonferrous metal, and textile and clothing industries (
Table 4). This means that the improvement of energy intensity in each industry corresponds to energy savings. However, the improvement of energy intensity in the overall manufacturing sector does not necessarily correspond to energy savings by the intensity effect because the structure effect cannot be captured in the energy intensity in
Table 2.
The results of the additive factor decomposition analysis allow the analysis of the absolute increases and decreases in energy consumption. However, it is not easy to evaluate the relative contribution of each factor. Nevertheless, it is possible to estimate and interpret the relative sizes in the increase in energy consumption, but more specific values must be presented. Thus, this study also presents the results of the multiplicative factor decomposition.
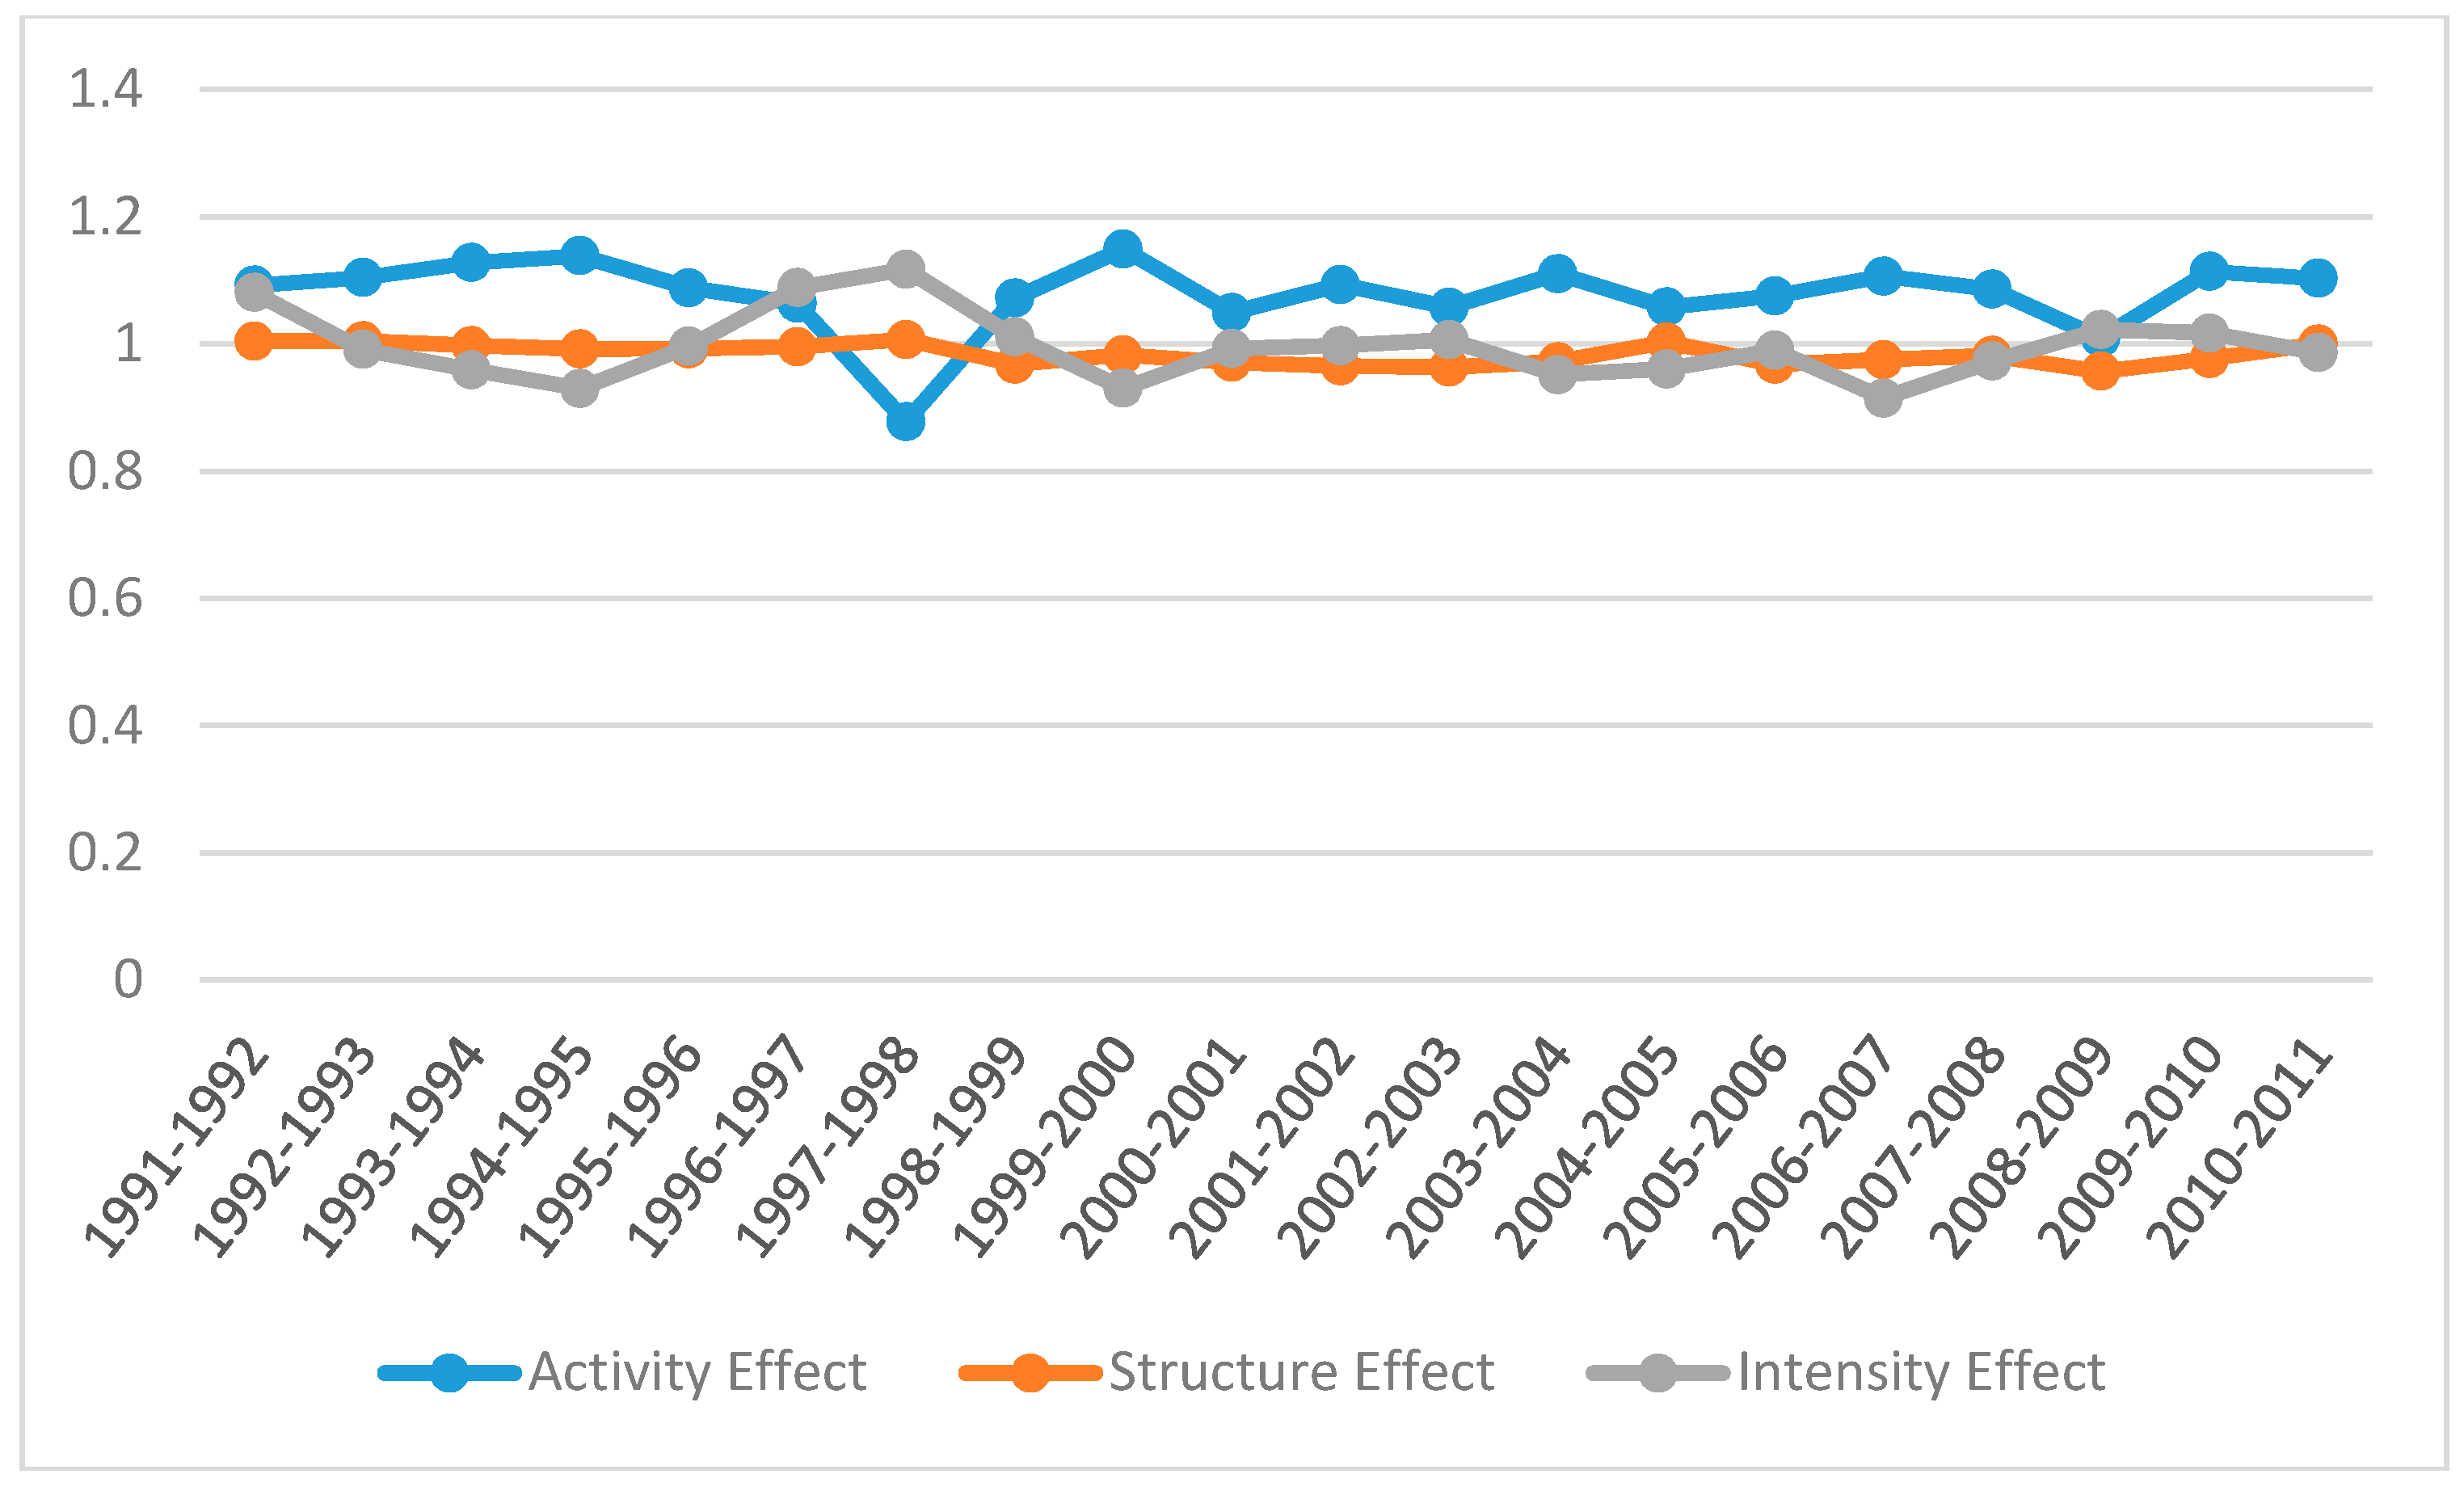
Table 5 and
Figure 4 provide the multiplicative factor decomposition results of the increase in energy consumption for each year in comparison to the corresponding previous year. For example, the results from 2010 to 2011 can be interpreted as follows. Total effect is 1.0872, which means that energy consumption increased by 8.72% in 2010–2011. As regards decomposition, it increased by 10.30% due to the activity effect, and decreased by 1.4% due to the intensity effect and 0.0004% due to the structure effect. The total effect can be calculated by multiplying the values of each individual effect. The value of the total effect is greater than one because the activity effect is larger than the intensity and activity effects.
The overall effect from 1991 to 2011 is presented at the last row of
Table 5. Activity effect is 4.2867 and structure effect and intensity effect is 0.7528 and 0.8779, respectively. The values of structure and intensity effects are less than one, which means that energy consumption reduced due to these effects. Therefore, during the last 20 years, the activity effect played a major role in increasing the energy consumption and the structure and intensity effects played a role in decreasing the energy consumption.
The multiplicative decomposition by industry is presented in
Table 6.
Table A3 presents the production effect of each industry by rolling base year and
Table A4 presents the intensity effect of each industry by rolling base year. The analysis by industry was classified according to the activity and intensity effects, indicating the different contributions of each industry. The industry with the largest activity effect is the fabricated metal industry, followed by the petroleum and chemical, primary and non-ferrous metal, and non-metallic industries. The industry with the largest contribution to decreasing energy consumption due to the intensity effect is the fabricated metal industry, followed by the primary and nonferrous metal and the textile and clothing industries. However, energy intensities of the petroleum and chemical, and the wood and wood products industries have deteriorated over the years. Moreover, the petroleum and chemical industry accounted for 52% of total energy consumption of the manufacturing sector. The wood and wood products industry accounted for only 2.1% of total energy consumption of manufacturing sector. Therefore, in particular, in order to improve the energy intensity of the manufacturing industry, it is urgent to improve the energy intensity of the petroleum and chemical industry.
In comparing the results with those of the factor decomposition of Canada, presented in Ang (2005), we see that the structure effect is much smaller in Korea than in Canada. Thus, the results of multiplicative factor decompositions can also be useful in comparative analyses among countries.
4. Discussion and Conclusions
This study conducted the LMDI factor decomposition for Korea’s manufacturing sector for the period from 1991 to 2011 and presented both the additive and multiplicative factor decomposition analyses methods.
Our findings are as follows. First, the activity effect made the largest contribution to the increase in energy consumption in Korea’s manufacturing sector, followed by the structure and energy intensity effects. Second, the change in energy consumption pattern was observed during the economic crises. After the IMF crisis in 2007–2008, the decrease in energy consumption due to the structure effect was evident. On the other hand, during 2006 financial crisis, energy consumption was mainly reduced by the intensive effect. This means that the industrial structure of Korea’s manufacturing sector has been transitioning to a low-carbon industrial one since the IMF crisis. Moreover, energy saving and restructuring of each industry is noticeable. Third, the factor decomposition by each industry indicated that energy saving by intensity effect was achieved in the fabricated metal, primary and nonferrous metal, non-metallic, and textile and clothing industries. For instance, the energy intensity of the fabricated metal industry rapidly improved as it was reorganized as a high-value industry (e.g., semi-conductor industry). A traditional energy intensive industry, primary and non-ferrous metal, was found to have been the most effective in energy saving during the study period. However, the petroleum and chemical industry, which is also categorized as energy intensive industry, was found to have deteriorated in energy intensity. Thus, the improvement in energy intensity is different even among the energy intensive industries. Thus, distinct countermeasures should be applied to each industry to improve energy intensity and achieve low carbon industry structure. In particular, to improve the energy intensity of the manufacturing sector, it is urgent to improve the energy intensity of the petroleum and chemical industry.
In conclusion, the results suggest that the improvement in the energy efficiency of the manufacturing sector and countermeasures against climate change can be achieved by industrial restructuring and industry-specific energy saving policies. As compared to other advanced countries, energy saving is an urgent problem in Korea, where the industrial sector consumes a large proportion of the county’s energy. Therefore, unless production is reduced (activity effect), industrial restructuring and improved energy intensity are the only solutions.
This study also provides the following policy implications. First, for energy savings in the industrial sector, Korea must consider a low-energy intensive industrial restructuring. To do so, the country must transit from energy-intensive industries to less energy dependent high-tech manufacturing, or even information and communications industries so that it is able to reduce energy consumption while maintaining economic growth. Alternatively, energy intensity can be improved by increasing the proportion of high-value products in a particular industry (e.g., steel). Although the process of restructuring industries and products takes time, improving energy intensity can be achieved in a relatively short time. New energy-saving equipment or processing technology should be introduced to improve energy intensity. Research and development on energy efficiency should be expanded and systematic financial and technical support related to these measures should be continued by the government.


