Article

Influence of Road Patterns on PM2.5 Concentrations and the Available Solutions: The Case of Beijing City, China

Sino-German Joint Laboratory on Urbanization and Locality Research (UAL), College of Architecture and Landscape Architecture, Peking University, Beijing 100871, China
*
Author to whom correspondence should be addressed.
Sustainability 2017, 9(2), 217; https://doi.org/10.3390/su9020217
Submission received: 22 November 2016 / Revised: 19 January 2017 / Accepted: 25 January 2017 / Published: 7 February 2017
(This article belongs to the Section Sustainable Urban and Rural Development)

Abstract

:
With the increase in urbanization and energy consumption, PM2.5 has become a major pollutant. This paper investigates the impact of road patterns on PM2.5 pollution in Beijing, focusing on two questions: Do road patterns significantly affect PM2.5 concentrations? How do road patterns affect PM2.5 concentrations? A land-use regression model (LUR model) is used to quantify the associations between PM2.5 concentrations, and road patterns, land-use patterns, and population density. Then, in the condition of excluding other factors closely correlated to PM2.5 concentrations, based on the results of the regression model, further research is conducted to explore the relationship between PM2.5 concentrations and the types, densities, and layouts of road networks, through the controlling variables method. The results are as follows: (1) the regression coefficient of road patterns is significantly higher than the water area, population density, and transport facilities, indicating that road patterns have an obvious influence on PM2.5 concentrations; (2) under the same traffic carrying capacity, the layout of “a tight network of streets and small blocks” is superior to that of “a sparse network of streets and big blocks”; (3) the grade proportion of urban roads impacts the road patterns’ rationality, and a high percentage of branch roads and secondary roads could decrease PM2.5 concentrations. These findings could provide a reference for the improvement of the traffic structure and air quality of Beijing.

1. Introduction

With rapid urbanization, high population density and heavy traffic exacerbate the air pollution arising from a traditional extensive economy. The frequent occurrence of PM2.5 pollution offers a warning against rapid urban development, which also underscores the importance of constructing a scientific and reasonable city structure. Previous studies have shown that PM2.5 concentrations in different urban spaces are variable [1,2], as they are affected by the urban spatial pattern [3], land development intensity [4,5], public green spaces [6], road grades, and traffic [7]. For example, Chan et al. (2001) [8] found that the concentration of PM2.5 in an urban industrial district, a residential area, and a business district of Hong Kong, was 77.6, 107.0, and 88.5 μg/m3, respectively. Li et al. (2012) [9] noted that the annual concentration of PM2.5 in a green space was lower than that in bare land.
Among these factors, motor vehicles have become important sources of fine particulate pollution, contributing between 25% and 35% of direct PM2.5 emissions [10,11], which are the dominant source of air pollution in most urban cities [12,13]. Meanwhile, “Particulate matter (PM) pollutants are currently of high interest, because medical findings indicate that adverse health effects are caused by aerosol particles in the ultrafine (<100 nm diameter) size range that are associated with traffic” [14]. The previous research on vehicle emissions of particulates has mainly focused on their black carbon or particle number concentrations, especially for diesel vehicles, which require high equipment and technology [15,16]. Compared to light-duty gasoline vehicles, primary PM2.5 emissions from heavy-duty diesel vehicles can be between one and two orders of magnitude higher [14]. As a result, diesel vehicles have been gradually controlled, and gasoline vehicles occupy 84.7% of the total number of motor vehicles in China [17]. With the renewal of vehicle technology, gasoline direct injection (GDI) technology has been widely used, which is different from traditional port fuel injection (PFI) technology. GDI has a good fuel economy and an emission reduction effect of CO2, but has caused the significant increase in particle emissions [18]. Meanwhile, due to the constraints of technology and difficulties in data acquisition to capture the concentrations of black carbon or other particulates, our research uses PM2.5 as the indicator for vehicle particle emissions.
Many studies have explored PM2.5 emissions from on-road vehicles [19,20,21], and the effect of exposure to traffic-related PM2.5 on human health [22,23,24]. Panis et al. (2011) [25] observed that the effects of specific speed reduction schemes on PM emissions from trucks are ambiguous. Xu et al. (2016) [26] examined the commuters’ exposure to PM2.5 in the Shanghai metro system and found that the metro in-carriage PM2.5 concentrations were significantly affected by the ventilation systems, out-carriage PM2.5 concentrations, and the passenger numbers. However, few studies have investigated the relationship between PM2.5 and the structure of road networks. As an important component of sustainable cities, reasonable road layouts would not only ease traffic congestion [27] and save energy, but also reduce the impacts on the environment [28]. Additionally, it has been reported that PM2.5 concentrations near busy roads could be 30% higher than the background levels [29]. Therefore, further research is still necessary to understand the requirements for a more sustainable and environmentally-friendly road network.
The objective of this paper is to assess the effect of road networks on PM2.5 pollution, which mainly focuses on two questions: Do road patterns significantly affect PM2.5 concentrations? How do road patterns affect PM2.5 concentrations? During the study, PM2.5 concentrations were the dependent variable, and road patterns, land-use, and population density were the independent variables, through which a land-use regression model (LUR model) was obtained. By comparing the regression coefficient of road patterns with other factors, the extent of its influence can be determined. Then, by referring to the variable-control approach and excluding the influence of other irrelevant variables, the grades, densities, and layouts of road patterns, can be used to analyze their relationship with the surrounding PM2.5 concentrations.

2. Materials and Methods
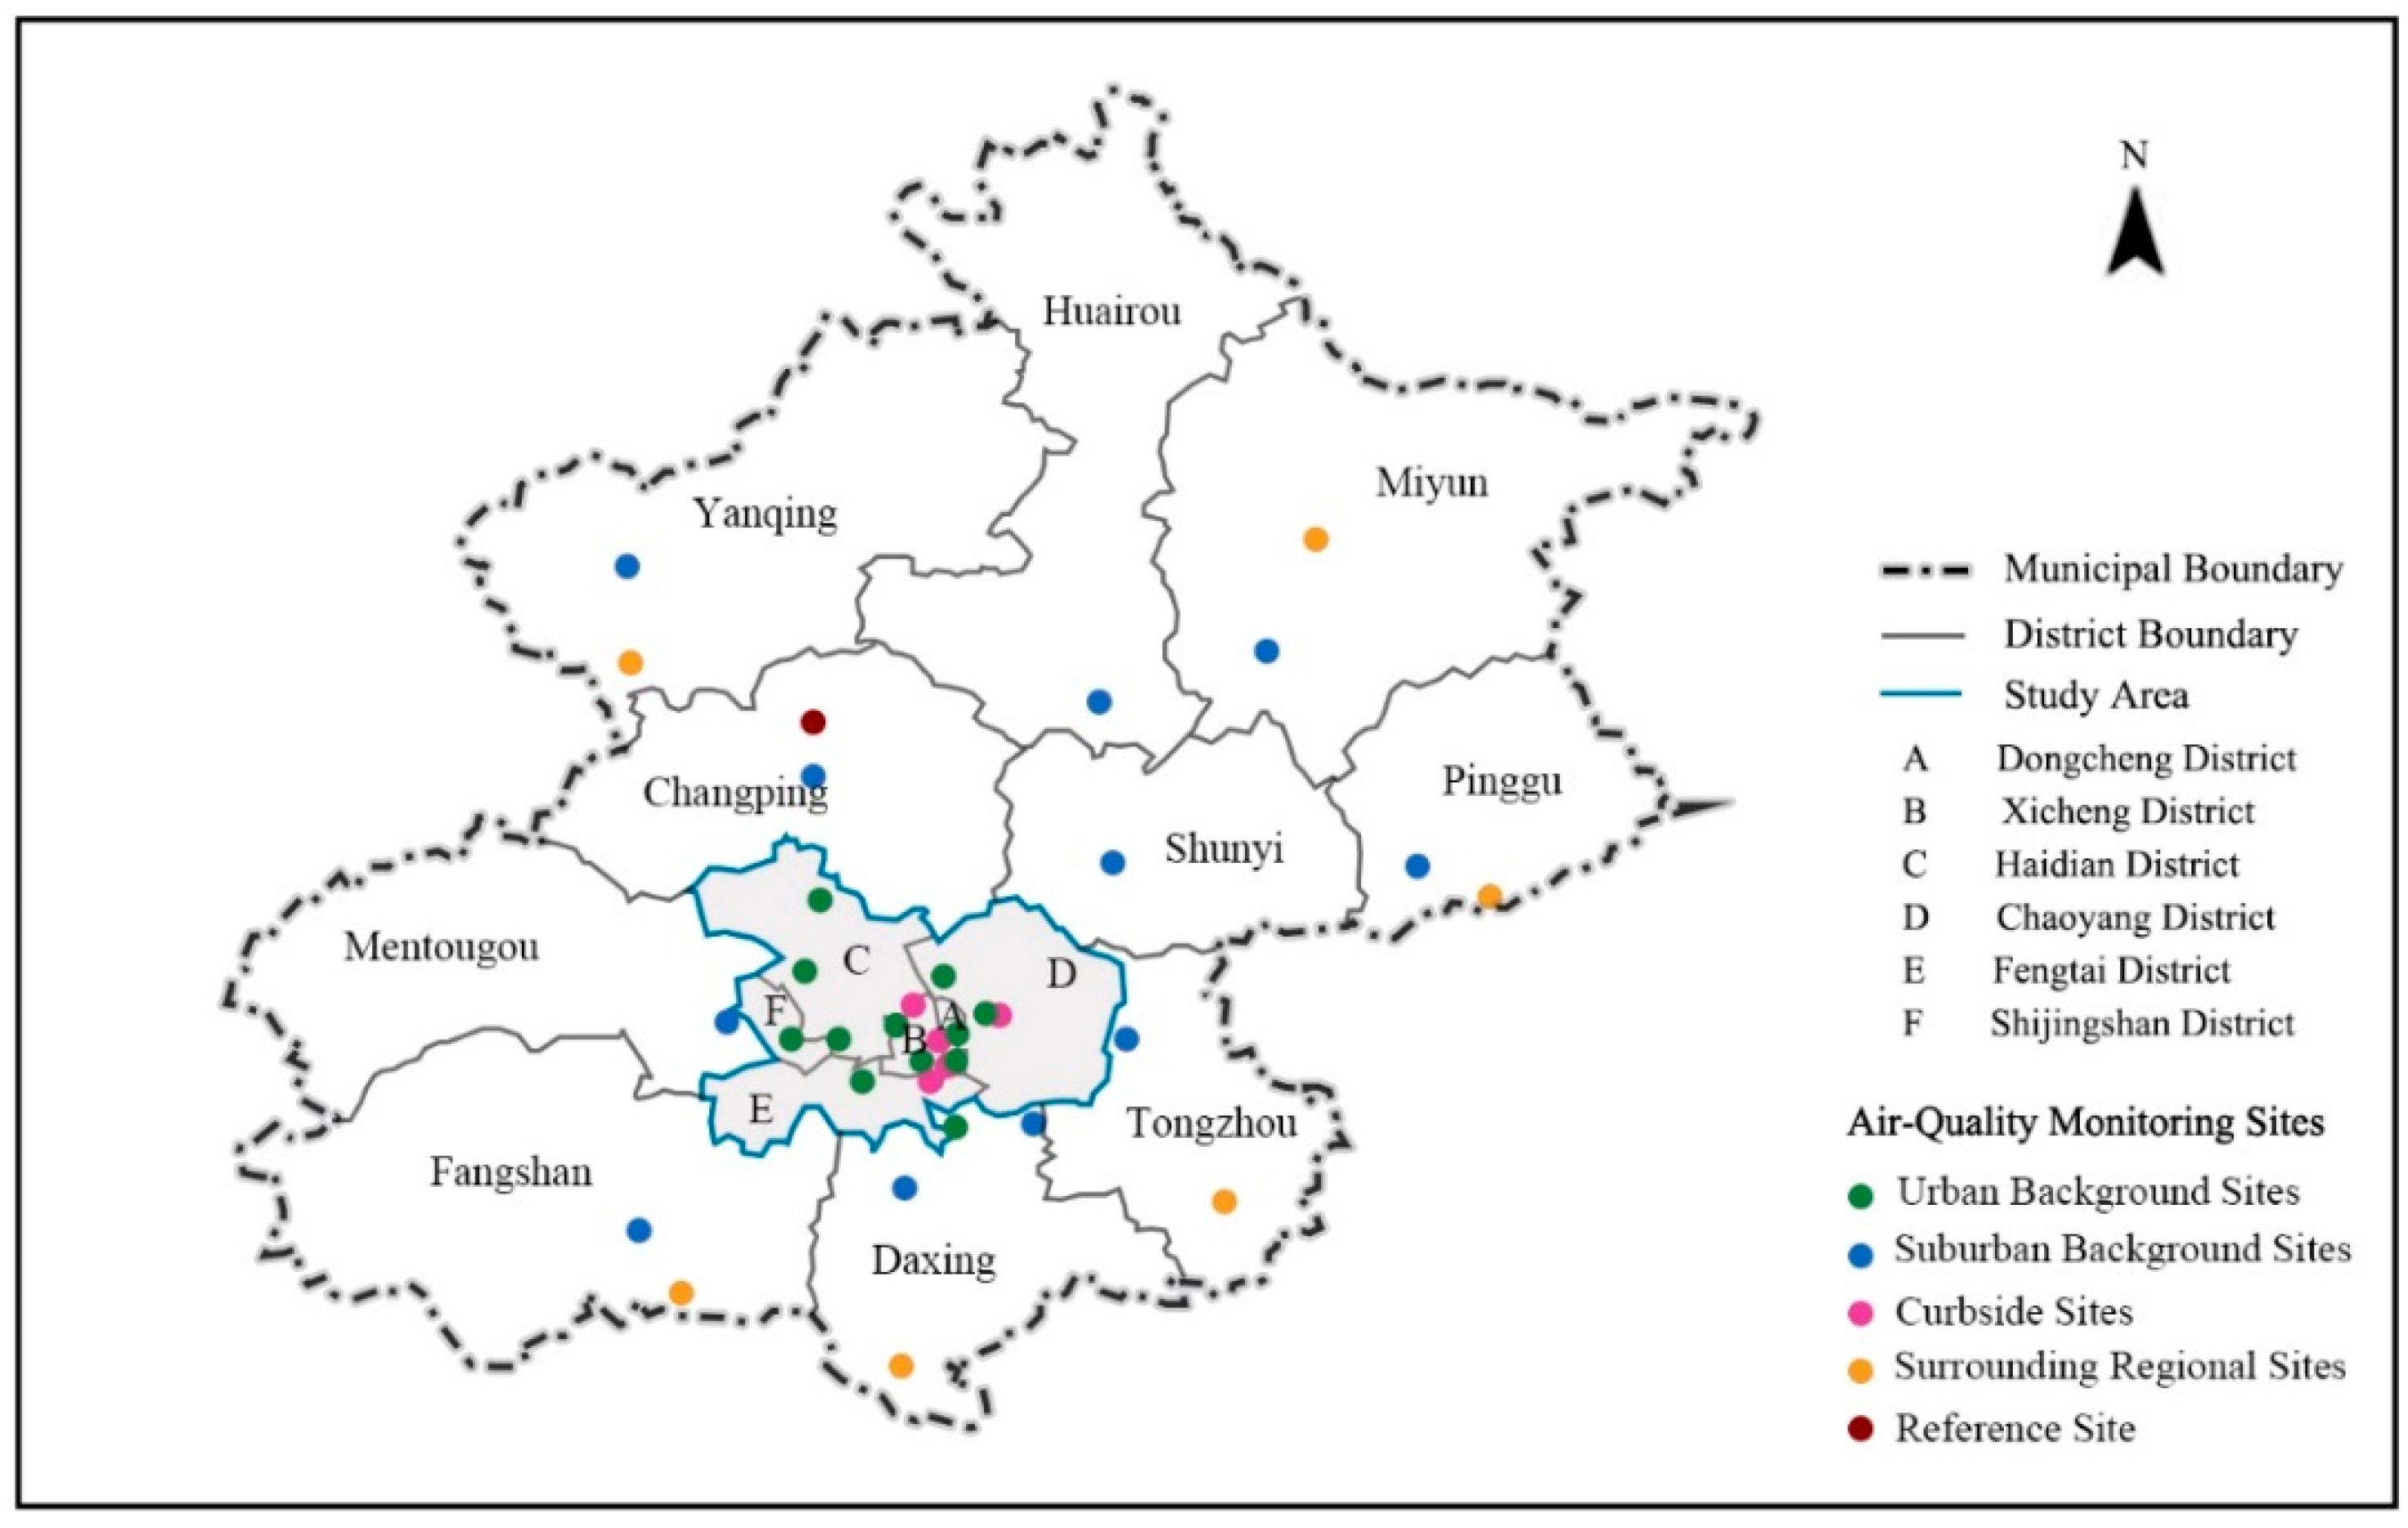
2.1. Study Area

Beijing (115.7°E–117.4°E, 39.4°N–41.6°N), the capital of China, is located in the North China Plain, and is adjacent to a semi-desert area. At an average elevation of 43.5 m, Beijing is surrounded by highlands on three sides. The elevation of the mountain area reaches up to 1500 m above sea level, which is unfavorable for pollution dispersion. Low forest coverage (14.85%) further exacerbates the problem of air pollution. Beijing’s climate is a typical continental monsoon climate, characterized by hot and rainy summers, and cold and dry winters. The average annual precipitation has been less than 450 mm over the last decade, with 80% of the rainfall being mainly concentrated in the summer. With the development of the city, and under the influence of its surroundings, air pollution in Beijing is becoming increasingly serious, with a higher concentration of PM2.5 in the southern part, than the northern part of Beijing. Considering the major differences between urban areas and suburbs, as well as the distribution characteristics of the air-quality monitoring sites, this paper takes the central zone of Beijing as the study area, including the Dongcheng District, Xicheng District, Chaoyang District, Haidian District, Fengtai District, and Shijingshan District, which together cover 8% of Beijing’s land area, 60% of the region’s population, and 70% of the region’s industries. The traffic index of the central zone of Beijing is around 5.5, which is little higher than the Beijing average traffic index of 5.1, meaning that parts of the ring and main roads are congested.

2.2. LUR Model

Approaches that have been developed to simulate the distribution of the concentration of air pollutants usually include geostatistical interpolation [30], land-use regression [31], dispersion [32], and hybrid [33] models. “Dispersion models use information on emissions, source characteristics, chemical and physical properties of the pollutants, topography, and meteorology to model the transport and transformation of gaseous or particulate pollutants through the atmosphere to predict, e.g., ground level concentrations” [34]. Also, it is expensive and difficult to obtain the high-precision data of pollutant sources and meteorology, which then has to be initialized and parameterized. Moreover, the interpolation method is only based on the monitoring of data, which means that it is hard to indicate the spatial variation of pollutant concentration on a small scale [35]. Compared with these methods, land-use regression (LUR) has been widely used, and has rapidly become an important approach for predicting long-term average pollutant concentration at an intra-urban scale [36]. Also, it is a promising approach for predicting ambient air pollutant concentrations at high spatial resolution [37,38], as it has a low requirement for the categories of the data, and the model is simple to construct. With less accurate exposure-estimating methodologies, such as those based on ambient city-wide monitoring or distance to road calculations, an increased exposure measurement error may bias the models toward null [39]. Moreover, the concentration of ambient pollution is usually used as a dependent variable, while the surrounding land-use, transportation, and population density are extracted using geographic information systems (GIS) and are included in a regression equation as predictor variables [40,41]. The LUR model has been applied in more than nine countries and 14 cities across Europe (e.g., [42,43]) and North America (e.g., [44,45]). European and North American LUR models yielded a predictive capacity (as R2) ranging from 35% to 94% for PM2.5 [36].
The keys to the success of the LUR model are as follows: (1) The selection of variables: the specific modeling usually requires three to five variable categories, and some of the most widely used include land-use, traffic emission, meteorology, population density, distribution of emission source, altitude, and so on; (2) Removing and selecting the variables: three principles should be considered, which are that variables are not significantly correlated with Xi, they meet the t-statistics values, and the R2 value is not less than 1%; (3) The choice of the buffer radius of the air-quality monitoring site: the buffer radius is closely related to the spatial precision and the research scale. Under normal conditions, the maximum buffer radius of land-use and population density could be up to 5000 m, and the maximum buffer radius of the road is relatively small [46].
The LUR model-building steps usually include the following: (1) Calculating the correlation between the variables and PM2.5 concentrations, and then ranking all of the variables by the absolute value of their correlation with PM2.5 concentrations; (2) Identifying the highest-ranking variable in each subcategory (Subcategory is a subdivision that has common differentiating characteristics within a larger category); (3) Eliminating other variables in each subcategory that are significantly correlated to the most highly ranked variable; (4) Entering the rest of the variables into a database for stepwise linear regression; (5) Removing any variables that have insignificant t-statistics values from the available pool; and (6) Repeating steps four and five to converge data, removing any variable that contributes to less than 1% of the R2 value, for a parsimonious final model [37]. The general regression equation of the LUR model is as follows:
c = a 0 +   a i   ·   X i   + ε i   ,   i   =   1 ,   2 ,   3 ,   ...   ,   n
In Equation (1), c is the concentration of PM2.5; a i   ( i = 0 ,   1 ,   2 , , n ) are regression coefficients; X i   ( i = 0 ,   1 ,   2 , ,   n ) are independent variables;   ε i   is the random error.

2.3. Data Collection

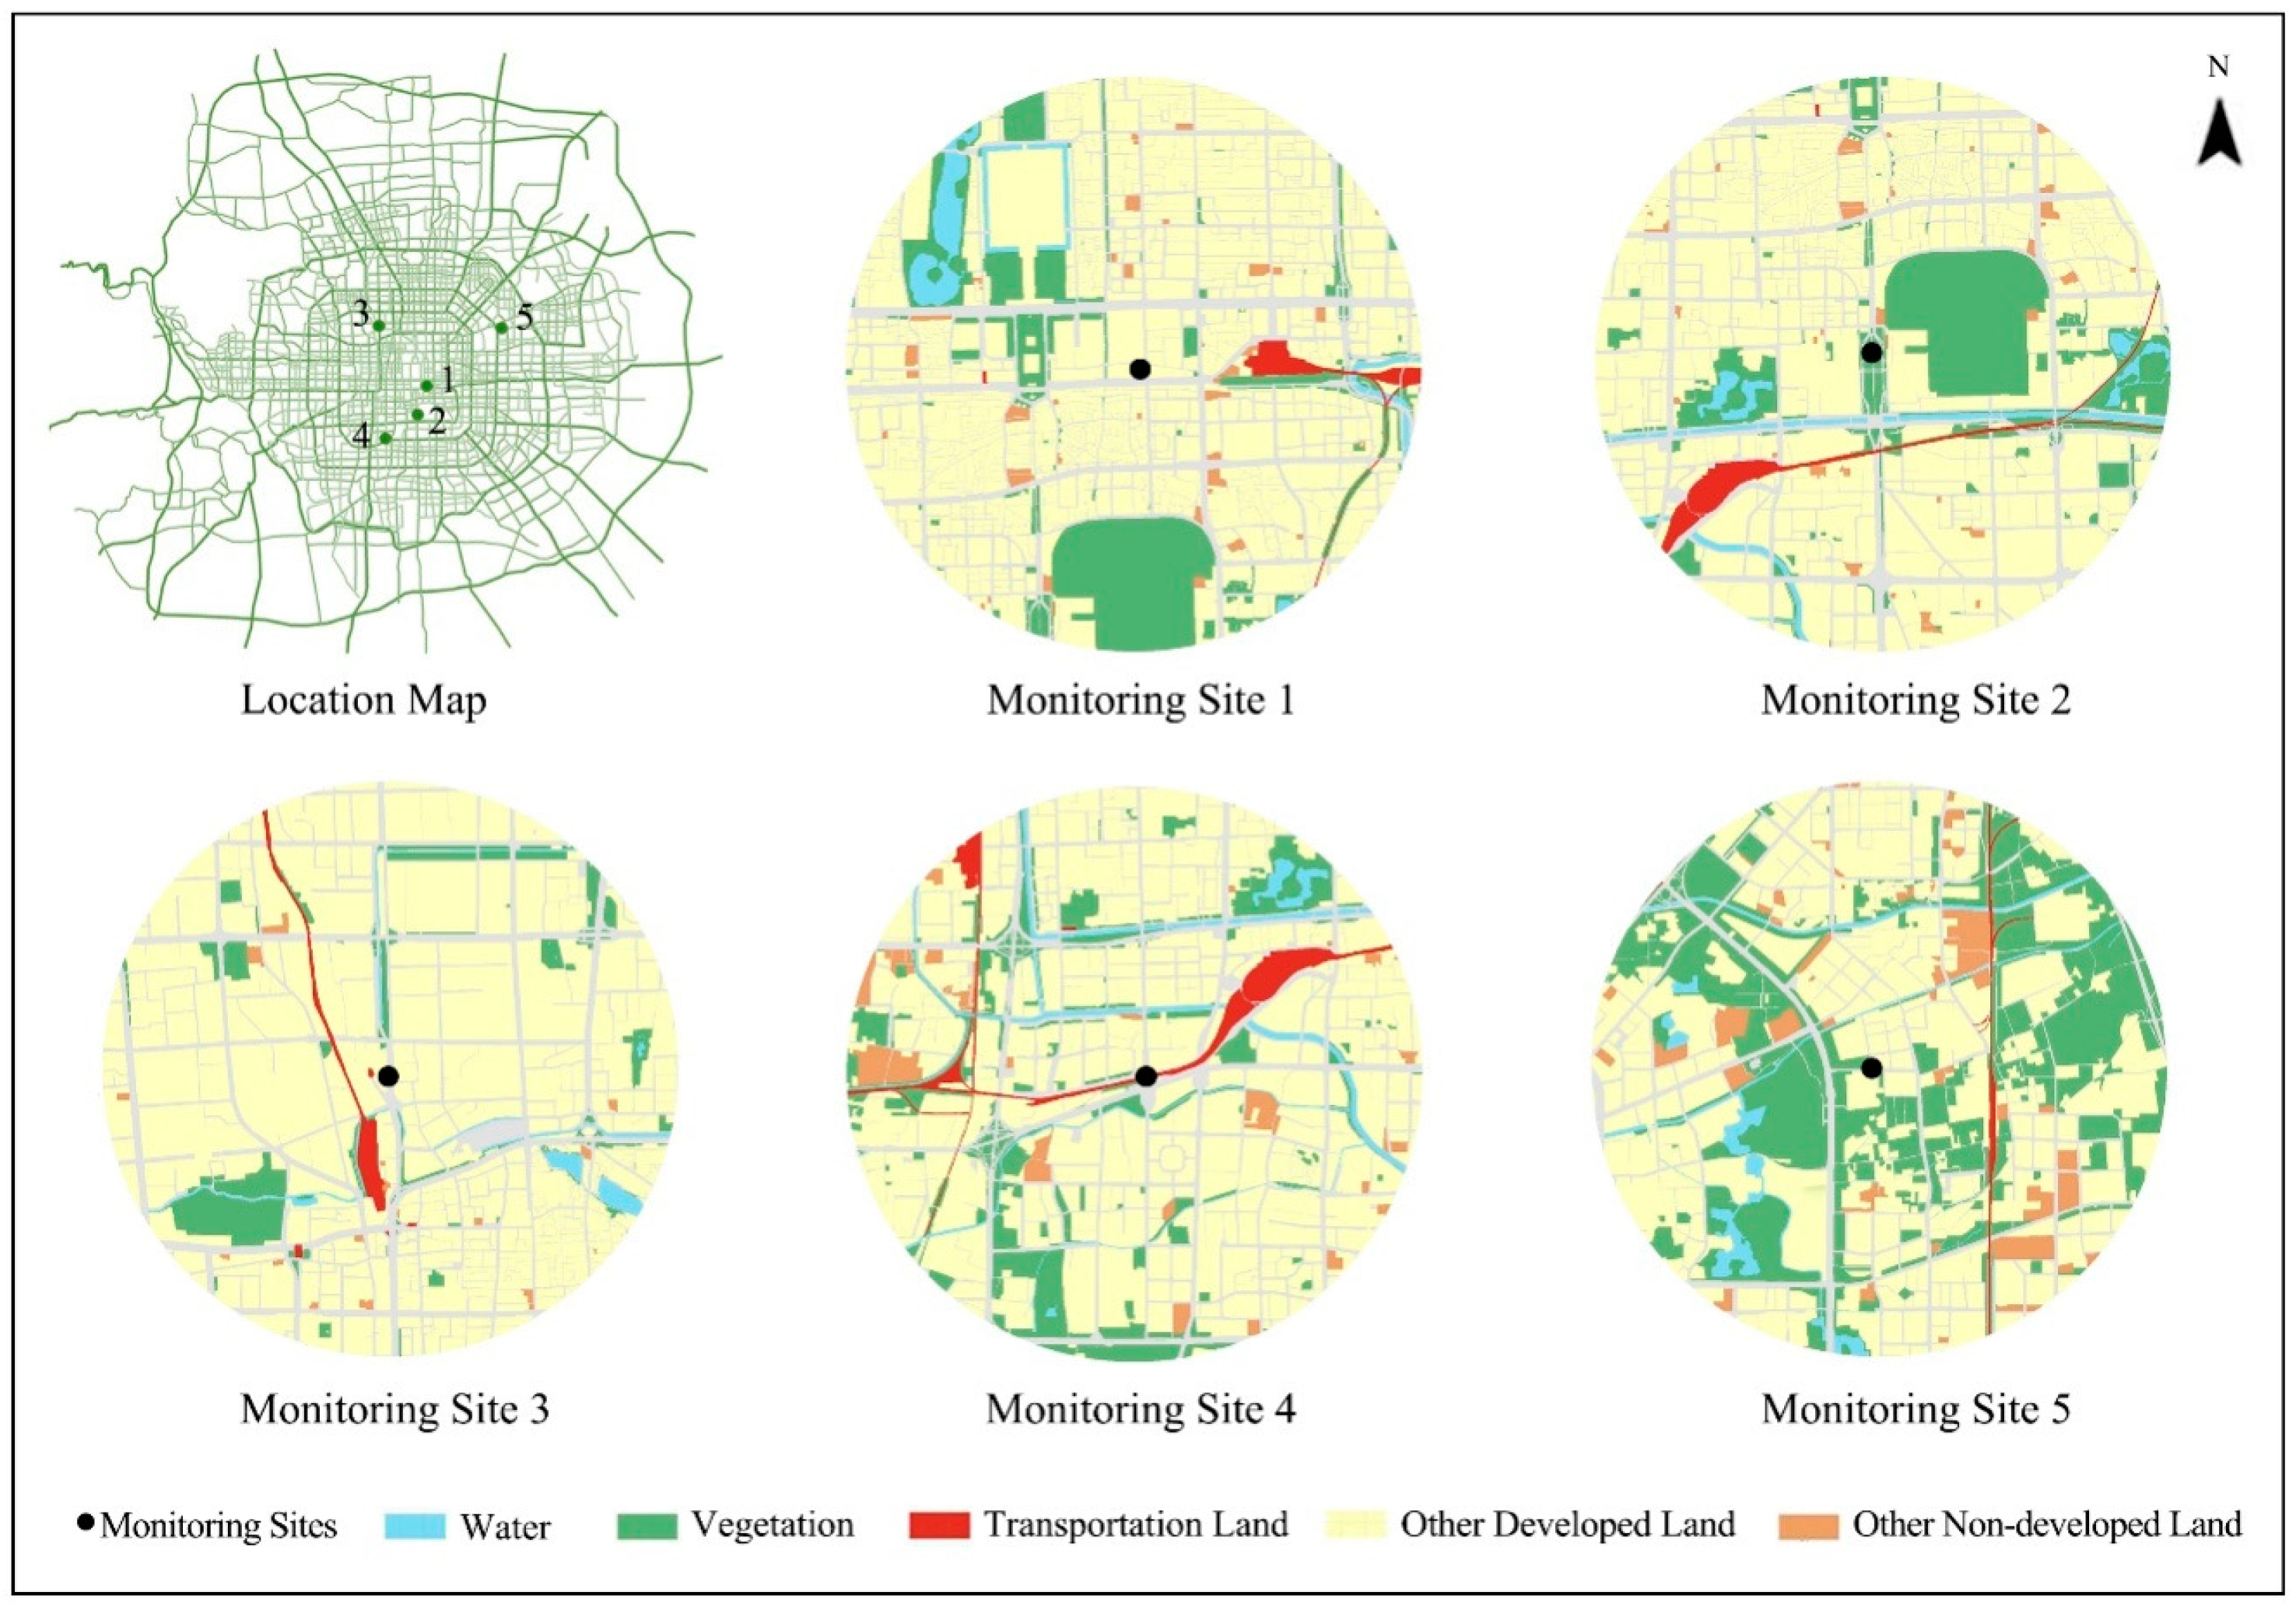
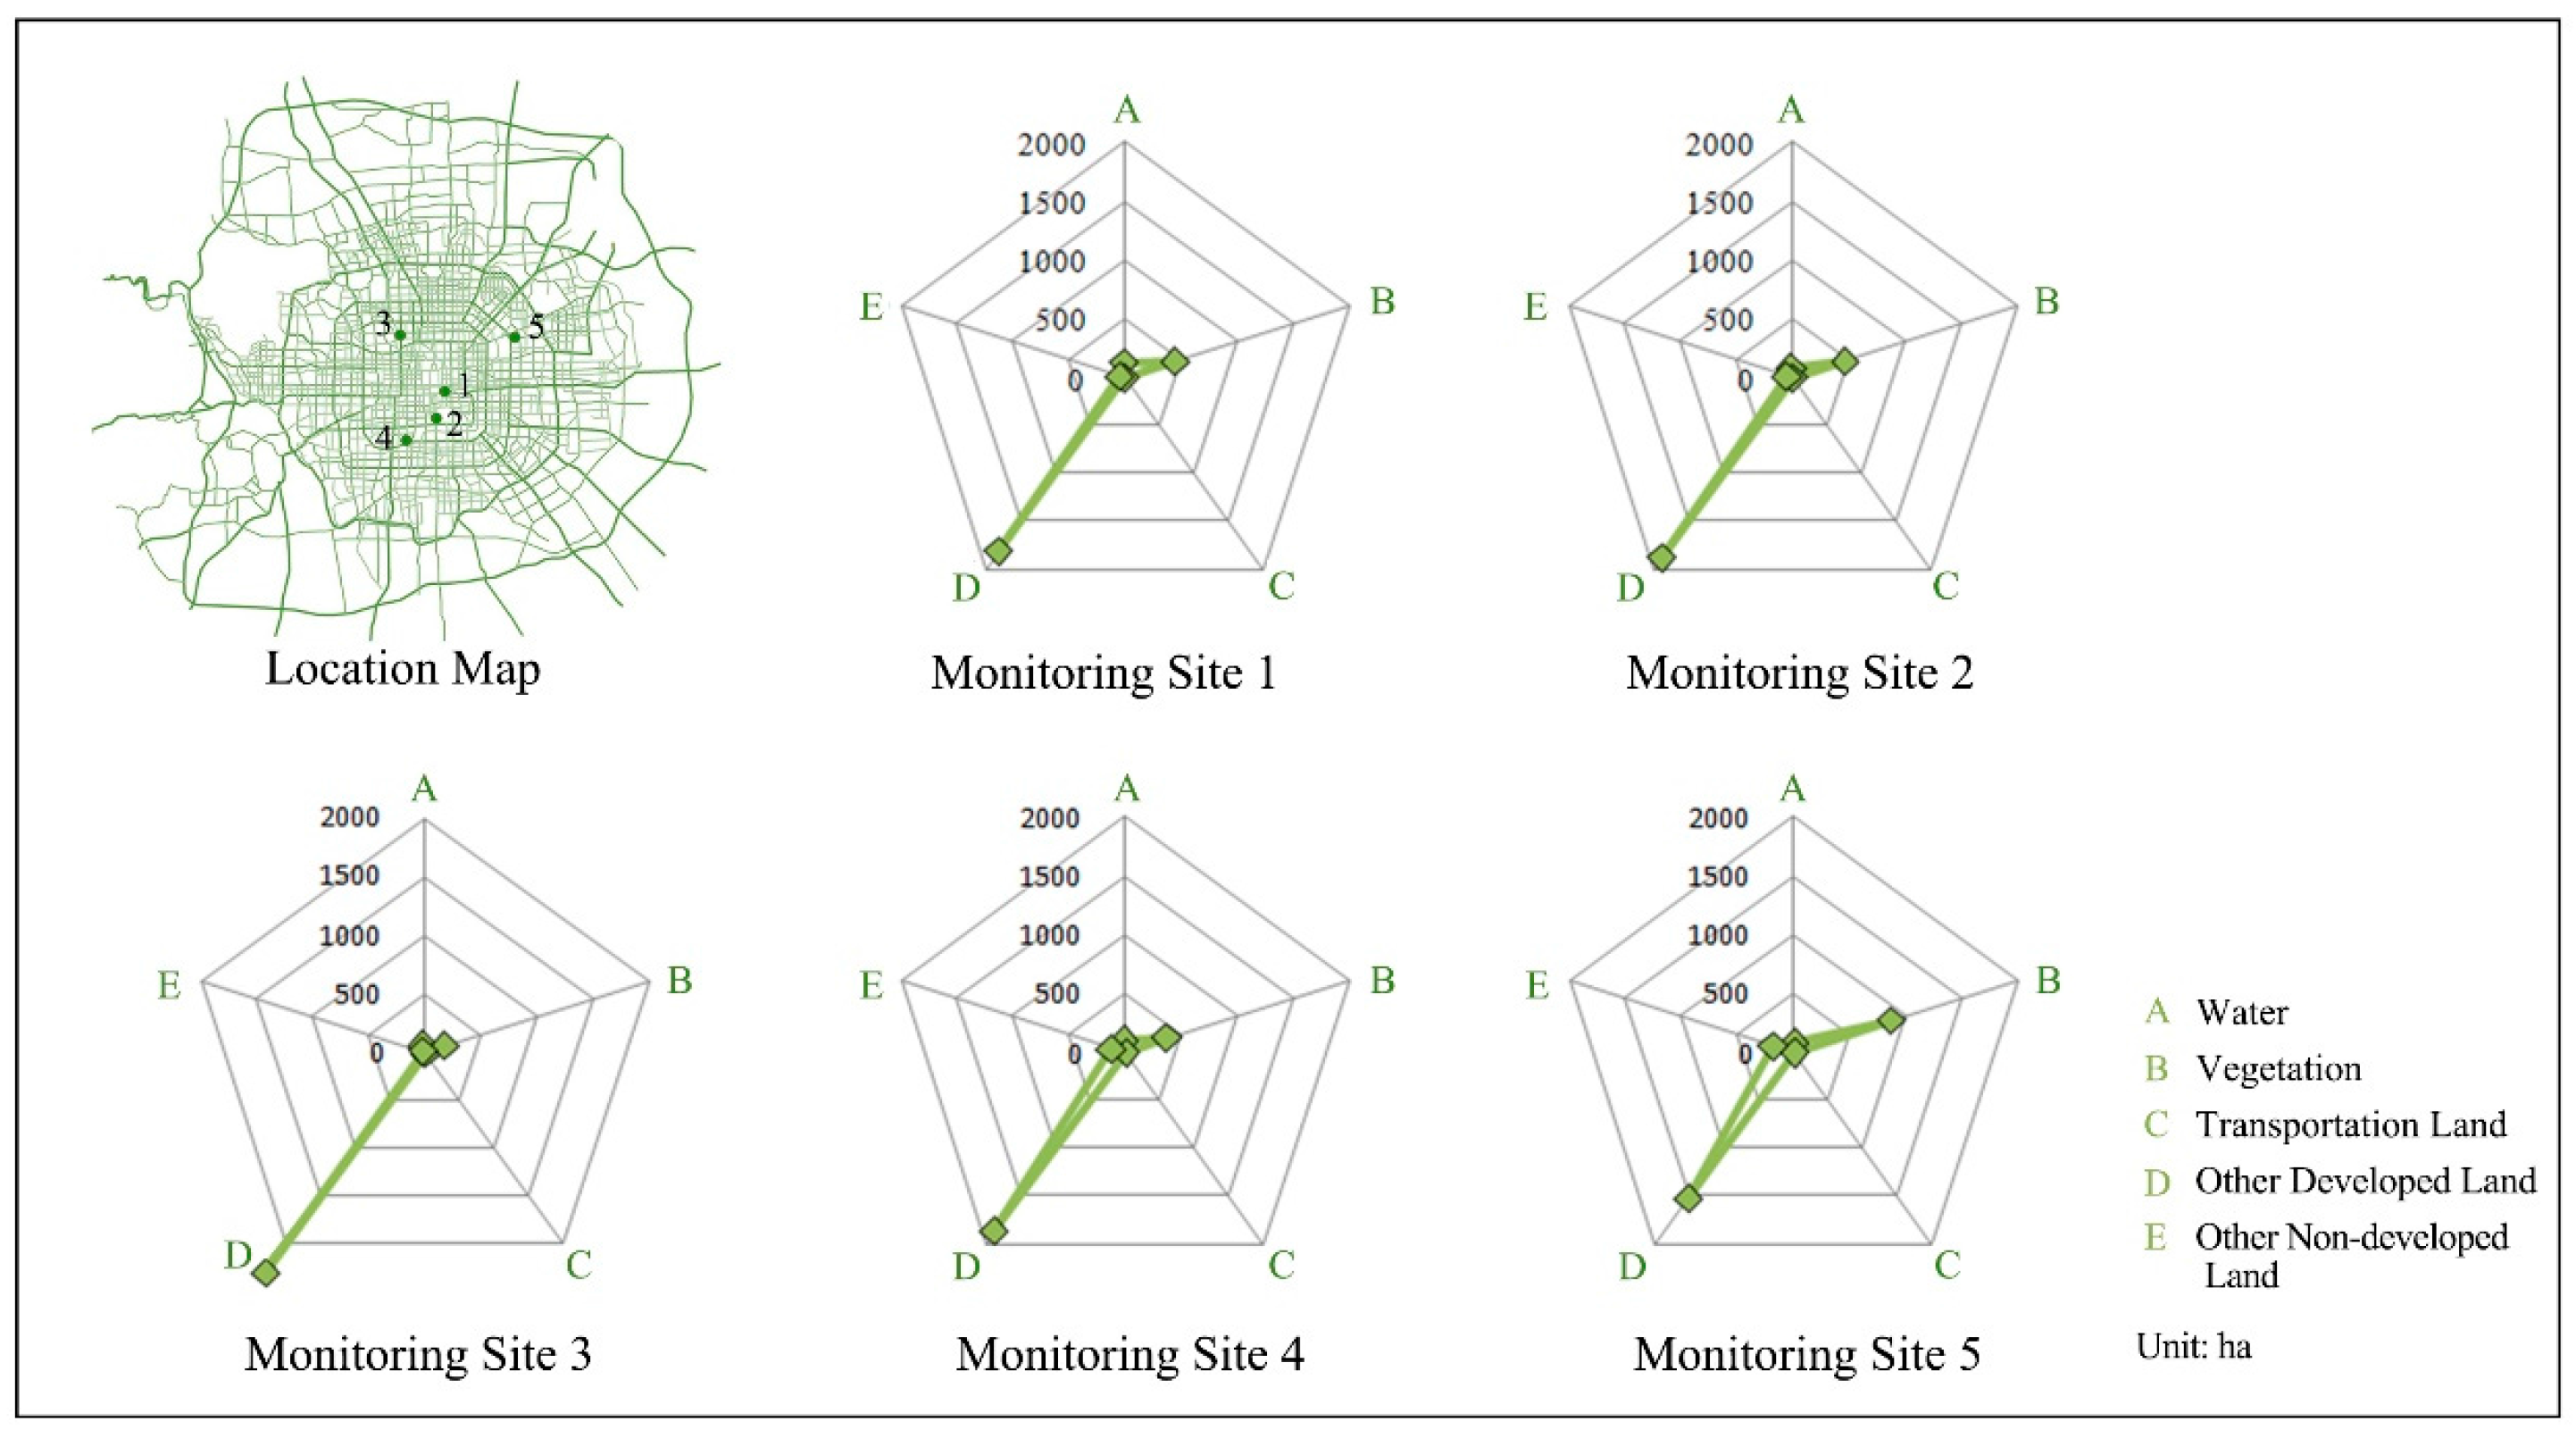
2.3.1. Monitoring Sites

The data on PM2.5 concentrations were collected from 35 air-quality monitoring sites in Beijing, which can be sorted into five categories: 12 urban background sites, 11 suburban background sites, five curbside sites, six surrounding regional sites, and one reference site (Figure 1). The reference site is included with the aim of reflecting the level of air quality in urban areas that not affected by local pollution. Moreover, these real-time monitoring data are posted online by the Beijing Municipal Environmental Monitoring Center in Beijing Air Quality Real-time Broadcasting (http://zx.bjmemc.com.cn/). Among these monitoring sites, the five curbside sites are located along main roads and are directly exposed to traffic emissions, while the 12 urban background sites are located far from the roads. These two types of sites are completely located within the study area. The PM2.5 data used in this paper are the annual average concentrations of both curbside sites and urban background sites in 2015.

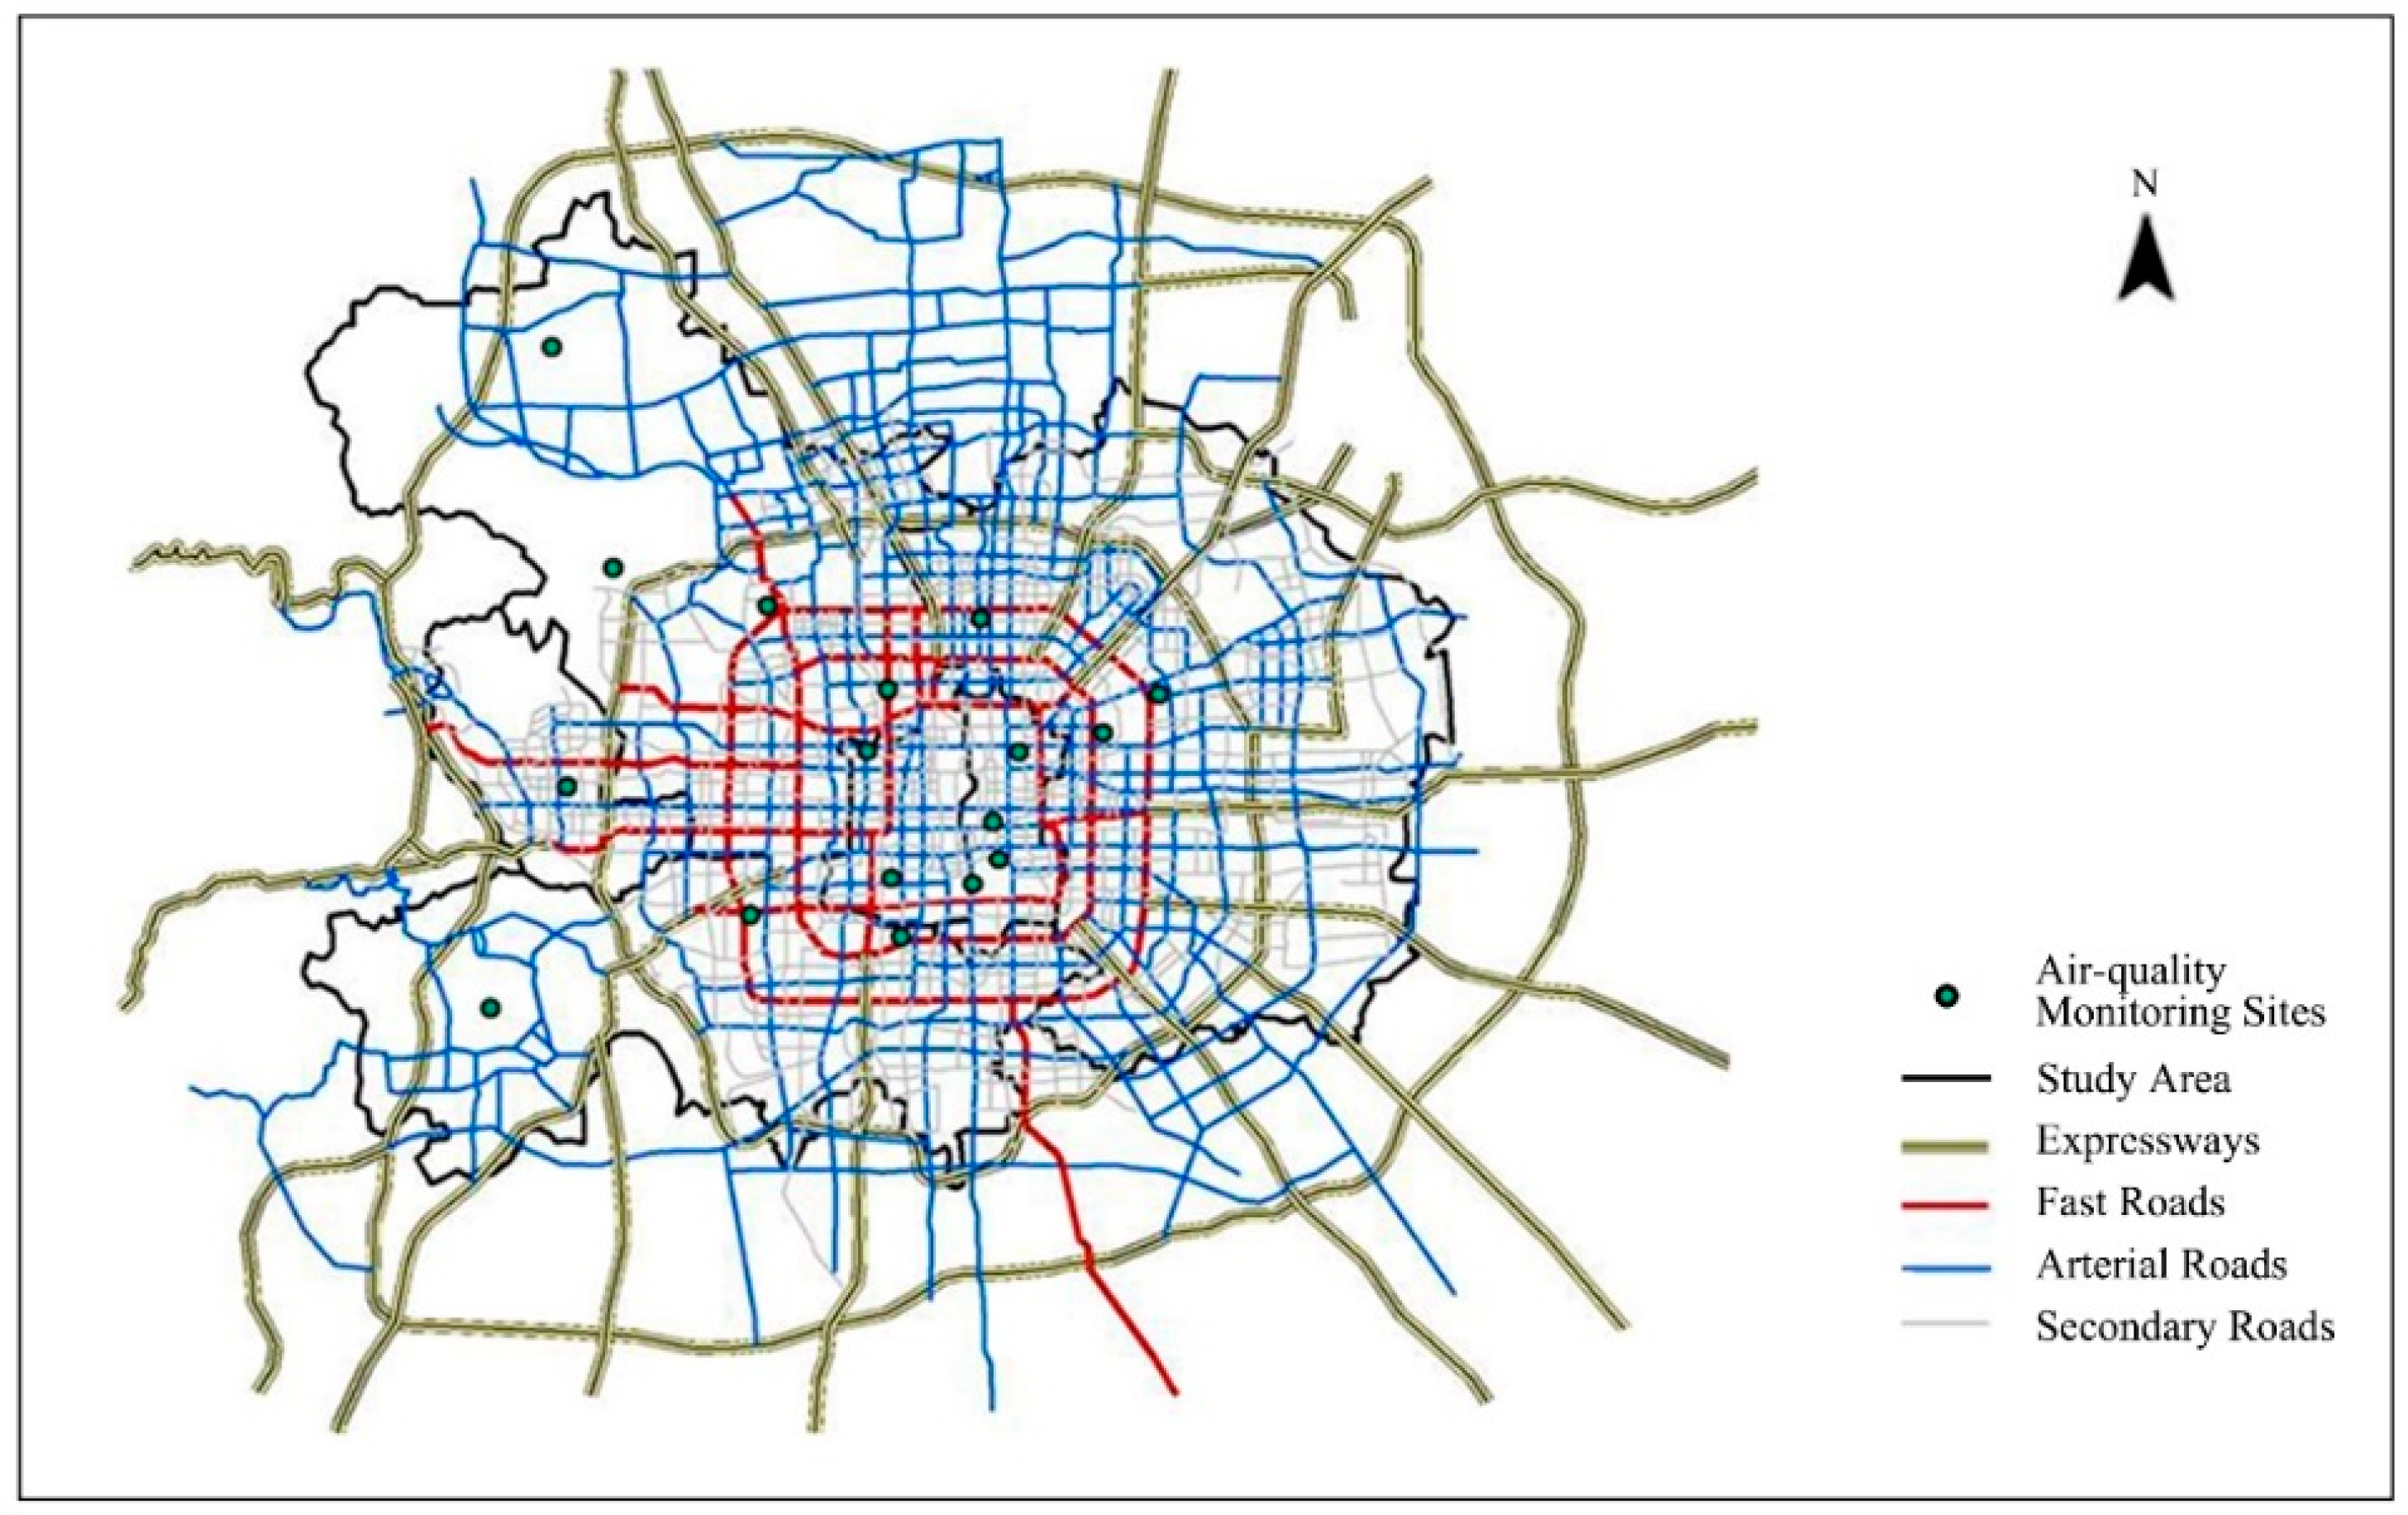
2.3.2. Road Traffic Data

The differences in traffic monitoring programs in urban areas result in variable types of traffic indicators. If cars and trucks are systematically enumerated, then variables reflecting traffic intensity can be generated. However, if traffic counts do not exist, then road classifications can be used as a surrogate, because road classification can reflect traffic volumes at a certain level. The higher the road level is, the larger the traffic flows are. Henderson et al. attempted to assess whether a similar LUR model could be obtained from the two different sets of traffic variables—traffic volume and road patterns. All of these results suggest that models built with road length and vehicle density metrics, are equally able to explain the variability in pollutant concentrations. This finding confirms that valuable LUR models can be developed in the absence of traffic count data, which are unreliable or nonexistent in many areas [37]. Many other scholars have also used road patterns to build LUR models [47,48]. Since it is difficult to collect the traffic flow data in Beijing, road classifications were selected in this study. During further research, roads were divided into five classes, including expressways, fast roads, arterial roads, secondary roads, and branch roads (Figure 2). The corresponding data come from the Master Planning of Beijing (2004–2020) [49] and Beijing Traffic Tourism Map (2015) [50].

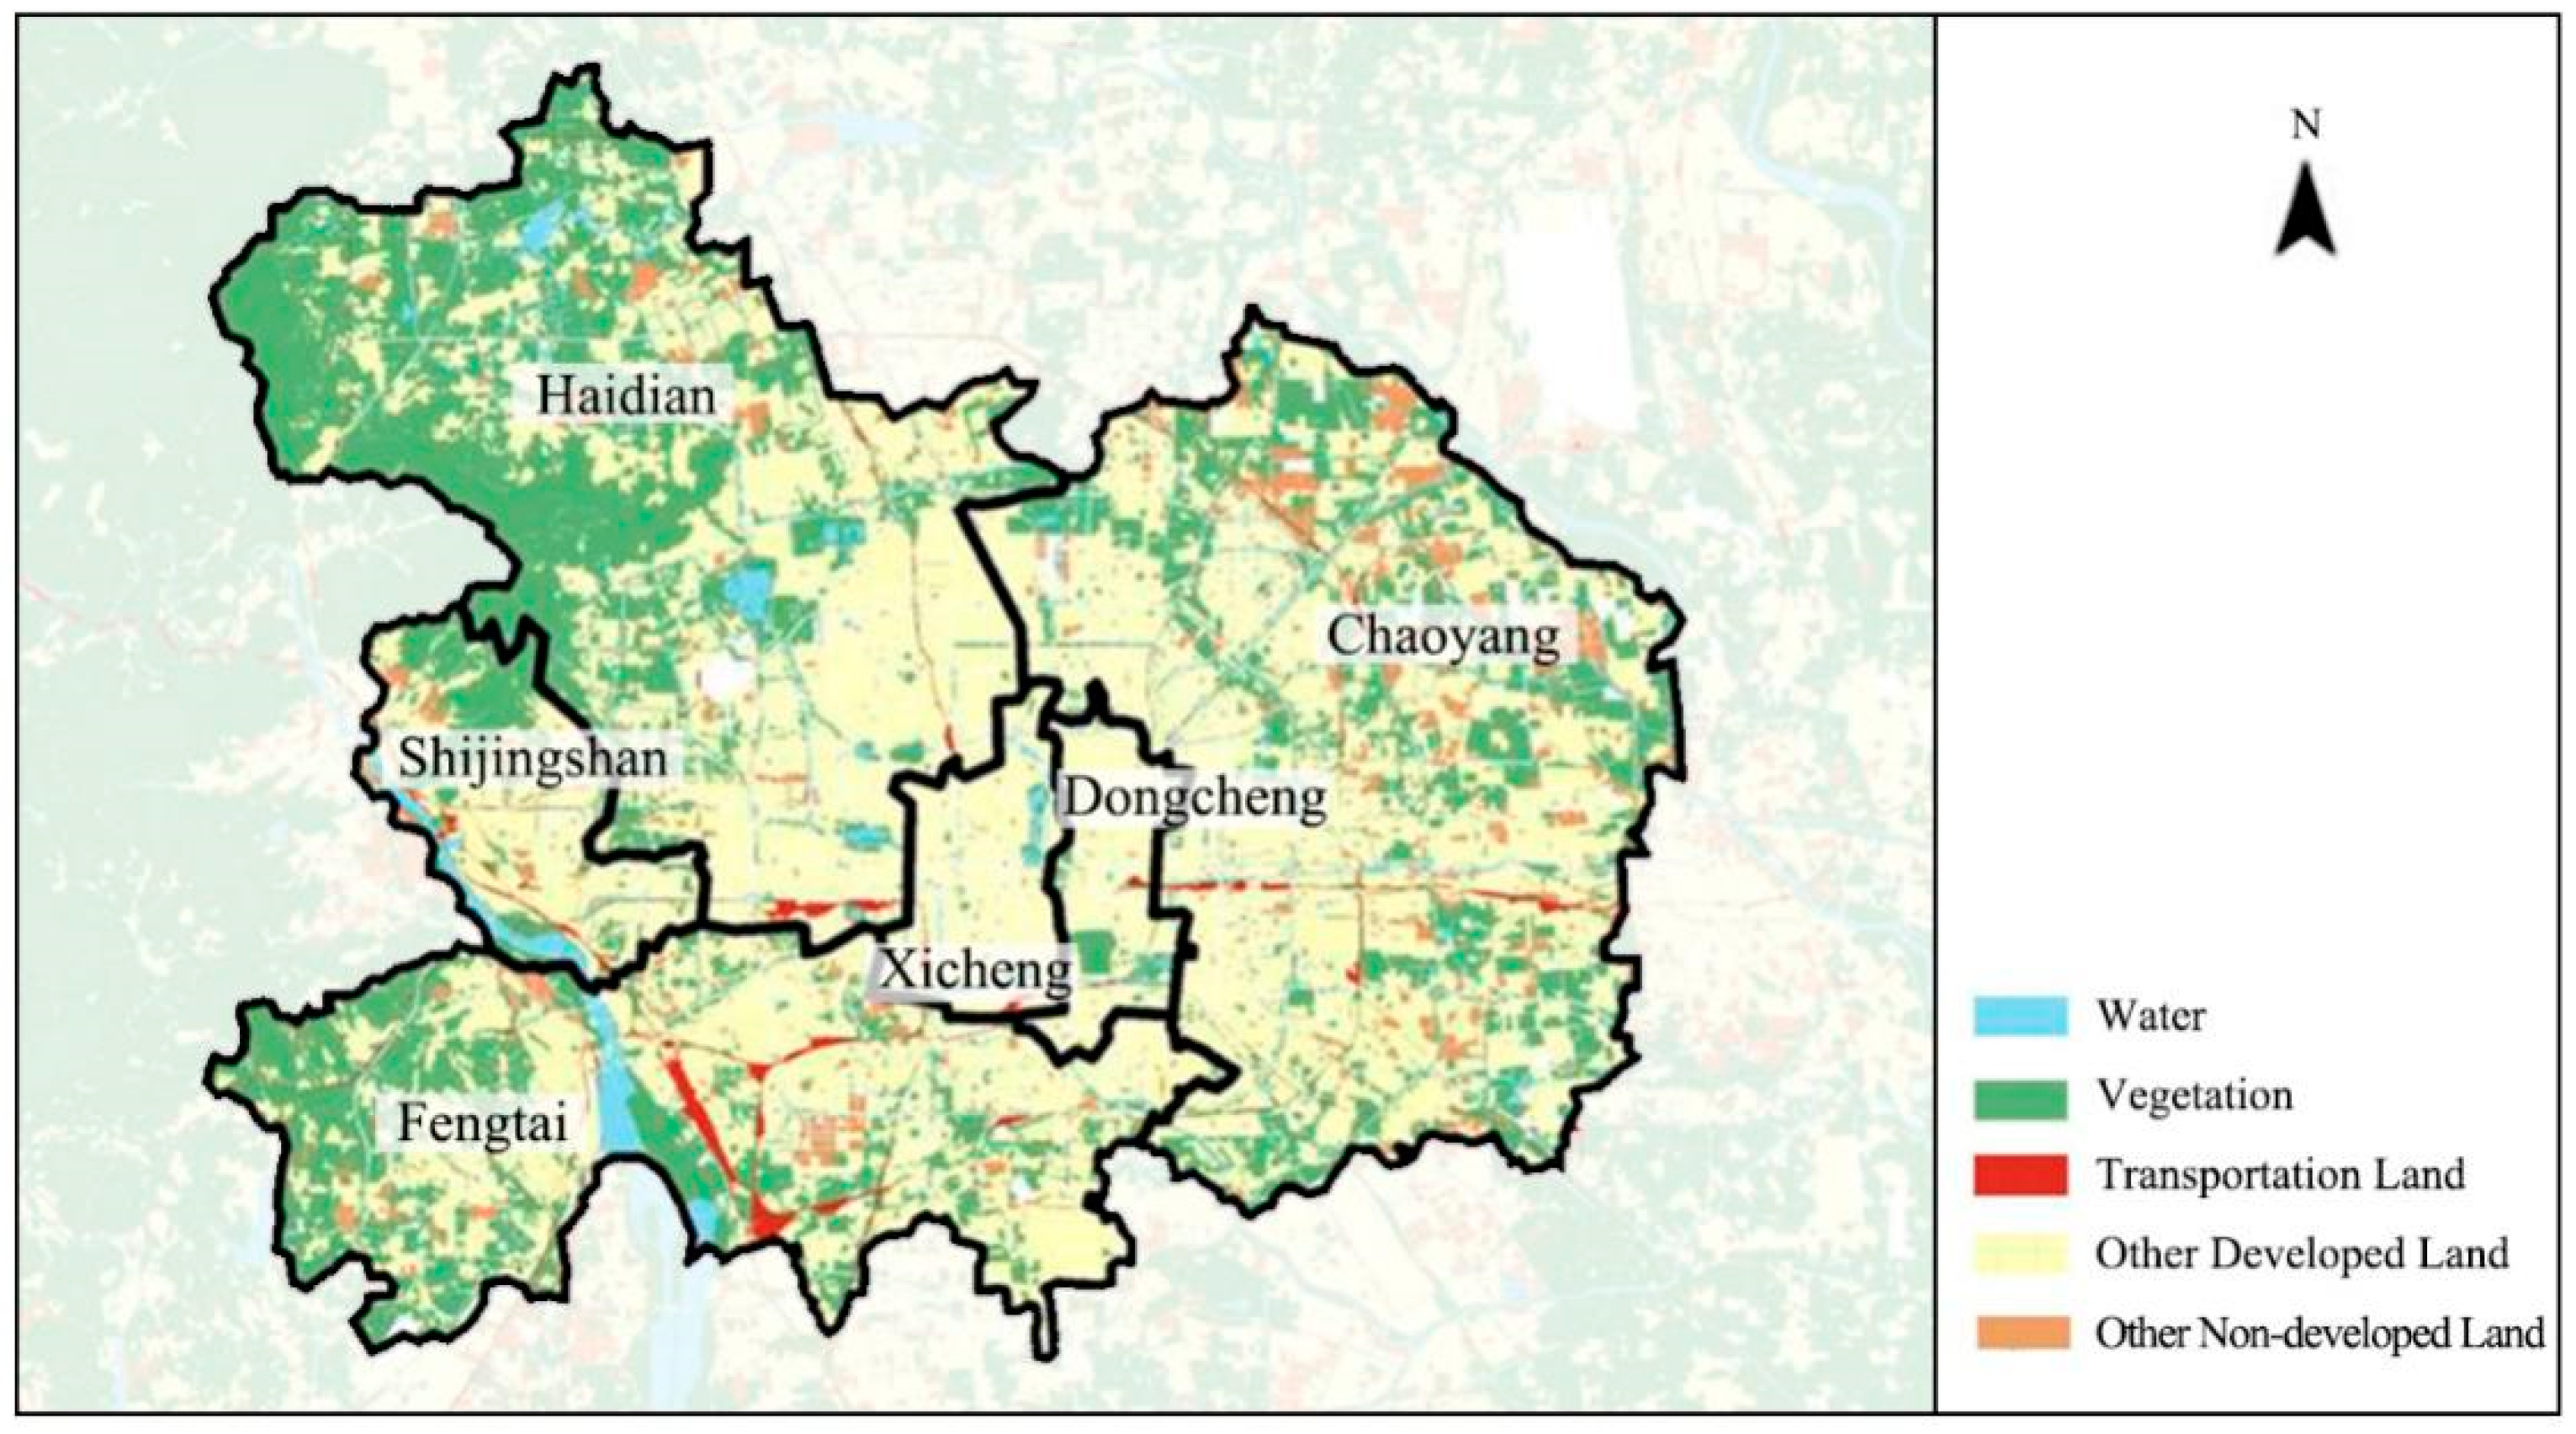
2.3.3. Land-Use Data

The land-use map of Beijing in 2014 was compiled by the Beijing Municipal Institute of City Planning & Design, which was then combined with the satellite imagery of Google Earth to obtain the land-use map of the study area in 2015. According to the Code for classification of urban land-use and planning standards of development land, and its positive and negative influences on PM2.5, land is divided into five types, including water, vegetation, transportation land, other developed land, and other non-developed land (Figure 3, Table 1). It is particularly worth mentioning here that, because the impact of traffic on PM2.5 concentrations is measured by the lengths of different roads, the land represented by road is not included in transportation land.

2.3.4. Population Data

With a dense population, the study area supports approximately 60% of Beijing’s permanent residents. Because this population could reflect the residential energy consumption, population data are also considered as a factor affecting the air quality [51]. The population data were taken from the Beijing Statistical Yearbook 2015 (Table 2) [52].

3. Results

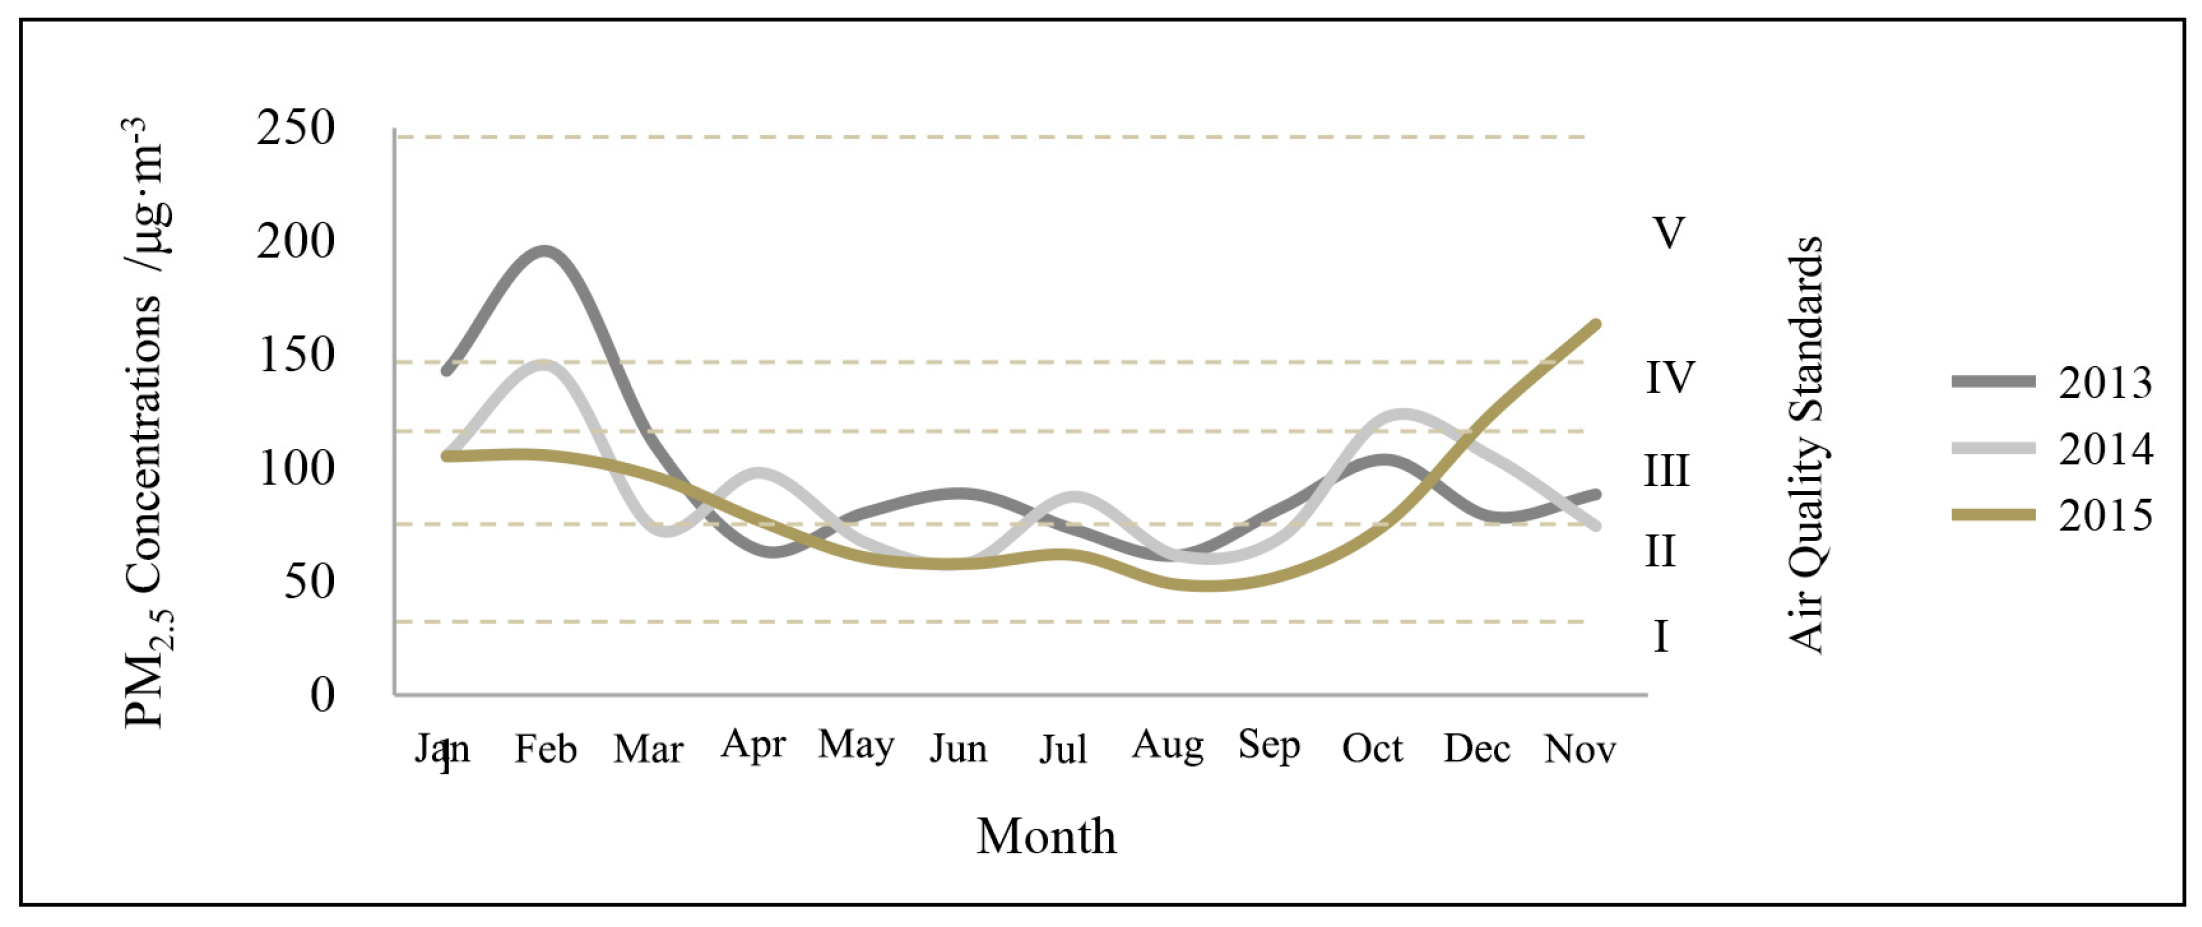
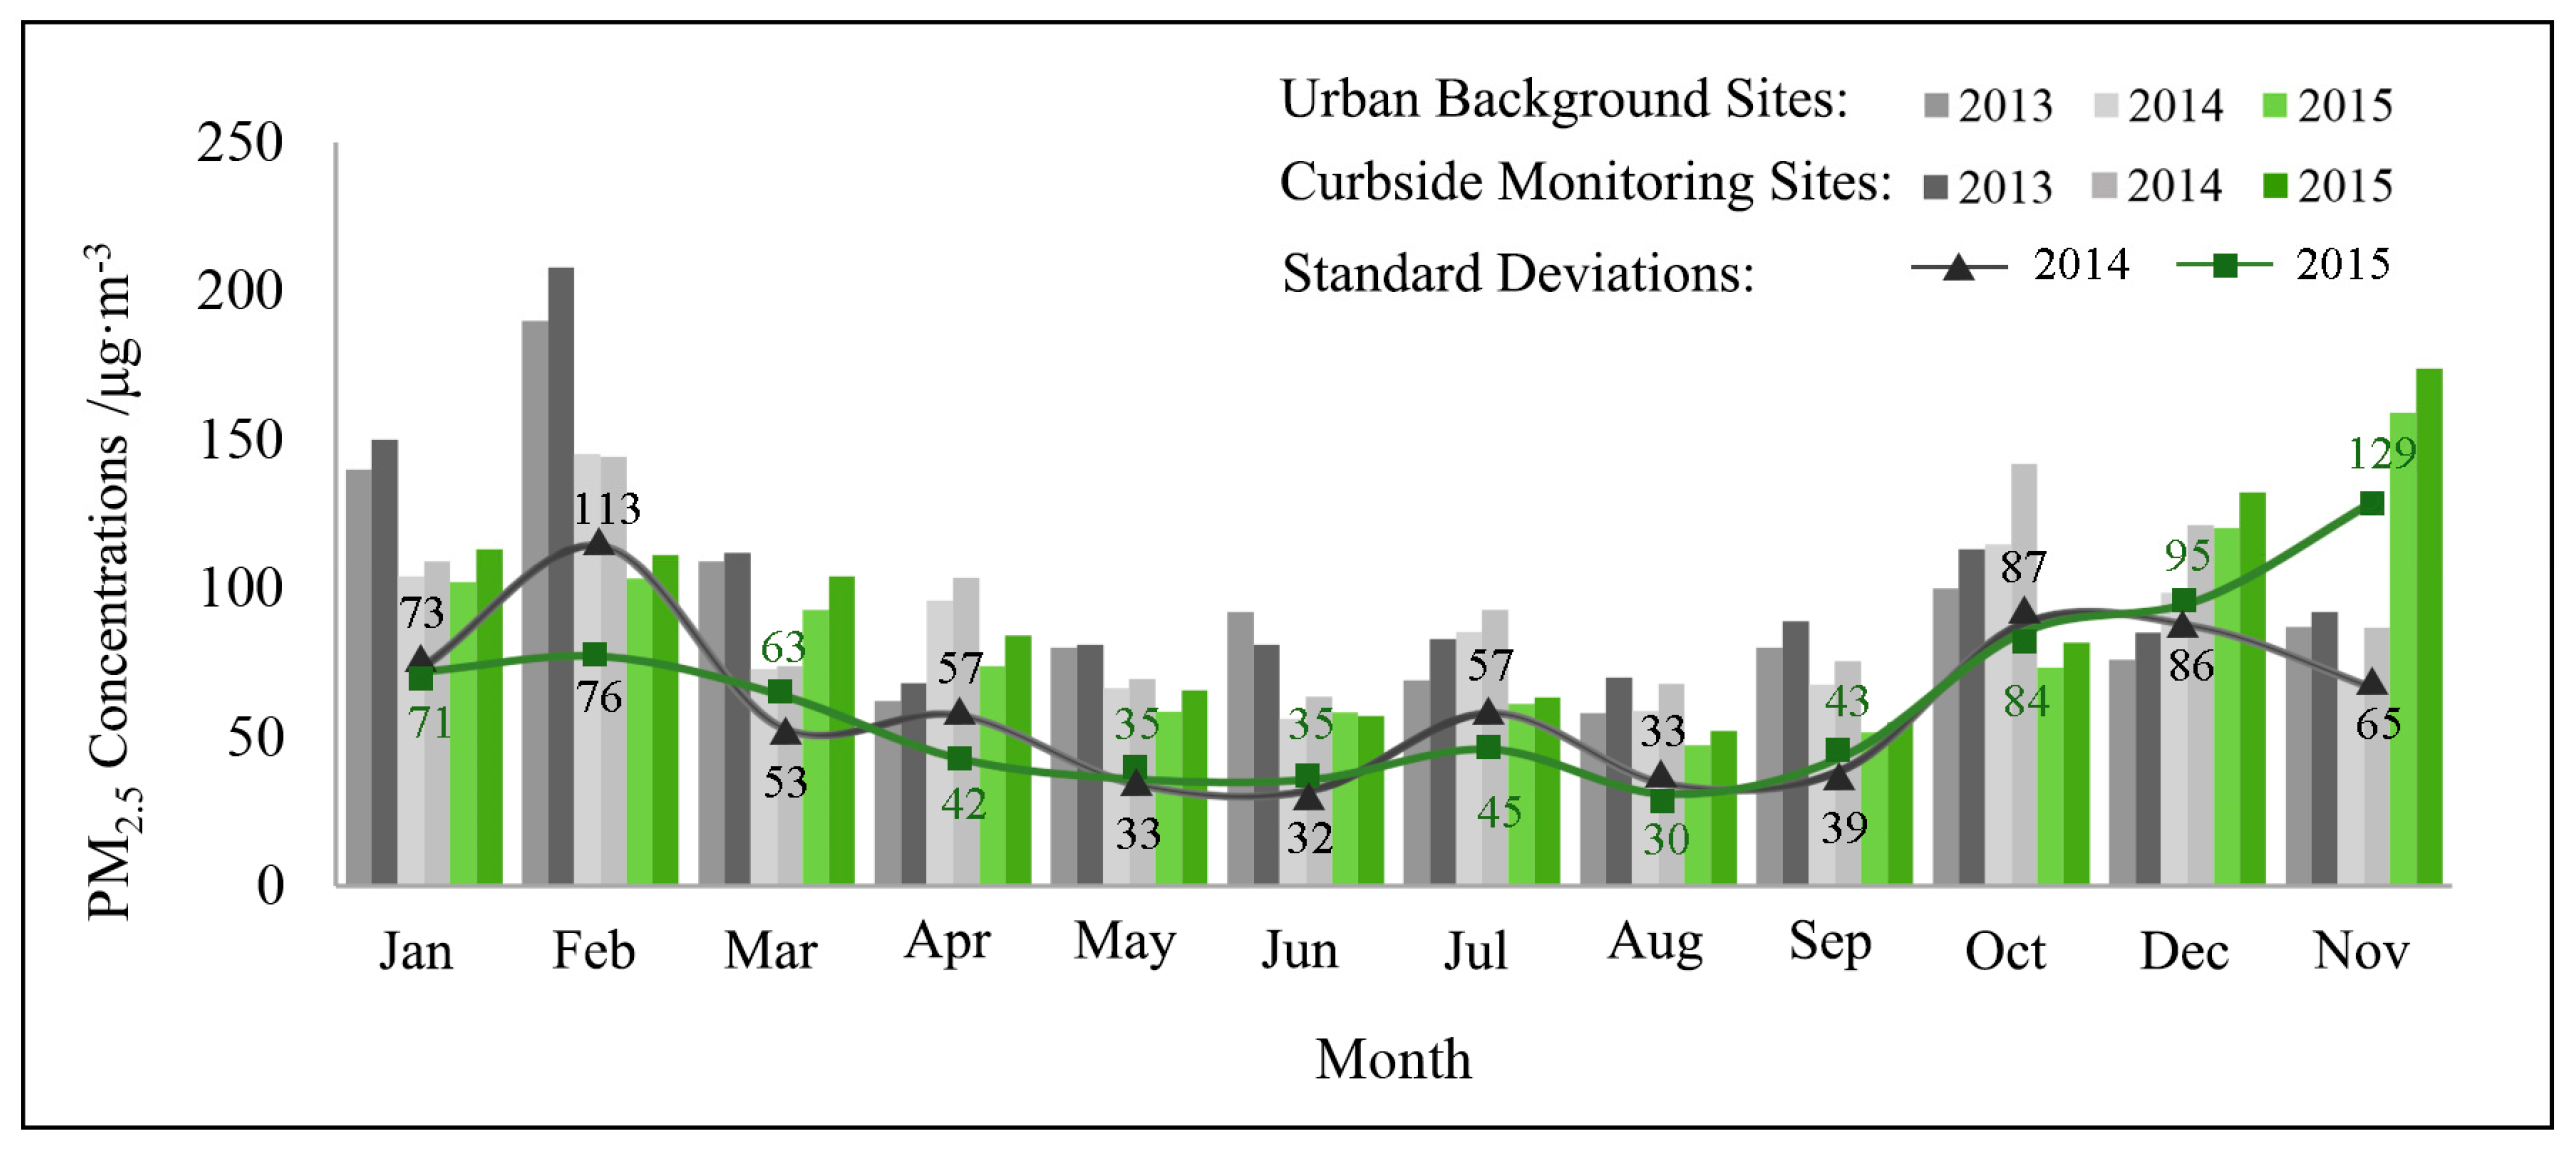
3.1. Air Quality in Beijing

Figure 4 shows the air quality of Beijing over the last three years. Spring runs from March to May, summer from June to August, autumn from September to November, and winter from December to February. The heating season in Beijing is always between November and March.
From the perspective of annual variation, the air quality of Beijing has improved in fluctuation in recent years (annual mean concentrations of PM2.5 for 2013, 2014, and 2015 were 98, 89, and 86 μg/m3, respectively). However, this air quality continues to be far below both the international standard (10 μg/m3), and the national first level standard (35 μg/m3). From the perspective of seasonal variation, PM2.5 pollution varies largely with the season, with the highest pollution occurring in winter, and the least pollution occurring in summer and autumn. From the perspective of monthly variation, PM2.5 concentrations fluctuate greatly throughout the year. The peaks in 2013 and 2014 appeared in February, and can be seen in December during 2015, while the troughs during 2013 to 2015 were in August. Previous studies show that the major reason for the frequent PM2.5 pollution in winter is the coal-fired heating during that time, in both Beijing and the surrounding areas [53]. Moreover, the lighting of fireworks during the spring festival also results in poor air quality.
According to the records (Figure 5), PM2.5 concentrations around curbside monitoring sites (the annual average concentrations of PM2.5 for 2013, 2014, and 2015 were 103, 96, and 91 μg/m3, respectively) were higher than those around the urban background sites (the annual average concentrations of PM2.5 for 2013, 2014, and 2015 were 95, 86, and 83 μg/m3, respectively), due to road dust and emissions from vehicles. The standard deviations of PM2.5 concentrations during each month were high, indicating that PM2.5 pollution might suffer a significant volatility in a short period of time, as a result of Beijing’s peculiar geographical locations, meteorological conditions, and the emissions of pollutants.

3.2. LUR Model

3.2.1. Processing of Predictor Variables

We generated 25 variables in three categories and seven subcategories, to characterize the street network, land-use, and population density at different radii around each monitoring site (Table 3). The spatial analysis function of ArcGIS 10.2 was used to process these variables. Many buffer areas, which were different-sized circles centered on each monitoring site, were generated in ArcGIS 10.2 to analyze the street network, land-use, and population density around each monitoring site. The choice of the buffer sizes was based on the scales of the variables and some other studies (e.g., [41,54]).

3.2.2. Selection of Predictor Variables

SPSS 22.0 (International Business Machines Corporation, New York, NY, USA), a widely used software for statistical analysis in social science, was applied to analyze the correlation between PM2.5 concentrations and each independent variable. As shown in Table 4, out of the three types of predictor variables, the subcategories that are most relevant to the PM2.5 concentrations are as follows: RD1, WT4, VT2, TP2, OD3, OND3, and PD. According to the filtering criteria (no significant linear correlation among predictor variables, t-tests, and the contribution to R2 is not below 1%), six variables were finally determined for regression: RD1, WT4, VT2, TP2, OND3, and PD (Table 5). Except for OD1, all of the variables highly relevant to PM2.5 were used for the final regression in the LUR model.

3.2.3. Regression Result

SPSS 22.0 was used to regress PM2.5 concentrations and the six variables selected, based on the data collected around the seventeen air-quality monitoring sites within the study area. The regression result is shown below:
Y P M 2.5 = 0.477 + 0.798 R D 1 + 0.201 W T 4 1.394 V T 2 0.416 T P 2 + 0.960 O N D 1 0.263 P D
In Equation (2),   Y P M 2.5 is the annual average concentration of PM2.5 in 2015, R D 1 is the length of roads within a buffer of 3 km, W T 4 is the water within a buffer of 0.5 km, V T 2 is the vegetation within a buffer of 2 km, T P 2 is the transportation land within a buffer of 2 km, O N D 1 is the other non-developed land within a buffer of 3 km, and P D is the population density.
The determination coefficient (R2) in this study was 0.839. Jerrett et al. (2007) [55] applied the LUR to Toronto, Ontario, Canada, and developed a model with an R2 of 0.69. Ross et al. (2006) [45] tested the LUR model in Southern California and were able to predict 79% of the variation in NO2. In their review, Wu et al. (2016) [56] noted that the average R2 of an LUR model is 0.671. Compared to these previous studies, the predictor variables selected in this study were highly relevant to PM2.5 and fit the LUR model well.

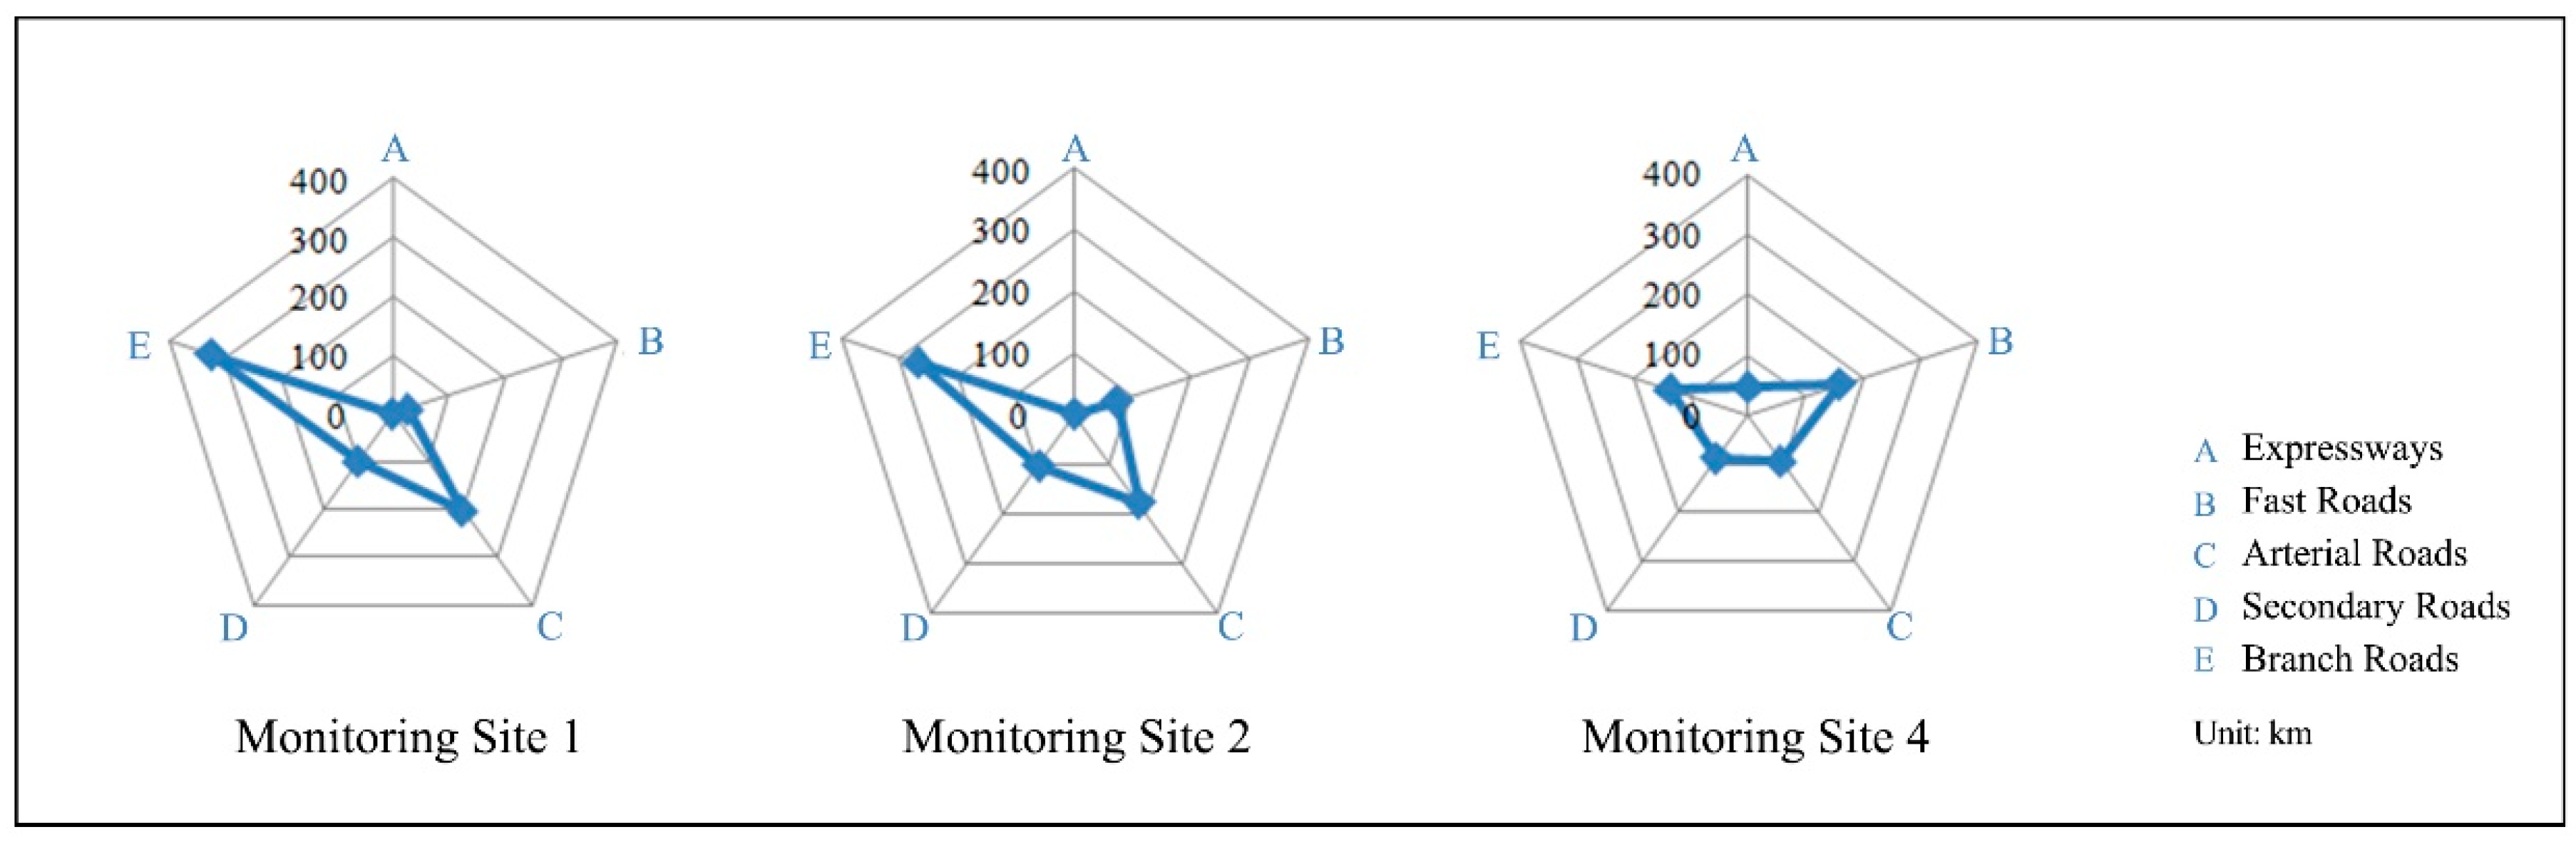
3.3. Influence of Road Patterns on PM2.5

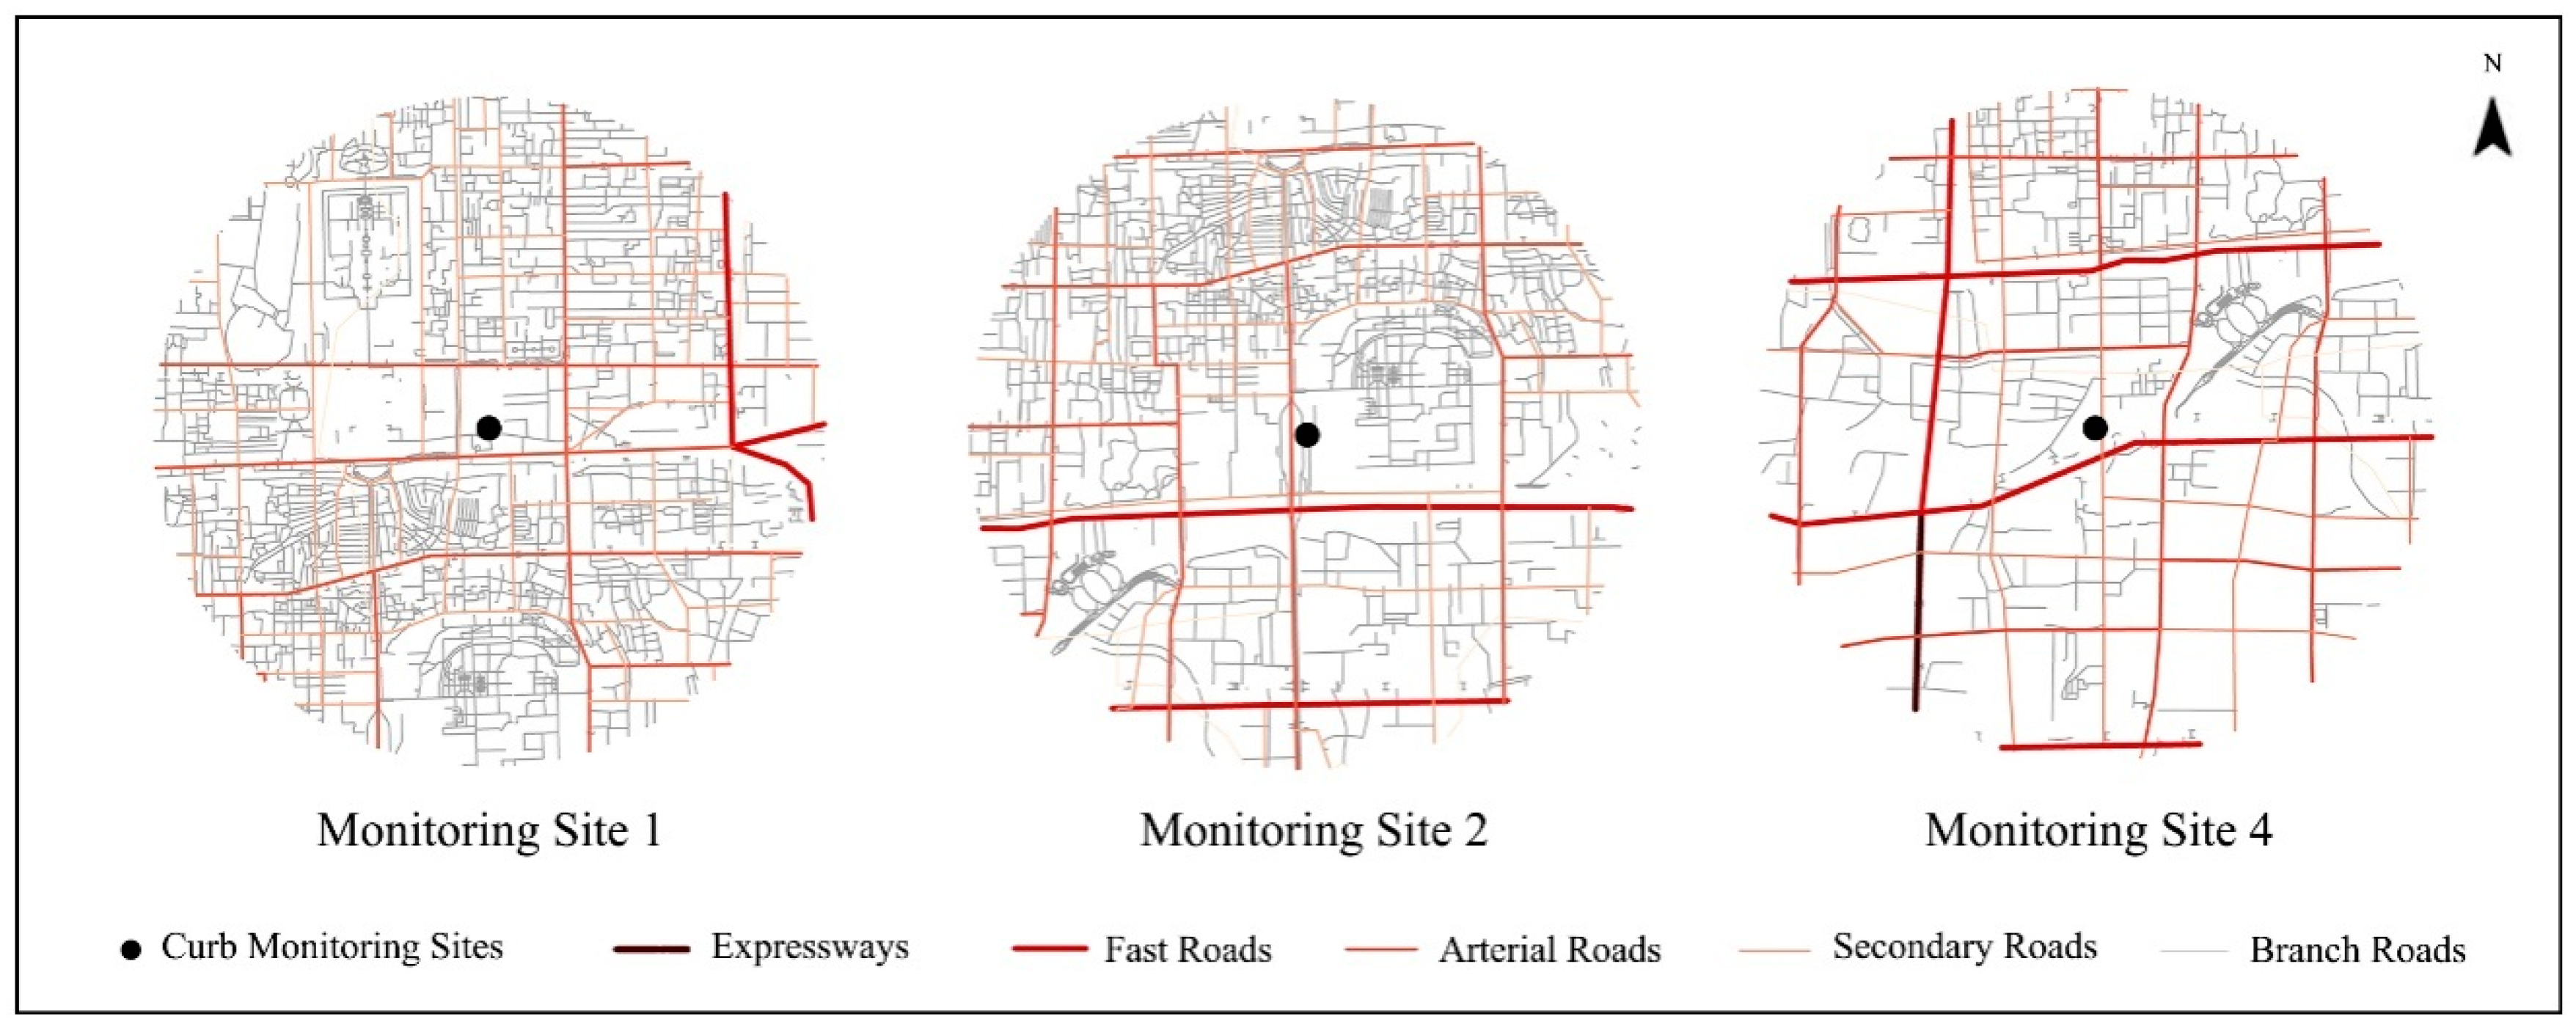
3.3.1. Analysis of the Land-Use around Traffic Pollution Monitoring Sites

Five curbside monitoring sites were set along main roads to assess the influence of traffic on the air pollution in Beijing, all of which were within the study area. Figure 6 and Figure 7 show the land-use within a buffer of 3 km around these five sites in 2015 (Table 4 shows that, only within a buffer of 3 km, is the PM2.5 concentration most correlated with road patterns. Therefore, the 3 km buffer radii was selected here, as well as in Figure 8 and Figure 9.).
From the two figures above, it can be seen that there are some similarities in the land-use pattern around the five curbside monitoring sites, such as similar grid layouts of the land-use divided by roads and similar land-use structures, with other developed land being the first, followed by vegetation, water, transportation land, and other non-developed land. When considering the percentage of vegetation, monitoring site 5 has a significantly higher percentage than the others, while monitoring site 3 has a significantly lower value than the others. As for the percentage of other non-developed land, monitoring site 5 has the lowest percentage, while monitoring site 3 has the highest value. From Equation (2), it can be seen that the three variables most relevant to PM2.5 concentrations are vegetation, other non-developed land, and road length. Based on the controlling variables method, monitoring sites with a similar land-use structure should be selected to analyze the influence of road patterns on PM2.5, because under this circumstance, the impact of land-use on PM2.5 concentrations can be ignored. Therefore, monitoring sites 3 and 5, whose proportions of vegetation and other non-developed land show large differences, were excluded, while sites 1, 2, and 4 were selected for the study. By comparing the road patterns and the PM2.5 distribution of the selected monitoring sites, the relationship between the two was determined.

3.3.2. Link between Road Patterns and PM2.5 Concentrations

(1) Comparison of road patterns around the curbside monitoring sites
Monitoring site 1 was located at the East Avenue of Qianmen, near Tian’anmen Square and East 2nd Ring Road. The surrounding street network shows a relatively uniform grid pattern, with arterial roads forming the skeletal structure of the road, while the branch and secondary roads weaved through them. The density of this road network reaches 23.3 km/km2. Monitoring site 2 lies along the Inner Avenue of Yongding Gate, near the Temple of Heaven and the North 2nd Ring Road. Branch roads and arterial roads are the major components of the street network near this site. Moreover, this network shows some differences between the southern and the northern areas: the road density in the south is lower than that in the north; fast roads and arterial roads constitute the skeleton of the network in the south, while arterial roads and secondary roads constitute the skeleton of the network in the north. The density of the whole road network around monitoring site 2 reaches 22.2 km/km2. Monitoring site 3 is located near the Southwest 3rd Ring Road and Jingkai Expressway. The surrounding street network shows a relatively uniform and low-density grid pattern, and the proportion of fast roads is higher than the other two monitoring sites. There are also some small differences between the south and the north, such as the arterial roads and branch roads, which are mainly concentrated in the north, and the expressway, which only appears in the south. The density of the entire road network around monitoring site 3 is 22.2 km/km2.
There are significant differences in the road network of the three monitoring sites (Figure 8 and Figure 9). When considering the road density, the following relationship can be seen: monitoring site 1 > monitoring site 2 > monitoring site 3. With regard to the road grade structure, both monitoring sites 1 and 2 are mainly dominated by branch roads and secondary roads, while monitoring site 4 features a relatively uniform network structure, with an expressway also running around it. As for the layout of the road network, the network near monitoring site 1 shows a relatively high-density grid pattern, with the main streets forming a fishbone shape, while the network near monitoring sites 2 and 4 shows a relatively low-density grid pattern, with the road in the north being denser than that in the south.
(2) Comparison of PM2.5 concentrations around traffic pollution monitoring stations
There are some differences in the distribution of PM2.5 around the three monitoring sites (Table 6). These differences among the concentrations look small, but they are quite important and meaningful, because even a small change in PM2.5 concentrations could indicate a big change in the total emission of PM2.5. Furthermore, some research has highlighted that slight variations in PM2.5 concentrations have a great influence on a human’s health. For example, the government of London released a report by Dr. Brian G Miller in 2010, which said that every 1 μg/m3 permanent increase in PM2.5 concentrations is associated with a mean reduction in life expectancy of three weeks [57]. When focusing on the annual mean and median of PM2.5 in 2015, the following pattern emerges: monitoring site 4 > monitoring site 1 > monitoring site 2. With regard to the amplitude of annual variation, the following relationship is recorded: monitoring site 1 ≈ monitoring site 4 > monitoring site 2. As for the upper and lower limits of the 95% confidence interval: monitoring site 4 > monitoring site 1 > monitoring site 2. The seasonal mean, except for the abnormally high level of monitoring site 2 in winter, the other seasons were almost aligned as: monitoring site 4 > monitoring site 1 > monitoring site 2. In summary, when considering the three monitoring sites, the PM2.5 concentration of site 4 was the highest, followed by site 1, and site 2 presented the lowest values. The fluctuations demonstrated at sites 4 and 1 were significantly higher than that of site 2.
(3) Link between road patterns and PM2.5
From Equation (2), it can be seen that the three variables which are apparently relevant to PM2.5 concentrations are vegetation, other non-developed land, and road length. According to the analysis in the Section 3.3.1 ”Analysis of the land-use around traffic pollution monitoring sites”, it is clear that the land-use structures of monitoring sites 1, 2, and 4 are similar. Therefore, we can conclude that the differences in PM2.5 concentrations between these three sites are mainly caused by the differences in road patterns, based on the controlling variables method. Under this circumstance, by comparing the road patterns and the PM2.5 distribution of the selected monitoring sites, the relationship between the two can be concluded.
First, both the grade of road and the road density influence PM2.5 concentrations. Under the same traffic carrying capacity, the high-grade road network, which has a low density, will be more likely to improve the concentration of PM2.5 than the low-grade road network, which has a high density. This means that the layout of “a tight network of streets and small blocks” is superior to the layout of “a sparse network of streets and big blocks”, from an environmental and sustainable point of view (by comparing monitoring sites 1, 2, and 4). The layout of “a tight network of streets and small blocks” originates from the city-plan idea of new urbanism, which is used to solve the problem of low-density road networks, serious block segmentation, high transportation energy consumption, traffic jams, etc., caused by the traditional mode of urban planning. With regard to PM2.5, this paper provides a more convincing evidence for the reasonability of the layout of “a tight network of streets and small blocks”.
Second, the grade system of urban roads impacts the rationality of the road patterns, and the high percentage of branch roads and secondary roads decreases PM2.5 concentrations (by comparing monitoring sites 1, 2, and 4). Without secondary roads, the connection between arterial roads and the place where traffic originates, will be insufficient. Without branch roads, secondary roads will bear the function of branch roads, which will make it more difficult for the secondary roads to maintain their own function, eventually leading to the disorganization of the entire road system. All of the above situations will result in the overlap of different speeds of traffic flows, and the overload of several accessible and convenient roads, which can hinder urban traffic evacuation. The percentage of low and middle grade roads in developed countries, such as America and Japan, could reach 80%, with the distribution proportion of roads from low-grade to high-grade being like a pyramid.
Third, keeping traffic nodes unimpeded will significantly reduce the concentration of PM2.5 (by comparing monitoring sites 1 and 2). Unimpeded traffic nodes not only improve the operating efficiency of the whole road network, but also reduce the obstruction to the wind field, which accelerates the diffusion of PM2.5. The planning of road directions should also take into consideration the local prevailing wind direction. The street canyons, which are parallel to the wind, could be helpful for the diffusion of air pollutants through the transport effect of wind. The air pollutants in the street canyons that are vertical to the direction of wind will diffuse less rapidly.

4. Conclusions and Discussion

With the fast development of motorized transport, the air pollution caused by traffic has been a major source of pollutants in modern cities. Much research has been performed on PM2.5, but the study of the correlation between road patterns and PM2.5 is a relatively new field. One major limitation of this study is the fact that there are only five curbside monitoring sites. The limited samples make it difficult to quantitatively research how the density, grade, and form of road network, affect PM2.5 concentrations. Under this circumstance, we chose a control variate method to perform our research, which inevitably results in some subjective errors. Another limitation is that this case study relates to the road patterns and PM2.5 in Beijing alone. Hence, more research on various types of cities should be undertaken, to enrich the findings and make them more universal. Despite these limitations, we believe that this research still offers an important insight ointo the relationship between road patterns and PM2.5. The main conclusions are as follows.
(1) Do road patterns significantly affect PM2.5 concentrations?
First, the LUR model developed in this paper can explain 83.9% of the variation in PM2.5 levels, which shows that the selected predictor variables are highly relevant to PM2.5, and that this model is a good fit for the Beijing. Second, from highly relevant to PM2.5, to weakly relevant to PM2.5, the variables are, vegetation, other non-developed land, road length, transportation land, population density, and water. Among these variables, the regression coefficient of road length is up to 0.798, which is significantly higher than water, population density, and transportation land, which shows that road patterns have an obvious effect on PM2.5 concentrations. Third, the regression coefficient of road patterns is positive, indicating that traffic improves the concentration of PM2.5, consistent with daily experiences. Fourthly, according to Table 4, we can conclude that the correlation between PM2.5 and road patterns increases with the increasing of a buffer zone.
(2) How do road patterns affect PM2.5 concentrations?
First, both the grade of road and the road density influence PM2.5 concentrations. Under the same traffic carrying capacity, the high-grade road network, that has a low density, will be more likely to improve PM2.5 concentrations than the low-grade road network, that has a high density. This means that the layout of “a tight network of streets and small blocks” is superior to the layout of “a sparse network of streets and big blocks”. Second, the grade proportion of urban roads impacts the rationality of the road patterns, and a high percentage of branch roads and secondary roads could decrease PM2.5 concentrations. Third, keeping traffic nodes unimpeded can significantly reduce PM2.5 concentrations.

Acknowledgments

This work was supported by the Sino-German Center (NSFC and DFG, Grant No. GZ1201).

Author Contributions

Fang Wang was in charge of this research. She contributed to data processing and drafting the manuscript; Yaoyao Peng contributed to data collection, data analysis, and paper revision; Chunyan Jiang contributed to data analysis and paper revision. All authors read and approved the final manuscript.

Conflicts of Interest

The authors declare no conflict of interest.

References

  1. Sun, Y.; Zhuang, G.; Wang, Y.; Han, L.; Guo, J.; Dan, M.; Zhang, W.J.; Wang, Z.F.; Hao, Z.P. The air-borne particulate pollution in Beijing—Concentration, composition, distribution and sources. Atmos. Environ. 2004, 38, 5991–6004. [Google Scholar] [CrossRef]
  2. Xu, H.; Bi, X.H.; Zheng, W.W.; Wu, J.H.; Feng, Y.C. Particulate matter mass and chemical component concentrations over four Chinese cities along the western Pacific coast. Environ. Sci. Pollut. Res. 2015, 22, 1940–1953. [Google Scholar] [CrossRef] [PubMed]
  3. Li, S.; Zhu, L.; Shi, T.M.; Wang, W. The counter measures of urban street planning based on the pollution prevention of inhalant particle. Urban Dev. Stud. 2014, 21, 42–45. (In Chinese) [Google Scholar]
  4. Weng, Q.H.; Yang, S.H. Urban air pollution patterns, land use, and thermal landscape: An examination of the linkage using GIS. Environ. Monit. Assess. 2006, 117, 463–489. [Google Scholar] [CrossRef] [PubMed]
  5. Schweitzer, L.; Zhou, J. Neighborhood air quality, respiratory health, and vulnerable populations in compact and sprawled regions. J. Am. Plan. Assoc. 2010, 76, 363–371. [Google Scholar] [CrossRef]
  6. Li, X.Y.; Zhao, S.T.; Li, Y.M.; Guo, J.; Li, W. Subduction effect of urban arteries green space on atmospheric concentration of PM2.5 in Beijing. Ecol. Environ. Sci. 2014, 23, 615–621. (In Chinese) [Google Scholar]
  7. Levy, J.I.; Bennett, D.H.; Melly, S.J.; Spengler, J.D. Influence of road patterns on particulate matter and polycyclic aromatic hydrocarbon concentrations in Roxbury, Massachusetts. J. Expo. Sci. Environ. Epidemiol. 2003, 13, 364–371. [Google Scholar] [CrossRef] [PubMed]
  8. Chan, L.Y.; Kwok, W.S.; Lee, S.C.; Chan, C.Y. Spatial variation of mass concentration of roadside suspended particulate matter in metropolitan Hong Kong. Atmos. Environ. 2001, 35, 3167–3176. [Google Scholar] [CrossRef]
  9. Li, X.Y.; Li, Y.M.; Zhao, S.T.; Guo, J. Influence of urban green spaces on the concentration of PM2.5. In Beijing Botanical Garden Afforestation and Livable City Construction, Proceedings of the Beijing Institute of Landscape architecture Academic Forum 2012, Beijing, China, 22–23 November 2012; pp. 17–20. (In Chinese)
  10. Chow, J.C.; Watson, J.G.; Frazier, C.A.; Egami, R.T.; Goodrich, A.; Ralph, C. Spatial and temporal source contributions to PM10 and PM2.5 in Reno, NV. In PM-10: Implementation of Standards: Transactions, Proceedings of the APCA/EPA International Speciality Conference, San Francisco, CA, USA, 22–26 February 1988; Mathal, C.V., Stonefield, D.H., Eds.; APCA: Pittsburgh, PA, USA, 1988; pp. 439–457. [Google Scholar]
  11. Japar, S.M. Motor vehicles and particle air pollution: An overview. In Particulate Matter: Health and Regulatory Issues VIP-49, Proceedings of the Air and Waste Management Association International Specialty Conference, Pittsburgh, PA, USA, 8–12 November 1993; pp. 577–598.
  12. Gertler, A.W.; Gillies, J.A.; Pierson, W.R. An assessment of the mobile source contribution to PM10 and PM2.5 in the United States. Water Air Soil Pollut. 2000, 123, 203–214. [Google Scholar] [CrossRef]
  13. Wang, J.S.; Chan, T.L.; Ning, Z.; Leung, C.W.; Cheung, C.S.; Hung, W.T. Roadside measurement and prediction of CO and PM2.5 dispersion from on-road vehicles in Hong Kong. Transp. Res. D Transp. Environ. 2006, 11, 242–249. [Google Scholar] [CrossRef]
  14. Myung, C.L.; Park, S. Exhaust nanoparticle emissions from internal combustion engines: A review. Int. J. Automot. Technol. 2012, 13, 9–22. [Google Scholar] [CrossRef]
  15. Zheng, X.; Wu, Y.; Jiang, J.K.; Zhang, S.J.; Liu, H.; Song, S.J.; Li, Z.H.; Fan, X.X.; Fu, L.X.; Hao, J.M. Characteristics of on-road diesel vehicles: Black carbon emissions in Chinese Cities based on portable emissions measurement. Environ. Sci. Technol. 2015, 49, 13492–13500. [Google Scholar] [CrossRef] [PubMed]
  16. Lau, C.F.; Rakowska, A.; Townsend, T.; Brimblecombe, P.; Chan, T.L.; Yam, Y.S.; Mocnik, C.; Ning, Z. Evaluation of diesel fleet emissions and control policies from plume chasing measurements of on-road vehicles. Atmos. Environ. 2015, 122, 171–182. [Google Scholar] [CrossRef]
  17. Ministry of Environmental Protection of the People’s Republic of China. China Vehicle Emission Control Annual Report 2016; Ministry of Environmental Protection of the People’s Republic of China: Beijing, China, 2016.
  18. Choi, K.; Kim, J.; Ko, A.; Myung, C.L.; Park, S.; Lee, J. Size-resolved engine exhaust aerosol characteristics in a metal foam particulate filter for GDI light-duty vehicle. J. Aerosol Sci. 2013, 57, 1–13. [Google Scholar] [CrossRef]
  19. Gillies, J.A.; Gertler, A.W.; Sagebiel, J.C.; Dippel, N.W. On-road particulate matter (PM2.5 and PM10) emissions in the Sepulveda Tunnel, Los Angeles, California. Environ. Sci. Technol. 2001, 35, 1054–1063. [Google Scholar] [CrossRef] [PubMed]
  20. Aldabe, J.; Elustondo, D.; Santamaría, C.; Lasheras, E.; Pandolfi, M.; Alastuey, A.; Querol, X.; Santamaria, J.M. Chemical characterisation and source apportionment of PM2.5 and PM10 at rural, urban and traffic sites in Navarra (North of Spain). Atmos. Res. 2011, 102, 191–205. [Google Scholar] [CrossRef]
  21. Perugu, H.; Wei, H.; Yao, Z. Integrated data-driven modeling to estimate PM2.5 pollution from heavy-duty truck transportation activity over metropolitan area. Transp. Res. D Transp. Environ. 2016, 46, 114–127. [Google Scholar] [CrossRef]
  22. Buckeridge, D.L.; Glazier, R.; Harvey, B.J.; Escobar, M.; Amrhein, C.; Frank, J. Effect of motor vehicle emissions on respiratory health in an urban area. Environ. Health Perspect. 2002, 110, 293–300. [Google Scholar] [CrossRef] [PubMed]
  23. Fann, N.; Lamson, A.D.; Anenberg, S.C.; Wesson, K.; Risley, D.; Hubbell, B.J. Estimating the national public health burden associated with exposure to ambient PM2.5 and ozone. Risk Anal. 2012, 32, 81–95. [Google Scholar] [CrossRef] [PubMed]
  24. Ying, Z.; Xu, X.; Bai, Y.; Zhong, J.; Chen, M.; Liang, Y.; Zhao, J.; Liu, D.; Morishita, M.; Sun, O.; et al. Long-term exposure to concentrated ambient PM2.5 increases mouse blood pressure through abnormal activation of the sympathetic nervous system: A role for hypothalamic inflammation. Environ. Health Perspect. 2014, 122, 79–86. [Google Scholar] [CrossRef] [PubMed]
  25. Panis, L.I.; Beckx, C.; Broekx, S.; De Vlieger, I.; Schrooten, L.; Degraeuwe, B.; Pelkmans, L. PM, NOx and CO2 emission reductions from speed management policies in Europe. Transp. Policy 2011, 18, 32–37. [Google Scholar] [CrossRef]
  26. Xu, B.; Yu, X.; Gu, H.; Miao, B.; Wang, M.; Huang, H. Commuters’ exposure to PM2.5 and CO2 in metro carriages of Shanghai metro system. Transp. Res. D Transp. Environ. 2016, 47, 162–170. [Google Scholar] [CrossRef]
  27. Maddison, D.; Mourato, S. Valuing different road options for Stonehenge. Conserv. Manag. Archaeol. Sites 2001, 4, 203–212. [Google Scholar] [CrossRef]
  28. Xie, X.M.; Huang, Z.; Wang, J.S. The impact of urban street layout on local atmospheric environment. Build. Environ. 2006, 41, 1352–1363. [Google Scholar]
  29. Brook, J.R.; Dann, T.F.; Burnett, R.T. The relationship among TSP, PM10, PM2.5, and inorganic constituents of atmospheric participate matter at multiple Canadian locations. J. Air Waste Manag. Assoc. 1997, 47, 2–19. [Google Scholar] [CrossRef]
  30. Lee, S.J.; Serre, M.L.; van Donkelaar, A.; Martin, R.V.; Burnett, R.T.; Jerrett, M. Comparison of geostatistical interpolation and remote sensing techniques for estimating long-term exposure to ambient PM2.5 concentrations across the continental United States. Environ. Health Perspect. 2012, 120, 1727–1732. [Google Scholar] [CrossRef] [PubMed]
  31. Hankey, S.; Marshall, J.D. Land use regression models of on-road particulate air pollution (particle number, black carbon, PM2.5, particle size) using mobile monitoring. Environ. Sci. Technol. 2015, 49, 9194–9202. [Google Scholar] [CrossRef] [PubMed]
  32. Chang, S.Y.; Vizuete, W.; Valencia, A.; Naess, B.; Isakov, V.; Palma, T.; Breen, M.; Arunachalam, S. A modeling framework for characterizing near-road air pollutant concentration at community scales. Sci. Total Environ. 2015, 538, 905–921. [Google Scholar] [CrossRef] [PubMed]
  33. Beckerman, B.S.; Jerrett, M.; Serre, M.; Martin, R.V.; Lee, S.J.; van Donkelaar, A.; Ross, Z.; Su, J.; Burnett, R. A hybrid approach to estimating national scale spatiotemporal variability of PM2.5 in the contiguous United States. Environ. Sci. Technol. 2013, 47, 7233–7241. [Google Scholar]
  34. De Hoogh, K.; Korek, M.; Vienneau, D.; Keuken, M.; Kukkonen, J.; Nieuwenhuijsen, M.J.; Pradas, M.C. Comparing land use regression and dispersion modelling to assess residential exposure to ambient air pollution for epidemiological studies. Environ. Int. 2014, 73, 382–392. [Google Scholar] [CrossRef] [PubMed]
  35. Hoek, G.; Beelen, R.; De Hoogh, K.; Vienneau, D.; Gulliver, J.; Fischer, P.; Briggs, D. A review of land-use regression models to assess spatial variation of outdoor air pollution. Atmos. Environ. 2008, 42, 7561–7578. [Google Scholar] [CrossRef]
  36. Lee, J.H.; Wu, C.F.; Hoek, G.; de Hoogh, K.; Beelen, R.; Brunekreef, B.; Chan, C.C. LUR models for particulate matters in the Taipei metropolis with high densities of roads and strong activities of industry, commerce and construction. Sci. Total Environ. 2015, 514, 178–184. [Google Scholar] [CrossRef] [PubMed]
  37. Henderson, S.B.; Beckerman, B.; Jerrett, M.; Brauer, M. Application of land use regression to estimate long-term concentrations of traffic-related nitrogen oxides and fine particulate matter. Environ. Sci. Technol. 2007, 41, 2422–2428. [Google Scholar] [CrossRef] [PubMed]
  38. Sahsuvaroglu, T.; Arain, A.; Kanaroglou, P.; Finkelstein, N.; Newbold, B.; Jerrett, M.; Beckerman, B.; Brook, J.; Finkelstein, M.; Gilbert, N.L. A land use regression model for predicting ambient concentrations of nitrogen dioxide in Hamilton, Ontario, Canada. J. Air Waste Manag. Assoc. 2006, 56, 1059–1069. [Google Scholar] [CrossRef] [PubMed]
  39. Thomas, D.; Stram, D.; Dwyer, J. Exposure measurement error: Influence on exposure-disease relationships and methods of correction. Annu. Rev. Public Health 1993, 14, 69–93. [Google Scholar] [CrossRef] [PubMed]
  40. Briggs, D.J.; Collins, S.; Elliott, P.; Fischer, P.; Kingham, S.; Lebret, E.; Pryl, K.; van Reeuwijk, H.; Smallbone, K.; van der Veen, A. Mapping urban air pollution using GIS: A regression-based approach. Int. J. Geogr. Inf. Sci. 1997, 11, 699–718. [Google Scholar] [CrossRef]
  41. Ross, Z.; Jerrett, M.; Ito, K.; Tempalski, B.; Thurston, G.D. A land use regression for predicting fine particulate matter concentrations in the New York City region. Atmos. Environ. 2007, 41, 2255–2269. [Google Scholar] [CrossRef]
  42. Lebret, E.; Briggs, D.; Van Reeuwijk, H.; Fischer, P.; Smallbone, K.; Harssema, H.; Kriz, B.; Gorynski, P.; Elliott, P. Small area variations in ambient NO2 concentrations in four European areas. Atmos. Environ. 2000, 34, 177–185. [Google Scholar] [CrossRef]
  43. Brauer, M.; Hoek, G.; van Vliet, P.; Meliefste, K.; Fischer, P.; Smallbone, K.; Harssema, H.; Kriz, B.; Gorynski, P.; Elliott, P. Estimating long-term average particulate air pollution concentrations: Application of traffic indicators and geographic information systems. Epidemiology 2003, 14, 228–239. [Google Scholar] [CrossRef] [PubMed]
  44. Gilbert, N.L.; Goldberg, M.S.; Beckerman, B.; Brook, J.R.; Jerrett, M. Assessing spatial variability of ambient nitrogen dioxide in Montreal, Canada, with a land-use regression model. J. Air Waste Manag. Assoc. 2005, 55, 1059–1063. [Google Scholar] [CrossRef] [PubMed]
  45. Ross, Z.; English, P.B.; Scalf, R.; Gunier, R.; Smorodinsky, S.; Wall, S.; Jerrett, M. Nitrogen dioxide prediction in Southern California using land use regression modeling: Potential for environmental health analyses. J. Expo. Sci. Environ. Epidemiol. 2006, 16, 106–114. [Google Scholar] [CrossRef] [PubMed]
  46. Beelen, R.; Hoek, G.; Vienneau, D.; Eeftens, M.; Dimakopoulou, K.; Pedeli, X.; Eriksen, K.T. Development of NO2 and NOx land use regression models for estimating air pollution exposure in 36 study areas in Europe—The ESCAPE project. Atmos. Environ. 2013, 72, 10–23. [Google Scholar] [CrossRef]
  47. Wheeler, A.J.; Smith-Doiron, M.; Xu, X.; Gilbert, N.L.; Brook, J.R. Intra-urban variability of air pollution in Windsor, Ontario—Measurement and modeling for human exposure assessment. Environ. Res. 2008, 106, 7–16. [Google Scholar] [CrossRef] [PubMed]
  48. Lee, J.H.; Wu, C.F.; Hoek, G.; de Hoogh, K.; Beelen, R.; Brunekreef, B.; Chan, C.C. Land use regression models for estimating individual NOx and NO2 exposures in a metropolis with a high density of traffic roads and population. Sci. Total Environ. 2014, 472, 1163–1171. [Google Scholar] [CrossRef] [PubMed]
  49. The people’s Government of Beijing City. Master Planning of Beijing (2004–2020); Beijing City Planning & Construction Review: Beijing, China, 2005; pp. 5–51.
  50. Beijing Institute of Surveying and Mapping. Beijing Traffic Tourism Map; Sinomap Press: Beijing, China, 2015. [Google Scholar]
  51. Wu, J.S.; Liao, X.; Peng, J.; Huang, X.L. Simulation and Influencing Factors of Spatial Distribution of PM2.5 Concentrations in Chongqing. Environ. Sci. 2015, 36, 759–767. (In Chinese) [Google Scholar]
  52. Beijing Statistical Bureau. Beijing Statistical Yearbook; China Statistics Press: Beijing, China, 2015; p. 65.
  53. Wang, Y.S.; Yao, L.; Wang, L.L.; Liu, Z.R.; Ji, D.S.; Tang, G.Q.; Zhang, J.K.; Sun, Y.; Hu, B.; Xin, J.Y. Mechanism for the formation of the January 2013 heavy haze pollution episode over central and eastern China. Sci. China Earth Sci. 2014, 44, 15–26. (In Chinese) [Google Scholar] [CrossRef]
  54. Wang, M.; Beelen, R.; Bellander, T.; Birk, M.; Cesaroni, G.; Cirach, M.; Cyrys, J.; de Hoogh, K.; Declercq, C.; Dimakopoulou, K.; et al. Performance of multi-city land use regression models for nitrogen dioxide and fine particles. Environ. Health Perspect. 2014, 122, 843–849. [Google Scholar] [CrossRef] [PubMed] [Green Version]
  55. Jerrett, M.; Arain, M.A.; Kanaroglou, P.; Beckerman, B.; Crouse, D.; Gilbert, N.L.; Brook, J.R.; Finkelstein, N.; Finkelstein, M.M. Modeling the intraurban variability of ambient traffic pollution in Toronto, Canada. J. Toxicol. Environ. Health A 2007, 70, 200–212. [Google Scholar] [CrossRef] [PubMed]
  56. Wu, J.S.; Xie, W.D.; Li, J.C. Application of Land-use Regression Models in Spatial-temporal Differentiation of Air Pollution. Environ. Sci. 2016, 37, 413–419. (In Chinese) [Google Scholar]
  57. Miller, B. Report on Estimation of Mortality Impacts of Particulate Air Pollution in London. Consulting Report P951-001. 2010. Available online: http://www.aef.org.uk/uploads/IomReport_1.pdf (accessed on 6 February 2017).
Figure 1. The distribution of air-quality monitoring sites in Beijing (Source: by Authors).
Sustainability 09 00217 g001
Figure 2. The road network of the study area (2015). The branch roads were removed from display as they were dense (Source: Basic data from Beijing Municipal Institute of City Planning & Design and Google Earth, modified by authors).
Sustainability 09 00217 g002
Figure 3. The land-use map of the study area (2015) (Source: Basic data from Beijing Municipal Institute of City Planning & Design and Google Earth, modified by authors).
Sustainability 09 00217 g003
Figure 4. Monthly mean concentrations of PM2.5 in the study area (2013–2015). The latest China National Ambient Air Quality Standards for PM2.5 are: I. Excellent, 0–35 μg/m3; II. Good, 35–75 μg/m3; III. Slight pollution, 75–115 μg/m3; IV. Moderate pollution, 115–150 μg/m3; V. Heavy pollution, 150–250 μg/m3; VI. Extremely heavy pollution, above 250 μg/m3 (Source: by Authors).
Sustainability 09 00217 g004
Figure 5. Monthly mean concentrations of PM2.5 around two types of monitoring sites (Notes: Because we only can collect the monthly mean data of PM2.5 concentrations in 2013, so the standard deviations of PM2.5 concentrations in 2013 are missed in Figure 5.) (Source: by Authors).
Sustainability 09 00217 g005
Figure 6. Land-use layout around the curbside monitoring sites in 2015 (Source: Basic data from Beijing Municipal Institute of City Planning & Design and Google Earth, modified by authors).
Sustainability 09 00217 g006
Figure 7. Land-use structure around the curbside monitoring sites in 2015 (Source: by Authors).
Sustainability 09 00217 g007
Figure 8. Road network layout around curbside monitoring sites in 2015 (Source: Basic data from Beijing Municipal Institute of City Planning & Design and Google Earth, modified by authors).
Sustainability 09 00217 g008
Figure 9. Road network structure around the curbside monitoring sites in 2015 (Source: by Authors).
Sustainability 09 00217 g009
Table 1. Land-use classification.
Land TypeDetails
WaterRivers, lakes, reservoirs, channels, ponds, wetlands, etc.
VegetationUrban green land, cultivated and woody land (dry lands, orchards, shrub lands, artificial grasslands, paddy fields, forest lands, irrigated lands, etc.).
Transportation landTransportation hub lands (railway stations, highway bus stations, port passenger terminals, public transport hubs, etc.), parking lots, traffic squares, etc.
Other developed landResidential lands, commercial lands, industrial lands, villages, lands for mining, scenic spots, etc.
Other non-developed landSwamps, bare lands, other grasses, etc.
Table 2. Population data of the study area.
AreaLand Area (km2)Population (Million)Population Density (No. of Persons/km2)
Dongcheng District41.8691.121,763
Xicheng District50.53130.225,767
Chaoyang District455.08392.28618
Fengtai District305.80230.07521
Shijingshan District84.3265.07709
Haidian District430.73367.88539
Total16,410.542151.61311
Source: Beijing Statistical Yearbook 2015 [52].
Table 3. Classification, description, and processing methods used to generate variables in each category.
Category
(N Variables)
DescriptionSubcategoriesBuffer Radii (km)Processing
Road length
(4)
Total length (in km) of 5 road typesRD * (expressways, fast roads, arterial roads, secondary roads, branch roads)0.5, 1, 2, 31. The road networks in different buffer sizes are processed by the Clip tool in ArcGIS.
2. The property sheets exported are used to analyze road lengths.
Land-use
(20)
Total area (in km2) of 5 land-use typesWT (Water),
VT (vegetation),
TP (transportation land),
OD (other developed land),
OND (other non-developed land)
0.5, 1, 2, 31. The land in different buffer sizes are processed by the Clip tool in ArcGIS.
2. The property sheets exported are used to analyze the area of land.
Population density
(1)
Density (in persons/km2)PD (persons)-Population density of the district where each monitoring site was located has been used
* When regressing the LUR model, we found that not dividing roads into several subcategories worked better. Therefore, the road length variable here is not divided anymore.
Table 4. Bivariate correlation analysis.
NumberSymbolVariablePearson Correlation Coefficient (between Variables and PM2.5)Pearson Correlation Coefficient (between the Most Relevant Subcategory and Others)
1RD1Road length 3 km0.506-
2RD2Road length 2 km0.3730.823
3RD3Road length 1 km0.3540.727
4RD4Road length 0.5 km0.2080.442
5WT1Water 3 km−0.1210.600
6WT2Water 2 km−0.1320.707
7WT3Water 1 km−0.1080.979
8WT4Water 0.5 km−0.161-
9VT1Vegetation 3 km−0.6790.948
10VT2Vegetation 2 km−0.716-
11VT3Vegetation 1 km−0.7010.967
12VT4Vegetation 0.5 km−0.6140.829
13TP1Transportation land 3 km−0.2500.521
14TP2Transportation land 2 km−0.353-
15TP3Transportation land 1 km−0.1990.882
16TP4Transportation land 0.5 km−0.0550.411
17OD1Other developed land 3 km0.524-
18OD2Other developed land 2 km0.5180.920
19OD3Other developed land 1 km0.4520.644
20OD4Other developed land 0.5 km0.3830.306
21OND1Other non-developed land 3 km−0.569-
22OND2Other non-developed land 2 km0.318−0.029
23OND3Other non-developed land 1 km0.099−0.047
24OND4Other non-developed land 0.5 km−0.130−0.063
25PDPopulation density0.094-
Note: Blue words are the subcategories that are most relevant to PM2.5 concentrations.
Table 5. Variables selected for final regression.
Independent VariableSymbol
Road length 3 kmRD1
Water 0.5 kmWT4
Vegetation 2 kmVT2
Transportation land 2 kmTP2
Other non-developed land 3 kmOND1
Population densityPD
Table 6. Comparison of PM2.5 concentrations.
Monitoring SiteAnnual Variation in 2015Seasonal Mean (μg/m3)
Mean (μg/m3)Median (μg/m3)Bound of 95% Confidence IntervalStandard DeviationWinterSpringSummerAutumn
No. 192.966.583.2101.185.1101.089.460.589.5
No. 289.965.081.398.481.3104.479.757.288.9
No. 496.171.587.3105.084.5108.886.762.693.2

