
Impacts of Natural Disasters on Swedish Electric Power Policy: A Case Study


Abstract
:1. Introduction
2. The Gudrun Storm of 2005 and Its Aftermath
- Interruption is due to the negligence of the electricity user.
- The electricity is interrupted because of electrical safety reasons or to preserve supply security and reliability.
- Interruption is due to a barrier outside the network owner’s control.
- Interruption is attributable to the fault in the grid.
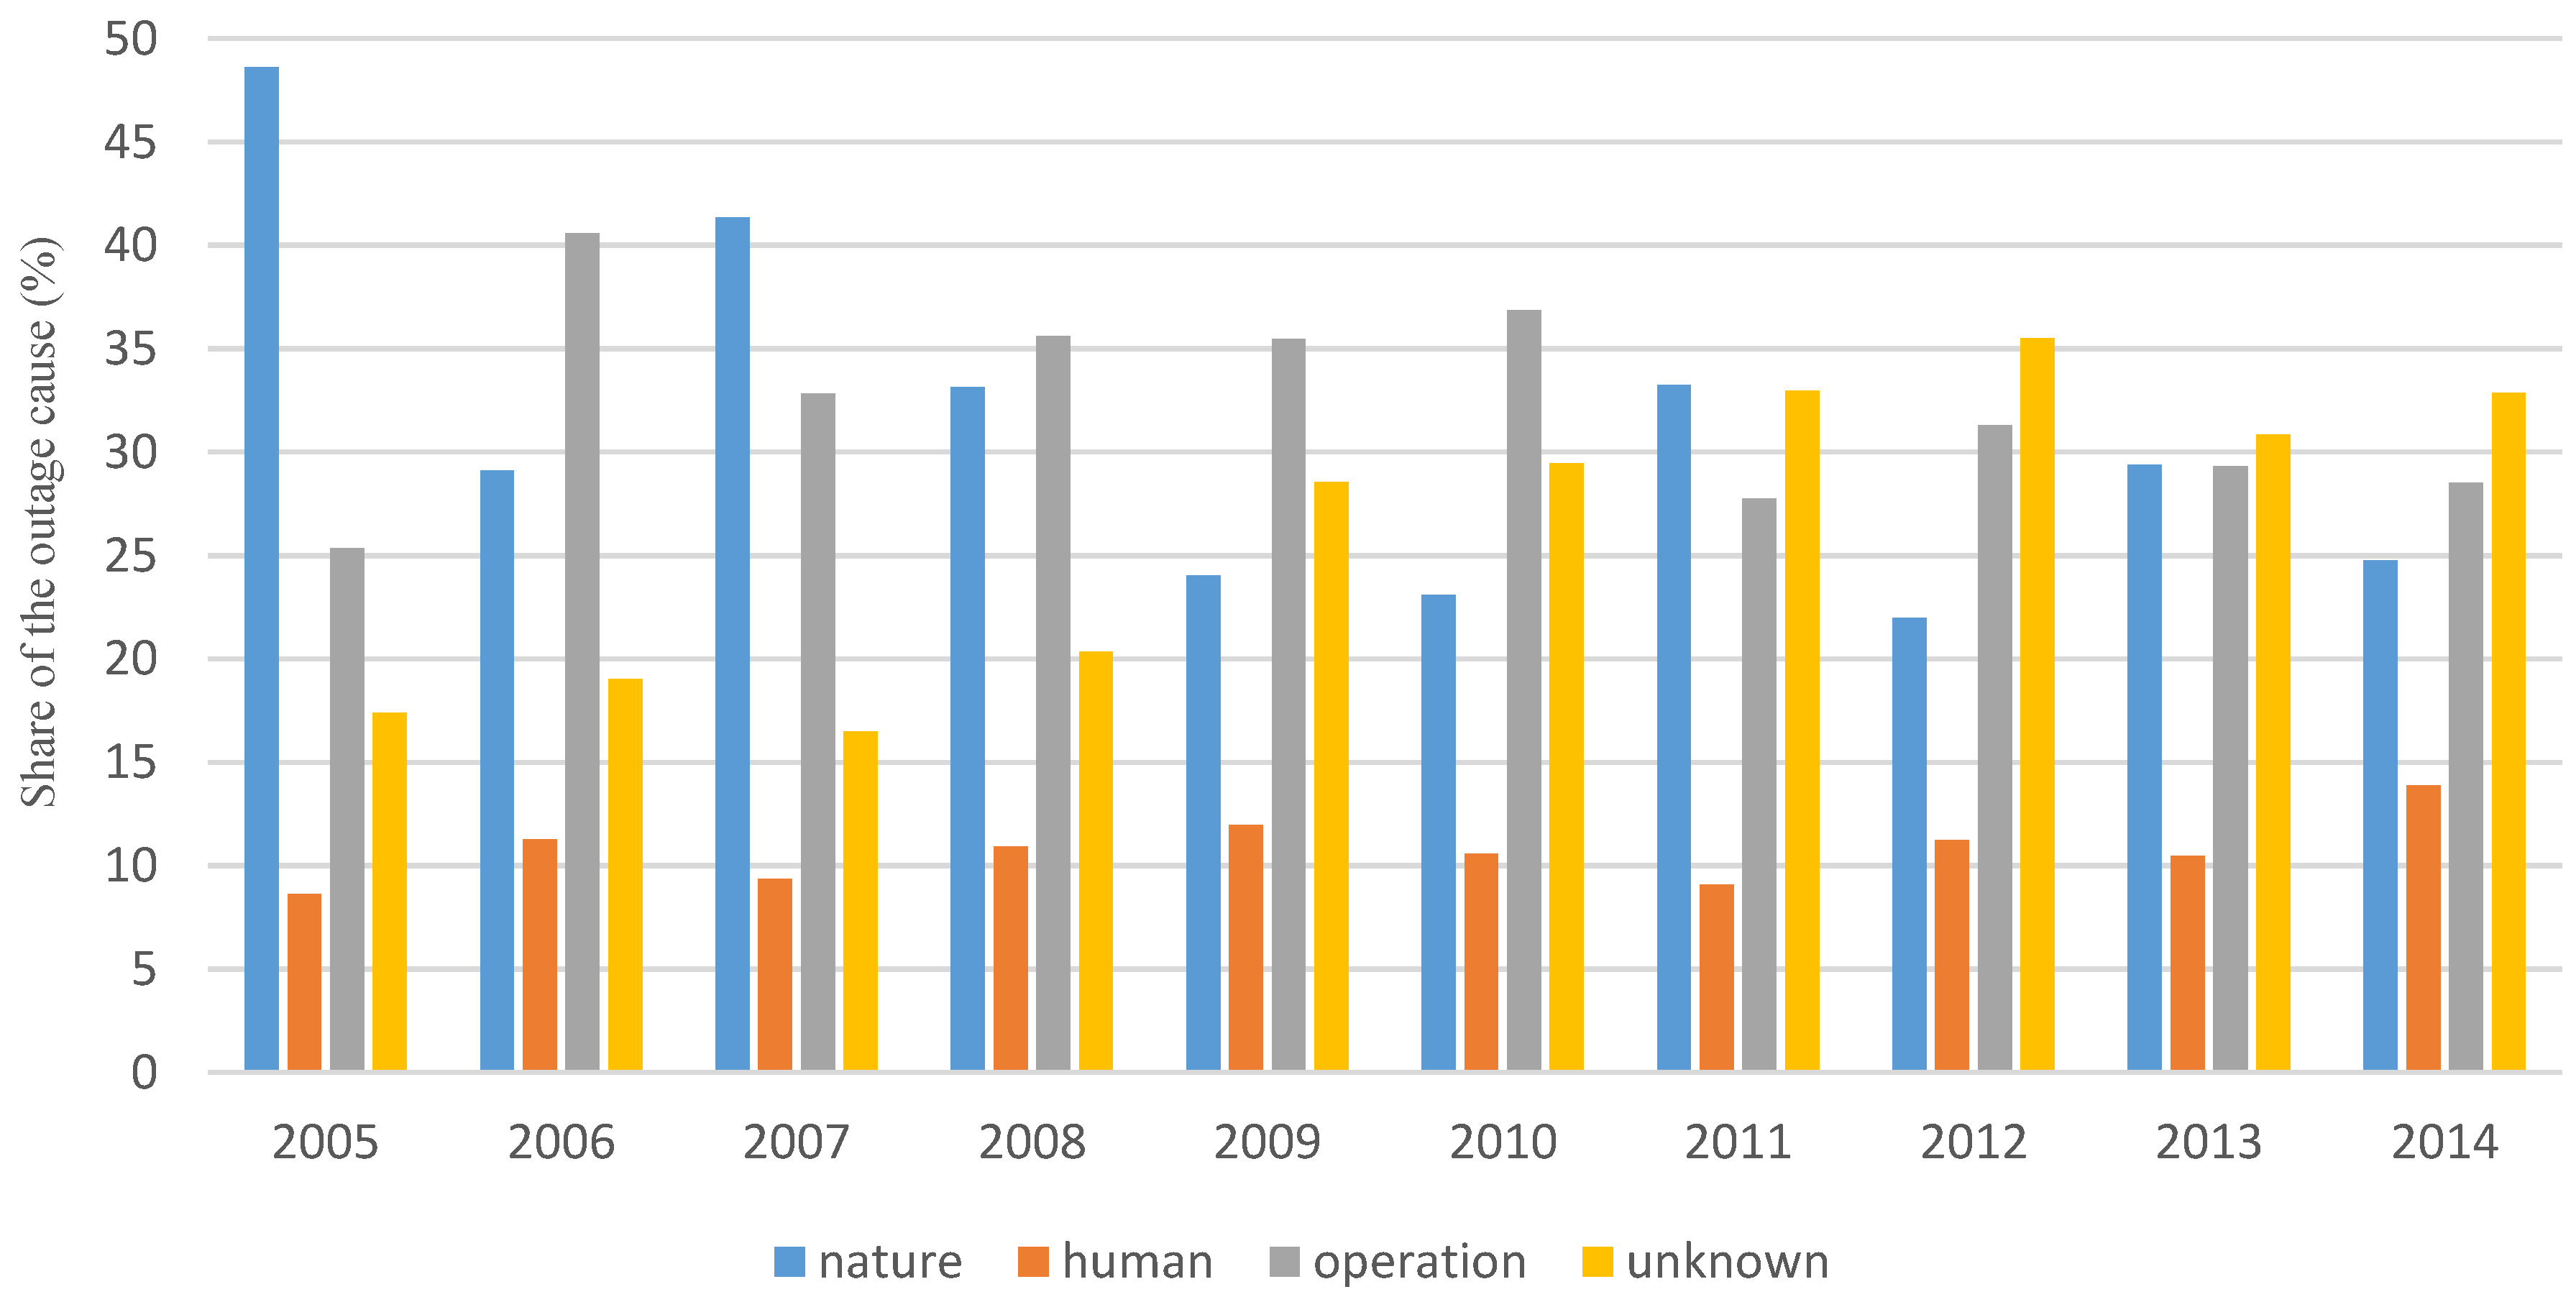
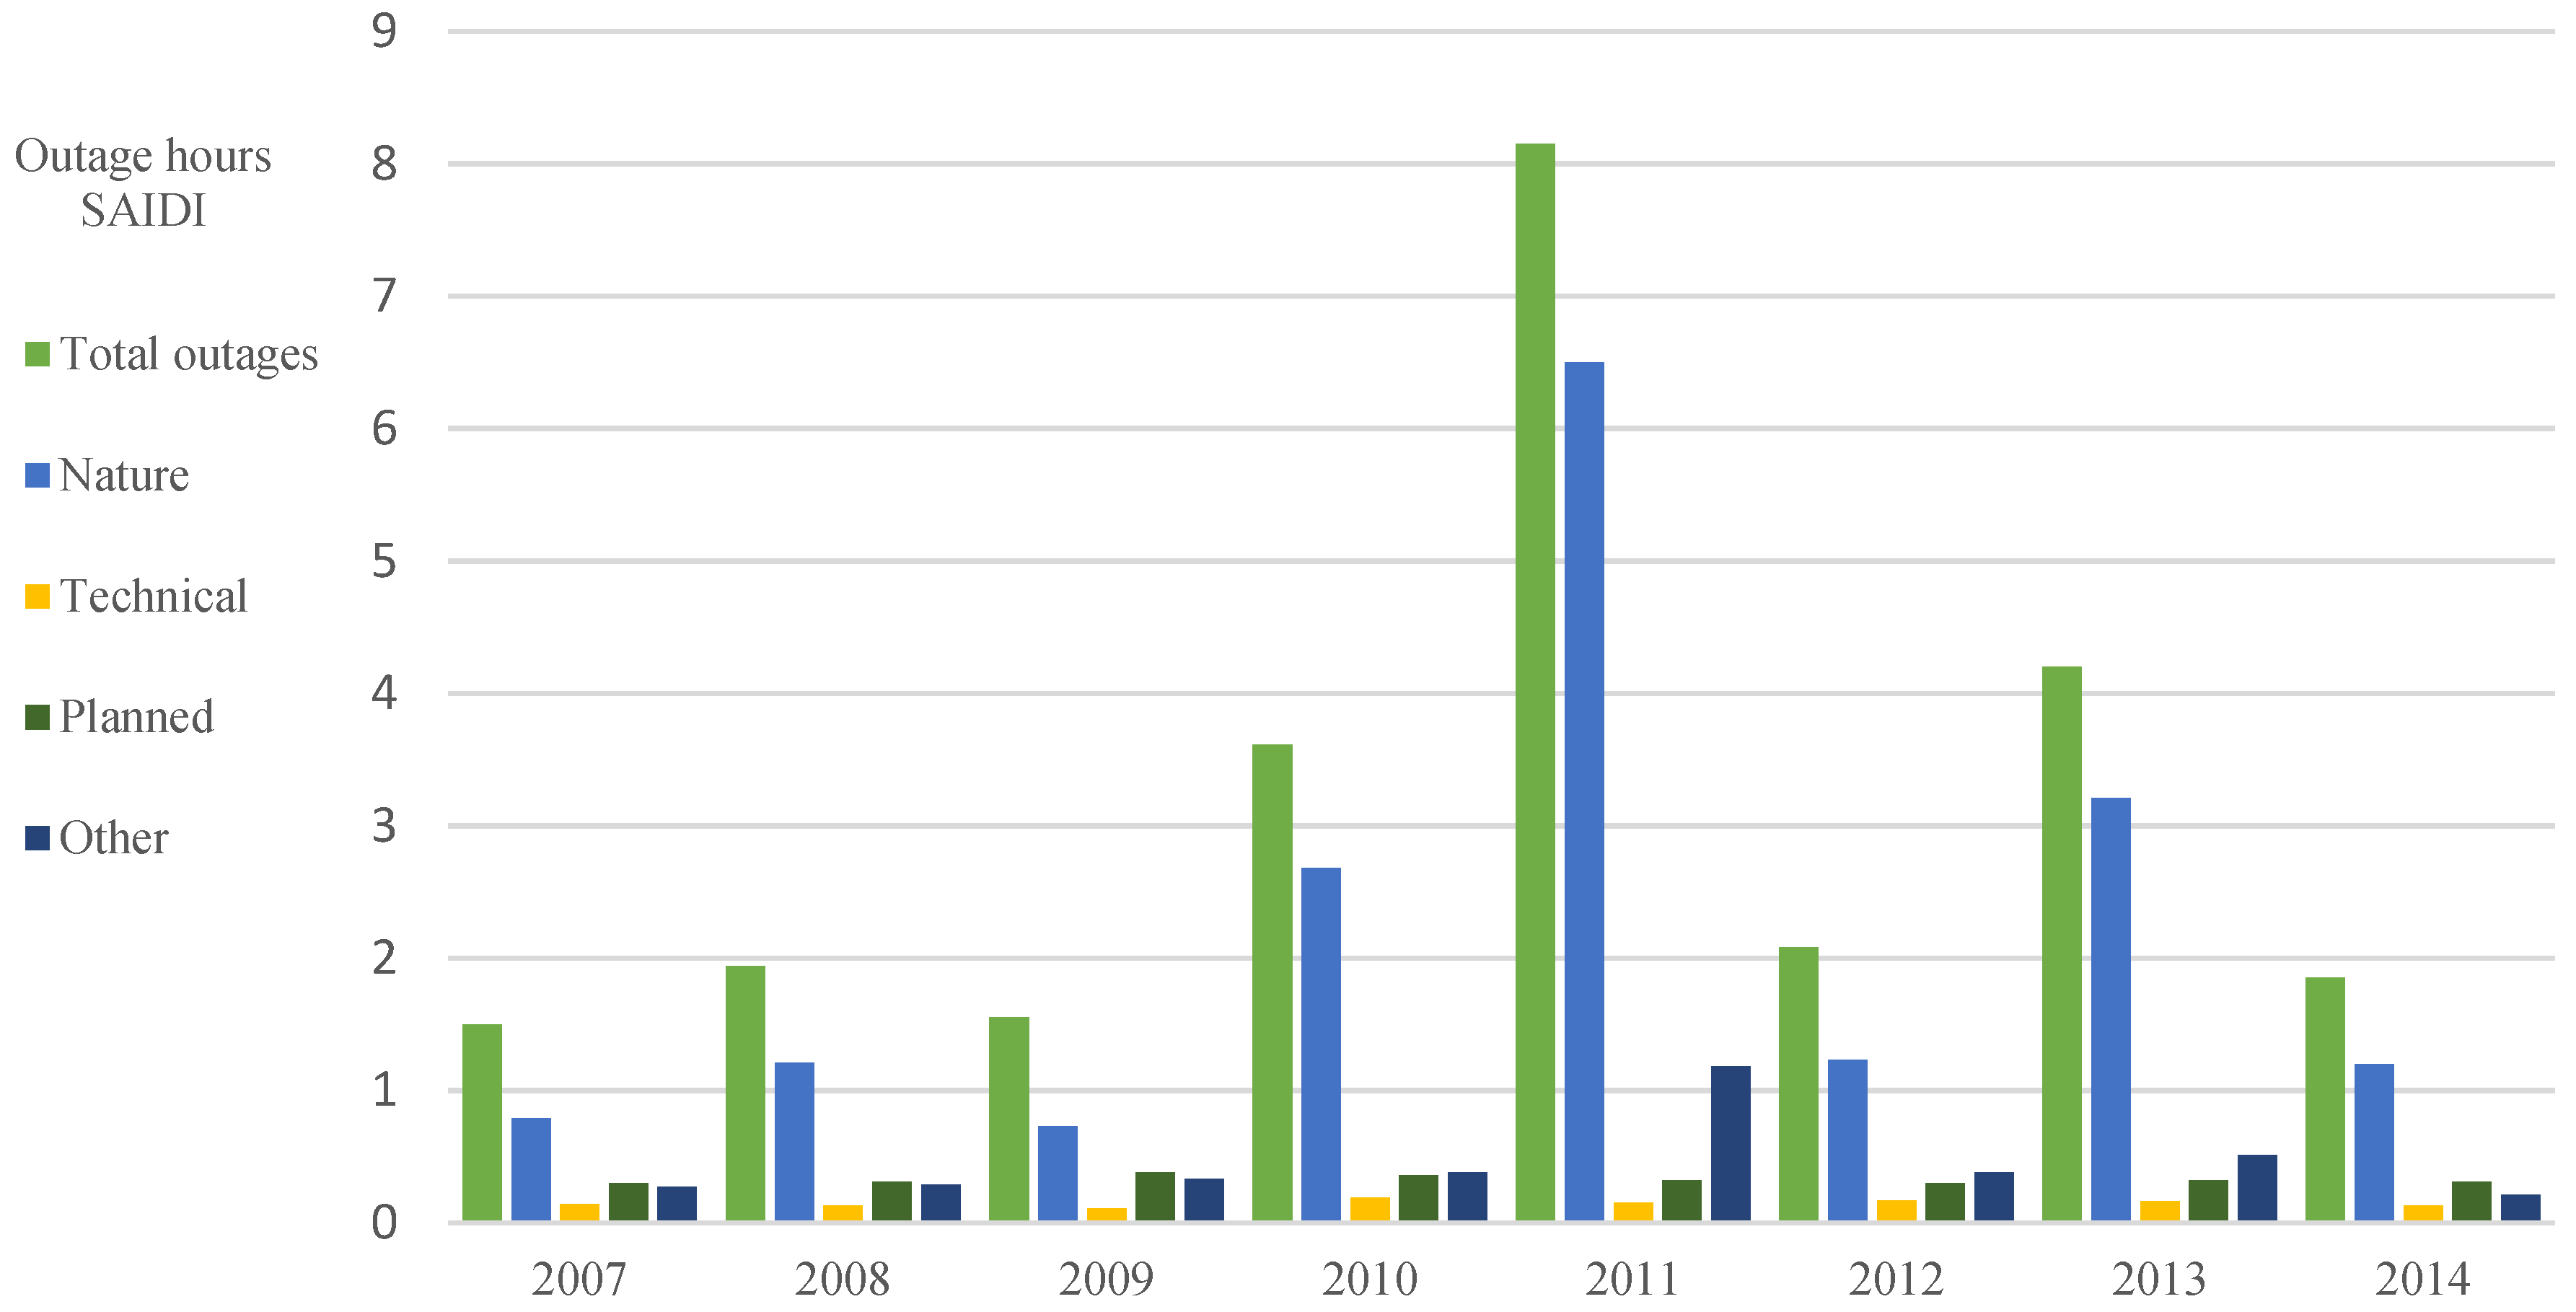
3. The Electric Power Reliability in Sweden
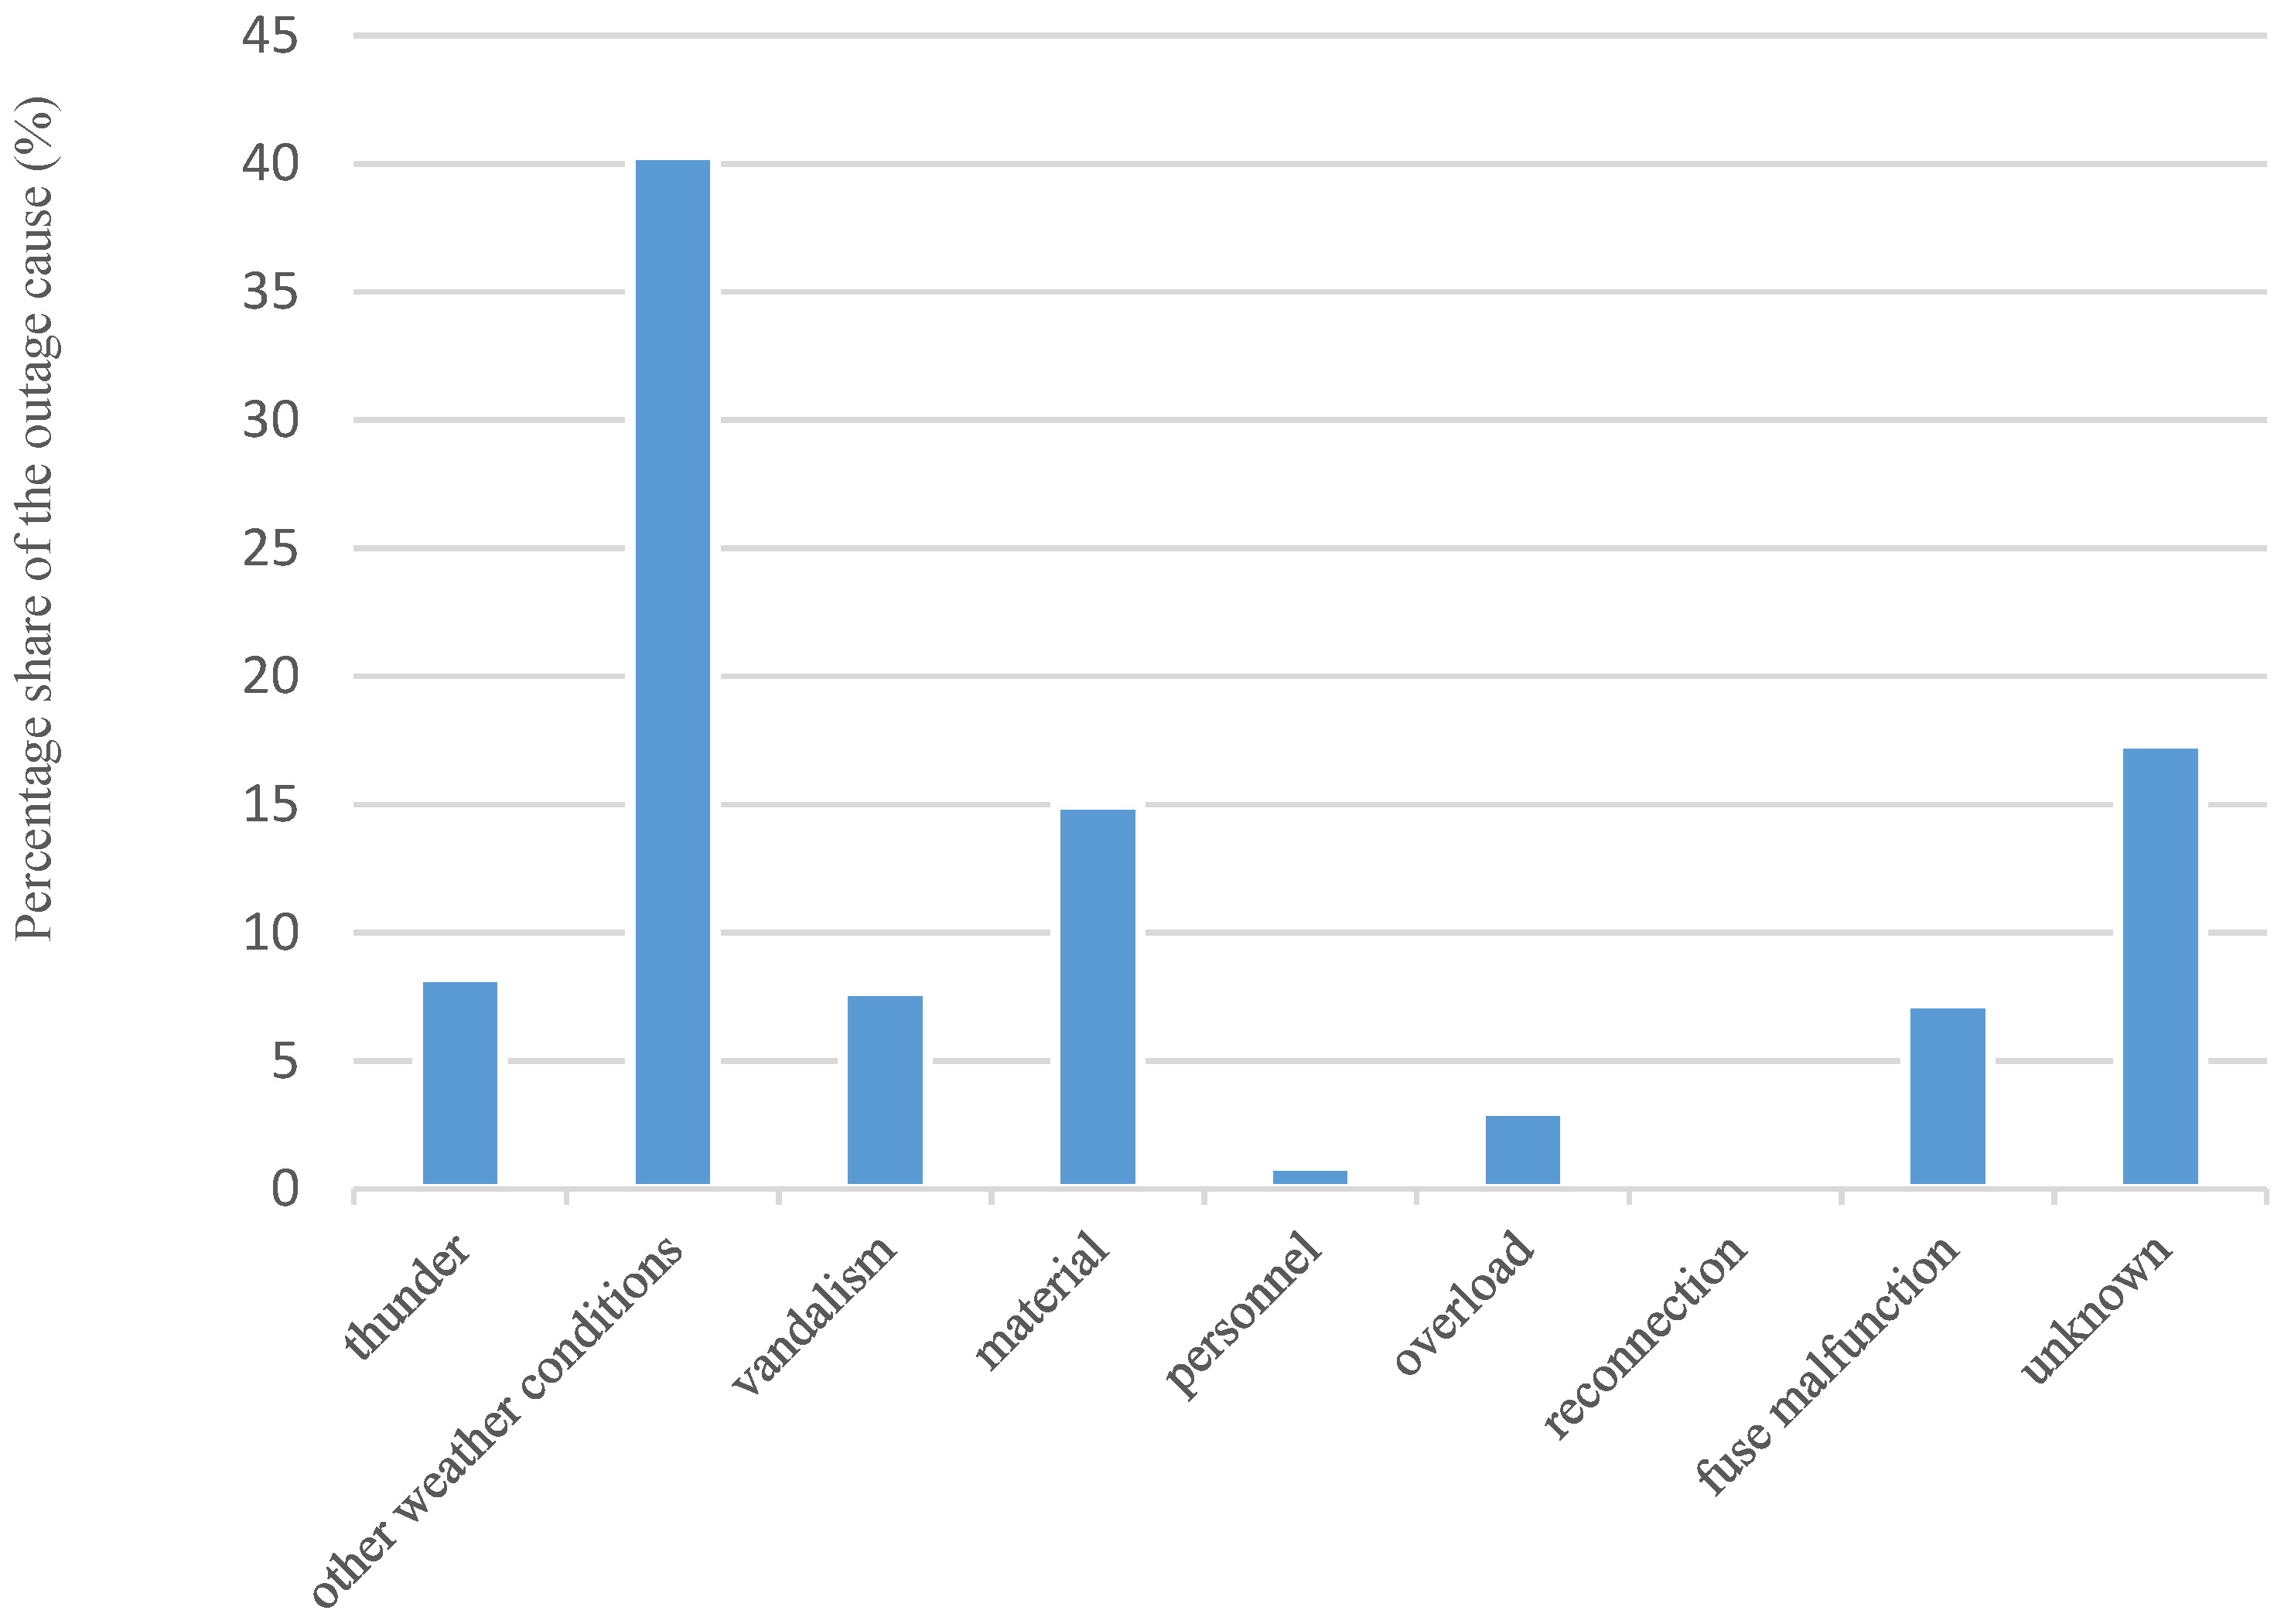
- nature: thunders and other weather conditions
- human: personnel and vandalism
- operation: material, overload, reconnection, and fuse malfunctioning
- unknown
Calculating the Costs of Power Interruptions
- CICt,k: monetary worth of the power interruptions to the DSO’s customers in year t in the value of money in year k, euros;
- ODunexp,t: customer’s average annual unexpected outage time weighted by annual energies in the year t, hours;
- hE,unexp: value of the unexpected outages to the customer in the 2005 value of money, euros/kWh;
- OFunexp,t: customer’s average annual unexpected outage number weighted by annual energies in the year t, numbers;
- hW,unexp: value of the unexpected outages to the customer in the 2005 value of money, euros/kW;
- ODplan,t: customer’s average annual planned outage time weighted by annual energies in the year t, hours;
- hE,plan: value of the planned outages to the customer in the 2005 value of money, euros/kWh;
- OFplan,t: customer’s average annual planned outage number weighted by annual energies in the year t, numbers;
- hW,plan: value of the planned outages to the customer in the 2005 value of money, euros/kW;
- Wt: the customer’s amount of energy consumption in the year t, kWh;
- Tt: the total number of hours in a year;
- CPI: Consumer Price Index.
4. Discussion
5. Conclusions
Acknowledgments
Author Contributions
Conflicts of Interest
References
- Global Energy Statistical Yearbook. Available online: https://yearbook.enerdata.net/electricity-domestic-consumption-data-by-region.html (accessed on 15 January 2017).
- Küfeoğlu, S.; Lehtonen, M. Cyclone Dagmar of 2011 and its impacts in Finland. In Proceedings of the 2014 IEEE PES Innovative Smart Grid Technologies Conference Europe (ISGT-Europe), Istanbul, Turkey, 12–15 October 2014; pp. 1–5.
- Küfeoğlu, S.; Prittinen, S.; Lehtonen, M. A Summary of the Recent Extreme Weather Events and Their Impacts on Electricity. Int. Rev. Electr. Eng. 2014, 9, 821–828. [Google Scholar] [CrossRef]
- Küfeoğlu, S.; Prittinen, S.; Lehtonen, M. Customer interruption costs calculation of Finnish electricity customers. In Proceedings of the 12th International Conference on the European Energy Market (EEM), Lisbon, Portugal, 19–22 May 2015.
- Steffen, W.; Hughes, L.; Karoly, D. The Critical Decade, Extreme Weather; The Climate Commission: Potts Point, NSW, Australia, 2013. [Google Scholar]
- Khazai, B.; Bessel, T.; Möhrle, S.; Dittrich, A.; Schröter, K.; Mühr, B.; Elmer, F.; Kunz-Plapp, T.; Trieselmann, W.; Kunz, M. Juni-Hochwasser in Mitteleuropa—Fokus Deutschland; Karlsruher Institut für Technologie; CEDIM Forensic Disaster Analysis Group (FDA): Karlsruhe, Germany, 2013. [Google Scholar]
- Toronto Hydro Corporation. Toronto Hydro Corporation Newsletter, 70,000 Customers Remain without Power; Toronto Hydro Corporation: Toronto, Canada, 2013; Available online: http://www.newswire.ca/ (accessed on 1 February 2016).
- Infrastructure Security and Energy Restoration, Office of Electricity Delivery and Energy Reliability. Comparing the Impacts of the 2005 and 2008 Hurricanes on U.S. Energy Infrastructure; U.S. Department of Energy: Washington, DC, USA, 2009.
- AON BENFIELD, Empower Results, Hurricane Sandy Event Recap Report: Impact Forecasting. Available online: http://thoughtleadership.aonbenfield.com/ (accessed on 15 January 2017).
- Environment Agency. The United Kingdom, It Could Get Wetter. Available online: http://www.environment-agency.gov.uk/news (accessed on 31 March 2016).
- Statement Following Meeting with Ed Davey, Secretary of State for Energy and Climate Change, Energy Network Association. Available online: http://www.energynetworks.org/news (accessed on 15 January 2017).
- Xie, Q.; Zhu, R. Earth, Wind and Ice. IEEE Power Energy Mag. 2011, 9, 28–36. [Google Scholar]
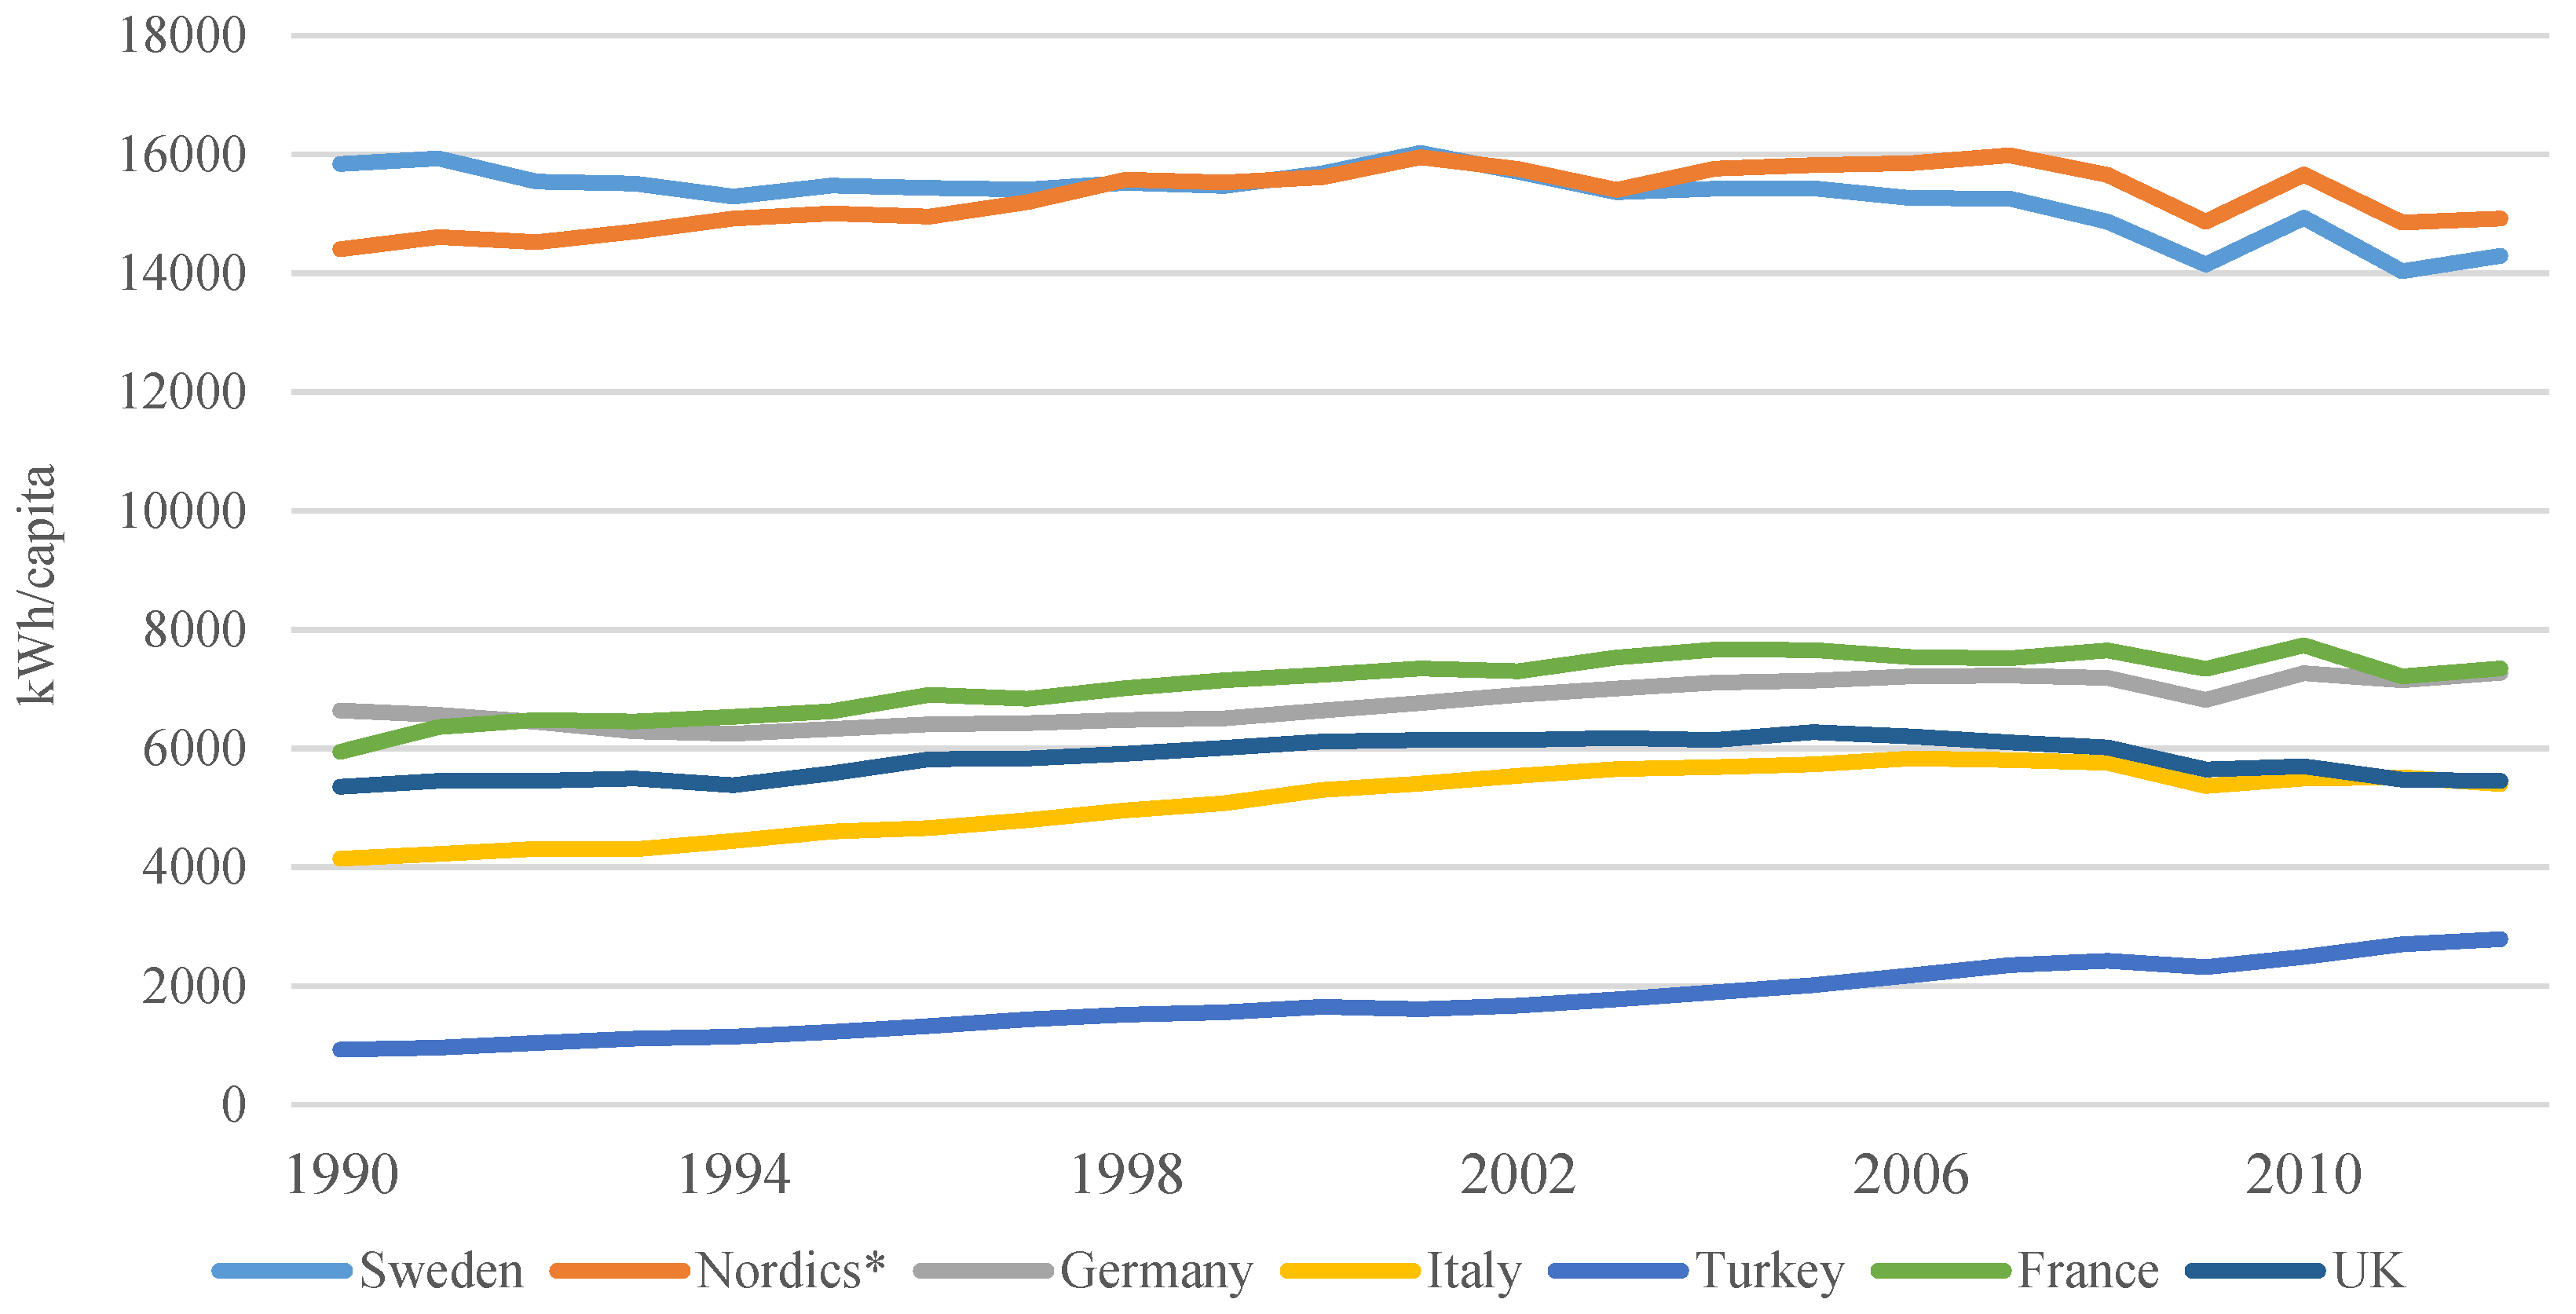
- Electric Power Consumption per Capita, World Bank. Available online: http://data.worldbank.org/indicator (accessed on 15 January 2017).
- Statens Energimyndighet. Energimyndigheten Stormen Gudrun—Konsekvenser för Nätbolag och; Statens Energimyndighet: Eskilstuna, Swedish, 2005. (In Swedish) [Google Scholar]
- Haanpaa, S.; Lehtonen, S.; Peltonen, L.; Talockaite, E. Impacts of Winter Storm Gudrun of 7th–9th January 2005 and Measures Taken in Baltic Sea Region. Available online: http://www.astra-project.org/sites/download/ASTRA_WSS_report_final.pdf (accessed on 7 February 2017).
- Korsfeldt, T.; Toll, M. Storm Gudrun, What Can Be Learnt from the Natural Disaster of 2005? Swedish Energy Agency: Eskilstuna, Swedish, 2006. [Google Scholar]
- The European Central Bank. SEK to EUR. Available online: https://www.ecb.europa.eu/stats (accessed on 15 January 2017).
- Ministry of Enterprise, Energy and Communications. Leveranssäkra Elnät, Prop. 2005/06:27; Regeringskansliet: Stockholm, Sweden, 2005. [Google Scholar]
- Swedish Electricity Law, Chapter 1 §1, Chapter 10 §9–16. Available online: https://lagen.nu/1997:857 (accessed on 15 January 2017). (In Swedish)
- Svensk Energi. DARWIin—Driftsstörningsstatistik Sweden. Available online: http://www.svenskenergi.se/ (accessed on 15 January 2017).
- Finnish Energy Industries. 2013, Outage Statistics 2007–2014. Available online: http://energia.fi/ (accessed on 15 January 2017).
- Küfeoğlu, S.; Lehtonen, M. A Review on the Theory of Electric Power Reliability Worth and Customer Interruption Costs Assessment Techniques. In Proceedings of the 13th International Conference on the European Energy Market (EEM), Porto, Portugal, 6–9 June 2016; pp. 6–9.
- Energy Market Authority. Regulation Methods for the Assessment of Reasonableness in Pricing of Electricity Distribution Network Operations and High-Voltage Distribution Network Operations in the Third Regulatory Period Starting on 1 January 2012 and Ending on 31 December 2015. Available online: http://www.energiavirasto.fi/documents (accessed on 15 January 2017).
- Enerdata. Global Energy Statistical Yearbook 2016. World Power Consumption, Electricity Consumption. Available online: https://yearbook.enerdata.net (accessed on 15 January 2017).
- SCB (Statistiska Centralbyrån, Statistics Sweden). CPI, Fixed Index Numbers. Available online: http://www.scb.se (accessed on 15 January 2017).
- Jorvin, C.L.; Miles, W.T. Impact Assessment of the 1977 New York City Blackout; U.S. Department of Energy: Washington, DC, USA, 1978.
- Svensk Energi Press Release. Electricity Networks Ten Years after Gudrun: 50 Billion in Investments Show Our Social Responsibility. Available online: http://www.svenskenergi.se/Pressrum (accessed on 15 January 2017). (In Swedish)
- Council of European Energy Regulators. CEER Benchmarking Report 5.2 on the Continuity of Electricity Supply Data Update, 2015. Available online: http://www.ceer.eu/portal (accessed on 15 January 2017).
- Küfeoğlu, S.; Lehtonen, M. Climate Change Concerns and Finnish Electric Power Supply Security Performance. In Proceedings of the IEEE PES Innovative Smart Grid Technologies Europe, Ljubljana, Slovenia, 9–12 October 2016; pp. 1–5.


| Distribution Lines in Affected Areas (Total) | Cable | Insulated Overhead Lines | Uninsulated Overhead Lines | |
|---|---|---|---|---|
| Length (km) | 142,631 | 68,593 | 23,193 | 50,845 |
| Percentage (%) | 100 | 48 | 16 | 36 |
| Loss of Supply | Clearance, Repair and Restoration | Compensations for Loss of Supply | Other Costs | Total | |
|---|---|---|---|---|---|
| SEK million | 53.62 | 1537.32 | 613.70 | 132.05 | 2344.78 |
| EUR 1 million | 5.90 | 169.11 | 67.51 | 14.53 | 257.93 |
| Share (%) | 2 | 66 | 26 | 6 | 100 |
| Outage Time | Compensation |
|---|---|
| (h) | (SEK) |
| 12 < t < 24 | 500 |
| 24 < t < 48 | 1000 |
| 48 < t < 72 | 3000 |
| 72 < t | 6000 |
| Outage Time | Percentage of Annual Costs Compensated | Minimum Amount of Compensation |
|---|---|---|
| (h) | (%) | (SEK) |
| 12 < t < 24 | 12.5 | 500 |
| 24 < t < 48 | 37.5 | 1000 |
| 48 < t < 72 | 62.5 | 3000 |
| 72 < t < 96 | 87.5 | 6000 |
| 96 < t < 120 | 112.5 | 4500 |
| 120 < t < 144 | 137.5 | 5400 |
| 144 < t < 168 | 162.5 | 6300 |
| 168 < t < 192 | 187.5 | 7200 |
| 192 < t < 216 | 212.5 | 8100 |
| 216 < t < 240 | 237.5 | 9000 |
| 240 < t < 264 | 262.2 | 9900 |
| 264 < t < 288 | 287.5 | 10,800 |
| 288 < t | 300 | 11,700 |
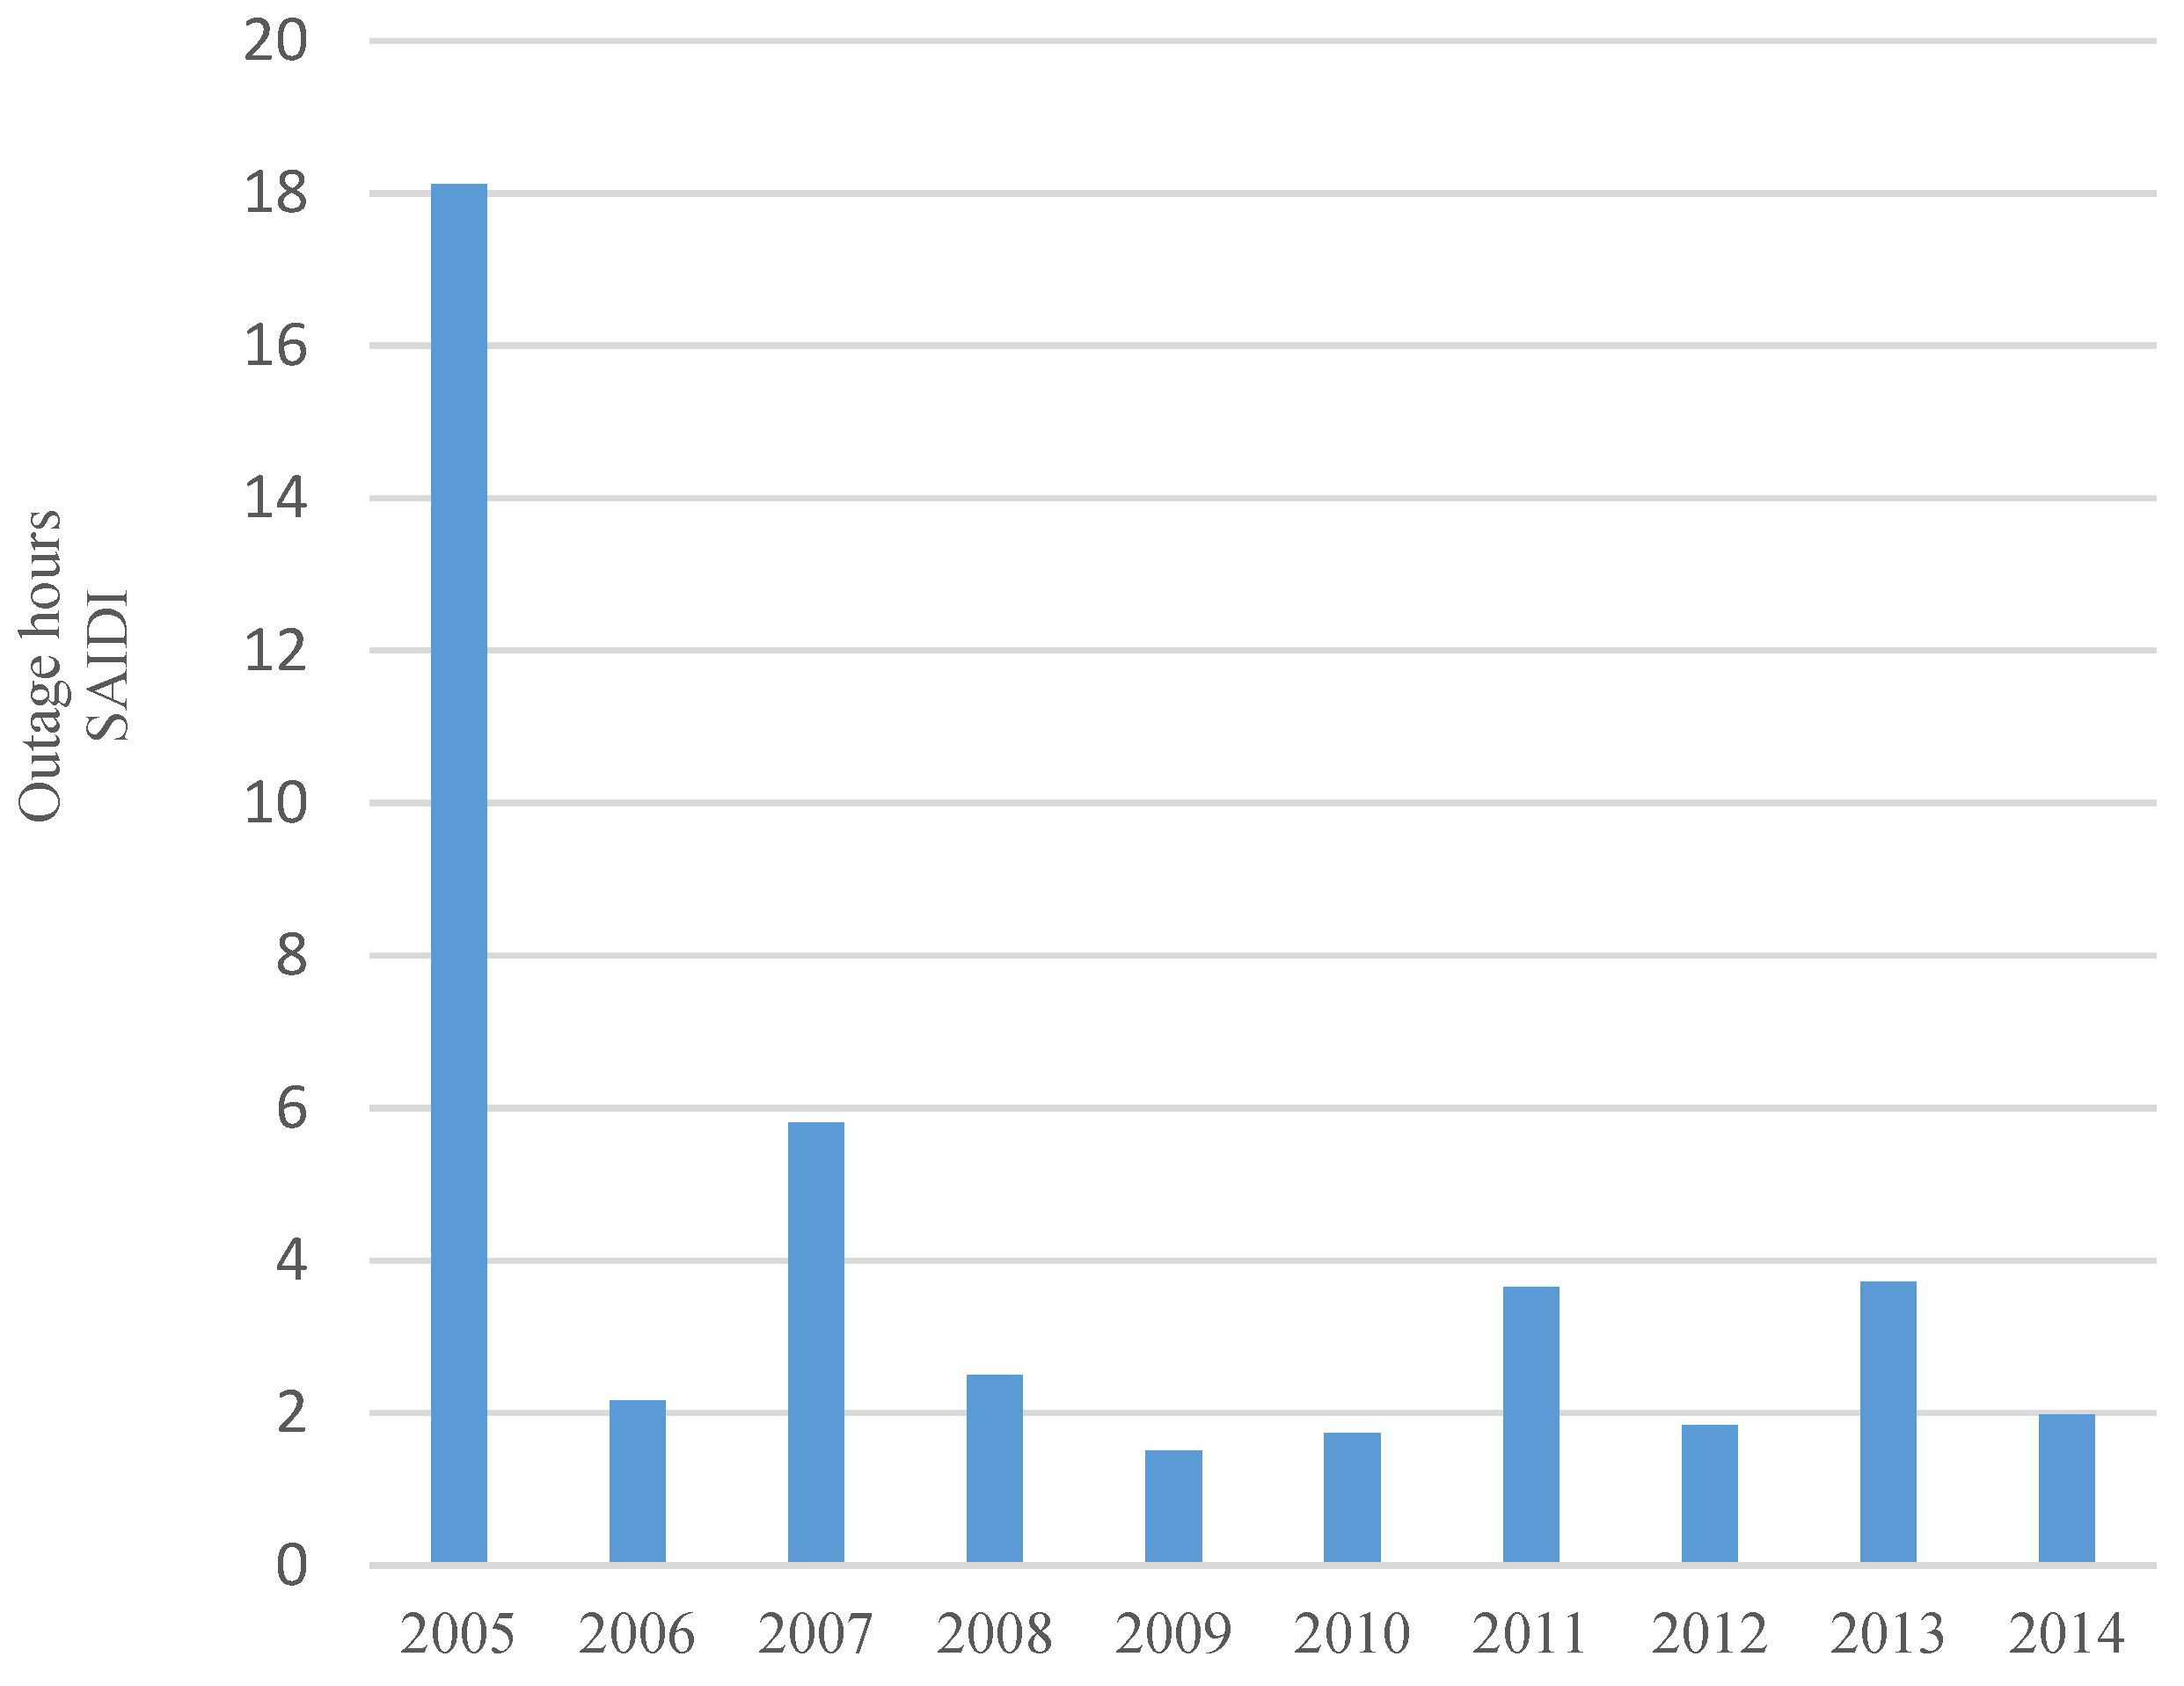
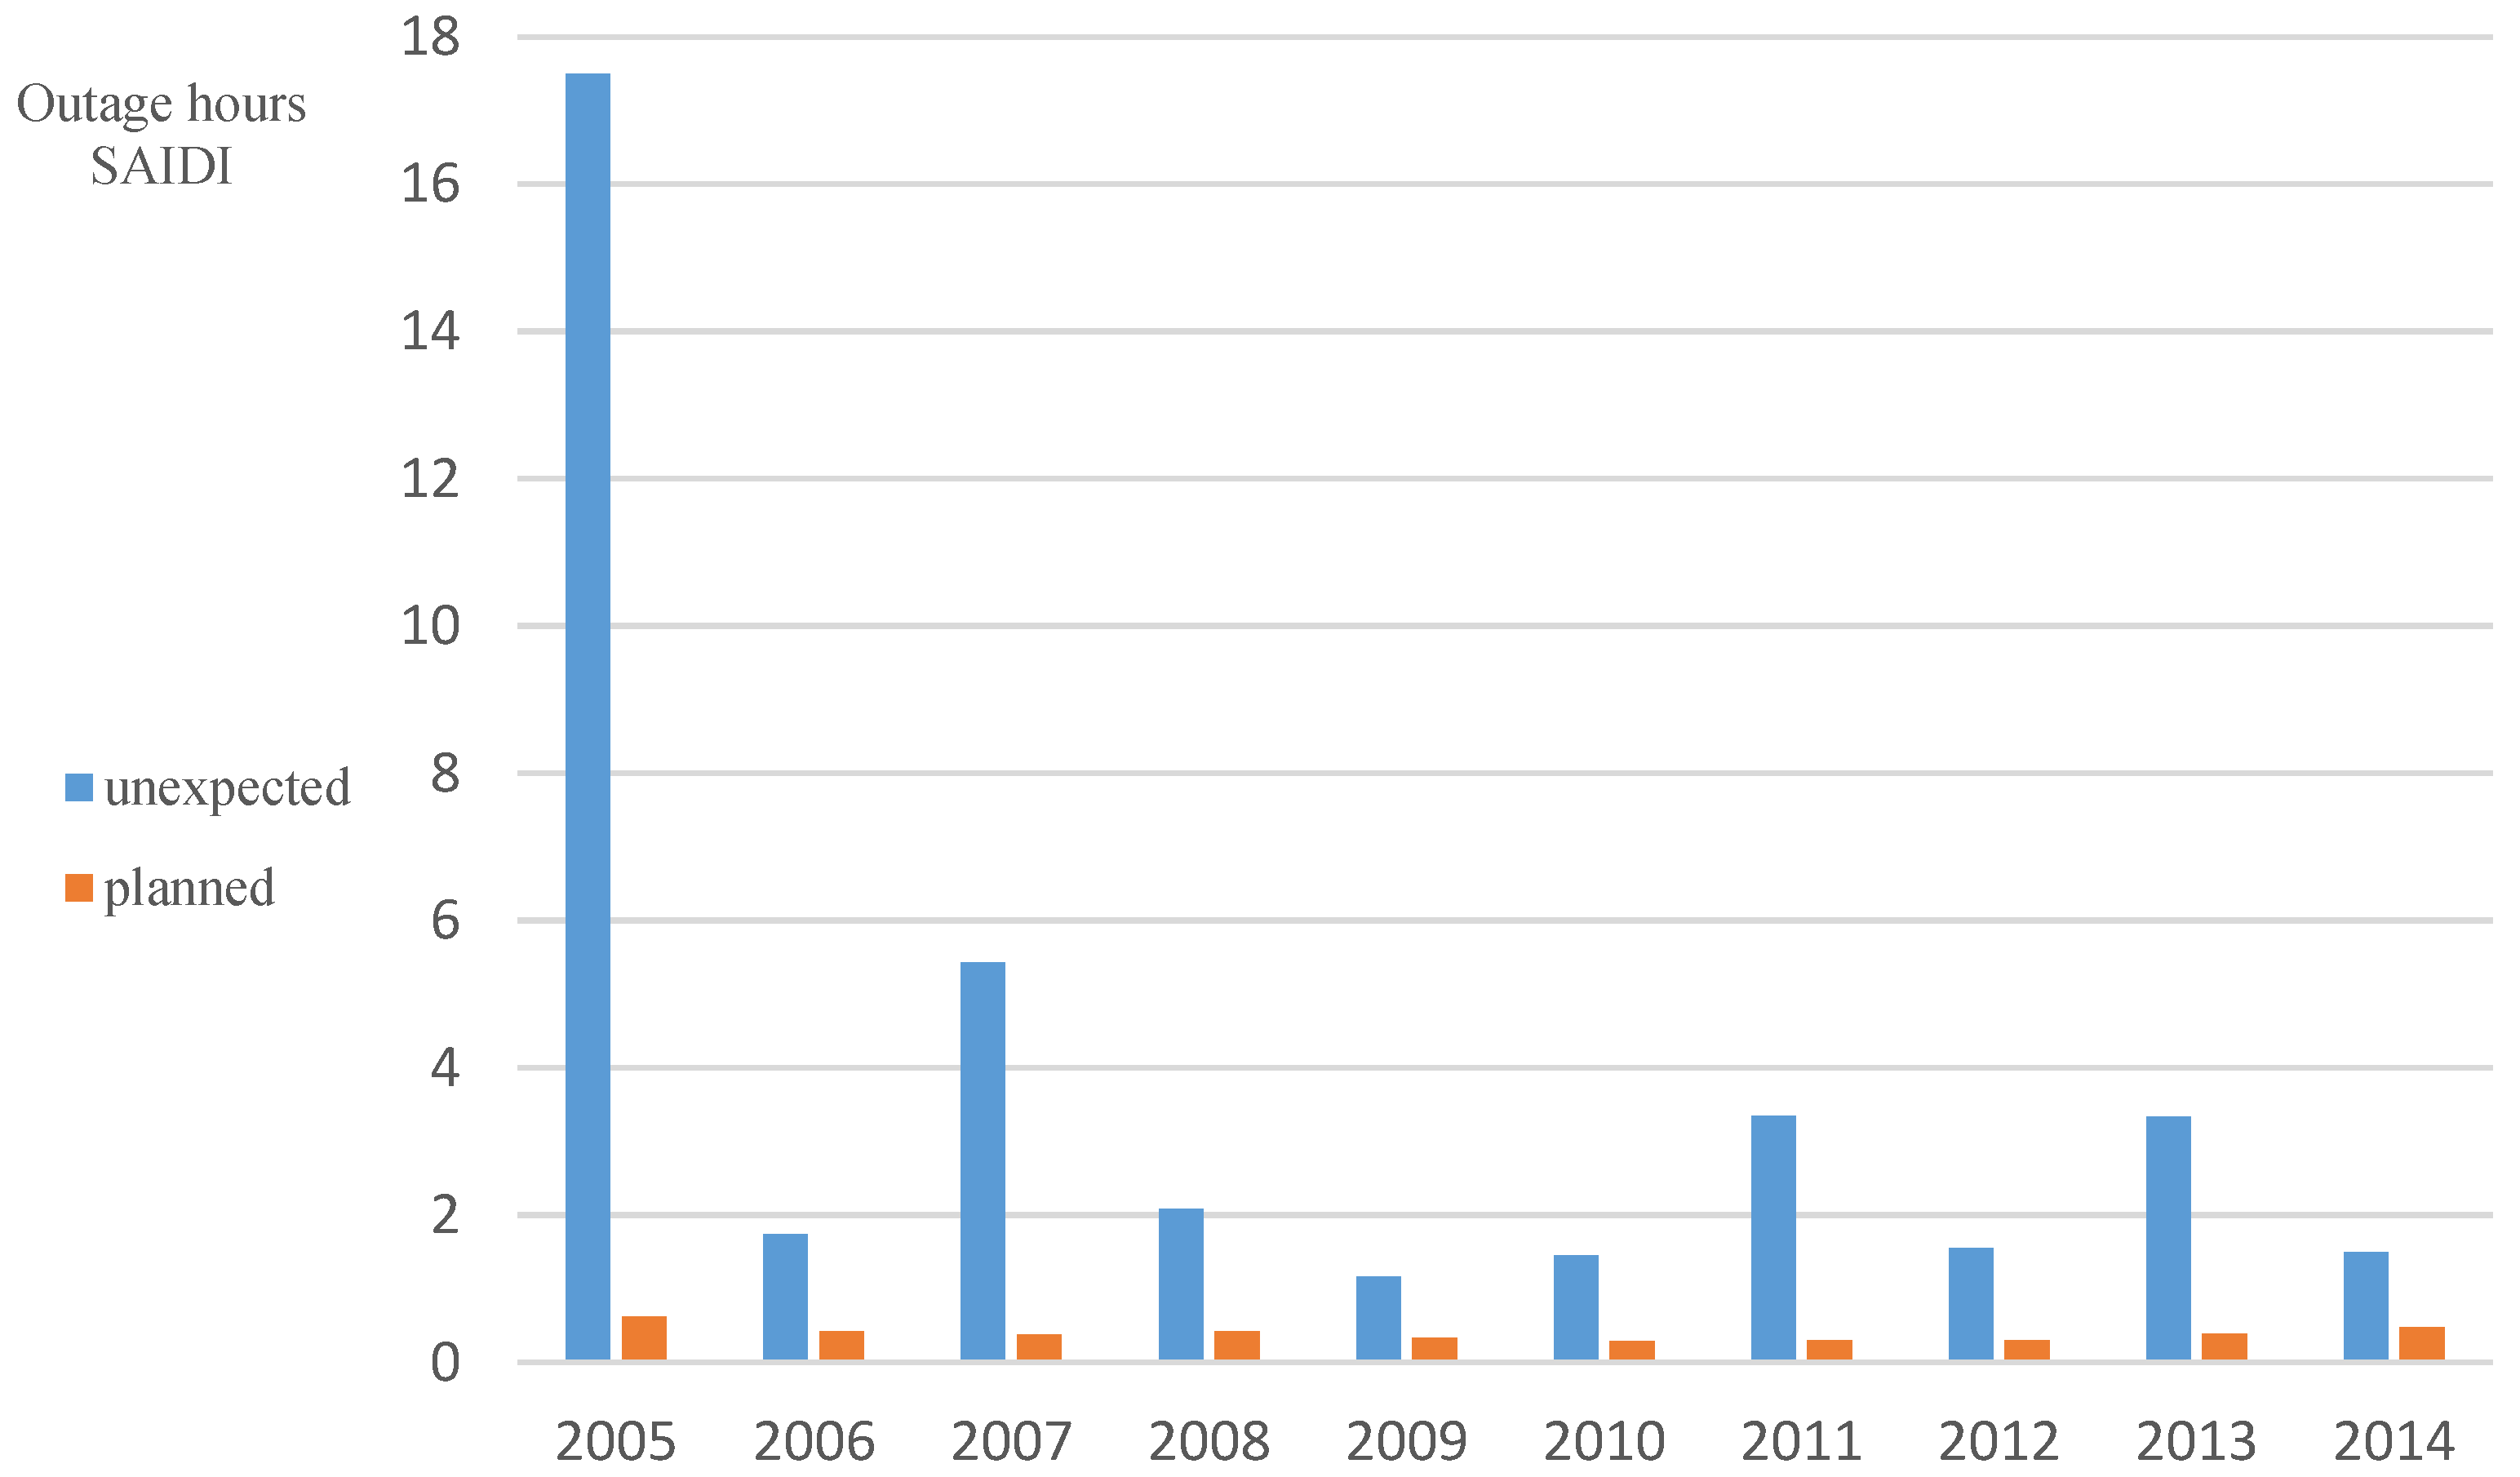
| 2005 | 2006 | 2007 | 2008 | 2009 | 2010 | 2011 | 2012 | 2013 | 2014 | 2015 | |
|---|---|---|---|---|---|---|---|---|---|---|---|
| SAIDI unexpected (h) | 17.48 | 1.73 | 5.43 | 2.09 | 1.17 | 1.45 | 3.35 | 1.55 | 3.34 | 1.50 | 2.17 |
| SAIDI planned (h) | 0.62 | 0.42 | 0.37 | 0.42 | 0.34 | 0.29 | 0.30 | 0.29 | 0.39 | 0.47 | 0.33 |
| SAIFI unexpected | 1.49 | 1.22 | 1.46 | 1.33 | 1.12 | 1.42 | 1.81 | 1.48 | 1.48 | 1.42 | 1.28 |
| SAIFI planned | 0.22 | 0.22 | 0.24 | 0.30 | 0.16 | 0.16 | 0.16 | 0.14 | 0.16 | 0.18 | 0.15 |
| Consumer Price Index | 100 | 101.36 | 103.61 | 107.21 | 106.87 | 108.22 | 111.07 | 112.05 | 112 | 111.8 | 111.75 |
| Electricity consumption (TWh) | 135 | 135 | 136 | 133 | 128 | 137 | 129 | 132 | 129 | 125 | 125 |
| hE,unexp (€/kWh) | hW,unexp (€/kW) | hE,plan (€/kWh) | hW,plan (€/kW) | |
|---|---|---|---|---|
| Value | 11 | 1.1 | 6.8 | 0.5 |
| Year | 2005 | 2006 | 2007 | 2008 | 2009 | 2010 | 2011 | 2012 | 2013 | 2014 | 2015 |
|---|---|---|---|---|---|---|---|---|---|---|---|
| CIC (M€) | 2996 | 324 | 992 | 404 | 223 | 298 | 638 | 317 | 636 | 293 | 406 |
© 2017 by the authors. Licensee MDPI, Basel, Switzerland. This article is an open access article distributed under the terms and conditions of the Creative Commons Attribution (CC BY) license ( http://creativecommons.org/licenses/by/4.0/).
Share and Cite
Gündüz, N.; Küfeoğlu, S.; Lehtonen, M. Impacts of Natural Disasters on Swedish Electric Power Policy: A Case Study. Sustainability 2017, 9, 230. https://doi.org/10.3390/su9020230
Gündüz N, Küfeoğlu S, Lehtonen M. Impacts of Natural Disasters on Swedish Electric Power Policy: A Case Study. Sustainability. 2017; 9(2):230. https://doi.org/10.3390/su9020230
Chicago/Turabian StyleGündüz, Niyazi, Sinan Küfeoğlu, and Matti Lehtonen. 2017. "Impacts of Natural Disasters on Swedish Electric Power Policy: A Case Study" Sustainability 9, no. 2: 230. https://doi.org/10.3390/su9020230