1. Introduction
Economic growth and industrial development in developing countries have long relied mainly on a resource path that entails high investment, high energy consumption, high emissions, low quality, low efficiency and low output [
1,
2]. Although this extensive mode of industrial growth contributes significantly to economic growth, it has also increased energy consumption, environmental pollution, and pollution emissions. Moreover, energy consumption has been approaching the limit of environmental carrying capacity. After more than 30 years of rapid development, China has become the world’s second largest economy. However, it has paid a huge price in terms of energy, environment and social welfare, and has surpassed the United States as the world’s largest pollution emitter. As the core of China’s economy, manufacturing plays a significant role in industrial economic growth, energy consumption and environmental pollution, and its negative impact on both energy and the environment cannot be ignored. For instance, the problem of haze pollution, which is mainly composed of PM
10 and PM
2.5, is particularly severe in China. Areas with a high concentration of manufacturing are shrouded in “the Gray Great Wall”, stretching for thousands of kilometers. The manufacturing industry is responsible for 469,366 billion cubic meters of total volume of industrial waste gas emissions, accounting for 67.61% of China’s total emissions; manufacturing consumes 2450.51 million tons of standard coal, accounting for 57.55% of China’s total energy consumption [
3,
4]. The high energy consumption and high emissions of Chinese manufacturing have come under great pressure and have become the focus of global attention.
Therefore, it is urgent that China transition to a mode of manufacturing that prioritizes energy saving and environmental protection, and this transition must be driven by the integration of green growth and innovation. “Green growth” is a mode of pursuing economic growth and development while preventing environmental deterioration, biodiversity loss and unsustainable use of natural resources [
5,
6]. Due to the need for balanced consideration of the relationship between growth and the environment, it has become the new preference of many countries and international organizations (United Nations Environment Programme, Organization for Economic Co-operation and Development and European Union) and is regarded as an important strategy in achieving sustainable development [
7,
8]. Meanwhile, if innovation is the driving force behind development, green innovation is the driving force behind sustainable development. Green innovation is the innovation pathway to reducing pollution, saving resources and improving the environment; it has both ecological and economic benefits, fundamentally promotes sustainable development and enhances the competitiveness of enterprises [
9]. To achieve sustainable development, it is increasingly important that industries develop and strengthen green technology innovation [
10,
11].
In this context, Green Innovation Growth is a complex developmental process based on technological innovation and knowledge accumulation. Due to the uneven distribution of industrial innovation resources in China, manufacturing is limited by its own resources: the Research and Development (R&D) foundation is very weak; and R&D intensity is only approximately 0.91%, which is well below the average level of 2.5%–4% in developed countries. Thus, the corresponding innovation-driving effect is limited. With the development of open innovation, Chinese manufacturing enterprises are creating and acquiring knowledge through external sourcing to produce new knowledge flows to build and update their technology stocks [
12]. Furthermore, by cooperating with enterprises, universities and research institutes with technical advantages, including cooperative R&D, R&D outsourcing and commissioned technology development, can achieve innovation transformation [
13]. Therefore, although a great deal of innovation comes from entrepreneurs and intrapreneurs independent of external knowledge, external knowledge sourcing has become one of the main paths by which the Chinese manufacturing industry pursues green innovation growth. Chinese manufacturing needs a clear understanding of the role (and adverse effects) of external knowledge sources in the growth of green innovation; it must explore new systems of technological innovation and environmental regulation, establish a model of green and eco-industrial development, and contribute to global green development.
This paper is organized as follows.
Section 2 provides an overview of the related literature.
Section 3 presents the methodology and empirical specifications, as well as the estimation variables and our database.
Section 4 discusses the evaluations of Green Innovation Growth under environmental and energy regulations. The empirical results and discussions of dynamic threshold effects between external knowledge sourcing and green innovation growth are presented in
Section 5. Finally,
Section 6 provides conclusions and recommendations.
2. Literature Review
Scholars have extensively studied and discussed open innovation, external knowledge sourcing and diversified innovation paths. It is worth noting that more and more scholars are beginning to examine the impact of external knowledge sourcing on innovation performance. For example, Reagans and McEvily [
14] proposed that external R&D institutions could promote the flow of knowledge, especially implicit knowledge. Meanwhile, external connections can bring all types of valuable innovation resources to the firm, reduce environmental uncertainty, promote the development of innovation activities and ultimately improve innovation performance. Hewitt-Dundas [
15] noted that the resources and abilities obtained from an external innovation partner could encourage enterprises’ innovation behavior and improve innovation ability. Cooperative partners may also benefit from complementary and shared innovative resources to make up for their individual lack of enterprise resources and limited capacity [
16]. Technical cooperation can help enterprises cope with global competition, financial and economic uncertainty, and rapid and fundamental technological change, and cooperation can reduce investment risk [
17,
18]. Based on the data of Austria enterprises, Todtling et al. [
19] showed that external cooperation innovation in Austria has a significant effect on innovation performance. Furthermore, Liu [
20] found that foreign technical cooperation has positive impacts on China’s energy industry performance, which are more obvious in developed regions of China.
However, unlike most studies, De Man and Duysters [
21] found that an enterprise’s external cooperation could have positive, negative and neutral effects on innovation performance. Vega-Jurado et al. [
22] observed that the influence of external sourcing on innovation performance is very weak in manufacturing of Spain. This also happens in Korea; interestingly, there is no significant impact of external knowledge-oriented approach while there is positive impact of internal knowledge-oriented approach [
23]. The high transaction costs of searching for and selecting partners, configuring additional resources, and coordinating and managing R&D activities of cooperative members reduce the benefits of external innovation activities and challenge organizational structure. Indeed, external cooperation with competitors or institutions has a negative impact on innovation performance [
24], and the failure rate of cooperative R&D is higher [
25]. Other studies suggest that there is an inverted U-shaped relationship between external knowledge resources and innovation performance in Europe, meaning that a threshold is created by a critical point [
26,
27]. Beyond this threshold, the enterprise’s innovation performance is reduced, and with the increase in the stock of technology, external knowledge sourcing will lead to increased opportunity costs, and the negative effect will be more significant. In other words, internal and external R&D may be complementary to varying degrees, but they may also substitute for each other [
28,
29].
In fact, no matter what type of innovation path an enterprise follows, it must adapt to the base of technology and resources in its industry, that is, the concept of development threshold [
30]. Technological innovation depends on the accumulation of knowledge, and the level of R&D determines the ability to innovate [
31,
32]. In turn, a strong technological base allows the extension of a firm’s technological capabilities and increases the odds of developing and realizing new products [
33]. In short, the foundation of R&D is support for technological innovation, which has a significant impact on innovation output. Thus, is innovation in external knowledge sourcing really effective at different levels of R&D? How does the heterogeneity of R&D thresholds affect the mechanism by which external knowledge sourcing shapes green innovation growth, and what type of heterogeneity has the greatest impact?
This study attempts to fill some of the abovementioned gaps. First, we clarify the relationship among energy consumption, environmental pollution and technological innovation by developing the slacks-based measure-directional distance function (SBM-DDF) to calculate the green innovation growth index of China’s manufacturing in 2008–2014; we further analyze its structure across industries with environmental and energy regulations. Second, any innovation path needs to correspond to the industry’s level of technological development; only with a minimal foundation of R&D can the industry effectively follow a certain innovation path. We introduce the threshold factor of R&D level into the complex mechanism linking external knowledge sourcing and green innovation growth to examine the dynamic threshold effect and its heterogeneity, and we try to explore the role of driving factor, realizing path and policy design in green innovation growth. Accordingly, this research provides key insights on the implications of green innovation growth.
3. Methodology and Model
3.1. The SBM-DDF Model
Many scholars have studied green technology innovation [
34,
35,
36]. However, prior studies have the following fundamental problems: Most adopt the non-parametric method of Malmquist–Luenberger, based on the directional distance function proposed by Chung et al. [
37], which presents environmental pollution as an undesirable output. However, due to the existence of radial and directional deviation, production efficiency is overestimated and cannot be non-proportionally adjusted simultaneously [
38]. The non-radial and non-oriented method of Slacks-Based Measure (SBM), based on the slack variable [
39], corrected the problem to some extent, but it is still unable to adjust the input and output radially, and the efficiency is overvalued. Consequently, Fukuyama and Weber [
38] proposed a new method that combines the SBM with the direction vector model (SBM-DDF); this can solve the above problems and better fit the input–output relationship under the constraints of environment and energy. The methodological contributions of SBM-DDF are as follows. (i) Undesirable outputs: SBM-DDF examines the decrease in undesirable outputs while examining the increase in output; (ii) Redundancy: This method can get input redundancy, and output deficiency has a strong policy implications; (iii) Weighting: SBM-DDF can be used to set the weight of the input and output variables, which is conducive to the analysis framework of the policy factors. It can reveal the government’s motivation and tendency in the green development and its different preference structure; (iv) Validity and authenticity: Green efficiency is essentially to examine the contribution of environmental and energy input to economic output, and it needs to be measured and decomposed in the framework of total factor. In other words, SBM-DDF can get a real sense of green efficiency [
40]. Therefore, this paper uses the new development model of the SBM-DDF to measure green innovation growth in manufacturing (Details are provided in
Appendix A).
3.2. Indicators for Evaluating Green Innovation Growth
3.2.1. Input Indicators
In this paper, the investment of green innovation in manufacturing mainly includes R&D capital stock (because early investment in R&D will affect the current input, we estimate the R&D capital stock using the perpetual inventory method), full-time R&D personnel and energy consumption [
41,
42]. It should be noted that for green innovation growth based on energy efficiency, we adopt the indicators of comprehensive energy consumption (million tons of standard coal) in manufacturing to measure the energy input of green innovation growth.
3.2.2. Output Indicators
Green innovation outputs include desirable outputs and undesirable outputs. Desirable outputs reflect the willingness of industrial technology to innovate. We choose the number of patent applications to illustrate the level of direct innovation in manufacturing. Meanwhile, we take new product sales revenue as the indirect output indicator, representing the commercial value of technology innovation [
43].
Undesirable outputs, as the “by-products” of the desirable outputs, directly or indirectly damage performance during the process of technological innovation (pollution emissions, environmental effects, etc.). We select undesirable outputs from the main pollution sources of manufacturing, including the amount of discharged pollutants (industrial wastewater, industrial waste gas, and industrial solid waste), as well as SO
2, soot and dust emissions [
44,
45]. Thus, we fit these indicators into a comprehensive index of environmental pollution using the entropy method (The indexes are provided in
Supplementary Materials):
First, data standardization:
where
is the number of industries,
is the number of indicators,
is the pollution value of indicator
industry
, and
is the sum of the pollution value.
Second, calculating the entropy of indicator
:
Then, calculating the difference coefficient of indicator
:
The weight values of the pollution indicators are obtained:
Finally, we can obtain the comprehensive index of environmental pollution each year:
The evaluation indicators system of green innovation growth is shown in
Table 1.
3.3. Dynamic Panel Threshold Model
According to previous studies [
30], the innovation path has its own development threshold, which is compatible with the level of technological development. To examine the non-linear relationship of external knowledge sourcing and green innovation growth, we employ the dynamic panel threshold model based on the method proposed by Hansen [
46]. (Two statistical tests are needed with the panel threshold model: (1) To test for a threshold with the null hypothesis of no threshold effect: H
0:
β11 =
β12. (2) When there is a threshold effect (
β11 ≠
β12), we need to use the likelihood ratio statistic to test whether
is consistent for
γ0 (the true value of
γ) with the null hypothesis:
. More details can be found in Hansen [
46].) It is worth noting that the Hansen [
46] method is only applicable to the non-dynamic panel model; it cannot reflect dynamic change or the lag effect of the sample object, and it also ignores the processing of endogenous variables. Thus, we add the lag variable (we find that the instrumental variables of the Second-order lags are significant and the fitting degree is the best, so we choose the first-order and the Second-order lags) to control the lag effect and include dynamic factors based on dynamic panel estimation. We first estimate the dynamic panel threshold and then use the “first-order difference GMM” [
47] to estimate the parameters between different threshold regimes. Using this method, we investigate the effect of external knowledge sourcing on green innovation growth with different thresholds on R&D level between industries. Taking a single-threshold model as an example, the specification is as follows:
where
is the indicator function, and
is the threshold value. The observations are divided into two regimes depending on whether the threshold variable
is lower or higher than the threshold value
. The regimes are distinguished by differing regression slopes,
β1 and
β2. The subscripts
i and
t denote province and year.
is a specific effect of the individual;
is a specific effect of time; and
is a random disturbance. In addition, we allow a one-year lag [
48] in the EKS variable (as green innovation growth requires changes in technological processes that require time to become effective, it appears reasonable that there exists a time lag between innovation path and changes in green innovation growth).
We take the index of green innovation growth (GIG) as the dependent variable and external knowledge sourcing (EKS) as the independent variable. With open innovation, the source of innovation is diversified, and external knowledge sourcing is one way for industries to acquire knowledge and develop new technologies through cooperation with external organizations [
12,
28]. External knowledge sourcing primarily measures R&D costs, including cooperation expenses paid by the industry to external organizations such as enterprises, universities and research institutes [
22,
49]. Thus, we use external R&D stock (we estimate the external R&D capital stock using the perpetual inventory method) to represent the degree of external knowledge sourcing. The threshold variable is the R&D level (LEV). “Financial Times” reporter Peter Marsh has suggested that “China has won the manufacturing, but lost the R&D” [
50]. Fortunately, the Chinese government has a clear understanding of this and believes that China’s manufacturing industry is large but not strong, and the foundation of R&D is still weak. Different levels of R&D have heterogeneous impacts on green innovation growth. We use the ratio of the R&D stock value to the main business income value as a proxy indicator.
In addition, we add a series of control variables. Based on the Porter hypothesis, the “compensation effect” and “learning effect” of environmental regulation will promote green technology innovation [
51]. However, the development of the industry bears high environmental costs, and environmental regulation may also be inversely proportional to green innovation growth [
48,
52,
53]. We use investment in the treatment of environmental pollution by industry as a proxy for environmental regulation (REG). Foreign direct investment (FDI) will increase the host country’s environmental pressure (Pollution Haven Hypothesis) [
54] but also promote industrial green production and reduce environmental pollution (Pollution Halo Hypothesis) [
55] by introducing the technologies of green energy and clean production. We use the ratio of industrial assets from foreign investment to total industrial assets to represent the FDI effect. Industrial agglomeration (AGG) is measured by “the number of manufacturing enterprises”. Industry scale (SCA) is also one of the important factors used by scholars [
56]. We define the industry scale as the ratio of its total asset value to the number of enterprises. The share of production factors, such as capital and labor, has a significant impact on efficiency. We use the ratio of total asset value to average annual number of employees to reflect the structure of industrial factor endowment (END).
3.4. Data Sources and Processing
The database of this paper is industry-level panel data for 2008–2014 obtained from the National Bureau of Statistics of China. We selected 28 manufacturing industries for the sample. Given the influence of price factors on R&D expenditures, we convert the nominal value of R&D expenditures to the actual value using a “price index for R&D”—the weighted average of the consumer price index and the fixed-asset investment price index, with the weights estimated to be 0.55 and 0.45, respectively. Investments in the treatment of environmental pollution and total asset value are weighted with the fixed-asset price index, and the main business income values are weighted with the PPI; the base period is 2008.
Table 2 summarizes the descriptive statistics of variables.
4. Measuring Green Innovation Growth
We measure green innovation growth in relation to environmental and energy regulations for manufacturing based on the SBM-DDF model, and the results are shown in
Table 3.
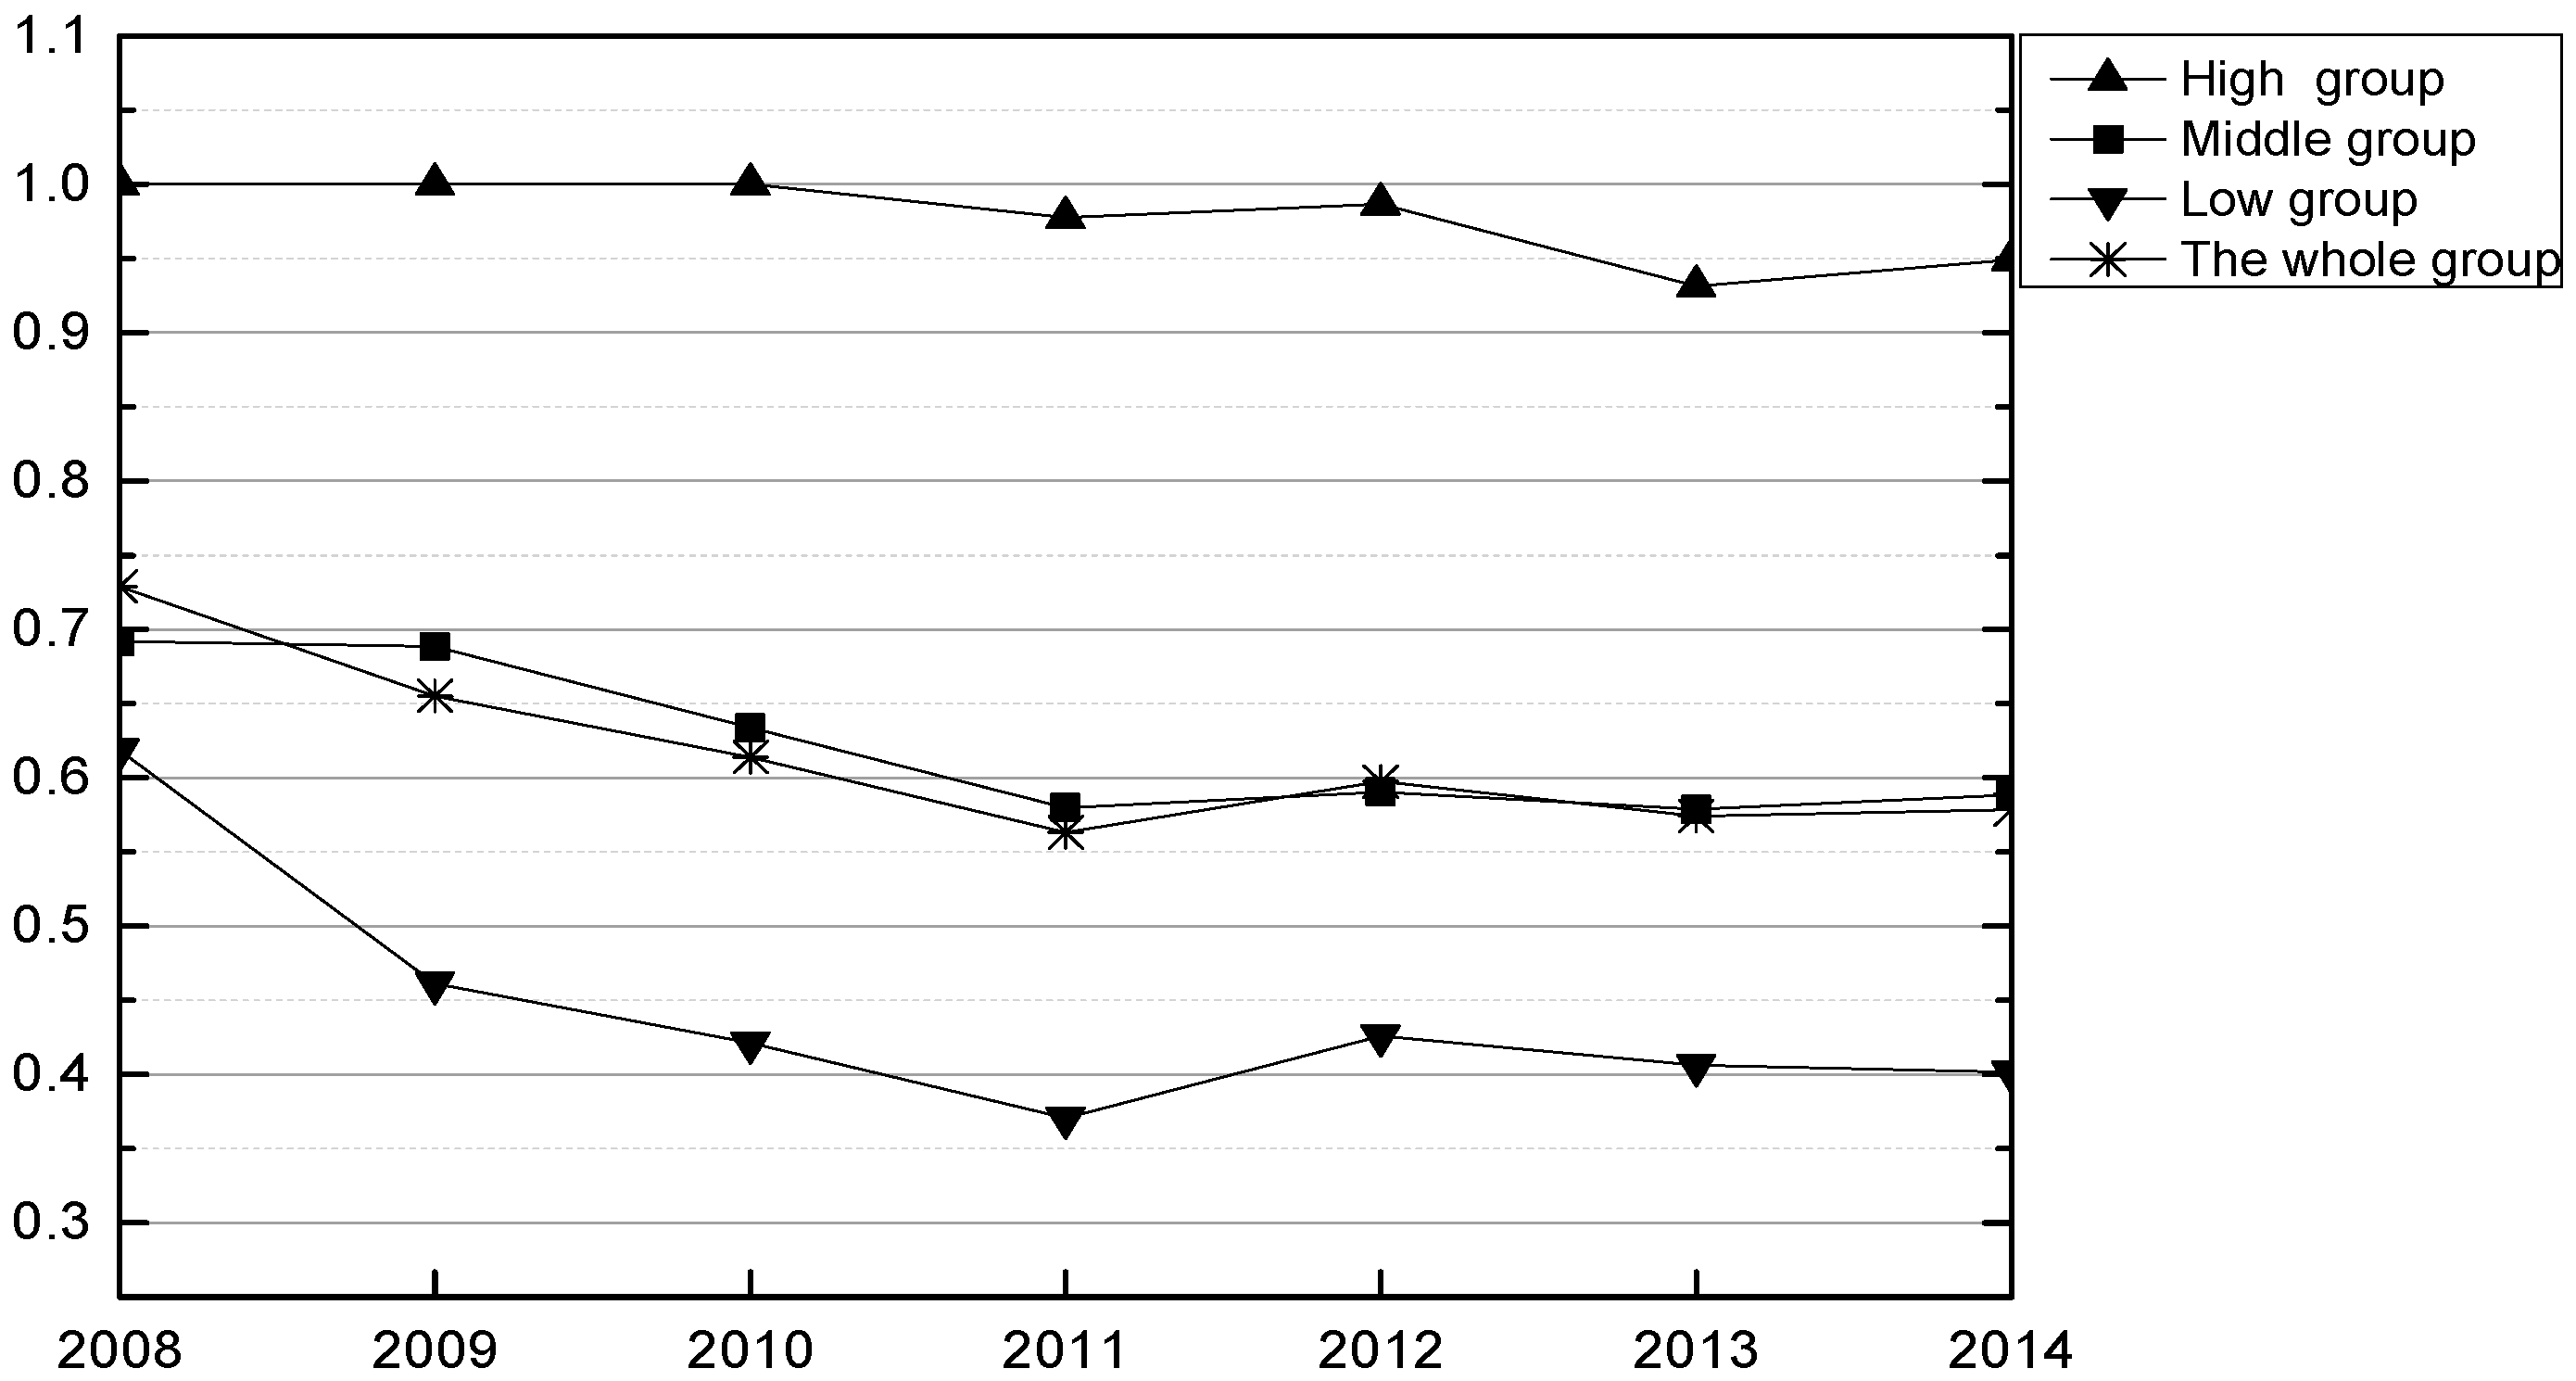
The overall level of green innovation growth in China’s manufacturing sector is relatively low, with an average of 0.6137. There is ample room for the development of green innovation growth in China, and the heterogeneity among industries is significant. Based on the gap in green innovation growth among manufacturing industries, we create three groups: the high green innovation group, middle green innovation group and low green innovation group. The industries in the high green innovation group, with a mean of 0.9775, can reach the forefront of green innovation growth, while the mean of the low green innovation industries is only 0.4381, which is significantly lower than the high green innovation group. In the high green innovation group, which includes industries that manufacture Tobacco; Articles for Culture, Education, Arts and Crafts; Sport and Entertainment Activities; Electrical Machinery and Apparatus; Computers, Communication and Other Electronic Equipment; Measuring Instruments; and Machinery and Transport Equipment, green practices, are the strongest, and the driving effect of green technology innovation is remarkable. Most of these industries are technology-intensive, their input–output efficiency (in terms of human and capital resources in technological innovation) is higher, and their energy consumption and environmental pollution are relatively low. Light industries, such as the Manufacture of Printing and Textiles, are at the middle level of green innovation, which also includes a number of high-tech industries and equipment manufacturing, such as the Manufacture of Metal Products, General Purpose Machinery and Medicines. To realize a transformation in green technology innovation, these industries can be further upgraded to achieve green growth, but they must pay attention to energy saving and improve the efficiency of their pollution emissions through more green technology innovations. Meanwhile, some high-tech manufacturing sectors have not yet realized the effects of low pollution and low energy consumption, indicating a lack of deep integration between technological innovation and green growth. The manufacture of Chemical Raw Materials and Chemical Products; the Processing of Petroleum; Coking; and the Processing of Nuclear Fuel have the lowest level of green innovation growth. The driving force behind technological innovation in these industries is insufficient, and they consume a large amount of energy and produce high emissions, causing serious damage to the ecological environment.
Regarding development trends (
Figure 1), most manufacturing is not showing growth in green innovation, and there is even a downward trend to a certain extent, with a large decline from 2008 to 2011. In 2012, the Chinese government vigorously implemented an innovation-driven development strategy, and continued to strengthen its green development policy, leading to some improvements to green innovation in manufacturing. However, due to the weak foundation of endogenous innovation and higher operating costs of energy and environmental technology, manufacturing cannot realize the “Porter effect” in a short time. Therefore, manufacturing does not show sustainable green innovation growth in 2013–2014. The concrete distribution of best practice manufacturing in Green innovation growth (2008–2014) is presented in
Supplementary Materials.
5. Empirical Results and Discussions
To examine how external knowledge sourcing affects green innovation growth given the heterogeneity of R&D thresholds, we first estimate the number of thresholds to determine the form of the model. Then, the F statistic and
p-value are obtained by the bootstrapping method (
Table 4 and
Table 5). We find that a single threshold is significant at the 5% level and the double threshold is significant at the 1% level, while the triple threshold is not significant because the bootstrap
p-value is 0.954. Therefore, further analysis is based on the double threshold model.
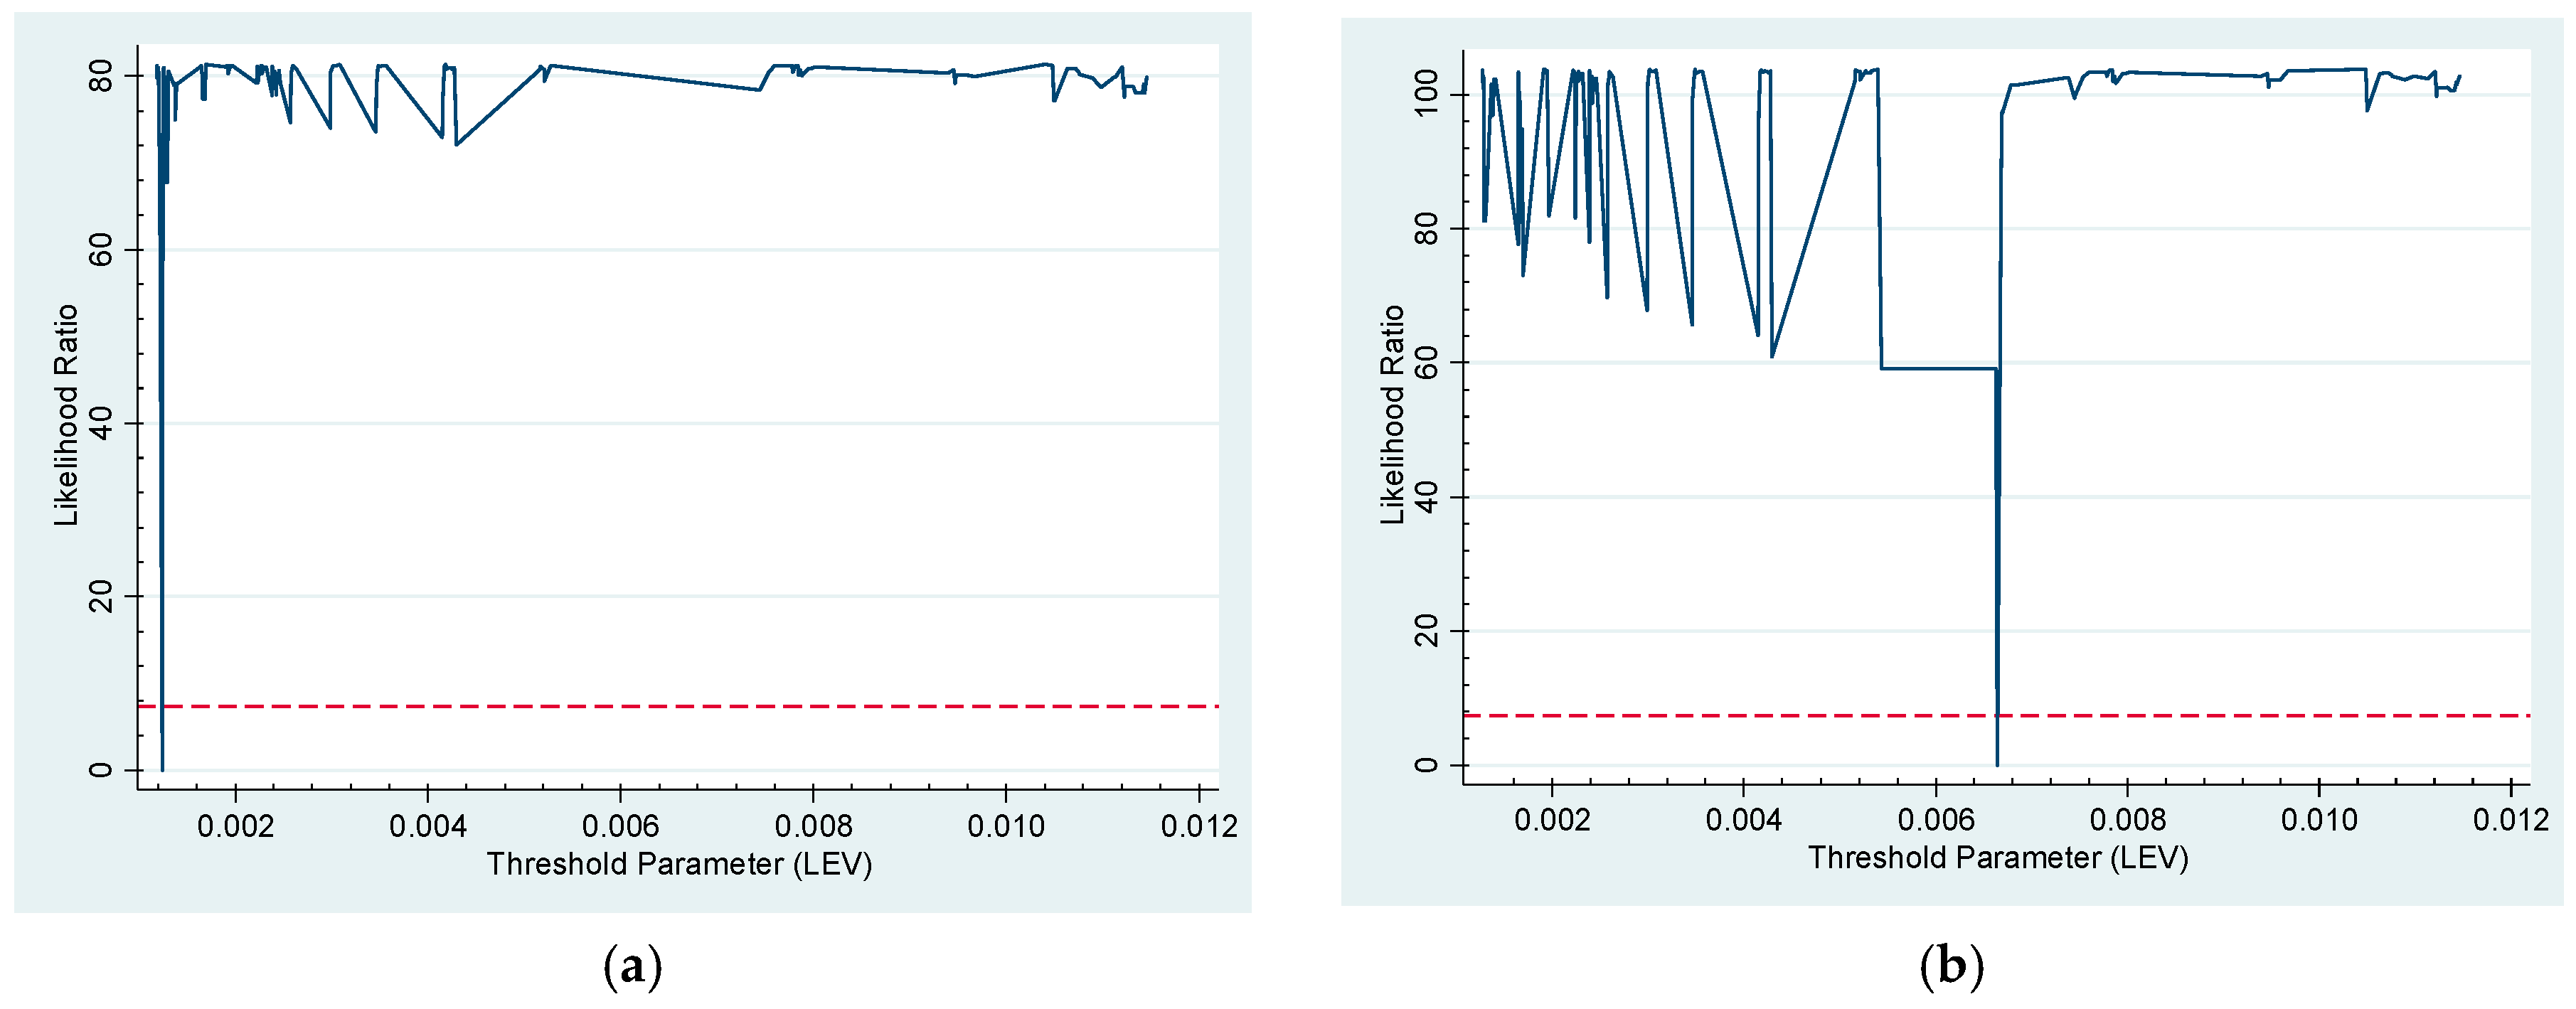
According to threshold theory (details for estimation techniques of panel threshold models are provided in Hansen [
46]), the effects of external knowledge sourcing on green innovation growth include a significant double threshold for R&D level: the threshold values are 0.001 and 0.007, which are within the 95% confidence intervals [0.001, 0.001] and [0.007, 0.007], respectively. Thus, we can divide the sample into different regimes: low level of R&D (LEV ≤ 0.001), middle level of R&D (0.001 < LEV ≤ 0.007) and high level of R&D (LEV > 0.007). The function chart of the threshold variable “likelihood ratio” sequence, with the well-defined change in threshold value, shows the structure of the estimate and the confidence interval (
Figure 2). (We use the likelihood ratio
to construct the “non-rejection region” showing the valid confidence interval of
γ. The “non-rejection region” at the confidence level of
is a series of
γ values that meet
. That is, when
(
is a significant level,
= 7.35 at 95% confidence level), we cannot reject the original hypothesis that the threshold estimate is equal to the true value (
). This corresponds to the horizontal line in the
Figure 2.)
Then, based on different regimes, we further use the dynamic estimation method of the first-order difference GMM to estimate the partition coefficient between different regimes.
Table 6 reports the estimates of the effects of external knowledge sourcing on green innovation growth. Overall, external knowledge sourcing has a significant negative effect on green innovation growth in manufacturing. With improvements in R&D level, there are differences in the mechanism of external knowledge sourcing: When the R&D level is lower than the threshold value 0.001, external knowledge sourcing has a significant negative impact on green innovation growth at the 1% level; and between 0.001 and 0.007, this negative impact is significantly weakened, but there is still a certain degree of limitation. When the threshold value is higher than 0.007, the negative effect is further weakened, and external knowledge sourcing is the minimum limit to green innovation growth. The distribution of manufacturing in these different threshold intervals each year is provided in
Supplementary Materials. Statistically, this presents a threshold characteristic: when the R&D level is higher than the critical value, the negative effect of external knowledge sourcing on green innovation becomes smaller and smaller.
Normally, to improve knowledge accumulation, external sourcing is necessary. However, we found that this is clearly not true for developing countries, where there is a large “gap”. This finding demonstrates that there may be a substitutional relationship between R&D and external sourcing under the influence of R&D level. When developing countries accumulate knowledge, internal R&D becomes more efficient, and the enterprise can use more R&D to replace external sourcing. At a certain level of R&D, and with an increase in external investment, R&D begins to see diminishing marginal returns; at this point, R&D and external sourcing still essentially have a simple substitutional relationship.
In China, the distribution of innovation resources is significantly uneven across industries. Industries with high R&D in manufacturing focus on R&D investment and endogenous innovation, external knowledge sourcing has long been neglected, and the diversified innovation effect is not fully developed. In contrast, industries with low R&D levels exhibit over-reliance on external cooperation and technology acquisition and will damage their industry’s R&D initiatives and encounter problems with absorption and intellectual property [
57], which will eventually reduce the positive spillover effect of external knowledge sourcing (Substitution effect). R&D is the intrinsic basis for the process of green innovation in industry, and corresponding knowledge and technical support are needed for every link in R&D, organization, design and manufacture, sales and other aspects of green innovation. However, most of manufacturing’s R&D foundation is weak due to resource constraints. R&D intensity in China is only approximately 0.91% (2014), and enterprises with R&D institutions accounted for only 13.34% (2014) of all enterprises. Coupled with the urgent problems of energy shortage, expensive resources and environmental protection, there are no strong foundational conditions for manufacturing to expand its external activities, and the corresponding driving effects are limited.
When the industry has accumulated a higher R&D base, industrial knowledge helps external sourcing identify the most worthwhile market issues and then optimize innovation performance, making up for the diminishing marginal returns of R&D investment [
58]. Meanwhile, knowledge stock has absolutely independent property rights and can be applied to internal R&D at a lower cost, thereby promoting the commercialization of internal R&D and innovation output [
59,
60]. Consequently, the industry will promote green innovation growth and gradually realize the transformation to green innovation.
Finally, the lag variable is significant at the 1% level, which indicates that the dynamic panel threshold model constructed in this paper is reasonable. The Sargan tests show Prob > χ2 = 0.0539, which does not reject the original hypothesis that the instrumental variables are reasonable at the 5% level. The AR(1) and AR(2) test (
Table 7) also shows that the model setting and the use of a first-order difference GMM are also more reasonable.
6. Conclusions
This study attempts to measure green innovation growth with environmental and energy regulations based on the SBM-DDF method and then takes the heterogeneity of the R&D threshold as the breakthrough point to examine the nonlinear effects of external knowledge sourcing on green innovation growth by developing a dynamic panel threshold model. Accordingly, the research provides interesting insights into the implications of green innovation.
The average level of green innovation growth in China’s manufacturing is relatively low. There is considerable room for improvement in green innovation growth in China, and the heterogeneity among industries is significant. The growth effect of green innovation is strongest in the manufacture of Tobacco; Articles for Culture, Education, Arts and Crafts; Sport and Entertainment Activities; Electrical Machinery and Apparatus; Computers, Communication and Other Electronic Equipment; Measuring Instruments; and Machinery and Transport Equipment. Light industry, such as the Manufacture of Printing and Textiles, is at the middle level of green innovation; it also includes a number of high-tech industries and equipment manufacturing, such as the Manufacture of Metal Products; General Purpose Machinery; and Medicines. The manufacture of Chemical Raw Materials and Chemical Products, Processing of Petroleum, Coking, and Processing of Nuclear Fuel has the lowest level of green innovation growth. These industries consume a large amount of energy and have high pollution emissions; they urgently need to be transformed by green innovation. Moreover, there is very little growth in green innovation in most manufacturing, and there is even a downward trend. The “Porter effect” cannot currently be realized in China. Finally, external knowledge sourcing has a significant negative effect on green innovation growth but with a non-linear relationship to the “threshold effect”: when the R&D level is higher than the critical value, the negative role of external knowledge sourcing in driving this mechanism becomes smaller and smaller.
From the above analysis, this study has several policy implications. First, as the main body that can promote the process of industrialization and modernization in China, manufacturing exhibits a low level of green innovation; it obviously has serious problems of environmental pollution and energy consumption. The manufacturing industry must strengthen its drive toward innovation integration and green development to achieve sustained growth in green innovation. Only by strengthening the integration of innovation-driven and green development can manufacturing achieve sustainable growth. Second, Chinese government needs to give full consideration to the gaps among industries and then implement a system of green innovation. On the one hand, the government should focus on supporting and developing strong green innovation industries and increase incentive policies such as tax, financial and other preferential incentives for these industries to further enhance the level of green innovation growth; it should also encourage these industries to play a leading role in the development of green innovation. On the other hand, for industries with low green innovation, the government should actively coordinate development planning and flexibly choose diversified environmental regulation tools, such as environmental taxes, sewage charges, clean development mechanisms (CDM), and carbon trading and planning, to encourage technological exchanges and cooperation between low and high green innovation industries, further promote the diffusion and spillover of knowledge and technology, and realize the balance of green innovation growth across these industries. Third, China must be aware of the adverse effects of external knowledge sourcing on green innovation growth. Therefore, manufacturing should properly control the input costs of external sourcing and establish a “bridge” between R&D and external sourcing by using the government’s preferential policies to promote cooperation on green innovation, improving the industrial green innovation system to absorb external knowledge of green technology, and optimizing green production and technical conditions, which will in turn expand R&D for manufacturing to effectively improve external green innovation. Finally, considering the threshold effect of R&D level, when choosing an innovation path for green innovation growth, developing countries need to select their optimal innovation paths depending on the distribution of the level of R&D across different industries. The government should further establish and improve the efficient implementation platform and the monitoring mechanism for the rational screening, introduction, transformation and accumulation. When the country reached a developed basis of R&D, the government can gradually turn to external knowledge sourcing to effectively drive the development of green innovation through the rational allocation of diversified innovation path.
There are several limitations of this study relating to: (i) the limited number of observations; (ii) the effective decision-making units (DMU) of green innovation growth cannot be further differentiated; (iii) presence of other unknown threshold factors in the relationship between external knowledge sourcing and green innovation growth; and (iv) there may also be more driving paths in the regression model as well as potential interactions between them. The limited number of observations is offset by the fact that multiple adjustments in statistical caliber of manufacturing enterprises by National Bureau of Statistics of China, especially in the classification of manufacturing industry, there are differences in the statistical aspects of science and technology and environmental energy. The data of external knowledge activities were published from 2008; hence, our data starts from 2008. Second, regarding the DMU of green innovation growth, such as industries in high green innovation group, their green innovation evaluation value reached the highest value 1.0000. However, it is important to note that this does not mean that no further improvement necessary for these industries, rather it is due to the limitations of our model being unable to distinguish differences among these effective DMU of green innovation growth. The last two limitations indicating that the influence of the external knowledge sourcing on green innovation growth may have other threshold effects beyond R&D level in the complex green innovation system. There is a threshold created by a critical point in open innovation system [
26,
27], and this includes threshold factors such as GDP level, education level, pollution events, command-and-control regulation and market-based regulation, which may have significant influence on green innovation [
48]. Moreover, in addition to external knowledge sourcing, the diversified innovation paths also include internal knowledge sourcing, non-R&D and others, and possible interactions between these driving paths may have been overlooked. For instance, internal and external R&D may be complementary to varying degrees but may also substitute for each other [
29]. Green innovation may be affected by interactions between these diversified driving paths. However, in the regression model, only uncorrelated explanatory variables were included in order to avoid biased regression results due to multi-collinearity [
61]. Adding more driving paths in the model is not feasible because of the low number of observations.
For future work, there is a need for an improved evaluation system to subdivide and compare the structure of effective decision-making units, and further identify and measure the difference in green innovation growth among high group industries. Meanwhile, it would be necessary to empirically study the underlying threshold factors and driving paths. Future research may analyze interactions between diversified driving paths on green innovation with various threshold constraints.


