
Modelling Land Use and Transport Policies to Measure Their Contribution to Urban Challenges: The Case of Madrid


Abstract
:1. Introduction
2. Materials and Methods
2.1. Determining the European Urban Challenges
2.1.1. Challenges of Cities as Living Environments
2.1.2. Challenges Related to the Efficiency of Urban Systems
2.2. MARS: A LUTI Model for the Case of Madrid
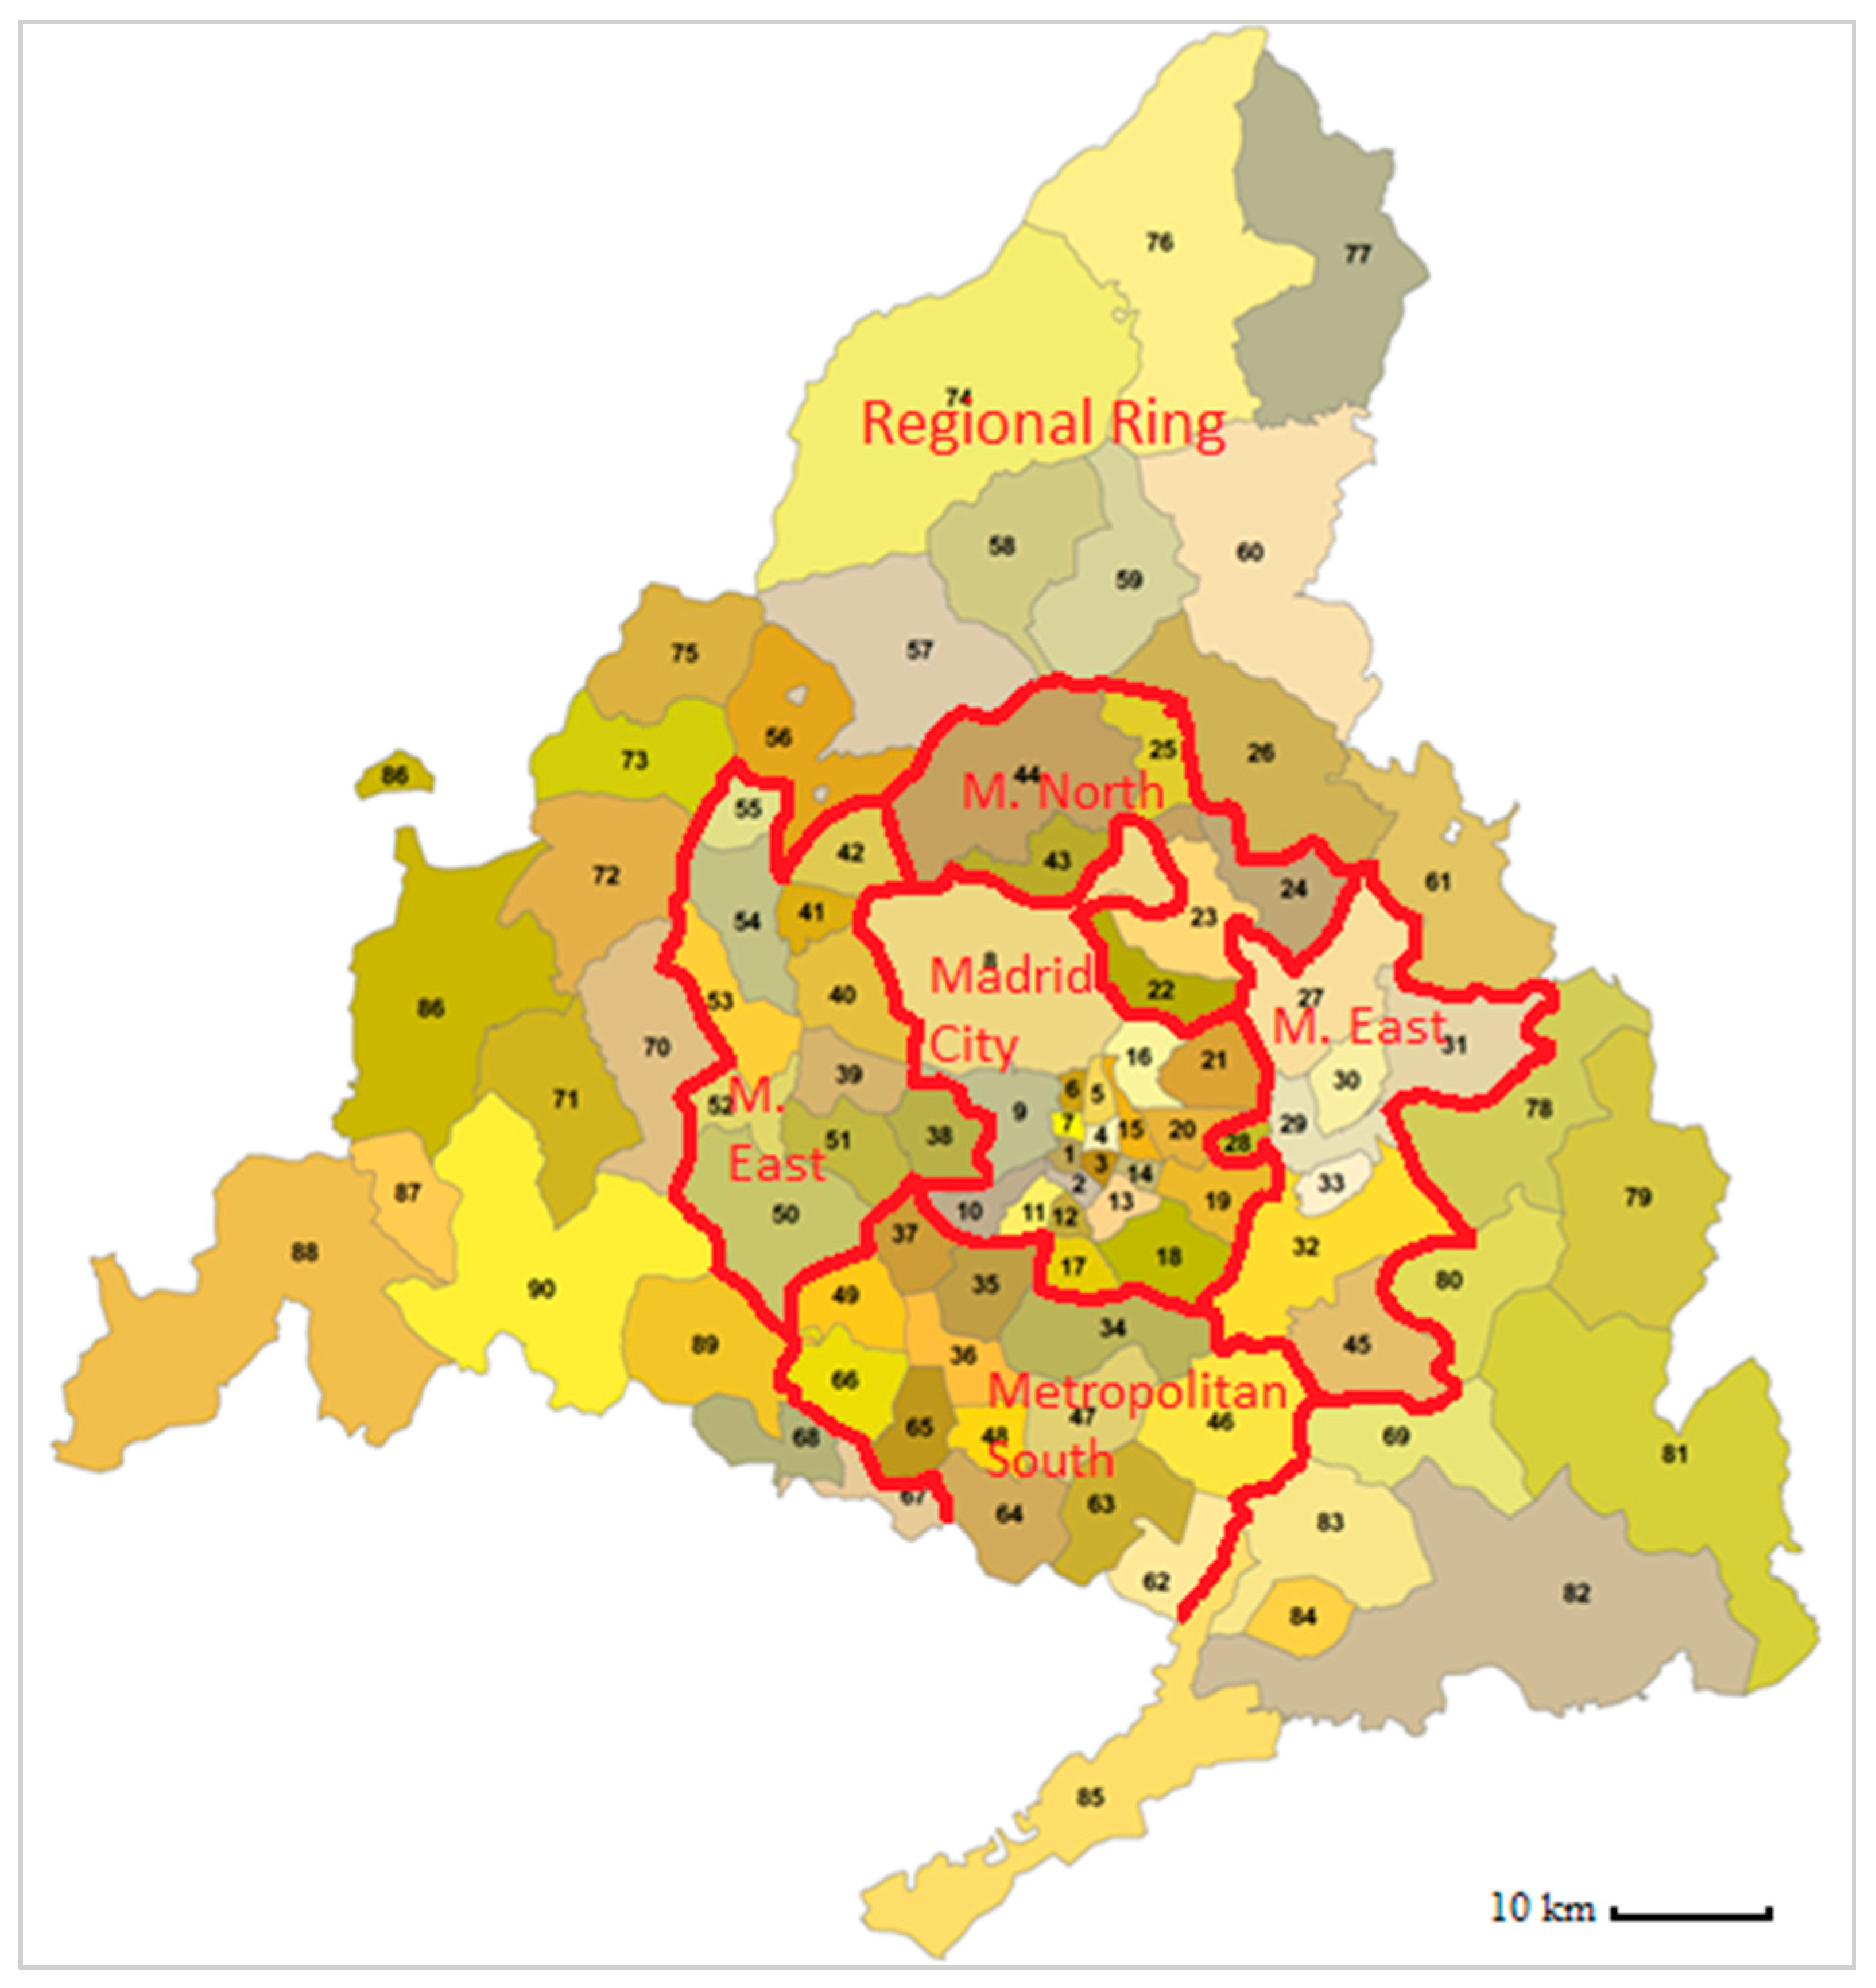
2.2.1. The Case Study of Madrid: Main Features of the Region and Regulatory Framework
2.2.2. Main Features of MARS Model for Madrid
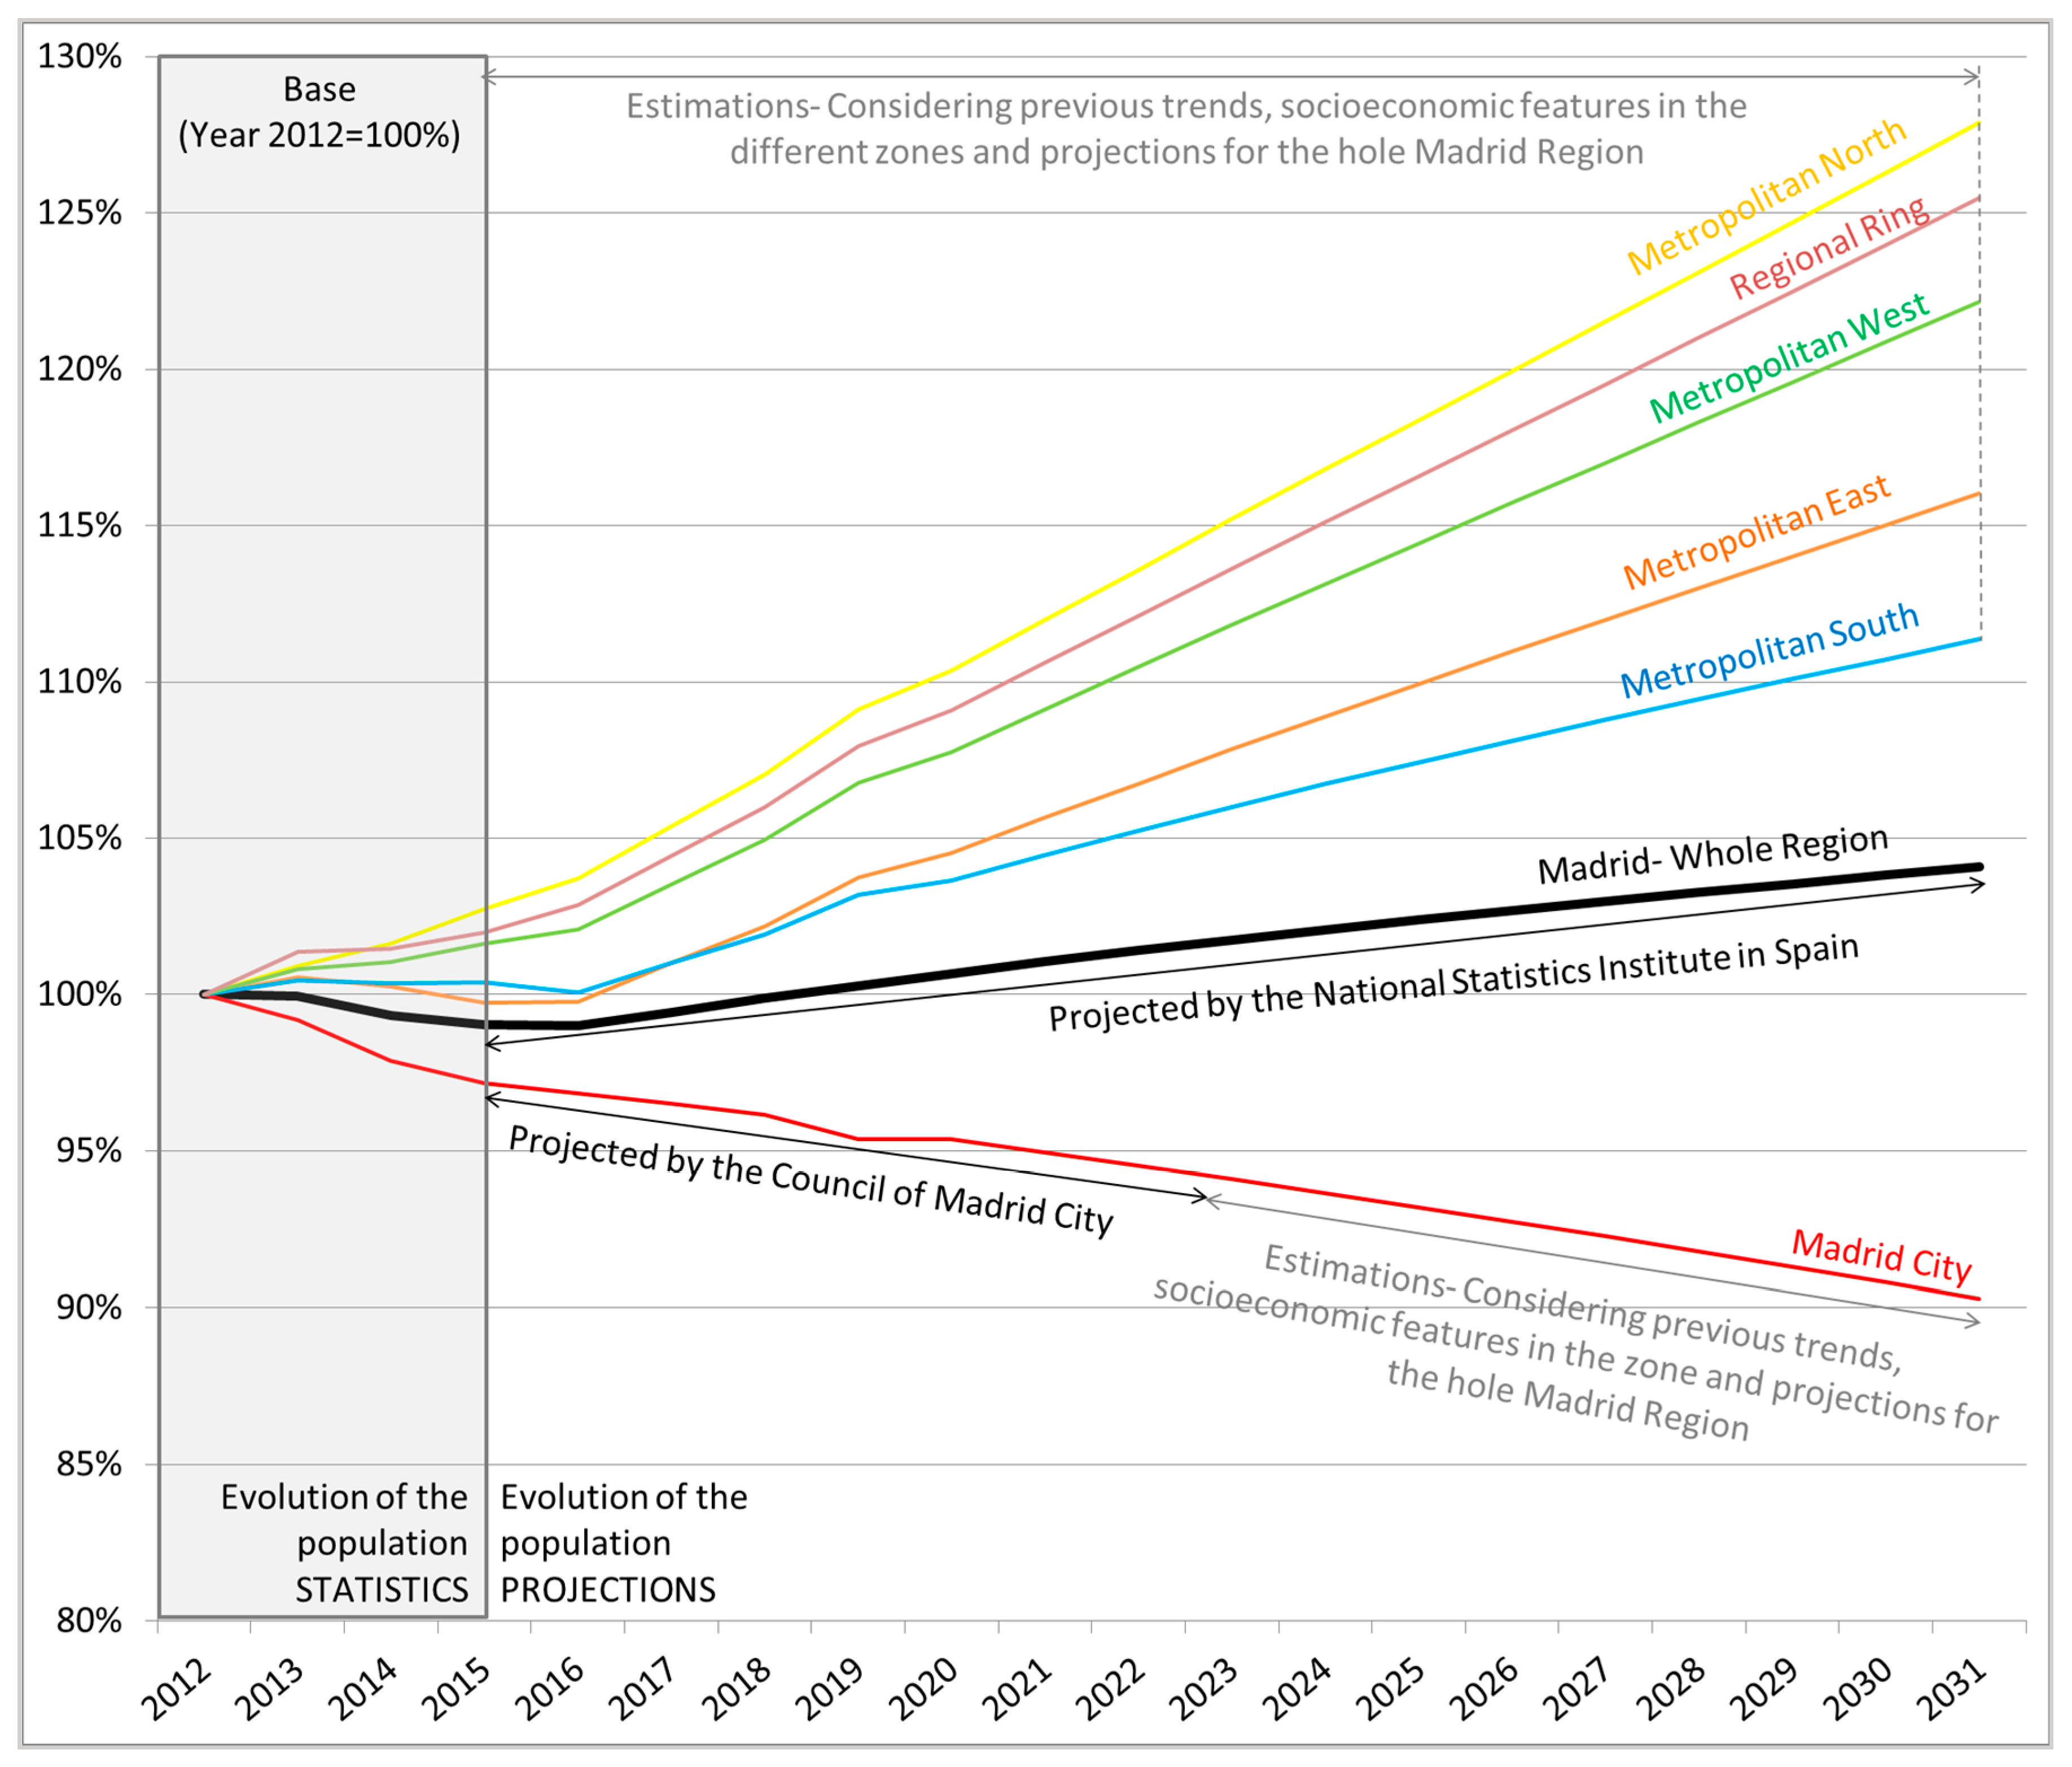
- Socio economic data, i.e., population per zone and population growth per aggregated region (city, metropolitan north, east, south or west and regional ring), household budget per zone, motorisation rate per zone, etc., were mainly obtained from the official statistical sources, provided by institutions at the city, regional and national levels [33,54,55].
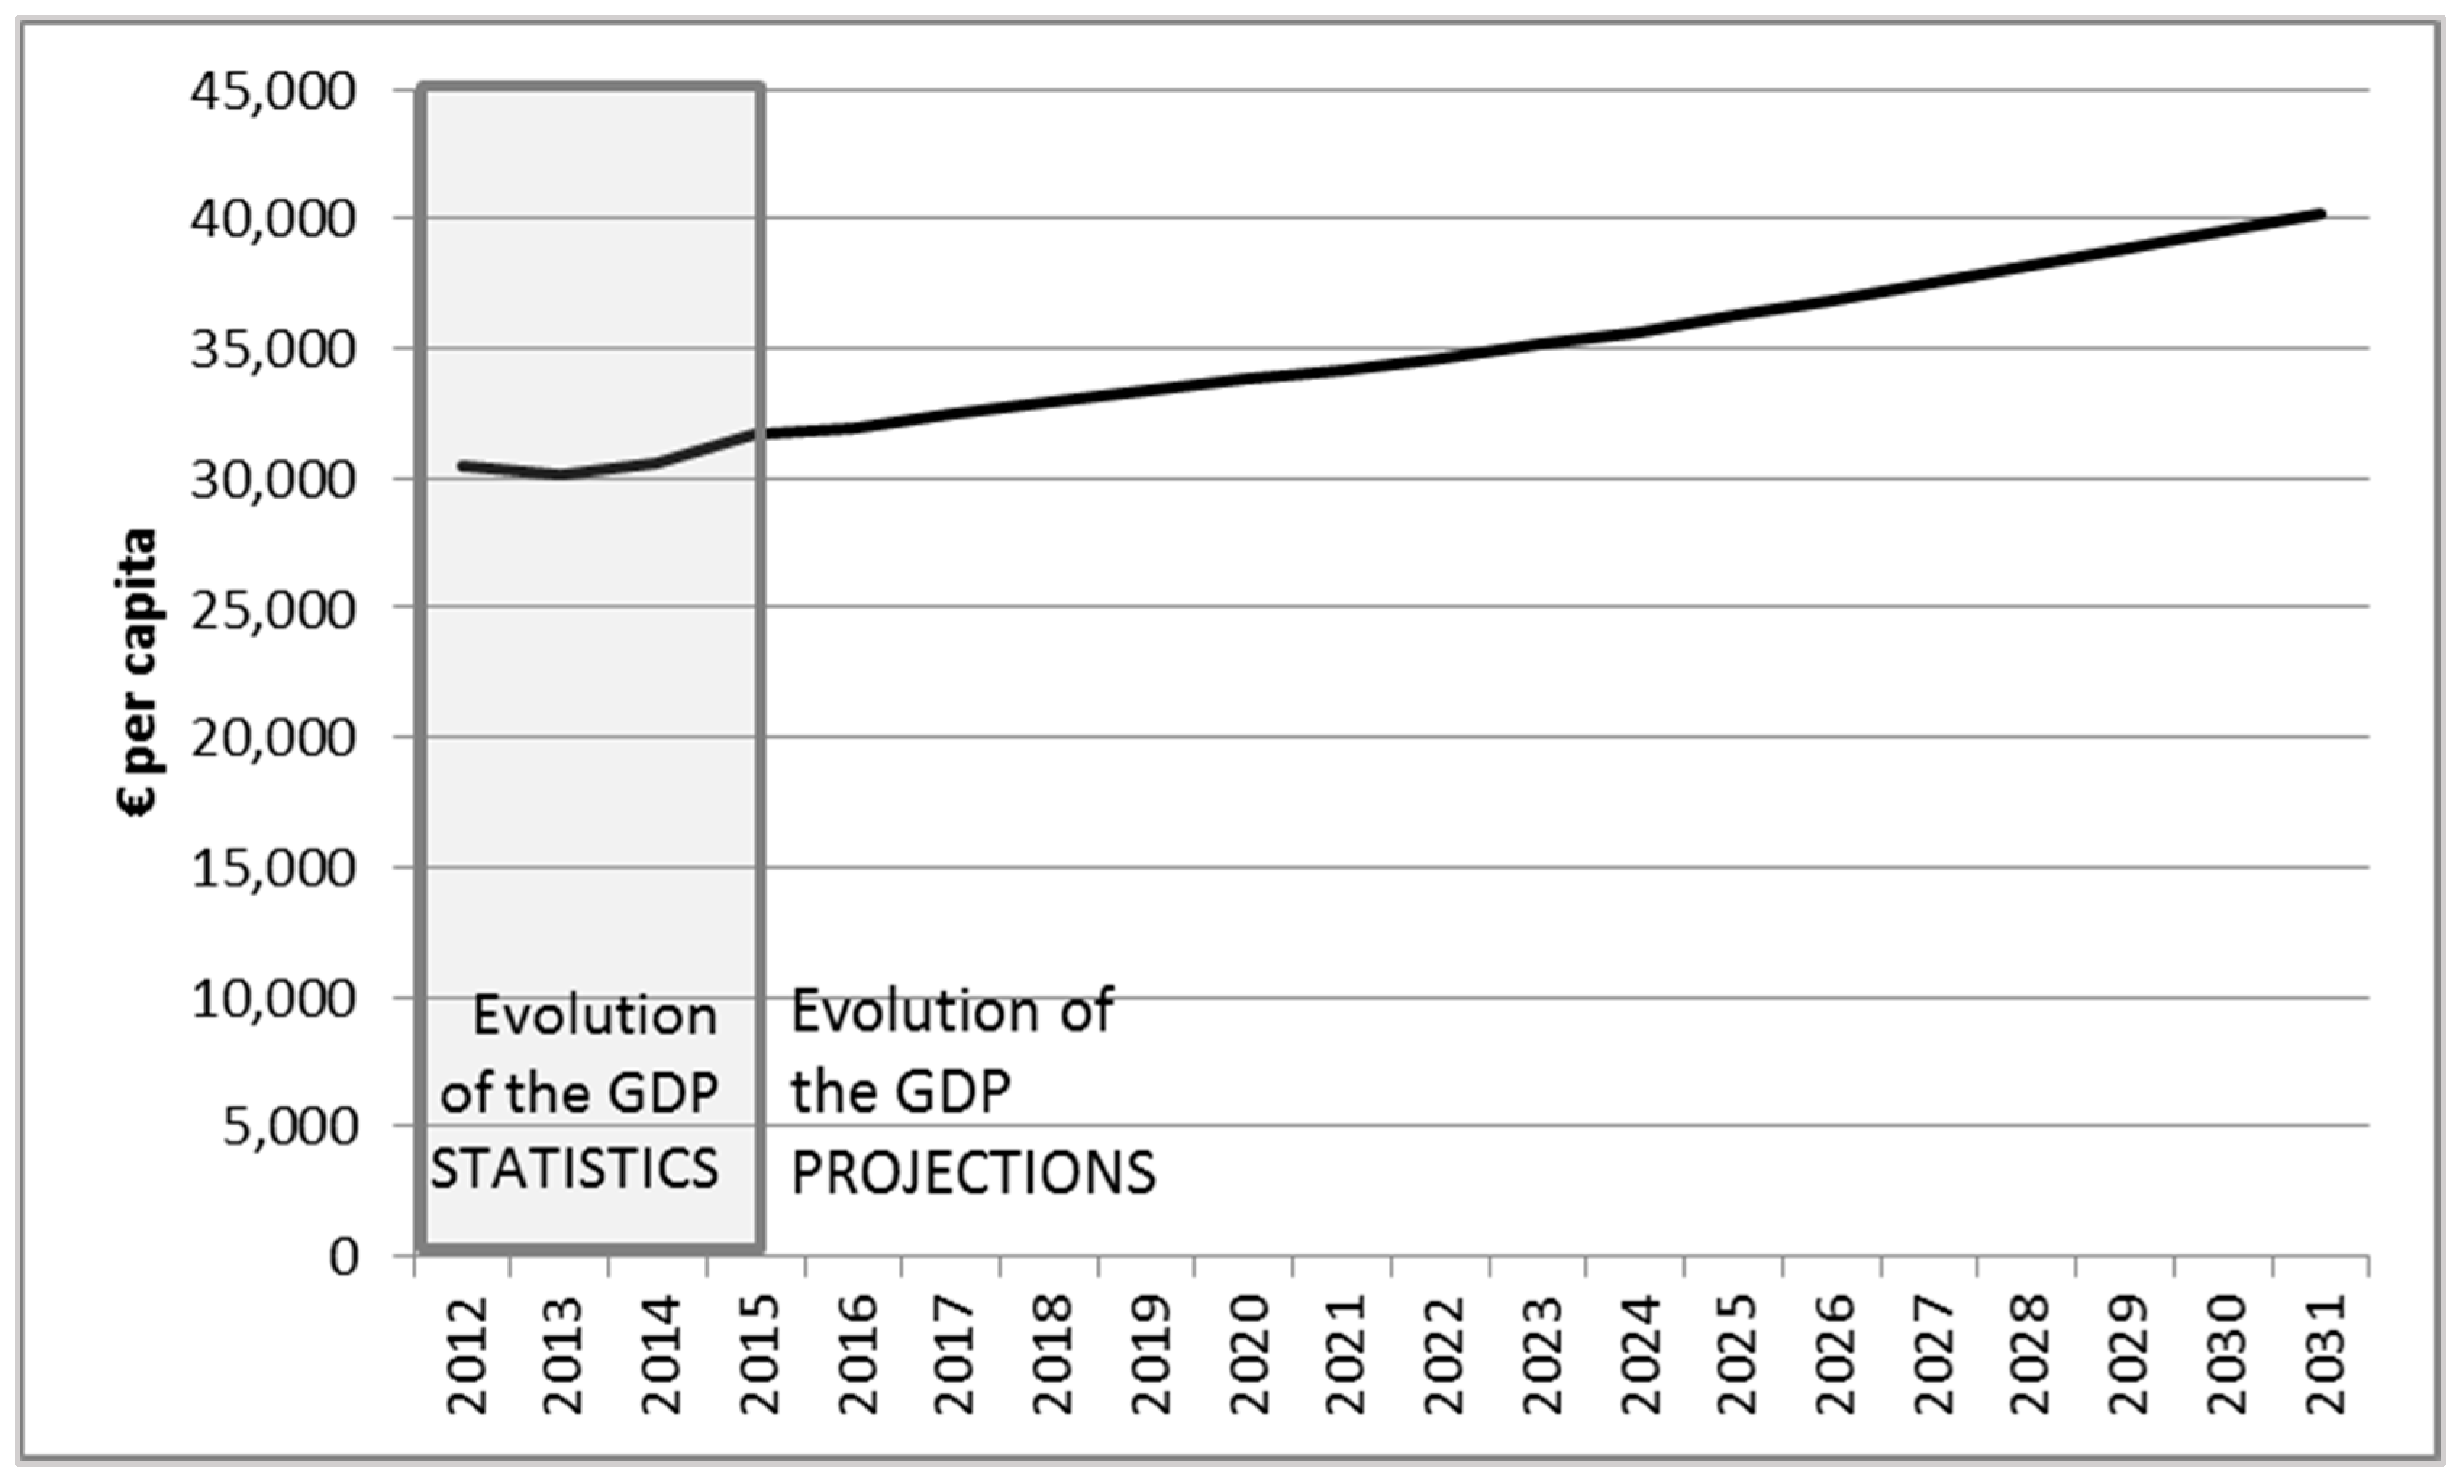
- Basic data on land use development and economic growth, i.e., the functional proportion of land use (resident, production and service), land prices, expected growth of economic activity etc., were mainly obtained from the structural statistic databases at the regional level [56], and from international databases containing economic projections [57].
- Basic data of transport mobility, i.e., trip distance, speeds and time between the zones in different modes, car operating costs, the value of time, car occupation rate, etc., since the MARS model is an aggregated model and does not have a transport network, were partly obtained from VISUM transport model, which was executed through road network of the model (e.g., [58]). Some other transport data were obtained directly from the CRTM [36]. Besides that, the Madrid MARS model was calibrated by using three household mobility surveys conducted in Madrid in 1996, 2004 and 2014. The calibration process involved adjusting the values for the MARS model as external variables.
2.2.3 Model Outputs for Policy Assessment
2.3 Policies Design and Implementation: Defining the Policy Scenarios
2.3.1 Do Nothing
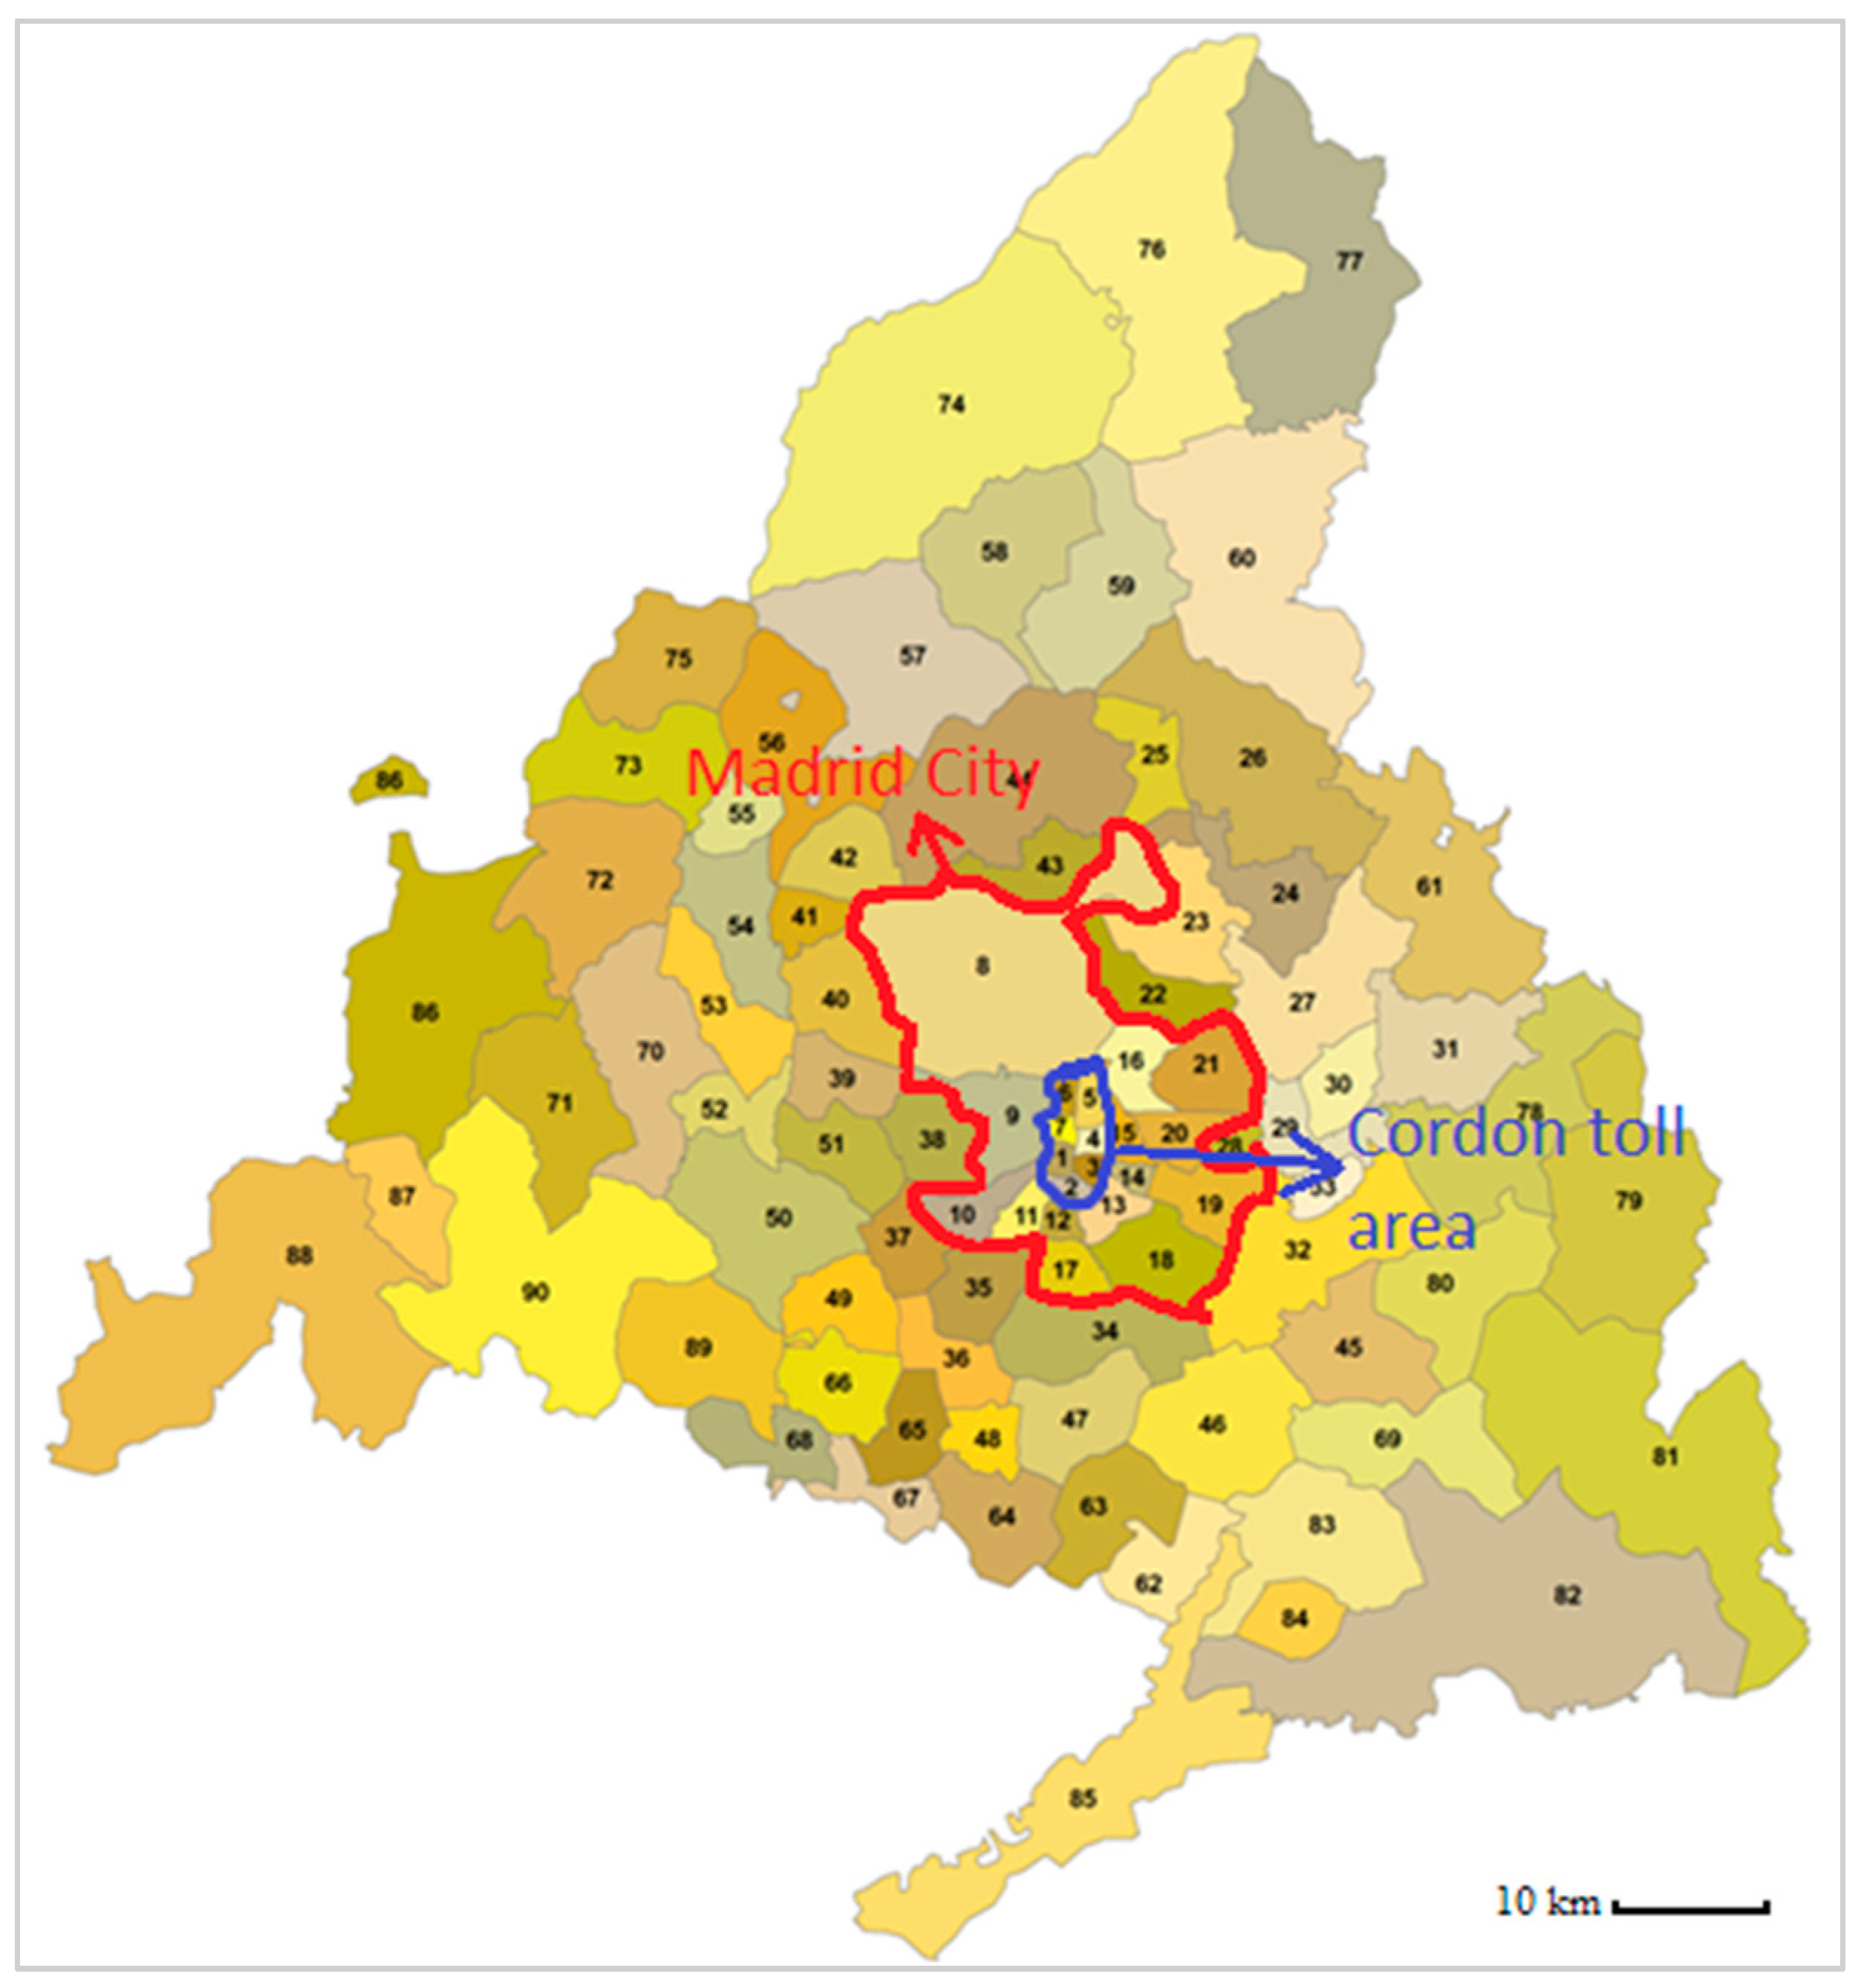
2.3.2 Cordon Toll and Public Transport Improvement
2.3.3. Teleworking
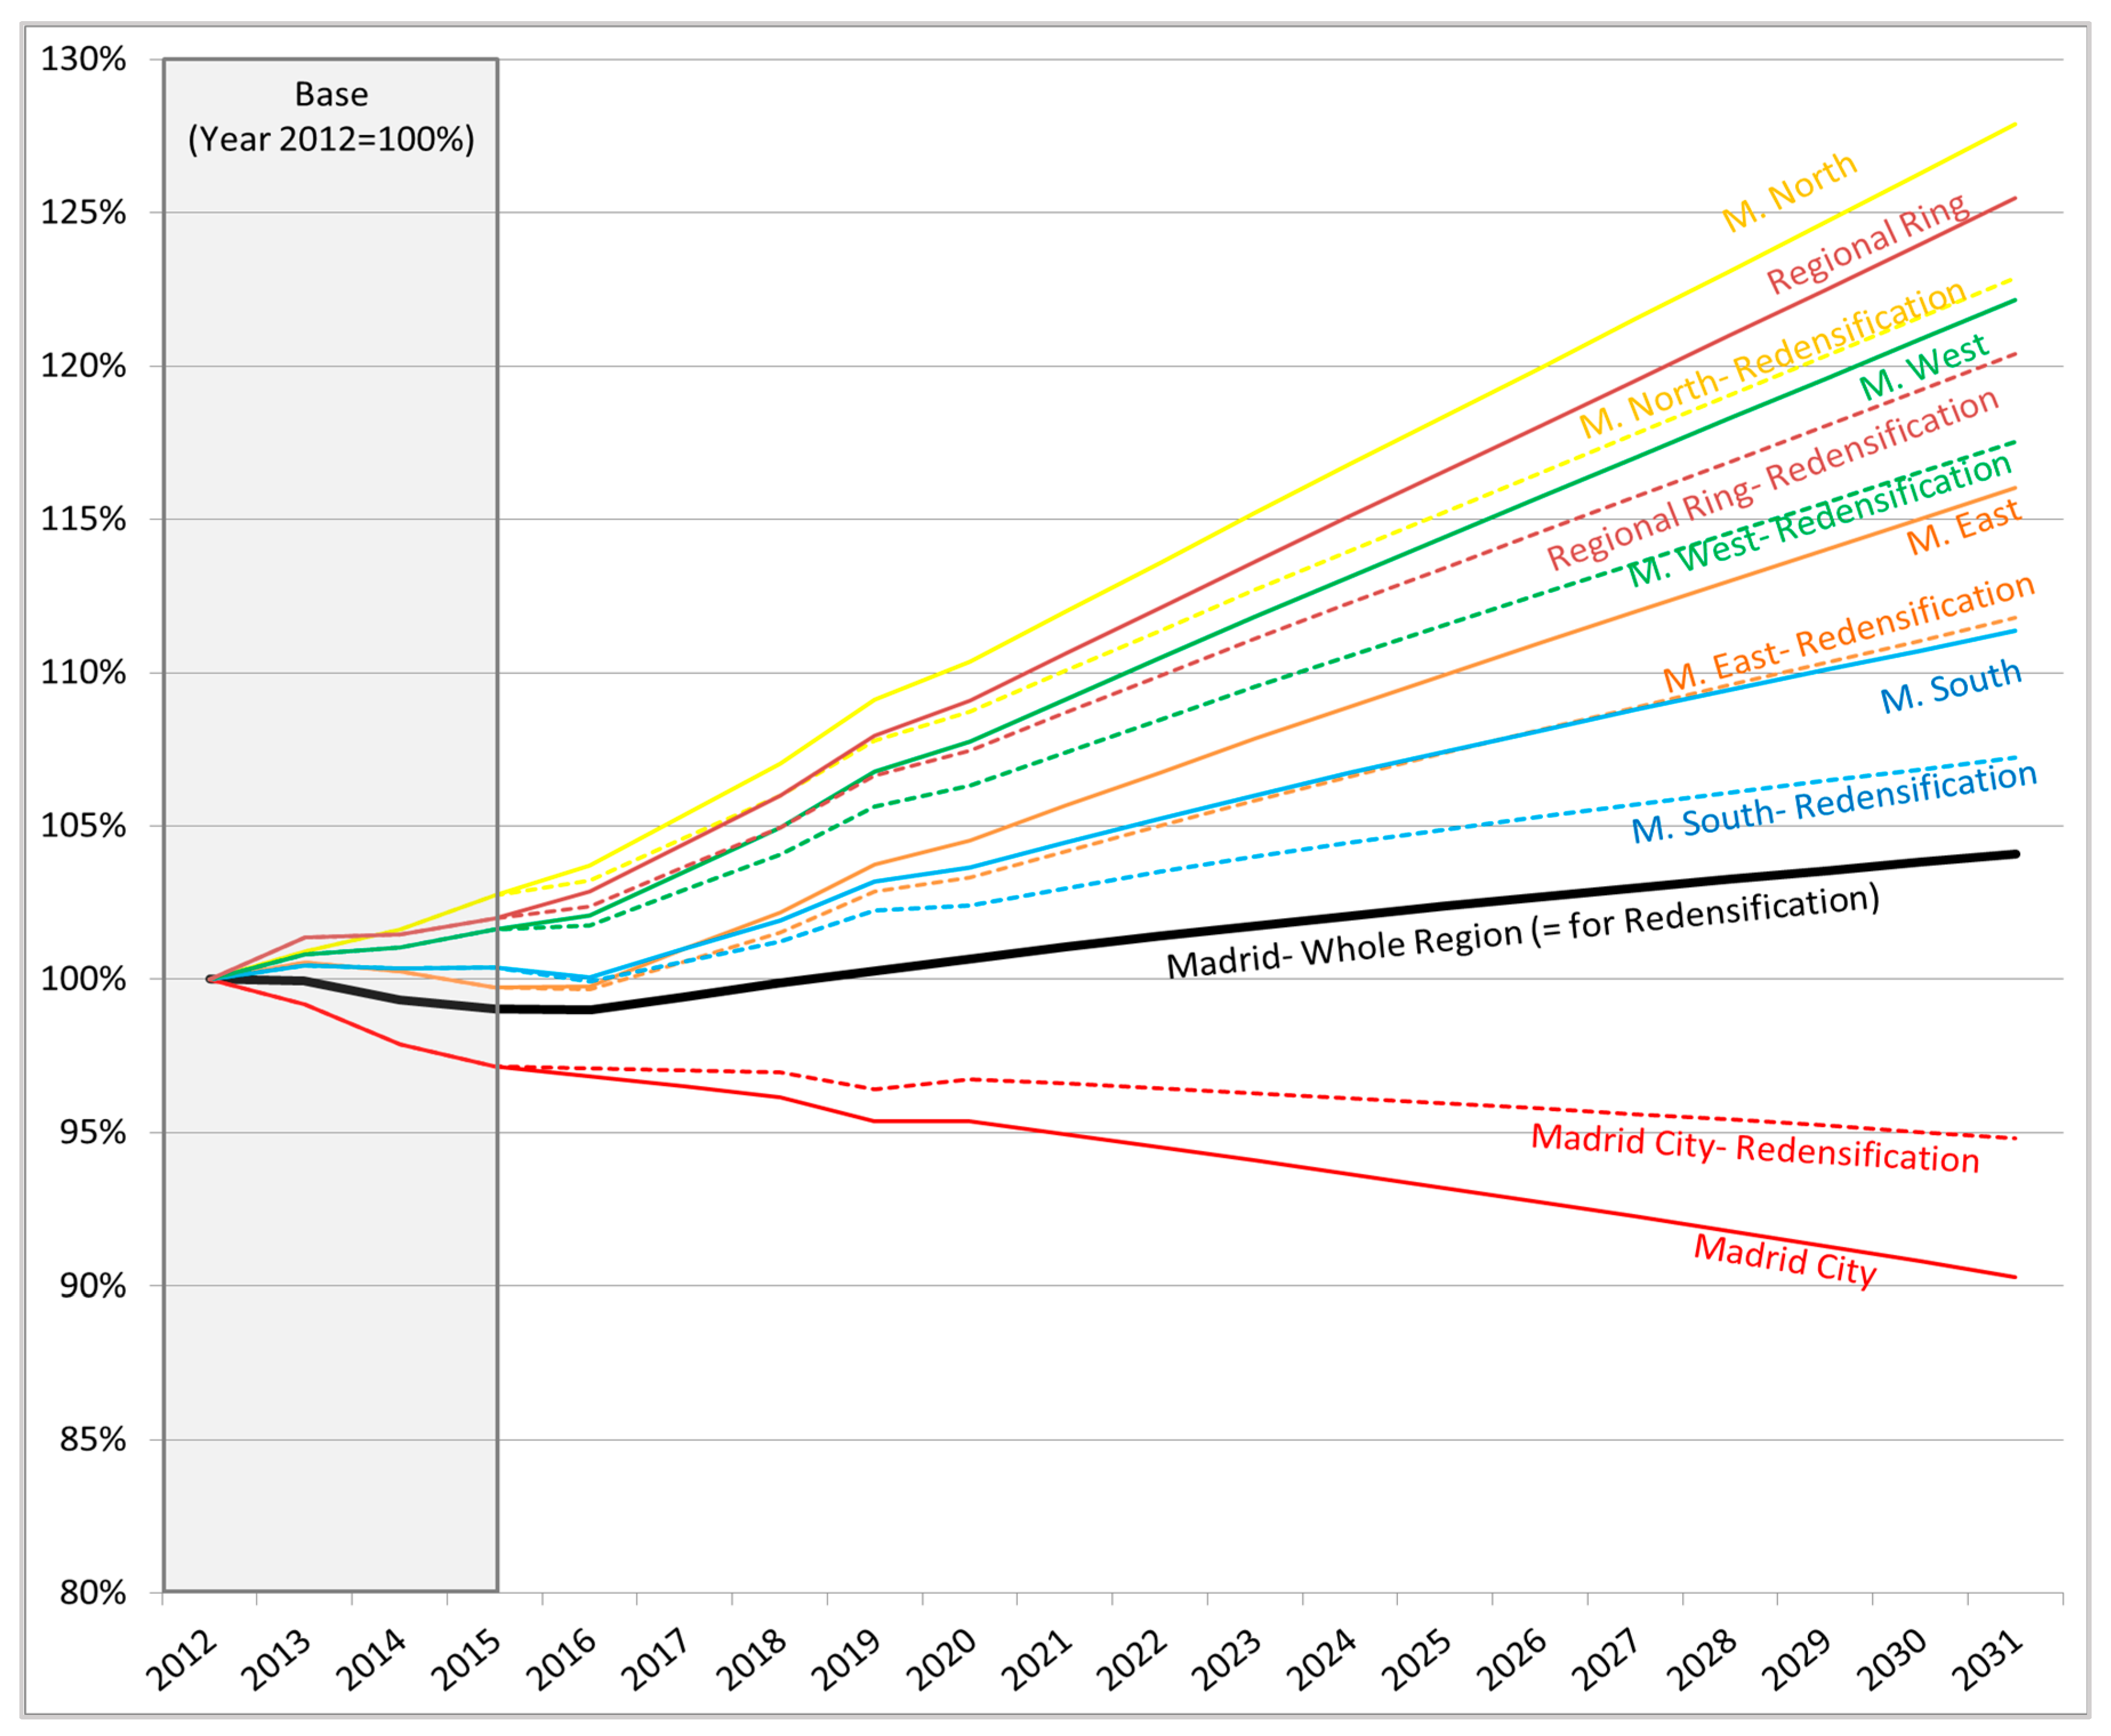
2.3.4. Re-Densification
3. Results
4. Discussion
5. Conclusions
Acknowledgments
Author Contributions
Conflicts of Interest
Abbreviations
| CBD | Central Business District |
| CRTM | Consorcio Regional de Transportes de Madrid (Public Transport Authority in Madrid Region) |
| GHG | Green House Gases |
| HOH | Home–Others–Home |
| HWH | Home–Work–Home |
| INE | Instituto Nacional de Estadística (National Statistical Institute in Spain) |
| LUTI | Land Use and Transport Interaction |
| MARS | Metropolitan Activity Relocation Simulator |
| OD | Origin–Destination |
| PT | Public Transport |
| PM | Particulate Matter |
| TOD | Transyt Oriented Developments |
Appendix A
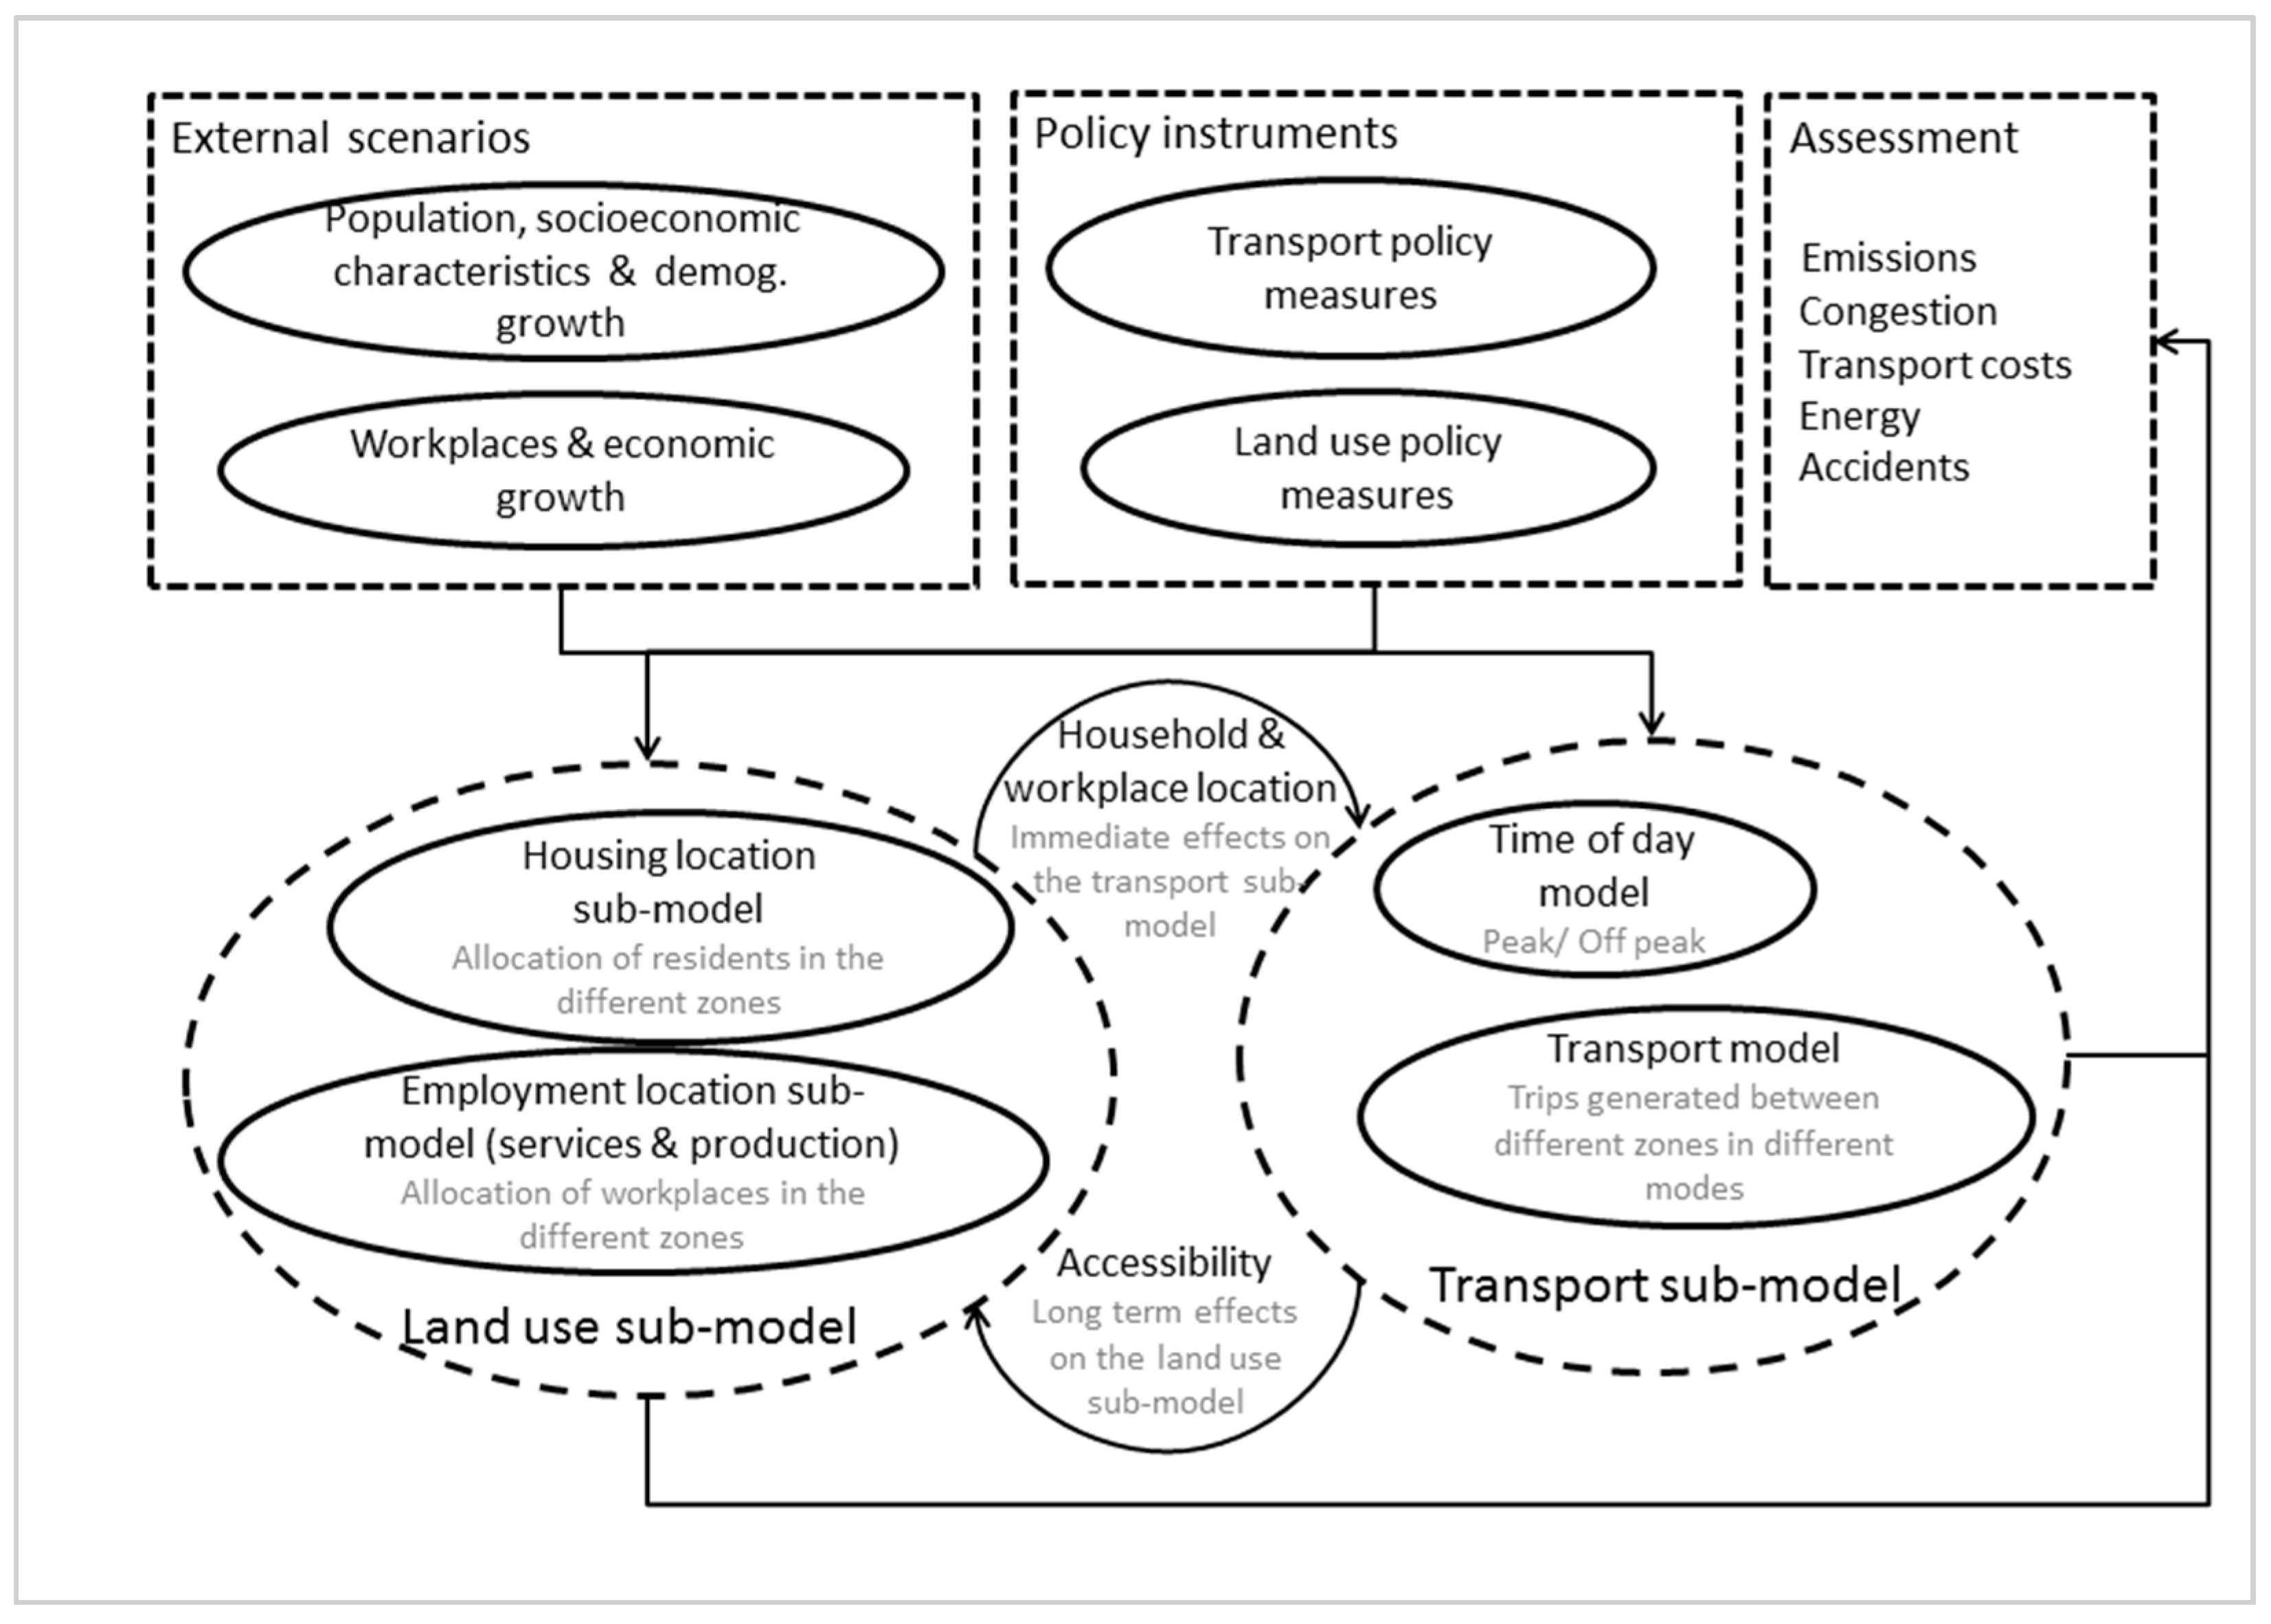
- The trip generation stage considers two types of trip purposes: work and others. This stage follows the overall principle of constant time budgets, supported by many studies [82,83,84,85]. The work-oriented trips, termed Home–Work–Home (HWH), generated in each zone i depend on the number of employed residents in the zone and on the average trip rate per person (Equation (A1)). The trips related to other purposes, termed Home–Other activities–Home (HOH), depend on the travel time available per person, which is calculated after the trips to work have been generated and distributed. The total travel time per capita and day is assumed to be constant.where Pi |HWH is the production of trips at zone i for tours HWH; r|HWH is the average trip rate per person for tours HWH, and Ei is the number of employed residents living in zone i.
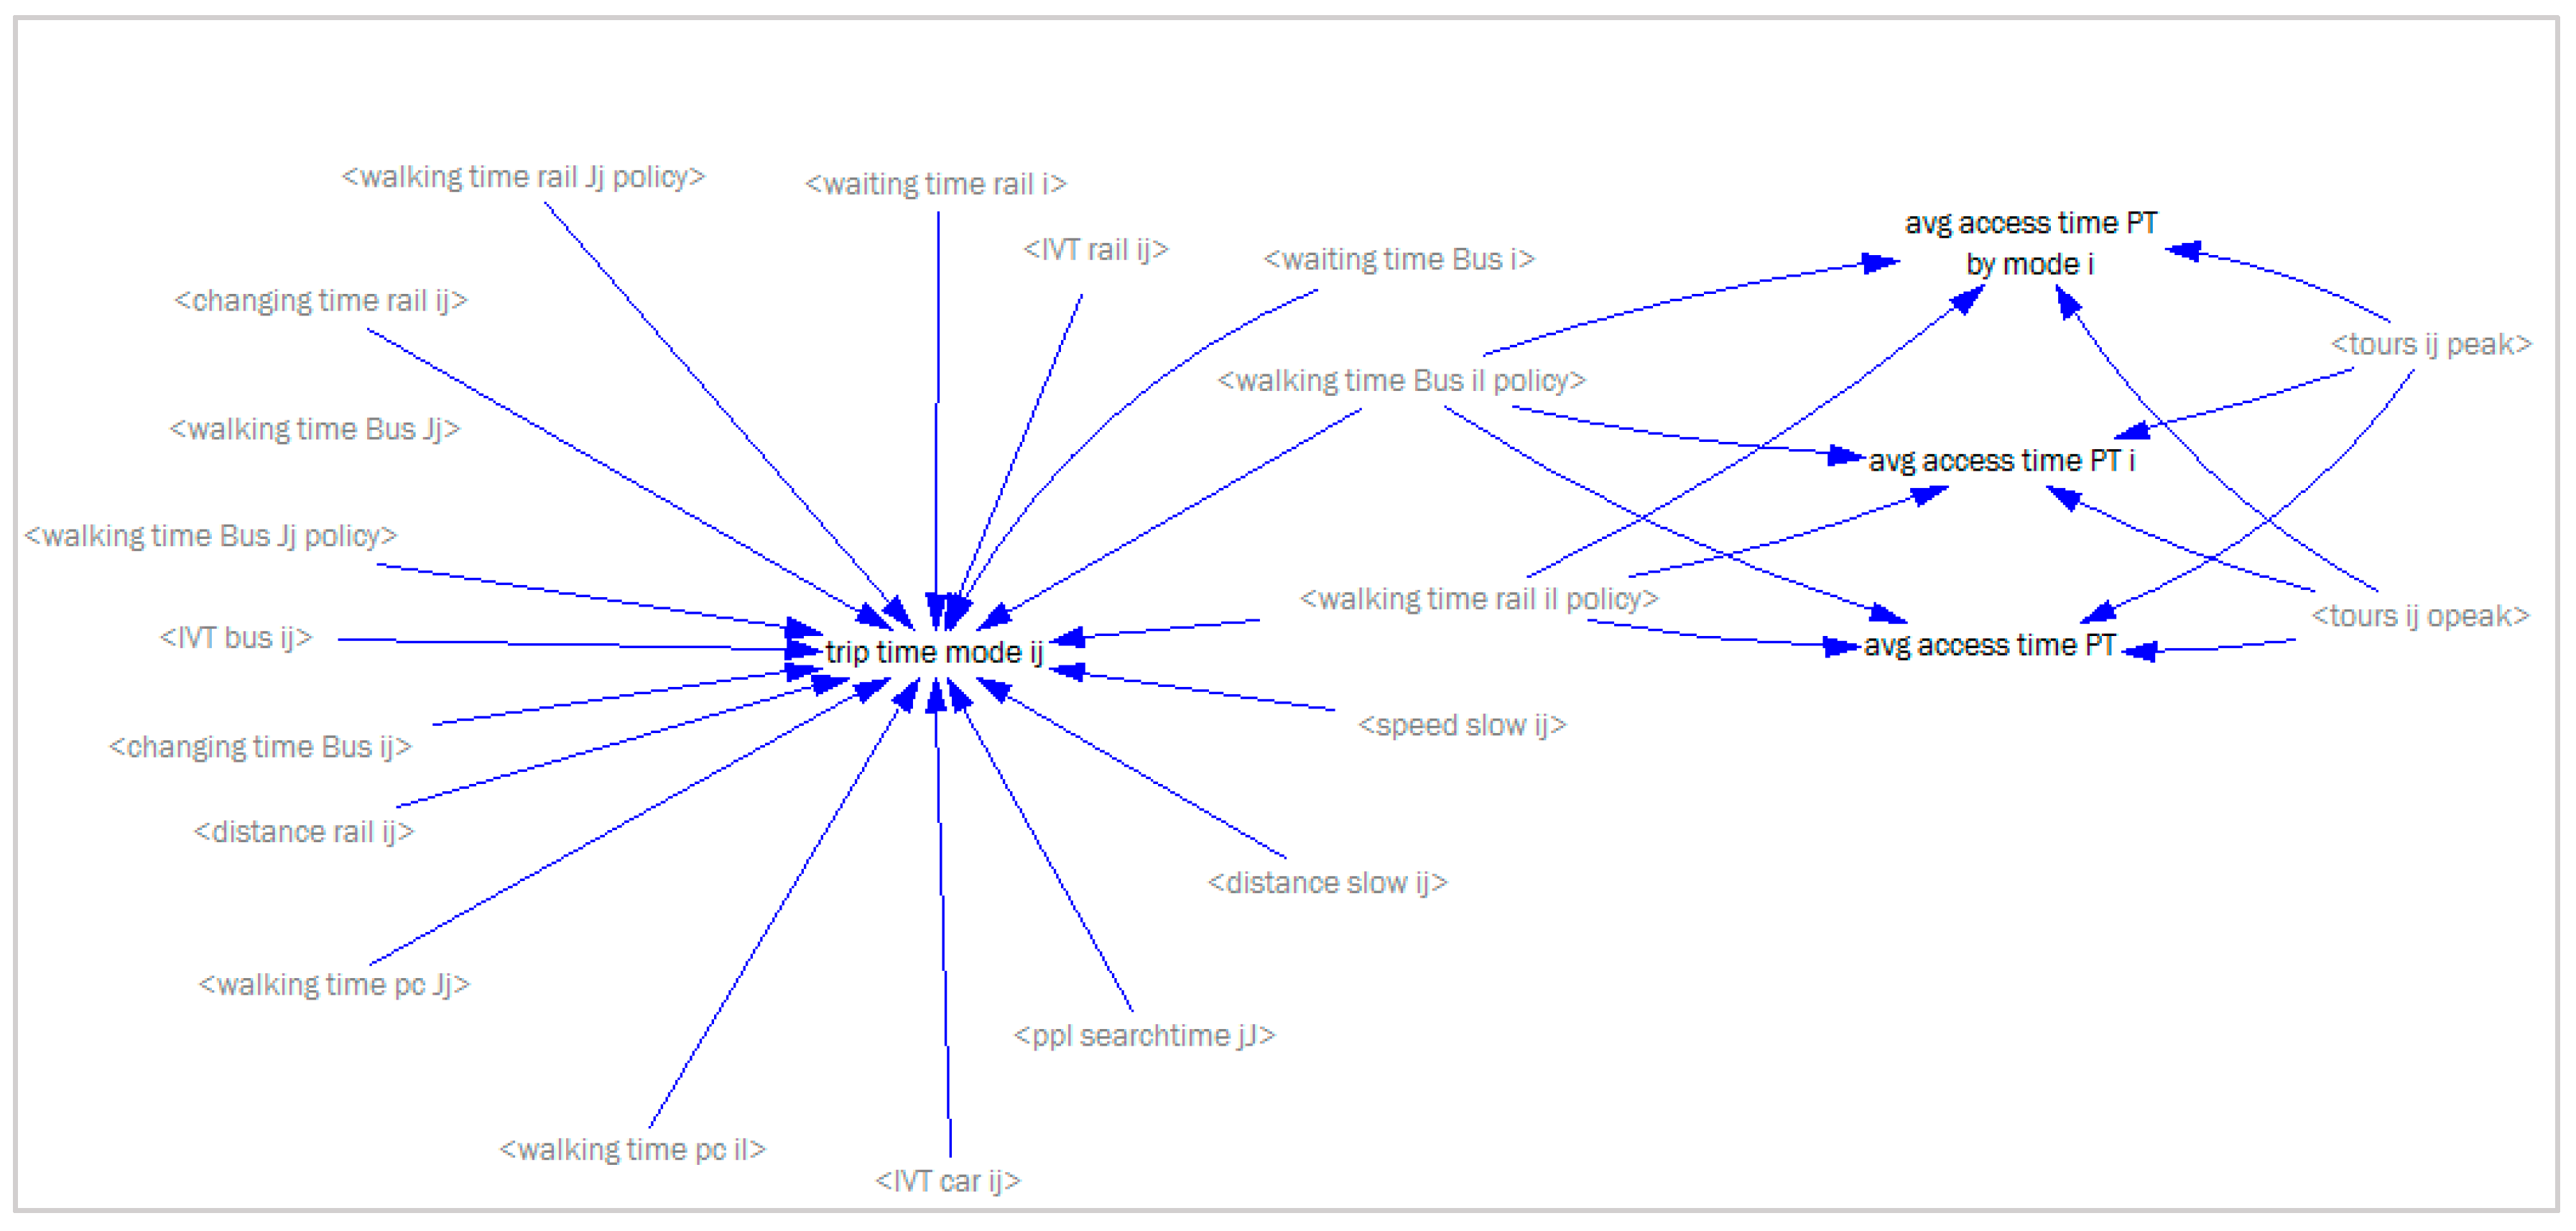
- The trip distribution and modal split take place simultaneously in the transport sub-model, using a combination of the analogy to the law of gravity and Kirchoff’s law from electrical engineering [32]. The trip attraction and mode choice is divided into HWH and HOH trips. The attraction of each zone, j, as a destination is given by the land use sub-model and depends on the activity for which the destination is chosen. For the trips HWH, the attraction depends on the number of workplaces in the destination zone. For the trips HOH, the attraction depends on the population living in the destination zone, and the existence of activities such as retail. Travel times and travel costs per mode and Origin-Destination (OD) pair give the different friction factors. Equation (A2) describes these simultaneous stages.where is the number of trips by mode m from zone i to destination j during the p period (peak or off peak hours); Pi is the production of trips at zone i, Aj is the attraction of zone j as a destination; and is the friction factor for a trip by mode m from zone i to destination j during the period p, including travel time and travel costs (which are calculated iteratively for the mode car, depending on the speed and the traffic flow).

References
- United Nations. Smart Cities and Infrastructure; United Nations Economic and Social Council: Geneva, Switzerland, 2016. [Google Scholar]
- European Union. Cities of Tomorrow—Challenges, Visions, Ways Forward; European Commission, Directorate General for Regional Policy: Brussels, Belgium, 2011. [Google Scholar]
- European Union. Making Our Cities Attractive and Sustainable; Publications office of the European Union: Luxembourg, 2010. [Google Scholar]
- United Nations. Climate Neutral Cities—How to Make Cities Less Energy and Carbon Intensive and More Resilient to Climatic Challenges; United Nations: Geneva, Switzerland, 2011. [Google Scholar]
- Saunders, M.J.; Kuhnimhof, T.; Chlond, B.; Silva, A.N.R. Incorporating Transport Energy into Urban Planning. Transp. Res. A Policy Pract. 2008, 42, 874–882. [Google Scholar] [CrossRef]
- Alonso, A.; Monzón, A.; Cascajo, R. Comparative Analysis of Passenger Transport Sustainability in European Cities. Ecol. Indic. 2015, 48, 578–592. [Google Scholar] [CrossRef]
- Alonso, A.; Monzón, A.; Cascajo, R. Measuring Negative Synergies of Urban Sprawl and Economic Crisis over Public Transport Efficiency. Available online: http://journals.sagepub.com/doi/abs/10.1177/0160017616687361 (accessed on 24 January 2017).
- Geurs, K.T.; Wee, B. Land-use/Transport Interaction Models as Tools for Sustainability Impact Assessment of Transport Investments: Review and Research Perspectives. Eur. J. Transp. Infra. Res. 2004, 4, 333–355. [Google Scholar]
- Wegener, M. The Future of Mobility in Cities: Challenges for Urban Modelling. Transp. Policy 2013, 29, 275–282. [Google Scholar] [CrossRef]
- Shepherd, S.P. A Review of System Dynamics Models Applied in Transportation. Trans. B Trans. Dyn. 2014, 2, 83–105. [Google Scholar] [CrossRef]
- INSIGHT-7FP-EC—Innovative Policy Modelling and Governance Tools for Sustainable Post-Crisis Urban Development. Available online: http://www.insight-fp7.eu/ (accessed on 21 December 2016).
- Guzman, L.A.; Hoz, D.; Monzón, A. Optimal and Long-Term Dynamic Transport Policy Design: Seeking Maximum Social Welfare through a Pricing Scheme. Int. J. Sustain. Transp. 2014, 8, 297–316. [Google Scholar] [CrossRef] [Green Version]
- Wang, Y.; Monzon, A.; Ciommo, F.D. Assessing the Accessibility Impact of Transport Policy by a Land-use and Transport Interaction Model—The Case of Madrid. Comput. Environ. Urban Syst. 2015, 49, 126–135. [Google Scholar] [CrossRef] [Green Version]
- Pfaffenbichler, P.; Garcia, G.; Angel, L.; Hoz Sánchez, D.D.L.; Shepherd, S. Analysis of the taxes on CO2 transport emissions as a measure to reach sustainable scenarios. In Proceedings of the VII Conference on Transport Engineering, La Coruña, Spain, 2–4 July 2008. (In Spanish)
- Lo Feudo, F. How to Build an Alternative to Sprawl and Auto-Centric Development Model through a TOD Scenario for the North-Pas-De-Calais Region? Lessons from an Integrated Transportation-land Use Modelling. Transp. Res. Proc. 2014, 4, 154–177. [Google Scholar] [CrossRef]
- European Commission. European Sustainable Cities—Report of the Expert Group on the Urban Environment; European Commission—DGXI Environment, Nuclear Safety and Civil Protection: Brussels, Belgium, 1996. [Google Scholar]
- European Union. Progress towards the Territorial Agenda of the European Union 2020; European Union: Luxembourg, 2014. [Google Scholar]
- Romanillos, G.; Alonso, A.; Wang, Y. Deliverable 2.2 Urban. Planning and Governance: Current Practices and New Challenges; INSIGHT 7FP–EC: Madrid, Spain, 2014. [Google Scholar]
- European Environment Agency. Urban. Sprawl in Europe—the Ignored Challenge; European Environment Agency: Copenhagen, Denmark, 2006. [Google Scholar]
- Lewis, J.O.; Hógáin, S.N.; Borghi, A. Building Energy Efficiency in European Cities; URBACT: Saint-Denis, France, 2013. [Google Scholar]
- European Commission. Green Paper—Towards a New Culture for Urban Mobility; European Commission: Brussels, Belgium, 2007. [Google Scholar]
- Enemark, A.; Kneeshaw, S. How Cities Can Motivate Mobility Mindsets; URBACT: Nancy, France, 2013. [Google Scholar]
- Colini, L.; Czischke, D.; Günter, S.; Tosics, I.; Ramsden, P. URBACT II Capitalisation against Divided Cities in Europe; URBACT: Nancy, France, 2013. [Google Scholar]
- United Nations. United Nations Conference on Human Environment. Available online: https://sustainabledevelopment.un.org/milestones/humanenvironment (accessed on 21 December 2016).
- European Commission. White Paper: Roadmap to a Single European Transport Area—Towards a Competitive and Resource Efficient Transport System; European Commission: Brussels, Belgium, 2011. [Google Scholar]
- World Health Organization. Health Effects of Transport-related Air Pollution; World Health Organization: Copenhagen, Denmark, 2011. [Google Scholar]
- United Nations. United Nations Conference on Environment & Development-AGENDA 21. Available online: https://sustainabledevelopment.un.org/content/documents/Agenda21.pdf (accessed on 21 December 2016).
- Preston, J.; Rajé, F. Accessibility, Mobility and Transport-related Social Exclusion. J. Transp. Geogr. 2007, 15, 151–160. [Google Scholar] [CrossRef]
- European Commission. Green Paper-Restructuring and Anticipation of Change: What Lessons from Recent Experience? European Commission: Brussels, Belgium, 2012. [Google Scholar]
- García, O.; Lucio, A.; Salas-Olmedo, M.H.; Romanillos, G.; Alonso, A.; Feijoo, C. Deliverable 2.1 Stakeholders Consultation; INSIGHT 7FP–EC: Madrid, Spain, 2014. [Google Scholar]
- Alonso, A.; Monzón, A. Assessing the Progress towards Sustainability and the Role of Urban Transport—City of Madrid. In Proceedings of the 6th Transport Research Arena, Warsaw, Poland, 18–20 April 2016.
- Pfaffenbichler, P. The Strategic, Dynamic and Integrated Urban Land Use and Transport Model MARS (Metropolitan Activity Relocation Simulator). Ph.D. Thesis, Technical University of Vienna, Wien, Austria, September 2003. [Google Scholar]
- ALMUDENA—Statistical Database for Madrid Region. Available online: http://www.madrid.org/desvan/Inicio.icm?enlace=almudena (accessed on 21 December 2016).
- Madrid Transport Consortium. EMTA—European Metropolitan Transport Authorities; Consorcio de Transportes de Madrid: Madrid, Spain, 2014. [Google Scholar]
- Alonso, A.; Monzón, A. Policy Priority Objectives: Comparative Assessment in Four European Cities. In Proceeding of the XII Congreso de Ingeniería de Transporte-CIT, Valencia, Spain, 7–9 June 2016.
- CRTM—Consorcio Regional de Transportes de Madrid (Public Transport Authority in Madrid Region). Available online: http://www.crtm.es/ (accessed on 21 December 2016).
- Madrid Region. Air Quality Strategy 2013–2020. Available online: http://www.madrid.org/cs/Satellite?c=CM_Planes_FA&cid=1354532201832&language=es&pageid=1350931018212&pagename=ComunidadMadrid%2FCM_InfPractica_FA%2FCM_fichaInfPracticaServicios&vest=1350930997092 (accessed on 21 December 2016). (In Spanish)
- Madrid Region. Land law for Madrid Region; Madrid Region: Madrid, Spain, 2001. (In Spanish) [Google Scholar]
- Leboreiro, A. Territorial Planning in Global European Cities: The Case of Madrid. Ph.D. Thesis, Polytechnic University of Madrid, Madrid, Spain, 2015. [Google Scholar]
- Wegener, M. Operational Urban Models: State of Art. J. Am. Plan. Assoc. 1994, 60, 17–29. [Google Scholar] [CrossRef]
- Greiving, S.; Wegener, M. Integration of Transport and Land Use Policies: State of the Art. In Proceeding of the 9th World Conference on Transport Research, Seoul, Korea, 22–27 July 2001.
- Bravo, M.; Briceño, L.; Cominetti, R.; Cortés, C.E.; Martínez, F. An Integrated Behavioral Model of the Land-use and Transport Systems with Network Congestion and Location Externalities. Transp. Res. B Methodol 2010, 44, 584–596. [Google Scholar] [CrossRef]
- Lowry, I.S. A Model of Metropolis; Rand Corporation: Santa Monica, CA, USA, 1964. [Google Scholar]
- Echenique, M.H.; Flowerdew, A.D.J.; Hunt, J.D.; Mayo, T.R.; Skidmore, I.J.; Simmonds, D.C. The MEPLAN Models of Bilbao, Leeds and Dortmund. Transp. Rev. 1990, 10, 309–322. [Google Scholar] [CrossRef]
- Hunt, J.D.; Abraham, J.E. Design and Implementation of PECAS: A Generalised System for Allocating Economic Production, Exchange and Consumption Quantities. In Integrated Land-Use and Transportation Models; Lee-Gosselin, M., Doherty, S., Eds.; Elsevier Science: New York, NY, USA, 2005; pp. 253–273. [Google Scholar]
- Wegener, M. The IRPUD Model; Spiekermann & Wegener Urban and Regional Research(S&W): Dortmund, Germany, 2011. [Google Scholar]
- Martínez, F. MUSSA: Land Use Model for Santiago City. Transp. Res. Rec. J. Transp. Res. Board 1996, 1552, 126–134. [Google Scholar] [CrossRef]
- Simmonds, D.C. The Design of the DELTA Land-use Modelling Package. Environ. Plan. B Plan. Des. 1999, 26, 665–684. [Google Scholar] [CrossRef]
- TU-Wien. Transport Research Institute in the Technische Universitat Wien. Available online: http://www.ivv.tuwien.ac.at/forschung/mars-metropolitan-activity-relocation-simulator/overview/ (accessed on 21 December 2016).
- Pfaffenbichler, P.; Emberger, G.; Shepherd, S. The Integrated Dynamic Land Use and Transport Model MARS. Netw. Spat. Econ. 2008, 8, 183–200. [Google Scholar] [CrossRef]
- Guzmán, L.A. Dynamic Optimization of Sustainable Mobility Strategies in Metropolitan Areas. Ph.D. Thesis, Technical School of Civil Engineering, Madrid, Spain, July 2011. [Google Scholar]
- Wang, Y. Assessing Urban Mobility through Participatory Scenario Building and Combined Utility Regret Assessment. Ph.D. Thesis, Universidad Politécnica de Madrid, Madrid, Spain, April 2014. [Google Scholar]
- Wang, Y.; Alonso, A.; Monzón, A. Transport Policy Evaluation by a LUTI Model (MARS). In The TRANSPACE Model; Dell’ Olio, L., Cordera, R., Ibeas, A., Eds.; GIST—Transport Systems Research Group: Santander, Spain, 2016; pp. 34–65. [Google Scholar]
- Madrid—Ayuntamiento. (Statistical Database for Madrid City). Available online: http://www-2.munimadrid.es/CSE6/jsps/menuBancoDatos.jsp (accessed on 21 December 2016).
- INE—National Statistical Database for Spain. Available online: http://www.ine.es/ (accessed on 21 December 2016).
- DESVAN. Statistical Database for Madrid Region. Available online: http://www.madrid.org/desvan/Inicio.icm?enlace=desvan (accessed on 21 December 2016).
- OECD—Organisation for Economic Co-operation and Development. Projections Database. Available online: https://data.oecd.org/gdp/gdp-long-term-forecast.htm (accessed on 21 December 2016).
- Valdes, C.; Monzon, A.; Benitez, F.G. Sustainable Urban Transportation Strategies: Searching for Synergies. KSCE J. Civ. Eng. 2016, 20, 1066–1075. [Google Scholar] [CrossRef]
- Ziltener, P. The Economic Effects of the European Single Market Project: Projections, Simulations and the Reality. Rev. Int. Political Econ. 2004, 11, 953–979. [Google Scholar] [CrossRef]
- Anas, A.; Lindsey, R. Reducing Urban Road Transportation Externalities: Road Pricing in Theory and in Practice. Rev. Environ. Econ. Policy 2011, 5, 66–88. [Google Scholar] [CrossRef]
- Coenen, M.; Kok, R.A.W. Workplace Flexibility and New Product Development Performance: The Role of Telework and Flexible Work Schedules. Eur. Manag. J. 2014, 32, 564–576. [Google Scholar] [CrossRef]
- Musterd, S.; Bontje, M.; Ostendorf, W. The Changing Role of Old and New Urban Centers: The Case of the Amsterdam Region. Urban Geogr. 2006, 27, 360–387. [Google Scholar] [CrossRef]
- Armuña, C.; Arenal, A.; Feijoo, C. Deliverable 7.5 Comparative Evaluation and Assessment; INSIGHT 7FP–EC: Madrid, Spain, 2016. [Google Scholar]
- Spanish Statistical Office. Population Projections for Spain 2016–2066—Methodology; Spanish Statistical Office: Madrid, Spain, 2016; pp. 1–56. (In Spanish) [Google Scholar]
- Brewer, A.M. Work Design, Flexible Work Arrangements and Travel Behaviour: Policy Implications. Transp. Policy 1995, 5, 93–101. [Google Scholar] [CrossRef]
- Zhang, W.; Kockelman, K. Urban Sprawl, Job Decentralization, and Congestion: The Welfare Effects of Congestion Tolls and Urban Growth Boundaries. In Proceeding of the Transportation Research Board (TRB) 93rd Annual Meeting, Washington, DC, USA, 12–16 January 2014.
- Eliasson, J. A Cost–Benefit Analysis of the Stockholm Congestion Charging System. Transp. Res. A Policy Pract. 2009, 43, 468–480. [Google Scholar] [CrossRef]
- Eliasson, J.; Hultkrantz, L.; Nerhagen, L.; Rosqvist, L.S. The Stockholm Congestion–charging Trial 2006: Overview of Effects. Transp. Res. A Policy Pract. 2009, 43, 240–250. [Google Scholar] [CrossRef]
- Parry, I.W.; Walls, M.; Harrington, W. Automobile Externalities and Policies. J. Econ. Lit. 2007, 45, 373–399. [Google Scholar] [CrossRef]
- Transport Styrelsen. Available online: https://www.transportstyrelsen.se/en/road/Congestion-taxes-in-Stockholm-and-Goteborg/ (accessed on 21 December 2016).
- Cegarra-Leiva, D.; Sánchez-Vidal, M.E.; Cegarra-Navarro, J.C. Work Life Balance and the Retention of Managers in Spanish Smes. Int. J. Hum. Res. Manag. 2012, 23, 91–108. [Google Scholar] [CrossRef]
- Nijland, L.; Dijst, M. Commuting-related fringe benefits in the Netherlands: Interrelationships and company, employee and location characteristics. Transp. Res. A Policy Pract. 2015, 77, 358–371. [Google Scholar] [CrossRef]
- Lier, T.; Witte, A.; Macharis, C. How Worthwhile is Teleworking from a Sustainable Mobility Perspective? The Case of Brussels Capital Region. Eur. J. Transp. Infrastruct. Res. 2004, 14, 244–267. [Google Scholar]
- Vanoutrive, T.; Malderen, L.; Jourquin, B.; Thomas, I.; Verhetsel, A.; Witlox, F. Mobility Management Measures by Employers: Overview and Exploratory Analysis for Belgium. Eur. J. Transp. Infrastruct. Res. 2010, 10, 121–141. [Google Scholar]
- Horvath, A. Environmental Analysis of Telework: What We Know and What We Do Not Know and Why. In Proceedings of the 2010 IEEE International Symposium on Sustainable Systems and Technology (ISSST), Arlington, TX, USA, 17–19 May 2010.
- Cacciaguerra, G.; Gatti, M.P. Urban Re-densification and Regeneration: 21st Century City Strategies; WIT Transactions on Ecology and the Environment: London, UK, 2015; pp. 217–226. [Google Scholar]
- Salvati, L. Urban Containment in Action? Long-term Dynamics of Self-contained Urban Growth in Compact and Dispersed Regions of Southern Europe. Land Use Pol. 2013, 35, 213–225. [Google Scholar] [CrossRef]
- Erli-Handayeni, K.D.M. TOD Best Practice: Lesson Learned for GHG Mitigation on Transportation Sector in Surabaya City, Indonesia. Proc. Soc. Behav. Sci. 2014, 135, 152–158. [Google Scholar]
- European Communities. Economic Crisis in Europe: Causes, Consequences and Responses; European Communities: Luxembourg, 2009. [Google Scholar]
- Wang, Y.; Salas-Olmedo, M.H.; Alonso, A.; Monzón, A.; García-Palomares, J.C. Deliverable 5.3 Enhanced Version of the MARS Simulation Model; INSIGHT 7FP–EC: Madrid, Spain, 2016. [Google Scholar]
- Salas-Olmedo, M.H.; Wang, Y.; Alonso, A. When GIS Meets LUTI: Assessing Accessibility with Local Coefficients for the LUTI Model MARS. Comput. Environ. Urban Syst. Accepted.
- Hupkes, G. The Law of Constant Travel Time and Trip-rates. Futures 1982, 14, 38–46. [Google Scholar] [CrossRef]
- Daly, H.E.; Ramea, K.; Chiodi, A.; Yeh, S.; Gargiulo, M.; Gallachóir, B.Ó. Incorporating Travel Behaviour and Travel Time into TIMES Energy System Models. Appl. Energy 2014, 135, 429–439. [Google Scholar] [CrossRef]
- Marchetti, C. Anthropological Invariants in Travel Behavior. Technol. Forecast Soc. Chang. 1994, 47, 75–88. [Google Scholar] [CrossRef]
- Schafer, A. Regularities in Travel Demand: An International Perspective. J. Transp. Stat. 2000, 3, 1–31. [Google Scholar]


| City Challenges | Validated Indicators 1 | ||
|---|---|---|---|
| Cities as living environments | Enable social development, in an equitable, healthy and safe manner; and minimise the impacts on environment | Liveable at human level | 5 indicators related to the quantity and quality of the areas in the city devoted to people. |
| Equal, safe and secure society | 11 indicators related to the provision and access to main needs and services, accidents, crime and inequalities | ||
| Pollution | 8 indicators for measuring air and noise pollution | ||
| Climate Change | 3 indicators for measuring GHG emissions | ||
| Demographic decline | 4 indicators for measuring the ageing of the population, and the shrinking of the active population | ||
| Education and culture | 2 indicators related to education in school and cultural services | ||
| Cities as efficient urban systems | Constitute appropriate frameworks for economic growth and efficiency; and minimise the consumption of resources | Economic activity | 5 indicators related to the job creation, and economic growth |
| Efficient use of resources (i.e., time) | 3 indicators related to the time spent in travelling to work or studies, wasted time in congestion or unused space in the city | ||
| Energy efficiency | 9 indicators measuring the energy consumption from different sources | ||
| Urban sprawl | 3 indicators for measuring the dispersion of the population | ||
| Model Features | MARS for Madrid |
|---|---|
| No of zones | 90 |
| Demographics | Average household budget, household size, motorisation, etc. |
| Land use changes | Simulates land use changes depending on changes in accessibility and population growth rates |
| Allowed time period for predictions | 30 years |
| Modes of travel | Car, public transport (bus, metro, urban train), slow mode (walking and cycling) |
| Congestion effect | Depends on the origin-destination speed-flow curves for commute trips |
| Friction factor (Generalised costs) | In-vehicle time, monetary costs, access/egress, parking search time, waiting time, transfer time |
| Journey purpose | Commute, other |
| Time periods | Peak hour and off-peak hours |
| Transport choice | Simultaneous mode and destination choice (not route, the model does not have a transport network) |
| Transport demand | Inelastic commuting trips and time budget essentially constant |
| City Challenges | No of Validated Indicators 1 | Madrid (2012) | Role in the Mars MODEL |
|---|---|---|---|
| Liveability | Pedestrians & cyclists injured in traffic accidents (no./year) | 27.9 | - |
| Space for pedestrian use (km2) | 102 | - | |
| Length of bicycle lanes (km) | 290 | - | |
| Road land occupation (km2) | 90 | - | |
| Green areas (km2) | 160 | Input | |
| Equal, safe and secure society | Use and coverage of PT (Million Pax-km/year) | 11,839 | Output |
| Use and coverage of PT within the main city | 5191 | Output | |
| Use and coverage of PT within the suburbs | 1702 | Output | |
| Income inequality: S80/S20 (ratio) | 6.6 | - | |
| Cost of main needs, share of the household budget devoted to main needs (housing, nutrition, health, education and transport) (%) | 62.1 | Only transport costs are the output of the MARS model | |
| Essential services provision in each zone: space devoted to health, educational and social services (km2) | 86 | The provision of essential services in each zone is considered as an input in the MARS model (acting as a factor of attractiveness of each zone for residents &workplaces) | |
| Essential services provision in the main city | 25 | ||
| Essential services provision in the suburbs | 60 | ||
| Traffic accidents with casualties | 10,625 | Output | |
| Fatalities occurred in traffic accidents (no) | 70 | - | |
| Crime according to surveys, share of persons that report delinquency and vandalism problems (%) | 54.2 | - | |
| Pollution | Average air concentration of: NOx (µg/m3) | 76 | - |
| Particles (µg/m3) | 22 | - | |
| Total emissions of: NOx (t) | 50,749 | Only emissions of NOx and PM due to the urban daily mobility of the population are an output of the MARS model | |
| Particles-PM (t) | 88,308 | ||
| Emissions in relevant sectors: Transport NOx (t) | 40,838 | ||
| Transport PM (t) | 5146 | ||
| Industry NOx (t) | 4421 | - | |
| Industry PM (t) | 1118 | - | |
| Noise intensity levels (LAeq dBA) | 62.8 | - | |
| Climate Change | Greenhouse gases emissions (GHG) (Thousands of Ton of CO2 eq) | 18,857 | Only GGE emissions due to the urban daily mobility of the population are an output of MARS |
| GHG by main sectors: Transport (Thousands of CO2 eq) | 8477 | ||
| Industry(Thousands of CO2 eq) | 3085 | - | |
| Demographic decline | Share of active population (%) | 53.2 | Only the initial population per zone and its growth per aggregated region is an input of MARS |
| Share of population over 60 years (%) | 20.4 | ||
| Share of population under 25 years (%) | 25.3 | ||
| Share of skilled workers (%) | 51.8 | ||
| Education/culture | Drop-out rates from secondary education (%) | 21.5 | - |
| Cultural offer (no. of cinemas and cultural offer) | 222 | - |
| City Challenges | No of Validated Indicators 1 | Madrid (2012) | Role in the Mars MODEL |
|---|---|---|---|
| Economic activity | Household available budget (€ per household/year) | 34,770 | Input |
| GDP per capita (€ per inhabitant (inhab)/year) | 30,446 | Input | |
| Employment (% of the active population) | 64.2 | Input | |
| Job creation (No. of workplaces) | 2,529,262 | Output | |
| Land prices (€/m2) | 2181 | Input | |
| Efficient use of resources (i.e., time) | Unoccupied flats or buildings (No.) | 436,977 | - |
| Congestion, increase of travel time at peak hours (%) | 11.8 | Output | |
| Total time spent commuting by all inhab (total hours/day) | 1,441,325 | Output | |
| Energy efficient | Energy consumption (ktoe/year) | 10,192 | Only energy consumption due to the urban daily mobility of the population are an output of the MARS model |
| Energy consumption in relevant sectors: Transport (ktoe/year) 1 | 5176 | ||
| Housing (ktoe/year) | 2396 | - | |
| Industry (ktoe/year) | 869 | - | |
| Fuel dependence (energy coming from petrol and carbon sources) (%) | 55.8 | Only energy fuel dependence of the urban daily mobility of the population is an output of the MARS model | |
| Fuel dependence in relevant sectors: Transport (%) | 96.2 | ||
| Housing (%) | 16.2 | - | |
| Industry (%) | 15.4 | - | |
| Share of energy consumption from renewable sources (%) | 1.9 | - | |
| Urban sprawl | Urban density (inhabitants/km2) | 6277 | Input (the urban surface and the population growth are part of the external scenarios of the MARS model) |
| Urbanised surface (km2) | 1037 | ||
| Share of the population living in the Central City (%) | 49.7 | Output |
| Feature | Unit | City | North | East | South | West | Regional |
|---|---|---|---|---|---|---|---|
| Population | No. inhab | 3,233,527 | 320,307 | 652,437 | 1,292,240 | 472,043 | 538,454 |
| Average age | Years | 42.4 | 37.2 | 37.1 | 38.3 | 36.7 | 37.1 |
| Birth rate | No./1000 inhab | 9.9 | 11.2 | 11.3 | 11.6 | 10.3 | 11.7 |
| Death rate | No./1000 inhab | 8.4 | 4.5 | 4.2 | 5.0 | 4.1 | 5.6 |
| Emigration rate | No./1000 inhab | 30.5 | 21.6 | 19.3 | 21.5 | 20.4 | 19.5 |
| Immigrants from other countries or Spanish regions | No. | 98,552 | 6913 | 12,597 | 27,799 | 9613 | 10,294 |
| Migration balance with other zones of Madrid | No. | −10,950 | 1638 | 2166 | 466 | 1720 | 4960 |
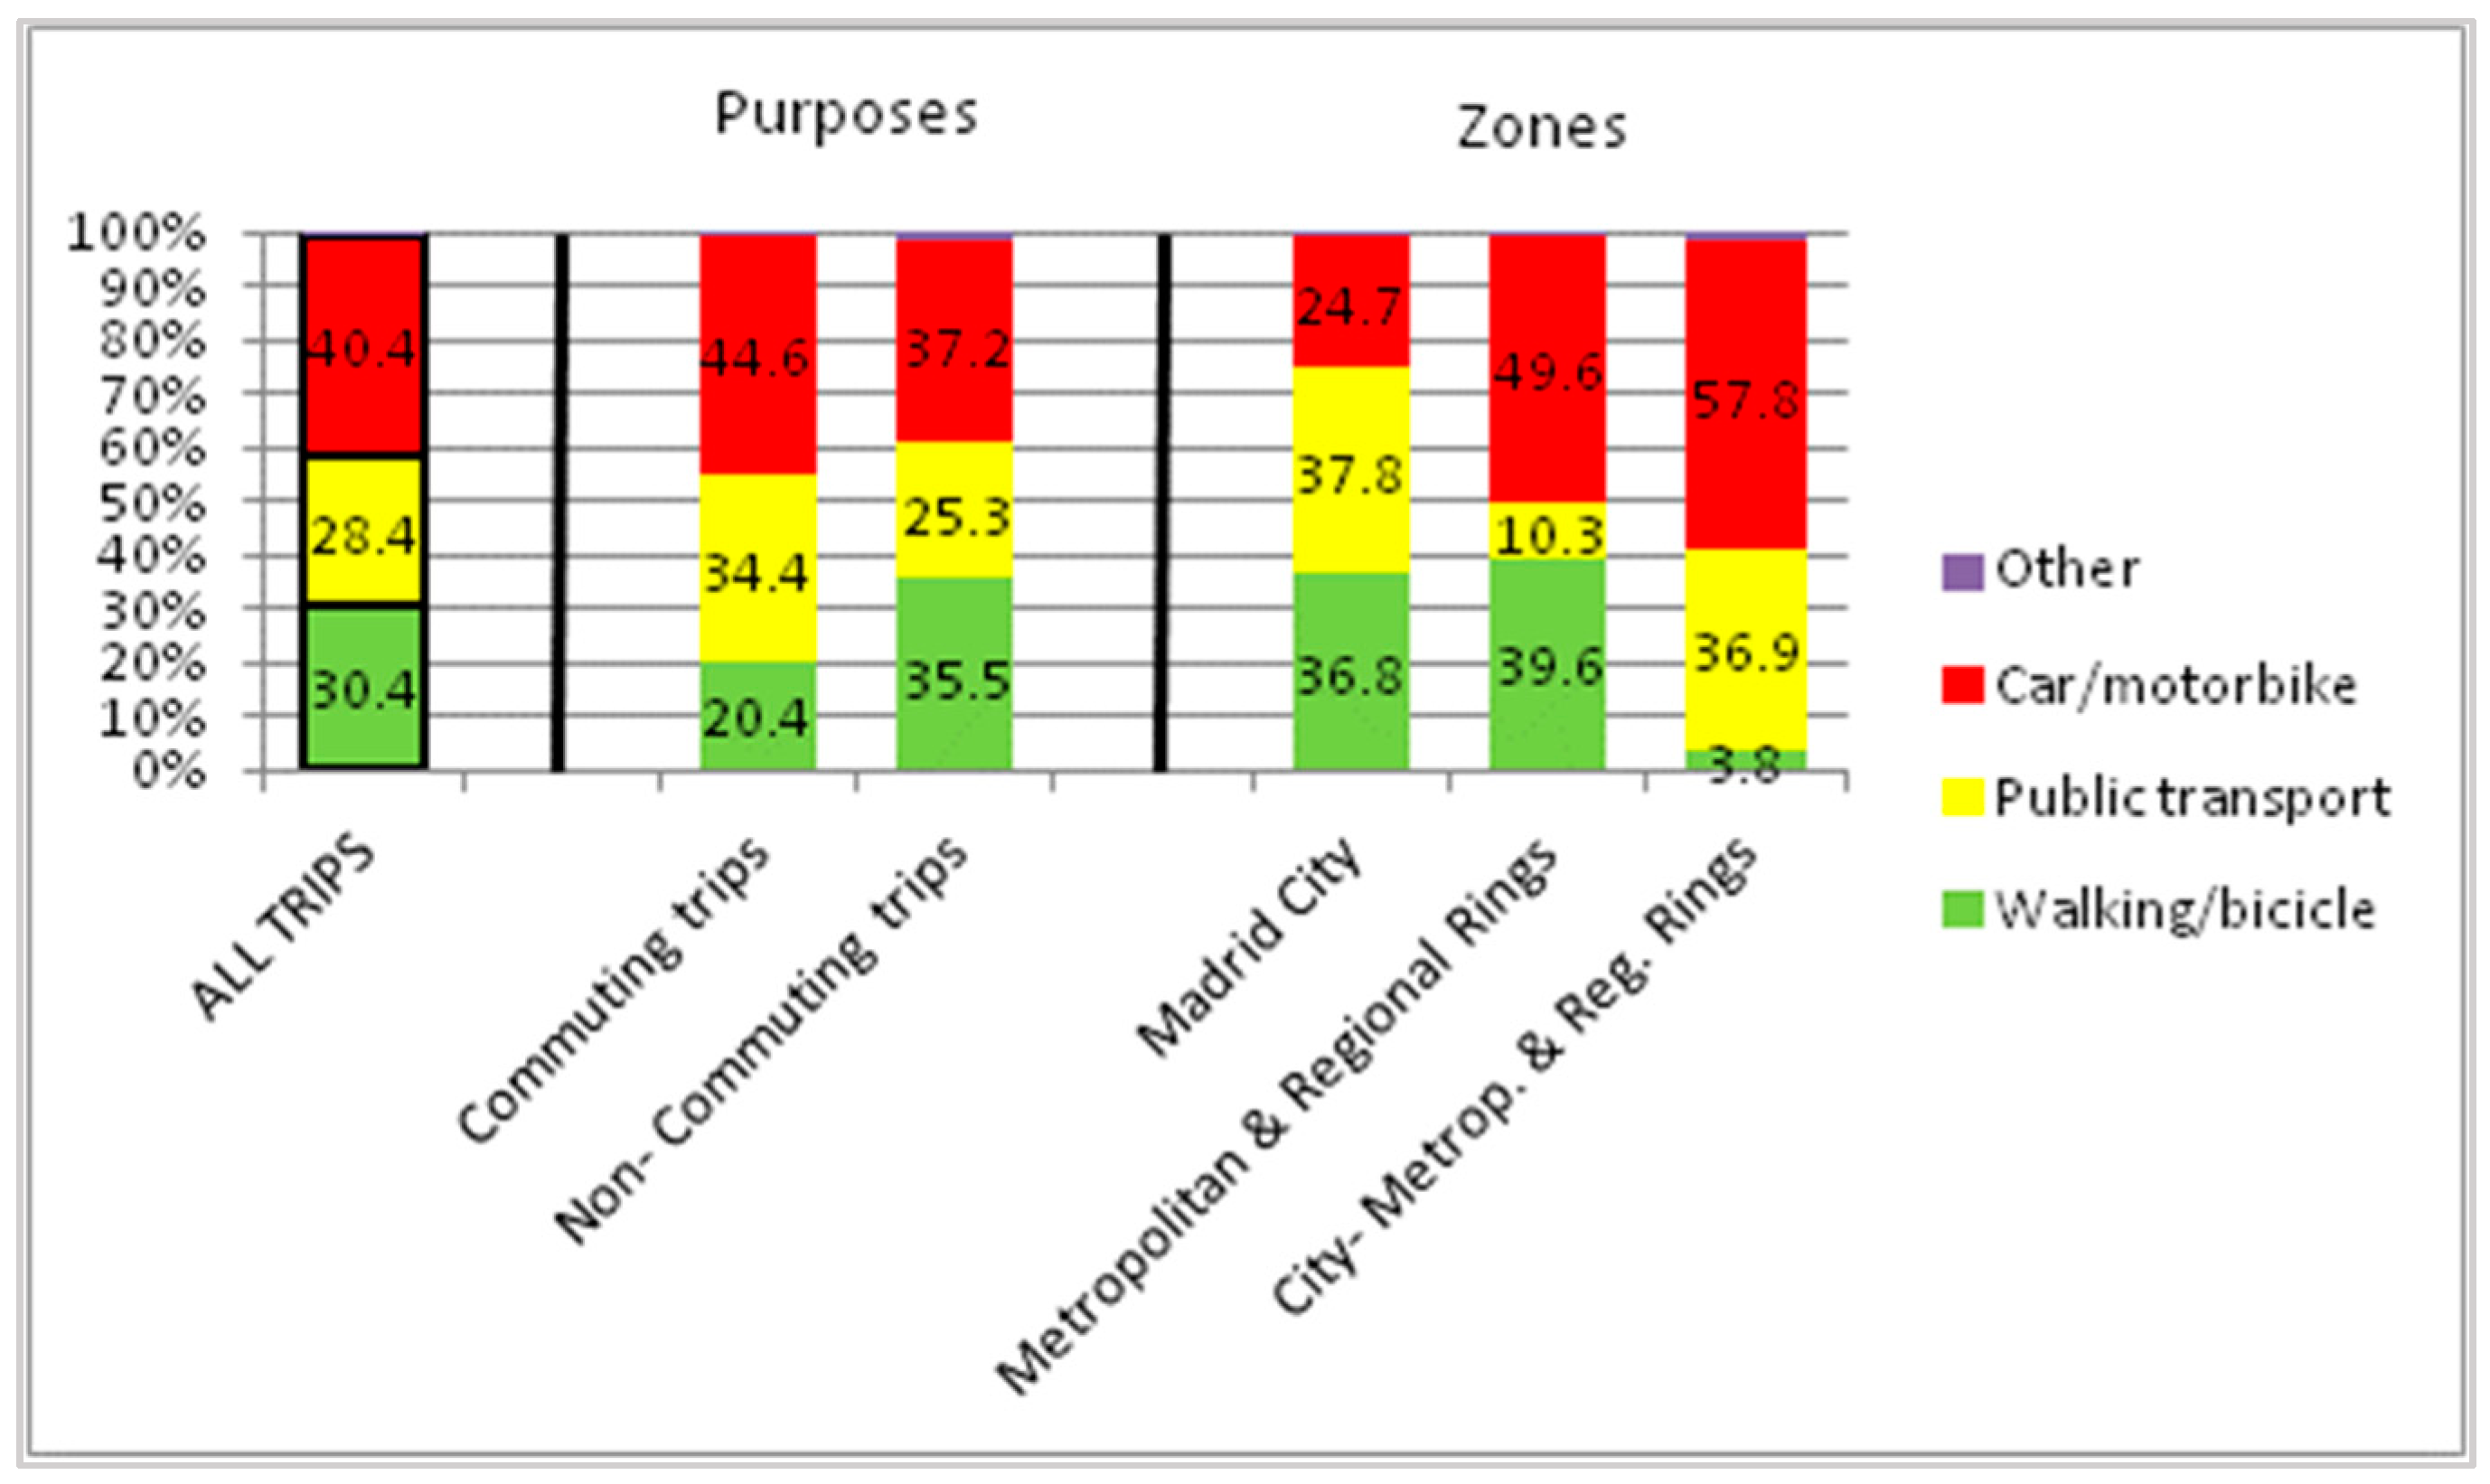
| Heading | No. of Trips Per Day | Within the City | Between the City and the Metropolitan & Regional Rings | Within the Metropolitan & Regional Trips |
|---|---|---|---|---|
| Commuting trips | 4.3 million | 45.4% | 28.9% | 25.7% |
| Non-Commuting trips | 9.2 million | 49.1% | 13.2% | 37.7% |
| Heading | Stockholm (2 Million Inhabitants) | Madrid (6.4 Million Inhabitants) |
|---|---|---|
| Real Data | Input Data for the Simulation | |
| Toll area: limitation | CBD, physically separated by channels | CBD, physically separated by the M-30 (ring road) |
| Share of the population living inside the toll area | 15.6% | 15.4% |
| Initial Price peak (KRN)/ GDP per capita (KRN) | 20 SEK in 2006 (~€2.12 in 2006) 418,099 SEK in 2006 (~€44,421 in 2006) | €2 in 2016/ €30,446 in 2015 (considering the GDP and the city size) |
| Initial Price off peak (€)/ GDP per capita (€) | 10 SEK in 2006 (~€1.06 in 2006) 418,099 SEK in 2006 (~€44,421 in 2006) | €1 in 2016/ €30,446 in 2015 |
| Public transport services extension | 7% increase in PT frequencies | 7% increase in PT frequencies |
| Increase of the peak price | 75% in 10 years | 112.5% in 15 years (accompanied by an increase of the PT frequencies: up to 14% in 2031) |
| Increase of the off-peak price | 10% in 10 years | 15 % in 15 years |
| Challenges | Indicator | 2012 | Policy Scenario | 2020 (Model) | 2031 (Model) | Total Savings (2012–2031) |
|---|---|---|---|---|---|---|
| Economic activity | Workplaces (no. of jobs) | 2,529,262 | Do-nothing | 2,665,996 | 2,854,384 | Base scenario |
| Toll + PT | 2,667,759 | 2,870,712 | n.a. 2 | |||
| Telework | 2,665,936 | 2,852,071 | n.a. | |||
| Redensific. | 2,665,996 | 2,855,003 | n.a. | |||
| Time efficiency | Congestion, increase in travel time at peak hours (%) | 11.8 | Do-nothing | 12.0 | 12.7 | Base scenario |
| Toll + PT | 11.5 | 12.0 | n.a. | |||
| Telework | 11.7 | 11.5 | n.a. | |||
| Redensific. | 11.9 | 12.5 | n.a. | |||
| Total time spent commuting by all inhab. (hours/day) | 1,441,325 | Do-nothing | 1,459,921 | 1,544,282 | Base scenario | |
| Toll + PT | 1,433,810 | 1,506,929 | 114 mill. hrs saved | |||
| Telework | 1,413,901 | 1,358,071 | 357 mill. hrs saved | |||
| Redensific. | 1,455,872 | 1,533,569 | 29 mill. hrs saved | |||
| Energy efficiency | Energy consumption in daily urban mobility (ktoe/year) | 1961 | Do-nothing | 2038 | 2222 | Base scenario |
| Toll + PT | 2029 | 2239 | 3 ktoe saved | |||
| Telework | 2049 | 2296 | 498 ktoe extra | |||
| Redensific. | 2027 | 2199 | 249 ktoe saved | |||
| Fuel energy dependency (%) | 94.4 | Do-nothing | 94.5 | 95.0 | Base scenario | |
| Toll + PT | 94.5 | 94.9 | n.a | |||
| Telework | 94.6 | 95.2 | n.a | |||
| Redensific. | 94.5 | 95.0 | n.a | |||
| Sprawl | Share of the metropolitan population living in the main city (%) | 49.7 | Do-nothing | 47.0 | 43.4 | Base scenario |
| Toll + PT | 47.2 | 43.5 | n.a | |||
| Telework | 47.2 | 43.4 | n.a | |||
| Redensific. | 47.7 | 45.3 | n.a |
| Challenges | Indicator | 2012 | Policy Scenario | 2020 (Model) | 2031 (Model) | Total Savings (2012–2031) |
|---|---|---|---|---|---|---|
| Safety | Traffic accidents (No./year) | 10,625 | Do-nothing | 11,667 | 12,027 | Base scenario |
| Cordon toll | 11,255 | 12,052 | 4504 accid. less | |||
| Telework | 11,157 | 12,445 | 3483 accid. less | |||
| Redensific. | 10,966 | 11,561 | 10,076 accid. less | |||
| Accessibility | PT use (million Pax-km/year) | 11,836 | Do-nothing | 11,678 | 11,048 | Base scenario |
| Cordon toll | 12,267 | 11,881 | n.a | |||
| Telework | 11,696 | 11,053 | n.a | |||
| Redensific. | 11,718 | 11,173 | n.a | |||
| Cost of mobility to work or study per person (€/day) | 1.25 | Do-nothing | 1.31 | 1.43 | Base scenario | |
| Cordon toll | 1.53 | 1.74 | n.a | |||
| Telework | 1.27 | 1.29 | n.a | |||
| Redensific. | 1.30 | 1.40 | n.a | |||
| Climate change | GGE from urban transport (Thousands of Ton CO2 eq./year) | 5458 | Do-nothing | 5531 | 6064 | Base scenario |
| Cordon toll | 5518 | 6062 | 177 t of CO2 saved | |||
| Telework | 5548 | 6185 | 776 t of CO2 extra | |||
| Redensific. | 5509 | 6022 | 519 t of CO2 saved | |||
| Air pollution | NOx emissions from urban transport (t/year) | 14,677 | Do-nothing | 16,494 | 18,725 | Base scenario |
| Cordon toll | 16,583 | 18,925 | 1879 t extra | |||
| Telework | 16,564 | 19,190 | 3078 t extra | |||
| Redensific. | 16,428 | 18,598 | 1540 t less | |||
| PM emissions from urban transport (t/year) | 1088 | Do-nothing | 1569 | 1926 | Base scenario | |
| Cordon toll | 1563 | 1914 | 162 t saved | |||
| Telework | 1573 | 1958 | 195 t extra | |||
| Redensific. | 1560 | 1912 | 170 t saved |
© 2017 by the authors. Licensee MDPI, Basel, Switzerland. This article is an open access article distributed under the terms and conditions of the Creative Commons Attribution (CC BY) license ( http://creativecommons.org/licenses/by/4.0/).
Share and Cite
Alonso, A.; Monzón, A.; Wang, Y. Modelling Land Use and Transport Policies to Measure Their Contribution to Urban Challenges: The Case of Madrid. Sustainability 2017, 9, 378. https://doi.org/10.3390/su9030378
Alonso A, Monzón A, Wang Y. Modelling Land Use and Transport Policies to Measure Their Contribution to Urban Challenges: The Case of Madrid. Sustainability. 2017; 9(3):378. https://doi.org/10.3390/su9030378
Chicago/Turabian StyleAlonso, Andrea, Andrés Monzón, and Yang Wang. 2017. "Modelling Land Use and Transport Policies to Measure Their Contribution to Urban Challenges: The Case of Madrid" Sustainability 9, no. 3: 378. https://doi.org/10.3390/su9030378