Article

Assessing the Sodium Exchange Capacity in Rainfed and Irrigated Soils in the Mediterranean Basin Using GIS

1
CIEO—Centre for Spatial and Organizational Dynamics, Gambelas, 8005-139 Faro, Portugal
2
IPP—Instituto Politécnico de Portalegre, Portalegre, Praça do Municipio, 7300-110 Portalegre, Portugal
3
Área de Edafología y Química Agrícola (Facultad de Ciencias) and GORSAS, Universidad de Extremadura, Avda de Elvas S/N, 06071 Badajoz, Spain
4
LEAF—Linking Landscape, Environment, Agriculture and Food, Superior Institute of Agronomy, Tapada da Ajuda, 1349-017 Lisboa, Portugal
*
Author to whom correspondence should be addressed.
Sustainability 2017, 9(3), 405; https://doi.org/10.3390/su9030405
Submission received: 15 December 2016 / Revised: 28 February 2017 / Accepted: 2 March 2017 / Published: 9 March 2017

Abstract

:
The soil exchange complex consists of colloidal materials on which ion exchange phenomena occur allowing it to attract, retain, and exchange elements that have opposite electric charges. Since their mineral constituents (clay) and organic components (humus) are mainly of a negative nature retained or exchanged ion are predominantly cations. Historically, failing to monitor parameters like the exchange sodium percentage (ESP) has led to the permanent deterioration of soils which have become completely unproductive, largely reducing the sustainability of the agricultural systems. This study assesses how the sodium exchange capacity in irrigated soils differs from the rainfed ones through a sample survey that was carried out in the 15,031 ha of the Caia Irrigation Perimeter and adjacent areas, located in the municipalities of Elvas and Campo Maior, Portalegre District, Portugal where 14,280 georeferenced samples were collected from the top soil layer (0–20 cm), which were mixed 10 at a time so that each composite sample representing 11.1 ha. Then the samples were analyzed regarding the most relevant parameters for characterizing the soil exchange complex including the concentrations of exchanged bases and Cation Exchange Capacity (CEC). The results were arranged in a georeferenced grid with 1451 entries. Using classical statistical analysis and Geographic Information Systems (GIS) software, it was possible to relate the individual soil samples analyzed with the cultural system practiced (irrigated or rainfed) and the present soil group which permitted us to analyze the influence of the cultural system in the soil exchange complex. The distribution chart of the exchange sodium and CEC were created. The obtained results confirm a general decrease of CEC values and an increase of the exchangeable sodium content of irrigated explored soils when compared to the rainfed ones, putting forward noteworthy ideas not only regarding the necessary changes towards the sustainability of these irrigated agricultural landscapes, but also considering the impact of these productive techniques on different agricultural systems.

1. Introduction

We currently live in a world where near 1500 million hectares of land (nearly 12% of the total land area of the world) are used to produce crops that feed the more than 7200 million people who live in it [1]. The planet’s population will increase, by 2050, to 10,000 million and at the same time will lose between 150 and 300 million hectares of arable land for food production due to salinization, erosion, and urban intensification [2,3,4,5,6,7]. There is then a tendency for an inverse evolution of these two factors and we may recognize the near future challenge in agriculture: to be able to produce more with fewer resources.
To address this problem a serious intervention will be required—by governments, stakeholders, agricultural specialists, farmers, etc.—in order to enable the application of socio-economic policies to curb the acceleration, and even create an inversion of population growth while simultaneously implementing other measures as a greater investment in research to improve all the production aspects of a crop while preventing the deterioration from agricultural soils. More research is needed in various fields, such as the different cultivation methods in hydroponics and aeroponics [8,9,10,11,12,13], which appear to be of great importance but nowadays—due to the production area on soil—have little expression. We must continue to further study the cultural practices, genetic seeds, fertilizers and, of course, the main aspect that makes today’s agriculture possible: the soil. Only by thoroughly studying all these parameters and applying these studies in practice can we achieve the goal of feeding a population of 10.000 million people by the year 2050, with fewer resources than those available today, while ensuring that the alarming number of people who daily have a “food intake insufficient to meet the energy requirements of the diet” [1] does not increase.
Today, in the Mediterranean basin, to increase the production of agricultural soils we fall back on agricultural intensification through irrigation practice because, in this agro-climatic system, water is the limiting factor [14,15,16]. Irrigation practice is so important that it represents, 40% of the total food production worldwide, and is practiced in 20% of all cultivated land [1,17]. It is, however, very important to monitor the land under irrigation because, historically, in the valley of Mesopotamia—Syria, Egypt and other areas of the Middle East—there have been cases where poor management of salinity and drainage resulted in a permanent deterioration of soils which have become completely unproductive [18,19,20]. Sodicity is a particular case, and also the most serious, of soil salinity and is described as the process by which the sodium ions (Na+) gain dominance in the soil exchange complex, which may cause the loss of one or more functions of it. The Exchange Sodium Percentage (ESP) measures the ability of the soil solution and the percolation water to exchange sodium with the soil being a representative calculation of this parameter [21]. It is therefore also important to monitor the impact that these cultivation systems have over the years in agricultural soils in order to guarantee the sustainability of the entire system.
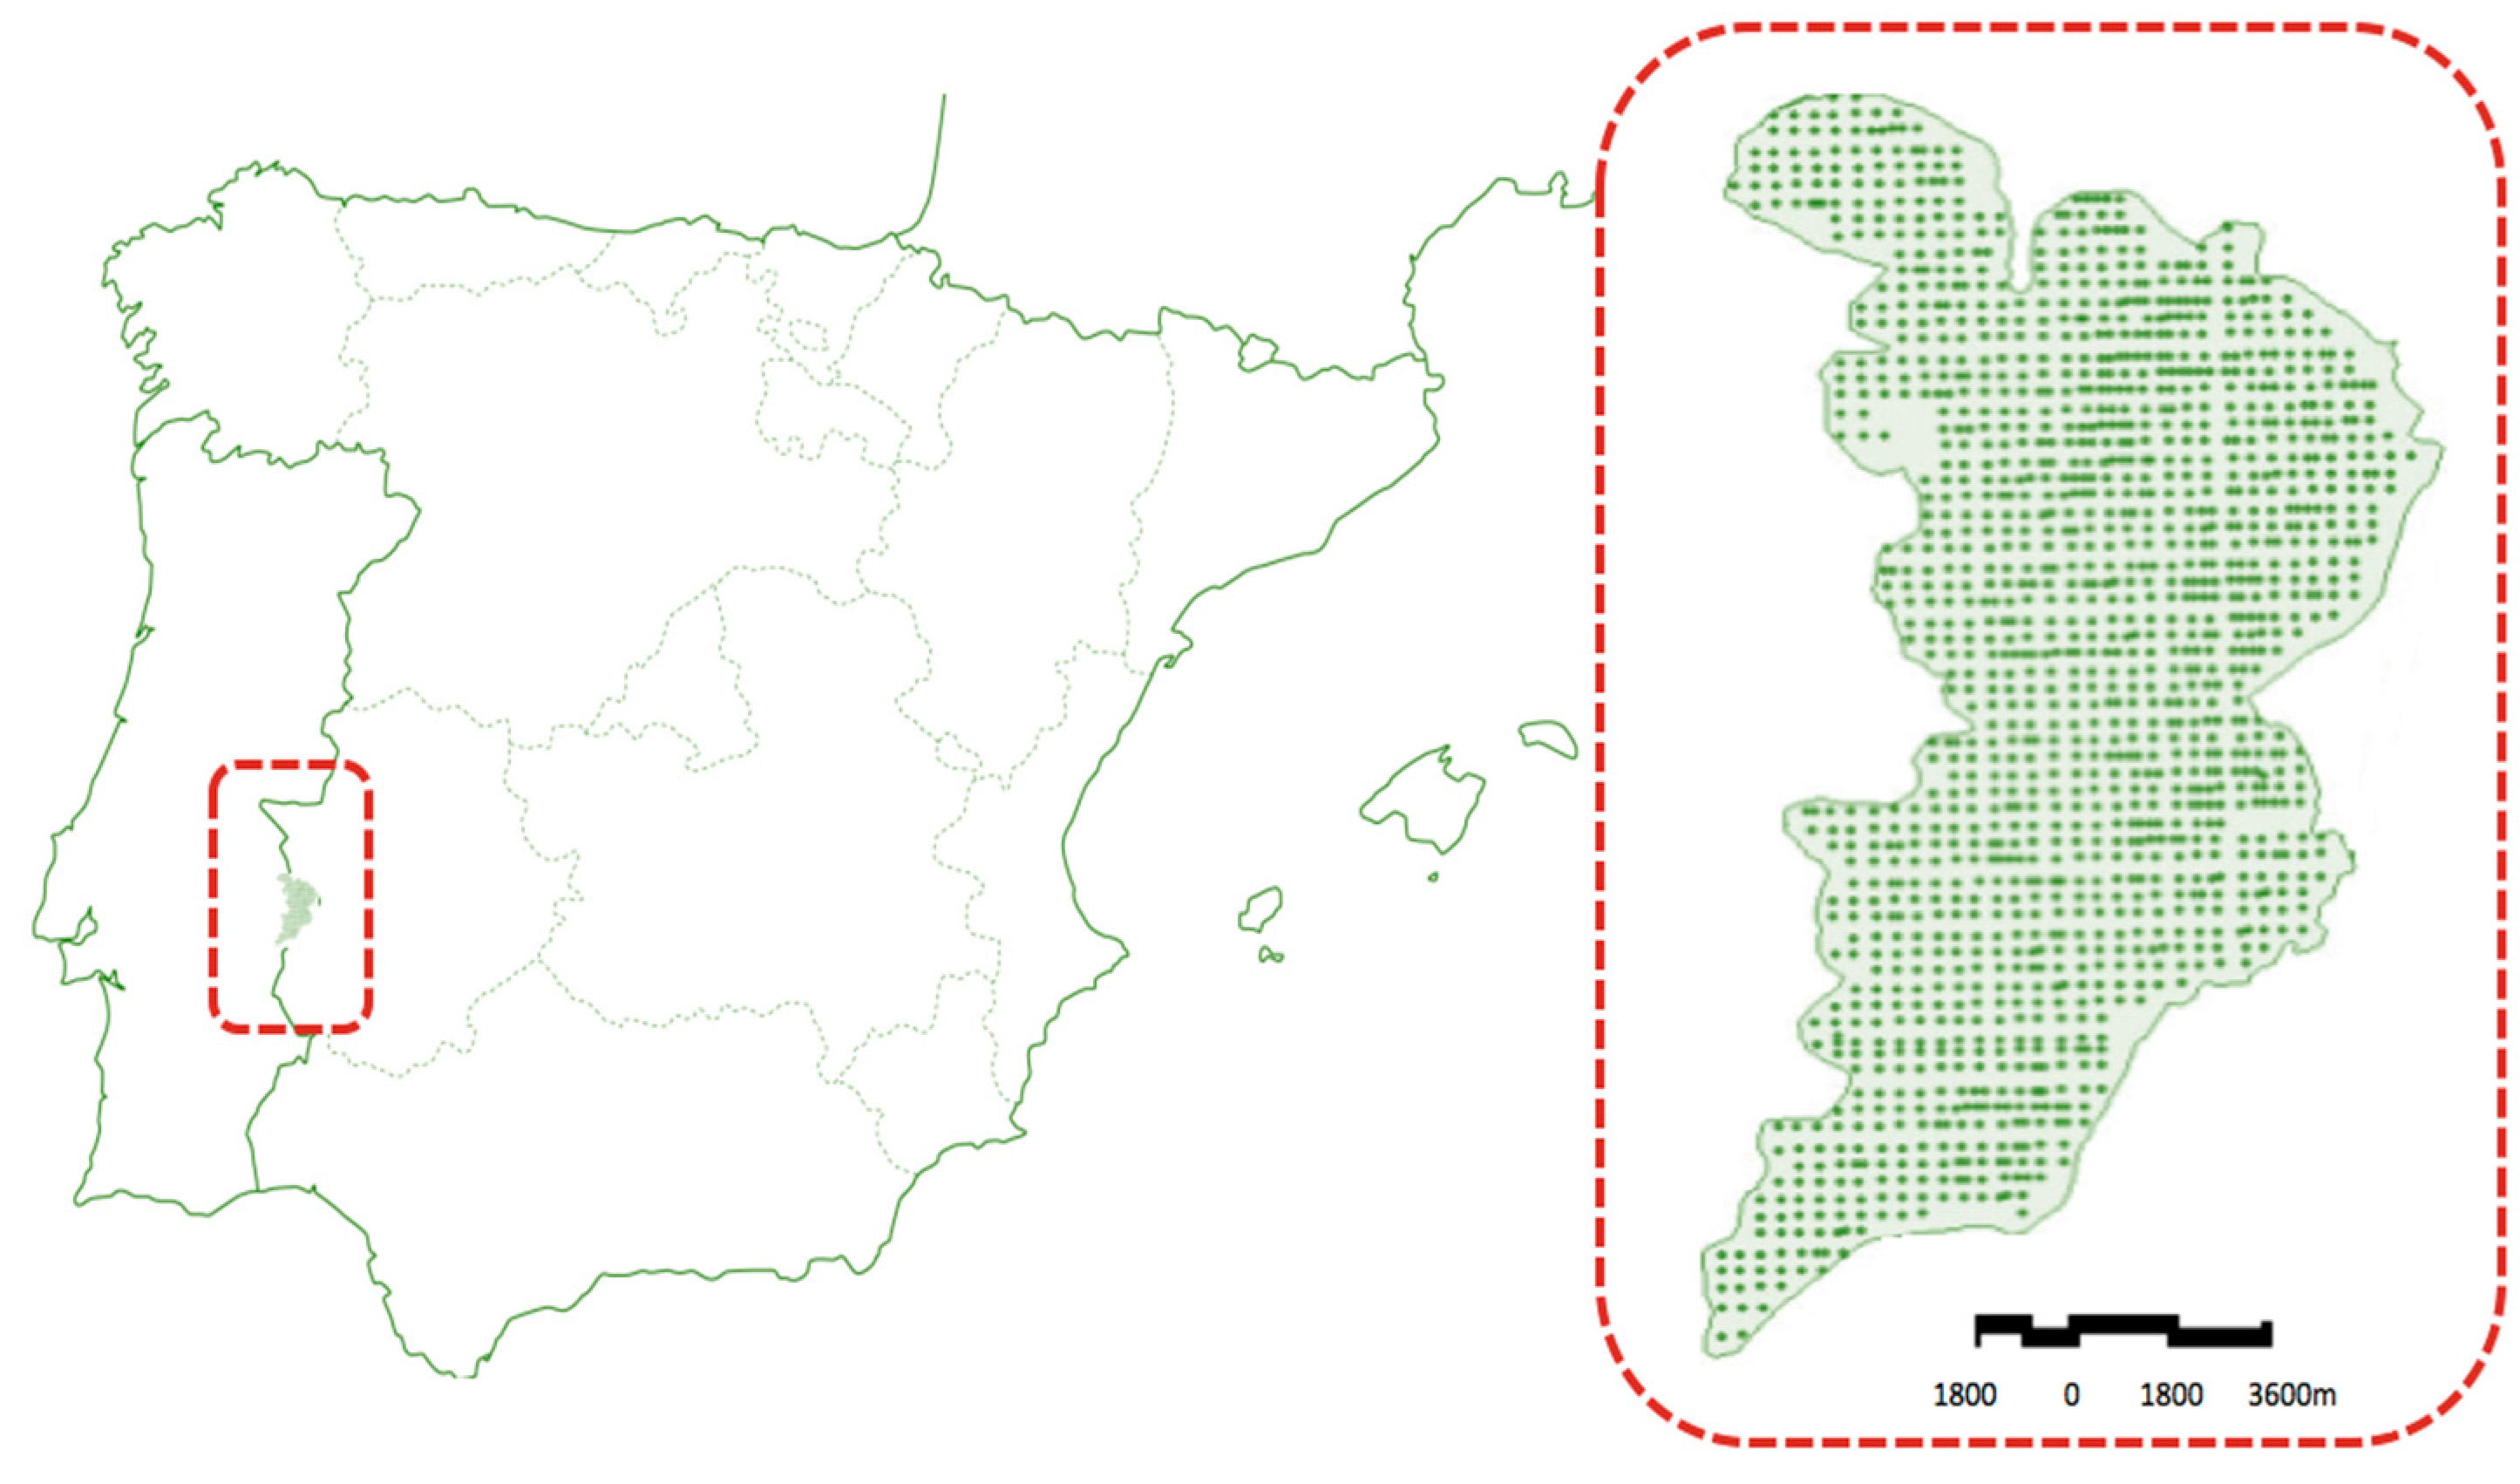
Thus, this paper tries to contribute to a better understanding of irrigation impacts on the soil sodium exchange capacity and may even be an important planning tool in relation to soil conservation, since it will be known which cultural system mostly affects the productive soil potential. Its results may, with the necessary care and adaptations, be extrapolated to other regions of similar characteristics in the Mediterranean basin (e.g., soil, water quality, and temperature, among other edaphic characteristics) and can be a tool for improving resource management, thus reducing the environmental impact of irrigation. For this reason, it is crucial to bear in mind not only the number of years in which a specific property has been irrigated, but also the crop that is being produced (considering that the amount of water depends directly from the produced crop and from the climate of the region), and the soil type of the parcel. Water quality is also a very important issue, but, as it will be discussed further in this paper, the water used in this irrigation perimeter is classified by the FAO as being of very good quality with low salinity and sodicity.

2. Materials and Methods

2.1. Study Area and Sampling

The study area is located within the administrative townships of Elvas and Campo Maior, at the confluence of the Rivers Caia and Guadiana, near the Portugal–Spain border [22] (Figure 1) and its irrigated area is near 15,031 hectares. The average annual rainfall is approximately 483 mm, most of which coincides with the coolest temperatures from October to March. The maximum average monthly temperature corresponds to July with 24.7 °C and the minimum to January with 8.8 °C. The Mediterranean region is characterized by its hot dry summers and cool wet winters and it is a ‘Csa’ in the Koppen classification.
The geology is heterogeneous but mainly consisting of hyper-alkaline and basic rocks. The most important crops are: olive (Olea europea) (35%), maize (Zea mays) (20%), tomato (Lycopersiconesculentum) (15%), and garlic (Allium sativum) (15%). The water is classified by the FAO as C1S2 [23], meaning that it is of very good quality with low salinity and sodicity. This parameter has remained as is over the years. The soils were classified according to the World Reference Base of the FAO Soil Resource (WRBSR) [17] and there are six different types in the study area, the Fluvisols (45%), Luvisols (30%), Calcisols (19%), Cambisols (5%), Regosols (<1%), and Leptosols (<1%). The Regosols and Leptosols have not returned statistically valid data and, consequently, will not be discussed.
A total of 1451 sites were selected in the Caia Irrigation Perimeter. We started by outlining the study area on the Portuguese military map, drawing the limits of the 15,031 hectares to analyze. Then each natural square of the military map, representing 100 hectares, was divided into nine equal squares and its center georeferenced. With the coordinates on paper and a GPS system we located the 1451 sites and collected, in each, 10 topsoil (0–20 cm) samples with a stainless-steel probe by the star method. The samples were carefully mixed in place creating a single composite sample per site. Later all samples were air dried, crushed, sieved to <2 mm, and stored.

2.2. Analytical Methods

The exchange cations and titratable acidity were extracted with a solution of ammonium acetate buffered to pH 7 [24,25,26] and were determined for each individual soil. The determination of the exchange bases (calcium, magnesium, potassium, and sodium) was realized by spectrophotometry of atomic absorption in a Perkin Elmer Analyst A300, according to the procedures and methods described by Nunes (2003) [22].
Based on these results, we calculated the CEC and ESP [27].
CEC = [Ca2+] + [Mg2+] + [K+] + [Na+] [H+] + [Al3+] (cmol(+)·Kg−1)
ESP = Na+/CEC × 100 (%)
Regarding the definition of CEC, the used method is based both on molecular weight and the valence.

2.3. Statistical Analyses

All statistical analyses were performed using the IBM® SPSS® Statistics 23 software package and ArcGIS version 10.0 and consisted of an ANOVA followed by a multiple means comparison by Duncan test (p < 0.05).

3. Results and Discussion

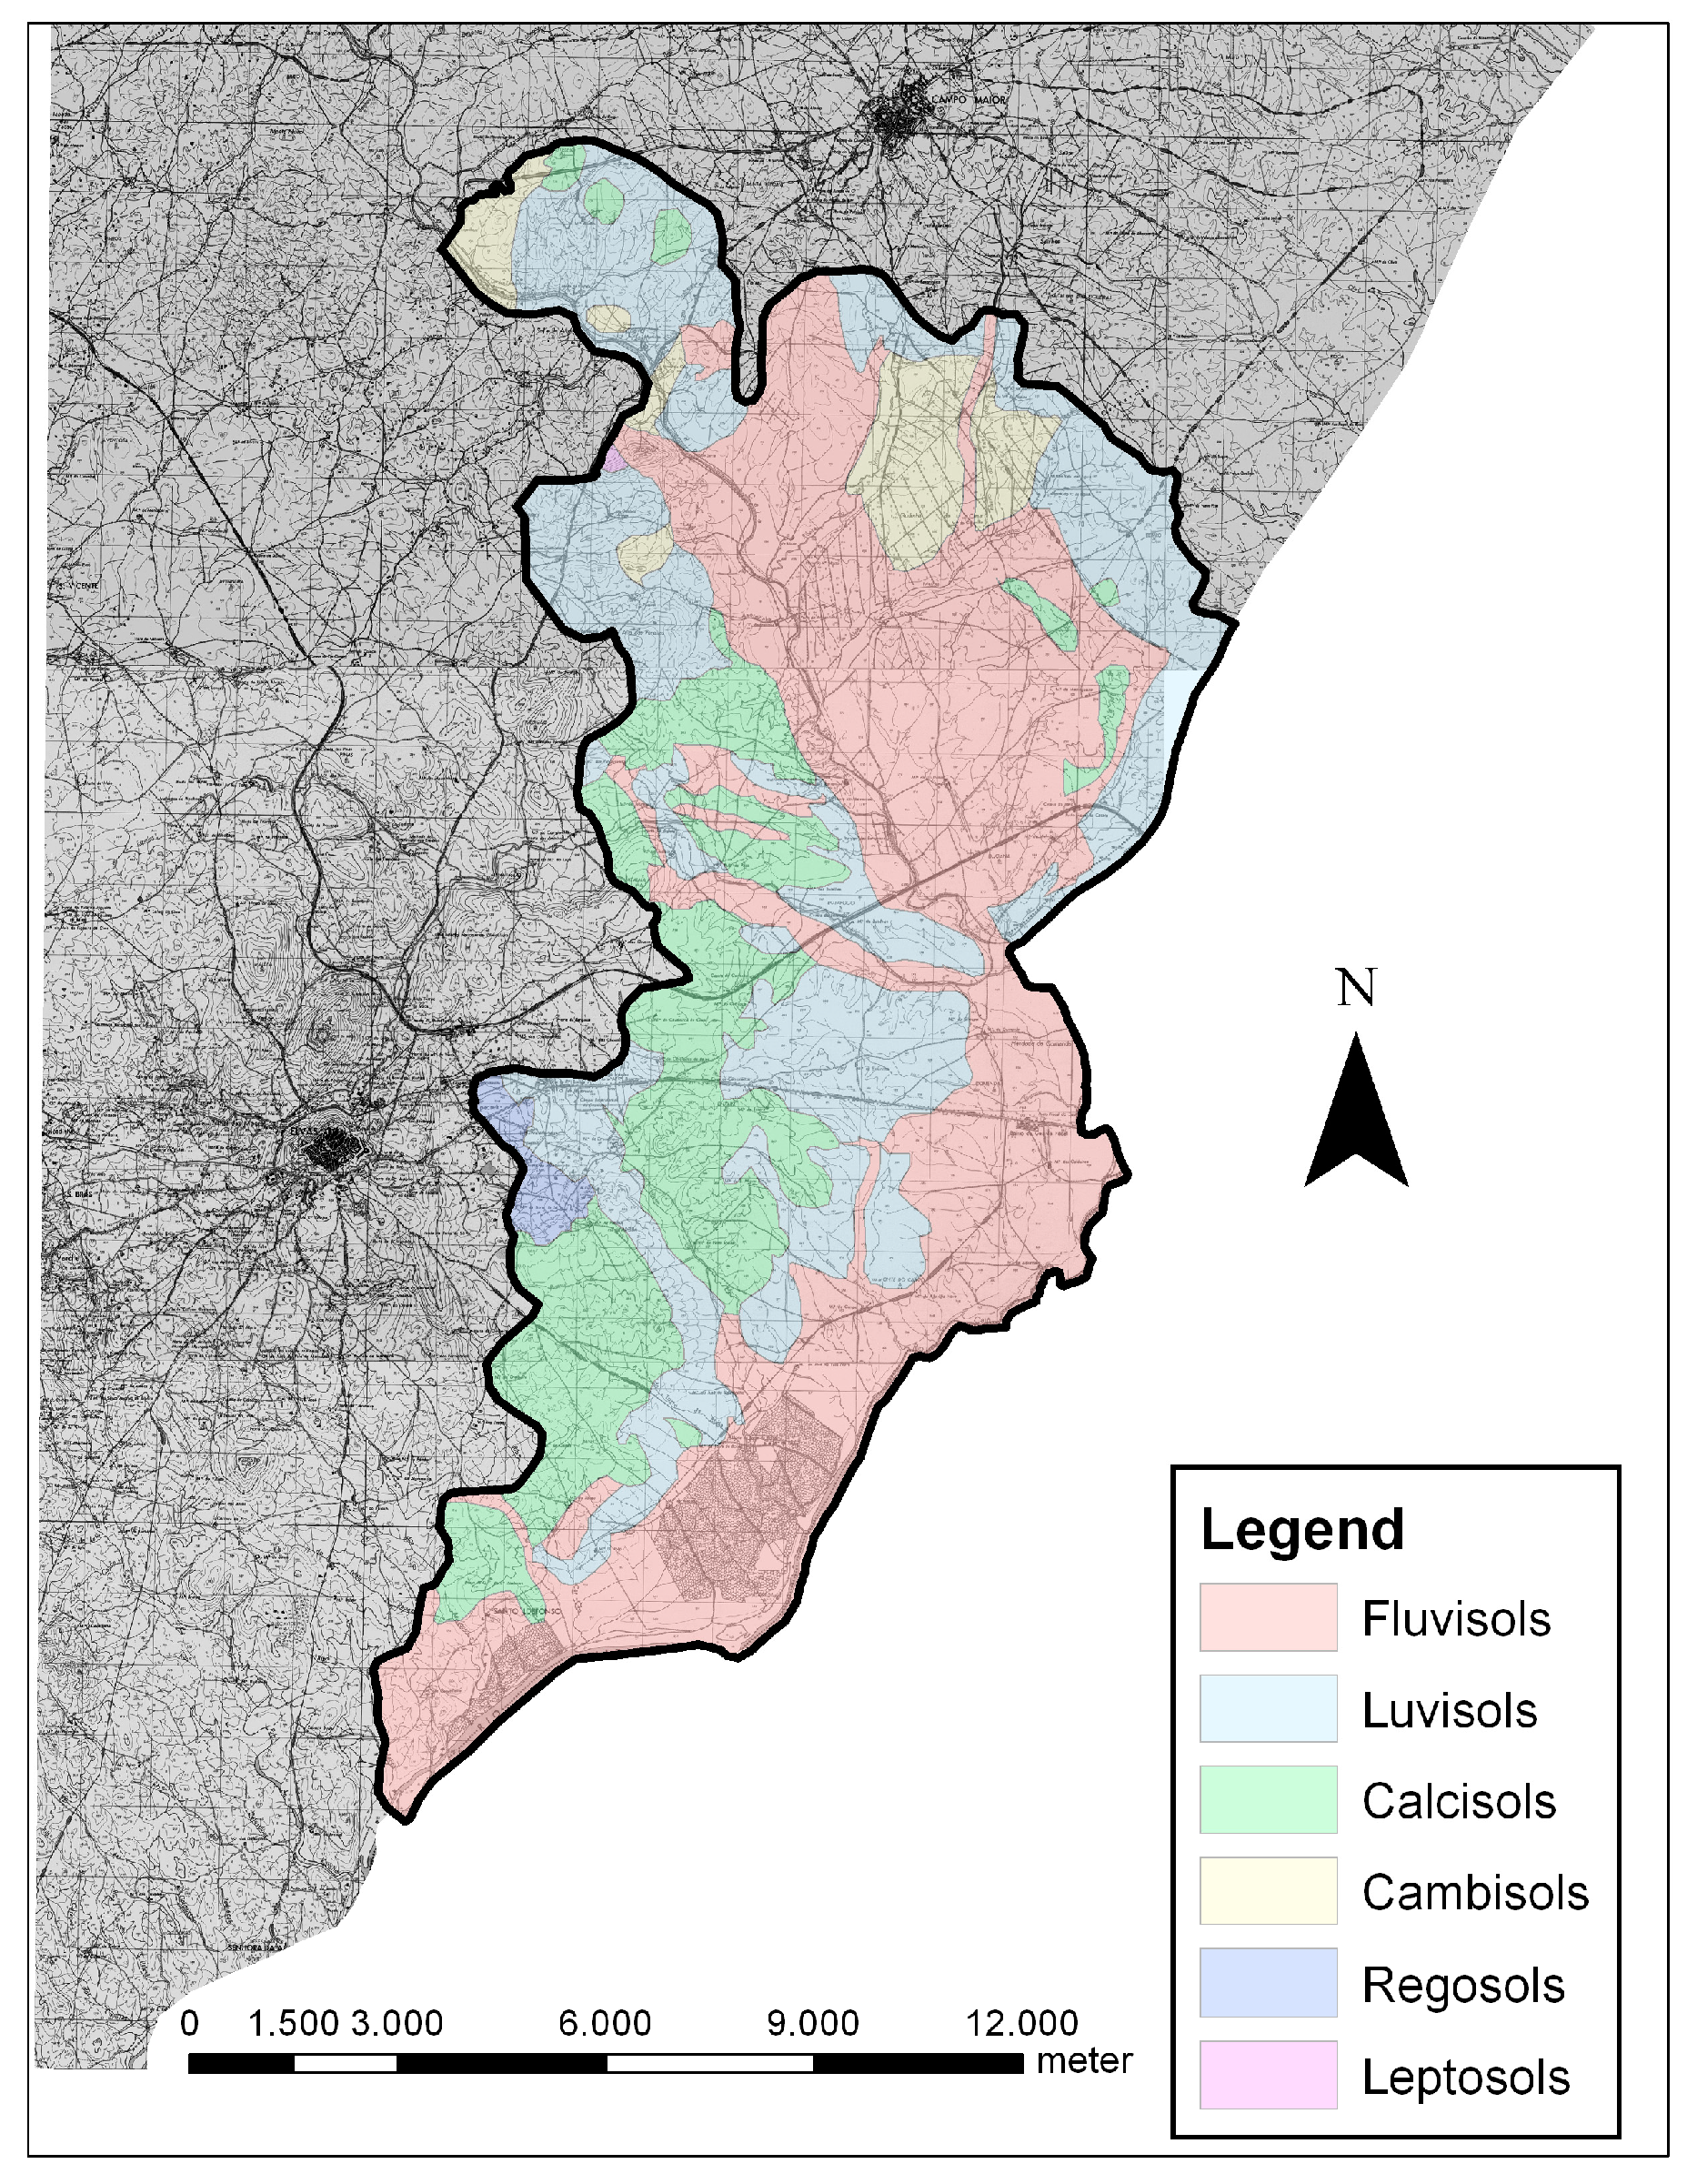
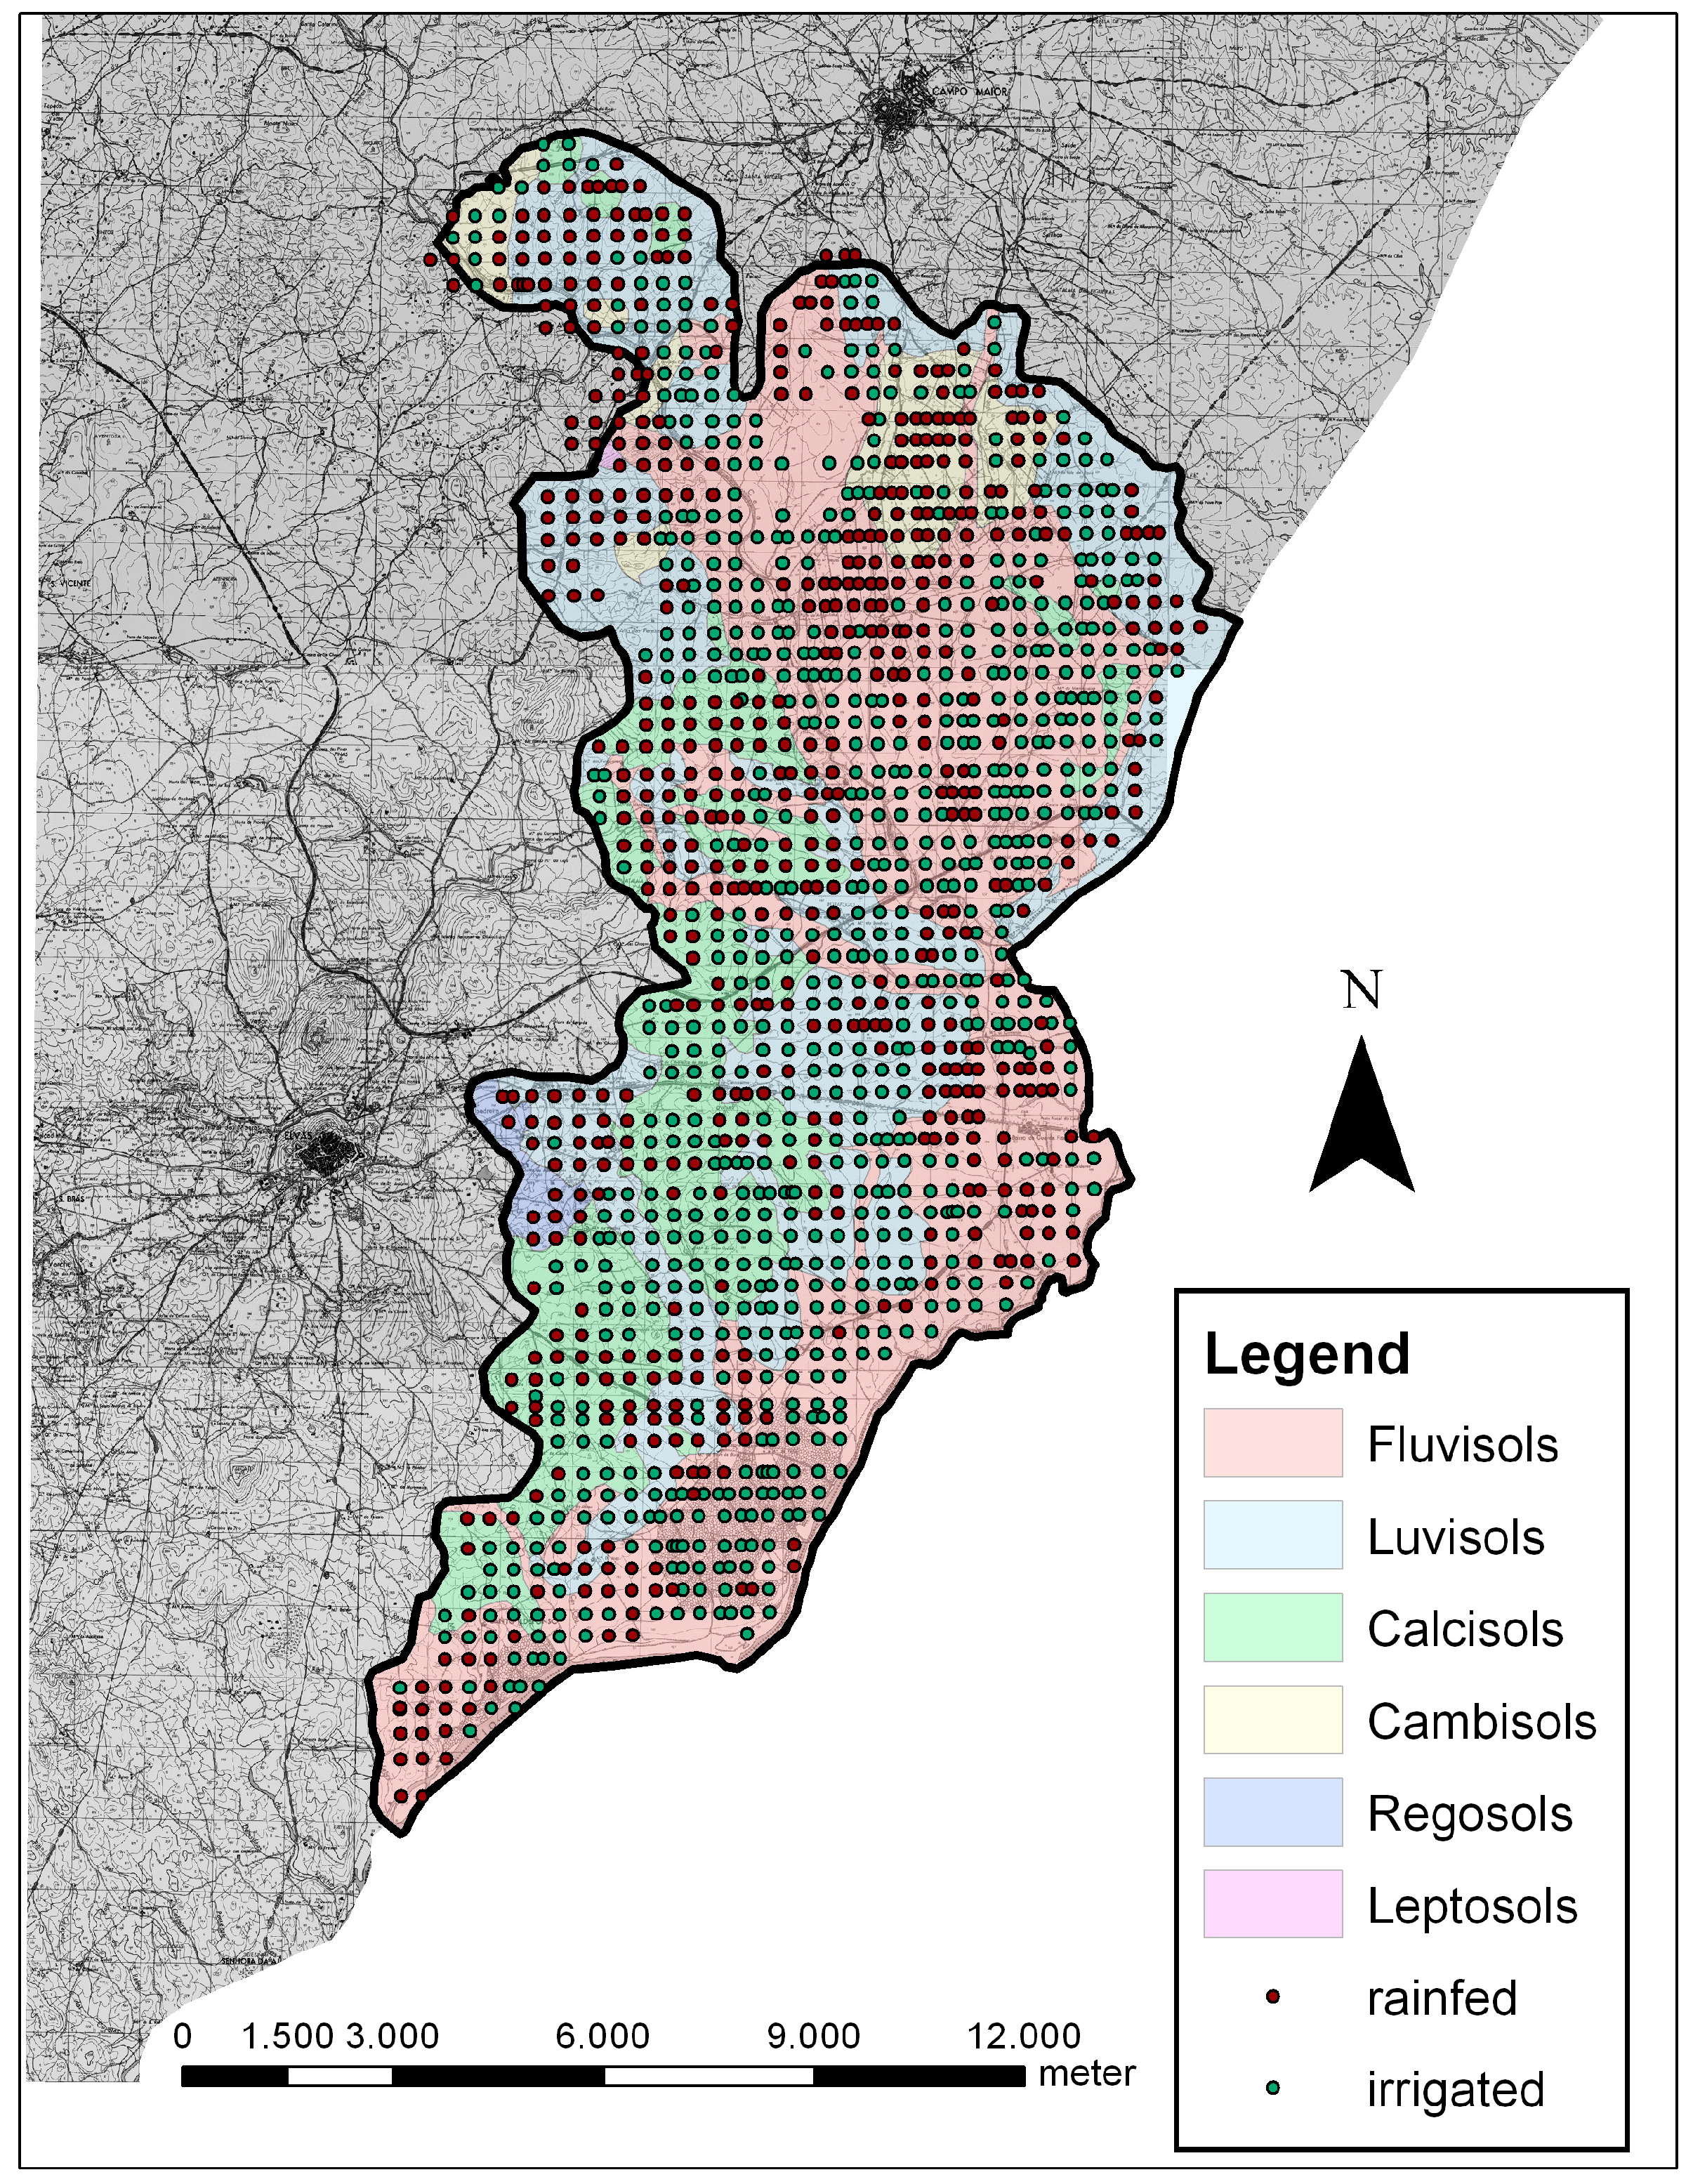
The commonest soil groups in the study area are Fluvisols (45.0%), Luvisols (29.7%), Calcisols (18.7%), Cambisols (5.4%), Regosols (1.1%), and Leptosols (0.1%) (as seen in Table 1 and Figure 2), as is usual in Mediterranean ecosystems [22]. In general, according to Nunes (2003), these are medium-loam and clay-loam soils with a pH close to 7, slightly calcareous, low levels of soil organic matter (SOM, 1.54%), and total nitrogen (N, 0.1%) [22].
To assess the influence of the irrigation practice on the soil exchange complex we compared the rainfed and irrigated values. The starting point for the analysis that follows is a sample universe with the data of 1243 samples belonging to the Caia Irrigation Perimeter and analyzed for this paper. The sample universe: 647 samples belong to irrigated soils and 596 samples to rainfed soils. While part of the area under analysis has been irrigated since 1969, when the irrigation perimeter was established, there are others that were under irrigation for 30 or 20 years [22]. Regarding water quality, as mentioned before, the irrigation water is considered by the FAO as very good, both with low values of sodicity and salinity. The amount of water used per hectare, considering main crops, ranges from 3.000 m3 for wheat and 9.000 m3 for corn. Soil texture and permeability were also measured in both systems and there were not found significant differences among them.
In this context, we begin by making a sample division by water feeding systems and the major soil groups that make up the perimeter of the Caia irrigation district, as illustrated in Table 2 and Figure 3.
We point out that the sample proportion of rainfed and irrigated is balanced and that there was no crop in the irrigation system installed in a Leptosol. We justify this fact by the cartographic position of these soils as, because they are only found in the limits of the study area, its samples were discarded. We also point out that the soils belonging to the Regosols group does not have a statistically significant number of samples and, therefore, will not be discussed.

3.1. Exchangeable Sodium

This is a very important parameter as it reflects one of the main environmental impacts of irrigation: the sodization of the soils. Even with the good quality water of the Caia Irrigation Perimeter, the amount of exchangeable sodium increases leading to an increase of it in the soil exchange complex.
In the rainfed soils, the content of the exchangeable sodium is, on average, 0.18 cmol(+)·kg−1 and in the irrigated soils the value rises to 0.19 cmol(+)·kg−1, which though representing an increment of 5.5% is not significant at the agricultural level. The strongest registered value appears in the irrigated Luvisol soil group with 0.22 cmol(+)·kg−1, and the weakest registered value appears in the rainfed Leptosol soil group with 0.11 cmol(+)·kg−1 as seen in the Table 3.
Performing the same analysis for the ESP values in the Table 4 shows that the trend of variation is not at all identical to what we had already found for exchangeable sodium content. The explanation for this result may also be similar, that is, an increase in the amount of sodium content in the soil motivated by this element introduced by the irrigation water, logically corresponds to an increase of its proportion in the soil exchange complex.
It should be noted that, although we attribute a high importance to the increase in the proportion of sodium in the soil exchange complex, the degree of saturation of sodium in the soils of the Caia Irrigation Perimeter is still far from the 15% referenced by the FAO and the USDA as the limit from which the soil becomes unproductive, or even the 10% referenced by some authors [28,29,30] as the limit. However, the irrigated soils have an Exchange Sodium Percentage (ESP) 17% higher than the rainfed soils, so this should be a parameter to monitor. Moreover, it is important to notice that the predominant clay mineral at the study area is a 2:1 montmorillonite, which adsorbs with greater strength the cations with higher valence and smaller dimensions.
Although the irrigation water used in the irrigation perimeter is considered to be of high quality, the explanation for these results are attached to the large amounts of sodium that is served by it. Given the volumes of water utilized for the irrigation of the primary crops and performing the calculation of the amount of sodium introduced in the soil by this means, one can easily reach the conclusion that, annually, several kilograms of sodium are added to the ground, leading to the results just noted.
If we analyze the effect of the irrigation practice on the exchangeable sodium content and taking into account the group to which the studied soils belong, we found that (with the exception of Calcisols) in all soil groups, the contents of this exchange base increase with irrigation.

3.2. Cation Exchange Capacity

While rainfed soils have a Cation Exchange Capacity (CEC) of 29.20 cmol(+)·kg−1 on average, the irrigated ones have 25.58 cmol(+)·kg−1. Thus, the CEC of the soil decreases significantly (12%) with the practice of irrigation. We believe that the explanation for this reduction in the CEC values lies in the fact that irrigation induces a decrease in the content of the soil’s organic matter by promoting its mineralization [23], and with this decrease the number of available sites for cation adsorption decreases, as this is the soil constituent with the greater ability for developing superficial charges. The decrease in CEC is also related to the increase of the sodium ion content which has a strong deflocculating effect, destroying the soils mineral colloids. This is very important since the exchange complex is one of the pillar-base of soil fertility. In this case, we are witnessing an effective decrease in the soil’s ability to retain cation nutrients, thereby reducing its ability to maintain an approximately constant concentration of nutrients throughout the agricultural epochs and to retain elements that otherwise will be free, which can be easily swept away by leaching with serious consequences in terms of environmental pollution. The only way to counteract this decrease in the CEC is by providing organic matter to the soil and maintaining the levels of this constituent. Regarding pH, while there was a significant decrease in its value for Fluvisols and Regosols; for Luvisols, Calcisols, and Cambisols the obtained results show that there are insignificant changes due to a higher buffer capacity.
If we analyze the effect of irrigation on the CEC of the various soil groups (Table 5), we find that this decreases significantly in all groups except in Luvisol soils. The explanation for these results is the same as we have been presenting.

3.3. Parametric Maps

From the study, conducted on the chemical characteristics of the surface layer of the soil in the Caia Irrigation Perimeter and neighboring areas, we obtained a wide georeferenced information that, recurring to GIS software, allowed us to develop a set of parametric maps. The starting point for the following analysis is constituted by a sample universe with 1243 data samples.

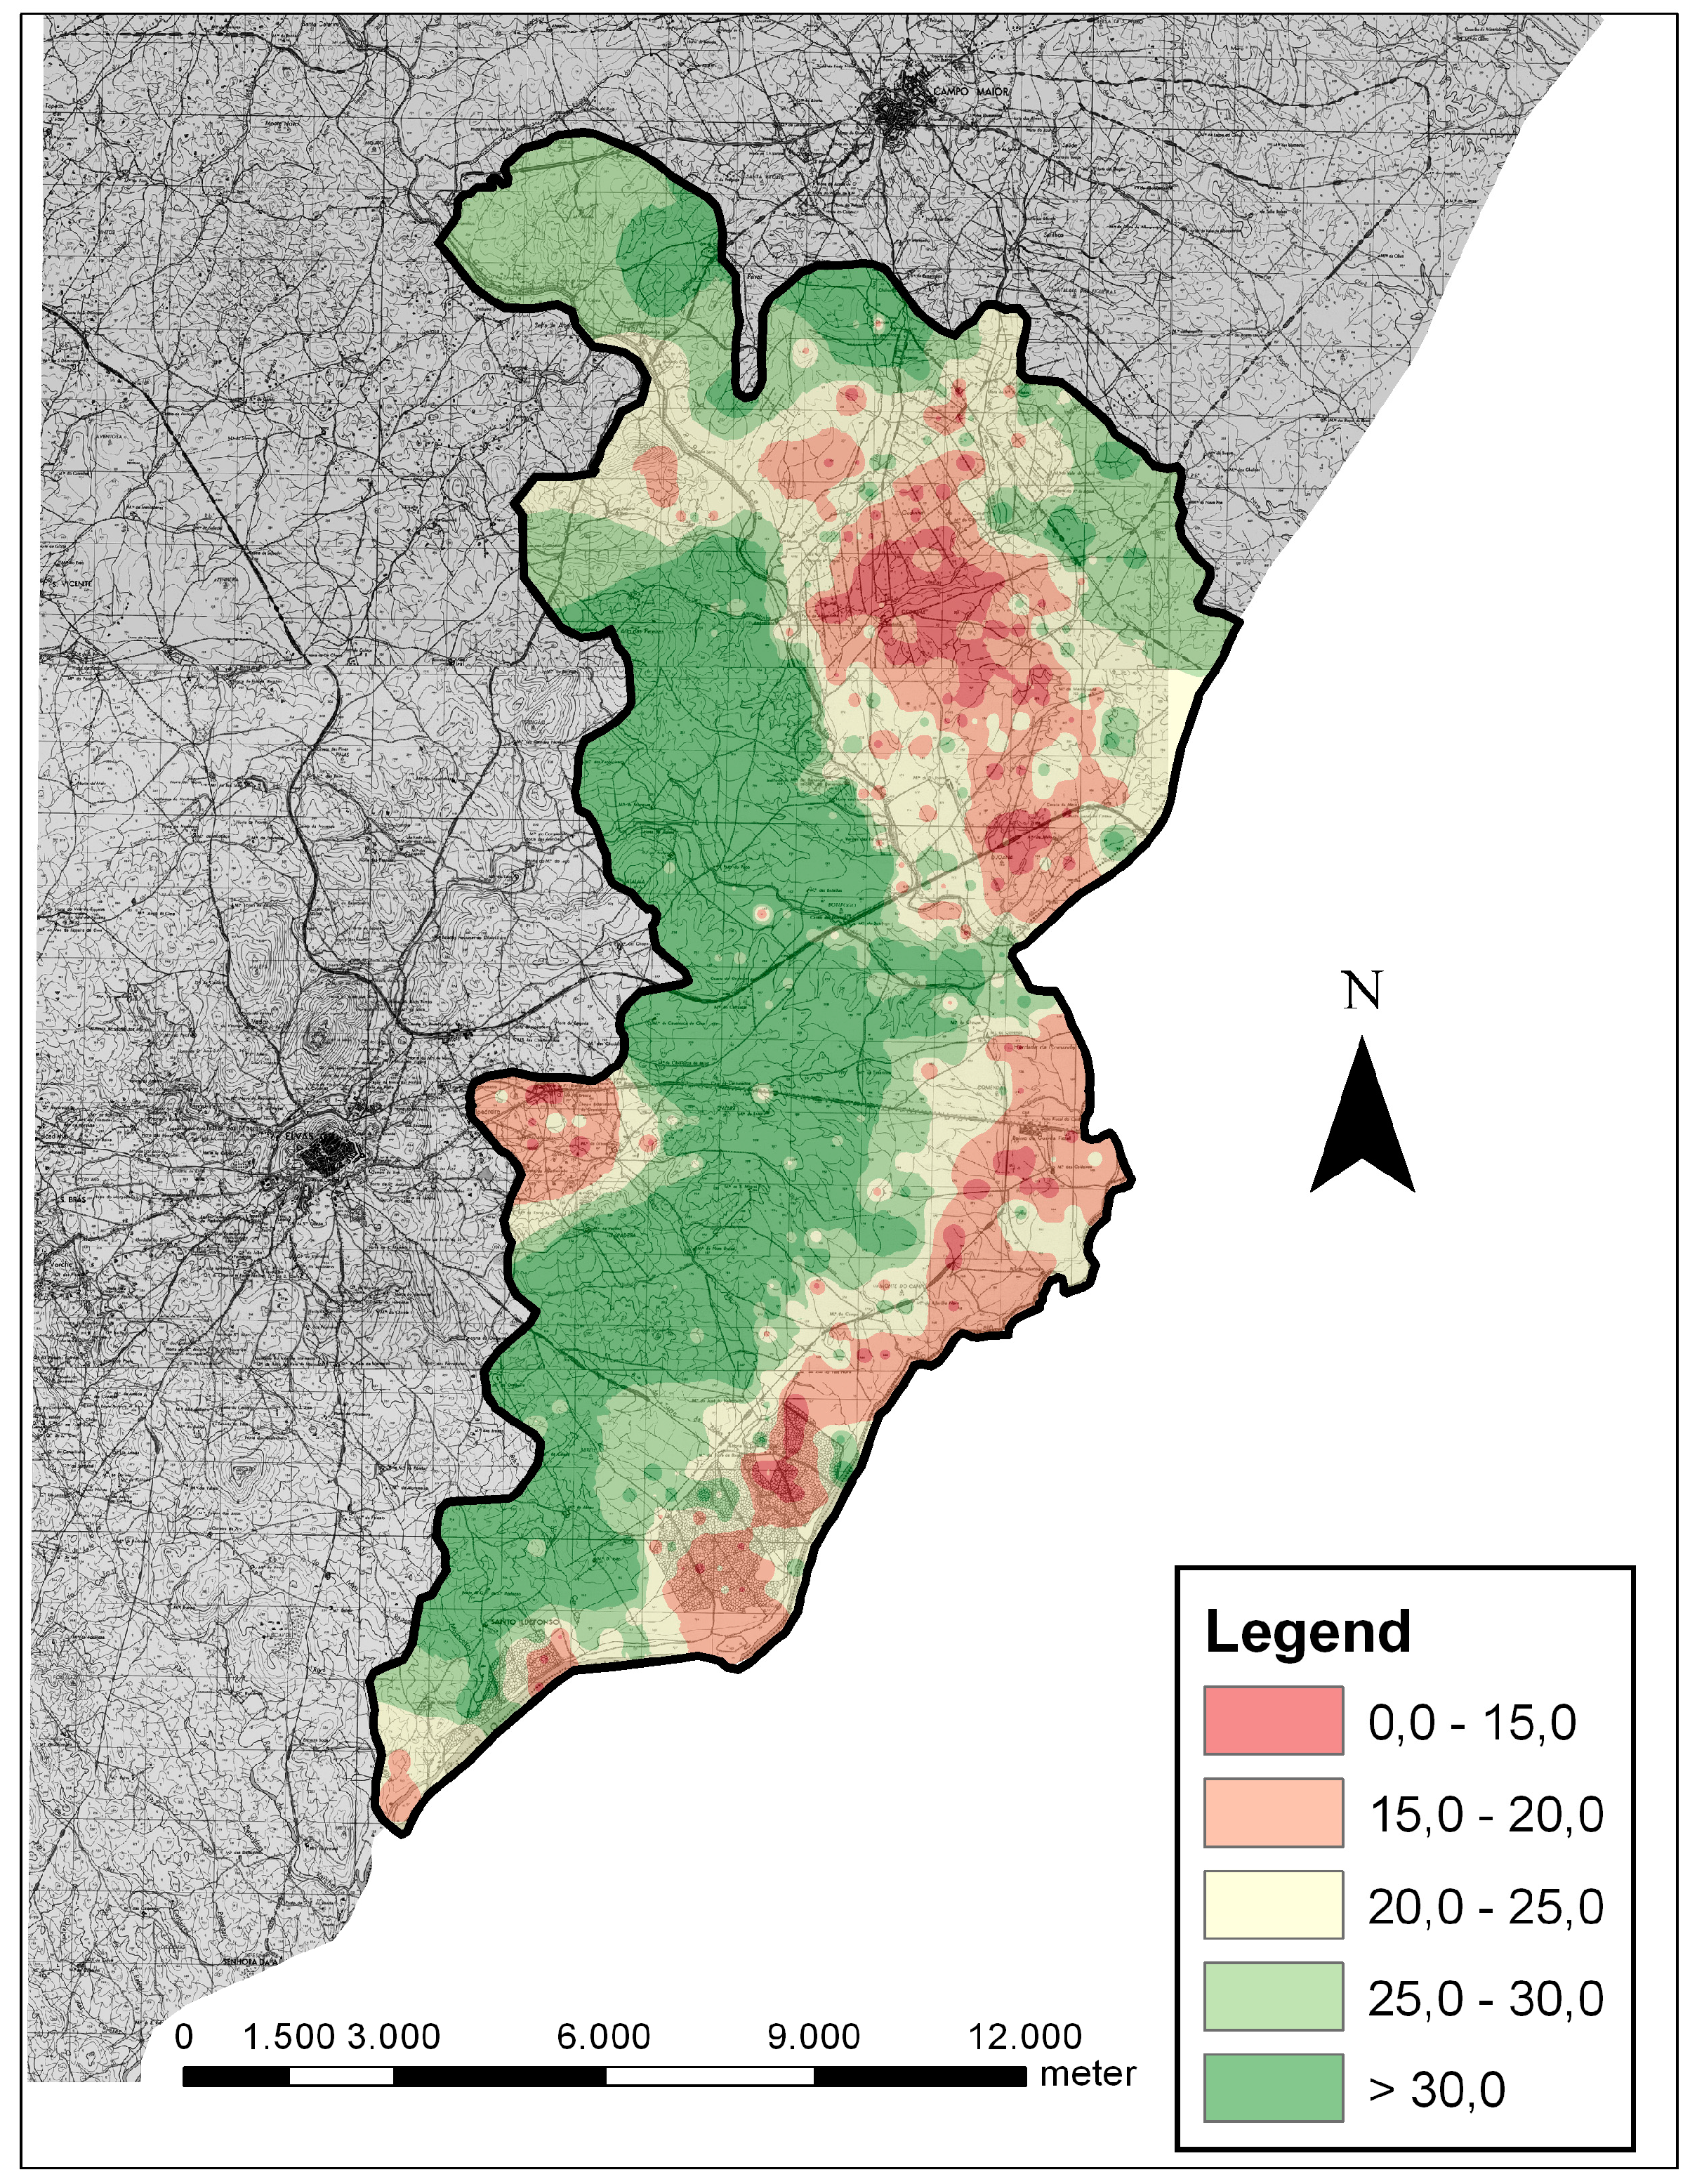
3.3.1. Cation Exchange Capacity

The Cation Exchange Capacity (CEC) levels in the soils of the Caia Irrigation Perimeter lie mostly (93.1%) between the 15 cmol(+)·kg−1 and 30 cmol(+)·kg−1. Only 3.4% of the soil groups have CEC values below 15 cmol(+)·kg−1 and only 3.5% of the irrigation area of the soil has a CEC higher than 30 cmol(+)·kg−1 (Table 6).
The corresponding map for the distribution of Cation Exchange Capacity Perimeter in the Caia Irrigation Perimeter and surrounding areas—the study area—can be seen in Figure 4.

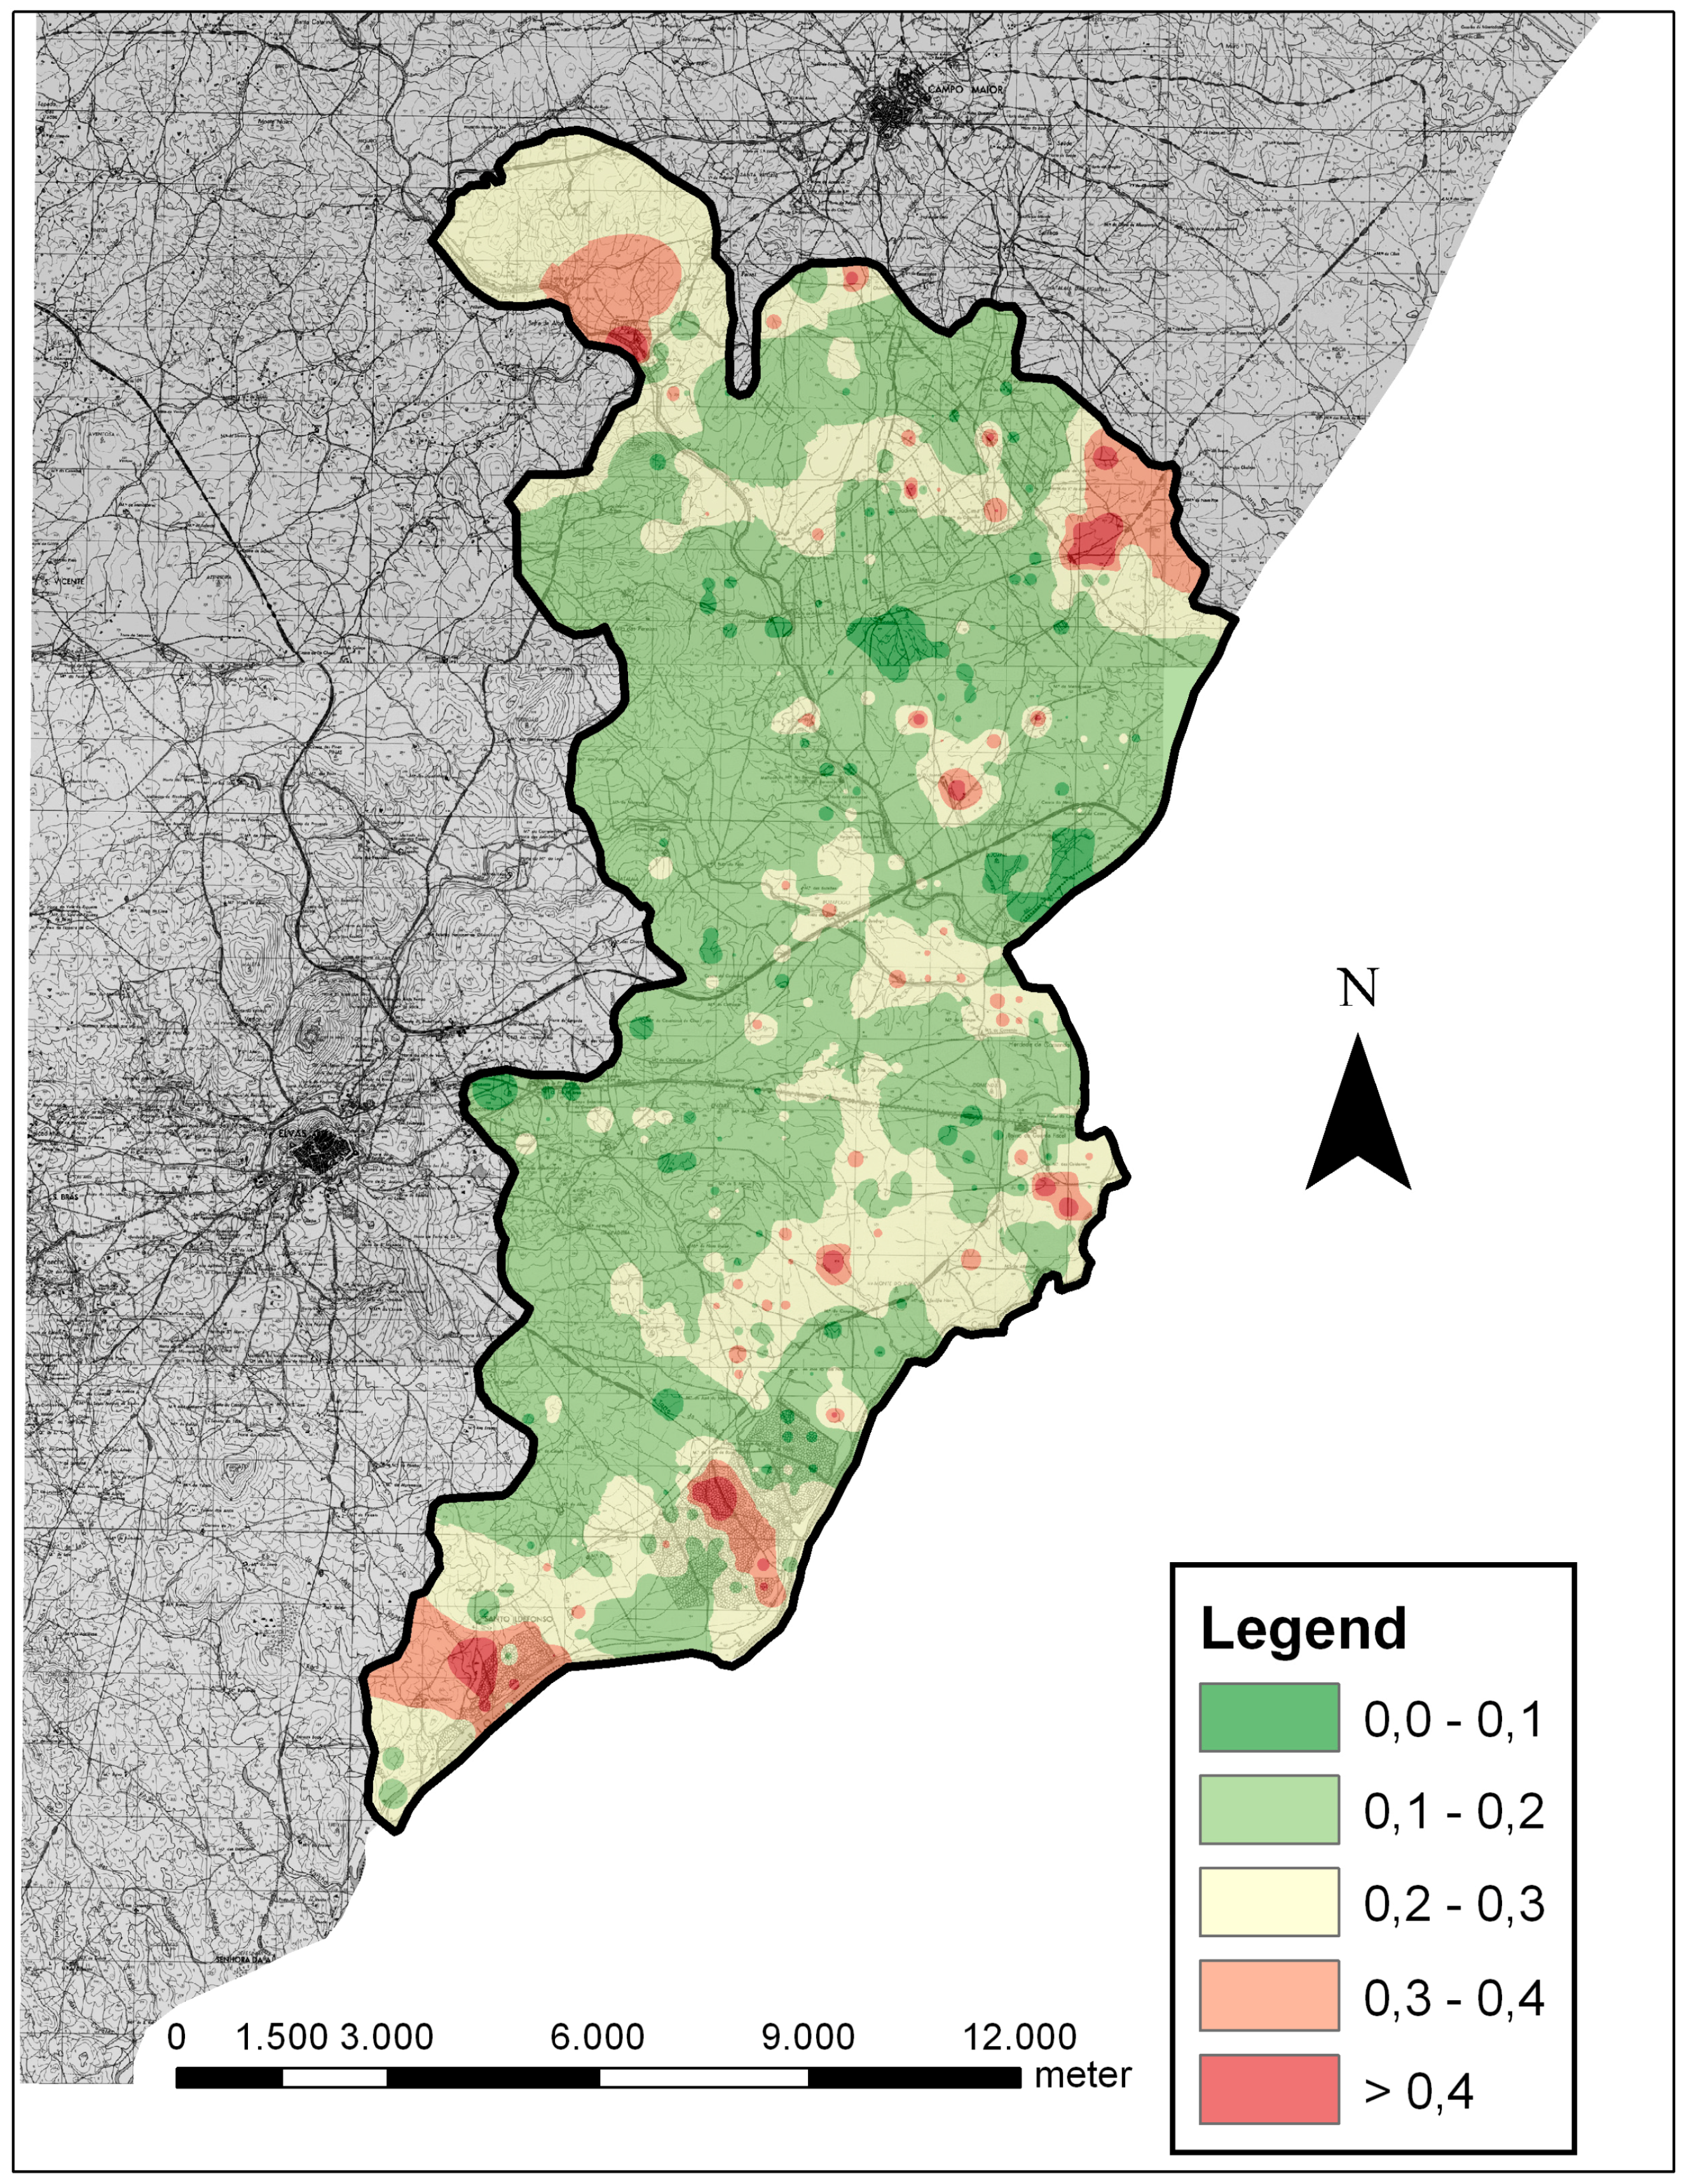
3.3.2. Exchange Sodium

The exchange sodium levels in the Caia Irrigation Perimeter soils are predominantly low with about 98.9% of its soils with 0.40 cmol(+)·kg−1 or below exchange sodium content, whereas only 1.1% have an exchange sodium content higher than 0.4 cmol(+)·kg−1 (Table 7). High exchangeable sodium levels are associated with the destruction of soil colloids with the consequent decline in the soil’s physical characteristics. This increase in the proportion of exchange sodium in the exchange complex is generally associated with fertilization and especially with irrigation, hence, it is an aspect of particular importance in the study of an irrigation perimeter.
The corresponding map for the study area can be seen in Figure 5.

4. Conclusions

As it has been concluded by previous studies [31,32], in general, irrigation leads to significant decreases in CEC. Still, the analysis performed in this study enabled us to put forward some precise data regarding the effect of irrigation in different soil groups, the Cambisols being the group where this decrease is more evident and the Calcisols and Luvisols being the ones where the values of these parameters undergo a minor change along irrigation practice. Moreover, irrigation also leads to an increase in exchange sodium content, with the Luvisols soil group being the most affected. The type of soil least affected by sodization is the Calcisols soil group. Still, it is important to notice that the present results are preliminary, and the findings need to be extensively studied in future work.
Nonetheless, the performed research enabled us to conclude that even if exchange sodium values are low, registering values mainly below the 0.30 cmol(+)·kg−1, monitoring this parameter constitutes a crucial task towards agricultural sustainability, as its values tend to increase where irrigation is practiced, leading to an increase of the proportion of sodium in the soil exchange complex. This happens mainly due to the copious volume of water—regardless of water quality—that is used and the fact that crops absorb it in such small quantities that it accumulates in the soil. The prevalence of the exchange sodium in the soil exchange complex was determined through the PST equation and the results show that it is increasing in the overwhelming majority of the CIP group soils so its monitoring is essential. These numbers are still far from the international reference to consider a soil wasteland which is found at the 10%–15% mark, depending on the authors.
The performed study enabled us to conclude that continued irrigation contributes to increasing the content of exchange sodium, since the irrigation water—though of good quality—naturally contains a certain amount of sodium which is progressively adsorbed on the soil complex.
Additionally, even if the collected data was sufficient to conclude that the Caia Irrigation Perimeter’s exchangeable sodium content is less than 0.40 cmol(+)·kg−1 in 98.9% of the total area, further studies are necessary in order to establish a spatial distribution pattern for this parameter.
Finally, it is important to notice that the use of geostatistics through GIS constitutes a powerful tool to access the sustainability of agricultural landscapes, corroborating with the ideas put forward in previous studies [33,34].

Acknowledgments

The authors would like to acknowledge financial support given by National Funds provided by FCT—Foundation for Science and Technology through project UID/SOC/04020/2013, and the support given to Luis Loures as a Post-Doc fellow at GORSAS (Research Group on Soils, Water and Sediments Management, Conservation and Recovery)—Universidad de Extremadura, throughout his postdoctoral research.

Author Contributions

Luis Loures and José Nunes conceived and designed the experiments; Luis Loures, José Nunes and José Gama performed the experiments; Luis Loures, António Piñeiro and José Nunes analyzed the data; Luís Loures, José Gama, José Nunes and António Piñeiro contributed with analysis tools and wrote the paper.

Conflicts of Interest

The authors declare no conflict of interest.

References

  1. Food and Agriculture Organization (FAO), Statistics. Food and Agriculture Organisation, Data Base Results. Available online: http://www.fao.org/statistics/en/ (accessed on 6 June 2016).
  2. Foley, J.; DeFries, R.; Asner, G.; Barford, C.; Bonan, G.; Carpenter, S.; Chapin, S.; Coe, M.; Daily, G.; Gibbs, H.; et al. Global consequences of land use. Science 2005, 309, 570–574. [Google Scholar] [CrossRef] [PubMed]
  3. Guerra, C.; Metzger, M.; Maes, J.; Pinto-Correia, T. Policy impacts on regulating ecosystem services: Looking at the implications of 60 years of landscape change on soil erosion prevention in a Mediterranean silvo-pastoral system. Landsc. Ecol. 2016, 31, 271–290. [Google Scholar] [CrossRef]
  4. Li, P.; Wu, J.; Qian, H. Regulation of secondary soil salinization in semi-arid regions: A simulation research in the Nanshantaizi area along the Silk Road, northwest China. Environ. Earth Sci. 2016, 75, 698. [Google Scholar] [CrossRef]
  5. Bruce McCarl, B.; Fernandez, M.; Jones, J.; Wlodarz, M. Climate Change and Food Security. Curr. Hist. 2013, 112, 33. [Google Scholar]
  6. Prosdocimi, M.; Burguet, M.; Di Primac, S.; Sofia, G.; Terold, E.; Comino, J.; Cerdà, A.; Tarolli, P. Rainfall simulation and Structure-from-Motion photogrammetry for the analysis of soil water erosion in Mediterranean vineyards. Sci. Total Environ. 2017, 574, 204–215. [Google Scholar] [CrossRef] [PubMed]
  7. Yang, F.; An, F.; Ma, M.; Wang, Z.; Zhou, X.; Liu, Z. Variations on Soil Salinity and Sodicity and Its Driving Factors Analysis under Microtopography in Different Hydrological Conditions. Water 2016, 8, 227. [Google Scholar] [CrossRef]
  8. Despommier, D. The rise of vertical farms. Sci. Am. 2009, 301, 80–87. [Google Scholar] [CrossRef] [PubMed]
  9. Bonfante, A.; Eugenia Monaco, E.; Alfieri, S.; De Lorenzi, F.; Manna, P.; Basile, A.; Johan Bouma, J. Chapter Two—Climate Change Effects on the Suitability of an Agricultural Area to Maize Cultivation: Application of a New Hybrid Land Evaluation System. Adv. Agron. 2015, 133, 33–69. [Google Scholar]
  10. Kim, Y.; Seo, Y.; Kraus, D.; Klatt, S.; Haas, E.; Tenhunen, J.; Kiese, R. Estimation and mitigation of N2O emission and nitrate leaching from intensive crop cultivation in the Haean catchment, South Korea. Sci. Total Environ. 2015, 529, 40–53. [Google Scholar] [CrossRef] [PubMed]
  11. Wood, S.; Rhemtulla, J.; Coomes, O. Intensification of tropical fallow-based agriculture: Trading-off ecosystem services for economic gain in shifting cultivation landscapes? Agric. Ecosyst. Environ. 2016, 215, 47–56. [Google Scholar] [CrossRef]
  12. Altieri, M.; Nicholls, C.; Henao, A.; Lana, M. Agroecology and the design of climate change-resilient farming systems. Agron. Sustain. Dev. 2015, 35, 869–890. [Google Scholar] [CrossRef]
  13. Junqueira, A.; Stomph, T.; Clementc, C.; Struik, P. Variation in soil fertility influences cycle dynamics and crop diversity in shifting cultivation systems. Agric. Ecosyst. Environ. 2016, 215, 122–132. [Google Scholar] [CrossRef]
  14. Mateos, L.; Araus, J. Hydrological, engineering, agronomical, breeding and physiological pathways for the effective and efficient use of water in agriculture. Agric. Water Manag. 2016, 164, 190–196. [Google Scholar] [CrossRef]
  15. Zhang, D.; Guo, P. Integrated agriculture water management optimization model for water saving potential analysis. Agric. Water Manag. 2016, 170, 5–19. [Google Scholar] [CrossRef]
  16. Singh, A. Hydrological problems of water resources in irrigated agriculture: A management perspective. J. Hydrol. 2016, 541, 1430–1440. [Google Scholar] [CrossRef]
  17. IUSS Working Group WRB. World Reference Base for Soil Resources 2014, Update 2015 International Soil Classification System for Naming Soils and Creating Legends for Soil Maps; World Soil Resources Reports No. 106; FAO: Rome, Italy, 2015. [Google Scholar]
  18. Sojka, R.E.; Bjorneberg, D.L.; Entry, J.A. Irrigation: An Historical Perspective. Encycl. Soil Sci. 2002. Available online: https://eprints.nwisrl.ars.usda.gov/815/1/1070.pdf (accessed on 6 June 2016). [Google Scholar]
  19. Vengosh, A. Salinization and saline environments. Treatise Geochem. 2003, 9, 333–365. [Google Scholar]
  20. Aldakheel, Y. Assessing NDVI spatial pattern as related to irrigation and soil salinity management in Al-Hassa Oasis, Saudi Arabia. J. Indian Soc. Remote Sens. 2011, 39, 171–180. [Google Scholar] [CrossRef]
  21. Rietz, D.; Haynes, R. Effects of irrigation-induced salinity and sodicity on soil microbial activity. Soil Biol. Biochem. 2003, 35, 845–854. [Google Scholar] [CrossRef]
  22. Nunes, J. Los Suelosdel Perímetro Regabledel Caia (Portugal): Tipos, Fertilidade, e Impacto Delriegoen sus Propriedades Químicas. Ph.D. Thesis, Universidad de Extremadura, Badajoz, Spain, 2003. [Google Scholar]
  23. Nunes, J.M.; López-Piñeiro, A.; Albarrán, A.; Muñoz, A.; Coelho, J. Changes in selected soil properties caused by 30 years of continuous irrigation under Mediterranean conditions. Geoderma 2007, 139, 321–328. [Google Scholar] [CrossRef]
  24. Mcbeth Division of Kollmorgen Instruments Corporation (Ed.) Munsel Soil Color Charts. In U.S. Dept. Agriculture Handbook 18—Soil Servey Manual; National Soil Survey Center: New York, NY, USA, 1994.
  25. Torrent, J.; Campillo, M.; Barrón, V. Short communication: Predicting cation exchange capacity from hygroscopic moisture in agricultural soils of Western Europe. Span. J. Agric. Res. 2015, 13. [Google Scholar] [CrossRef]
  26. Lewis, D. Analytical Data on Reference Clay Materials. Sect. 3, Base-Exchange Data, Reference Clay Minerals; A.P.I. Research Project 49, Preliminary Report No. 7; Columbia University: New York, NY, USA, 1949; p. 91. [Google Scholar]
  27. Elfaki, J.; Gafer, M.; Sulieman, M.; Ali, M. Comparison and Evaluation of Two Analytical Methods for Cation Exchange Capacity and Exchangeable Sodium Percentage of Five Soil Types in Central Sudan. Open J. Soil Sci. 2015, 5, 311–318. [Google Scholar] [CrossRef]
  28. Curtin, D.; Steppuhn, H.; Mermut, A.; Selles, F. Sodicity in irrigated soils in Saskatchewan: Chemistry and structural stability. Can. J. Soil Sci. 1995, 75, 177–185. [Google Scholar] [CrossRef]
  29. Miller, R.; Donahue, R. Soils in Our Environment, 7th ed.; Prentice Hall: Upper Saddle River, NJ, USA, 1995; p. 649. [Google Scholar]
  30. Shainberg, I.; Letey, J. Response of soils to sodic and saline conditions. Hilgardia 1984, 52, 1–57. [Google Scholar] [CrossRef]
  31. Loures, L.; Nunes, J.; López-Piñeiro, A.; Loures, A.; Navarro, A. Assessing Soil Edaphic Properties’ influence in Phosphorus Adsorption in Vertisols—Extremadura (Spain). Int. J. Energy Environ. 2015, 9, 53–60. [Google Scholar]
  32. Nunes, J.; Loures, L.; Lopez-Piñeiro, A.; Loures, A.; Vaz, E. Using GIS towards the Characterization and Soil Mapping of the Caia Irrigation Perimeter. Sustainability 2016, 8, 368. [Google Scholar] [CrossRef]
  33. Loures, L.; Loures, A.; Nunes, J.; Panagopoulos, T. Landscape Valuation of Environmental Amenities throughout the Application of Direct and Indirect Methods. Sustainability 2015, 7, 794–810. [Google Scholar] [CrossRef]
  34. Ferreira, V.; Panagopoulos, T.; Andrade, R.; Guerrero, C.; Loures, L. Spatial variability of soil properties and soil erodibility in the Alqueva dam watershed, Portugal. Solid Earth 2015, 7, 301–327. [Google Scholar] [CrossRef]
Figure 1. Localization map of the area studied.
Sustainability 09 00405 g001
Figure 2. Representativity of various soils in the study area.
Sustainability 09 00405 g002
Figure 3. Number of sample points by water feeding system and soil type.
Sustainability 09 00405 g003
Figure 4. Distribution map of exchange sodium levels in the Caia Irrigation Perimeter.
Sustainability 09 00405 g004
Figure 5. Distribution map of exchange sodium levels in the Caia Irrigation Perimeter.
Sustainability 09 00405 g005
Table 1. Representativity of various soils in the study area.
SOILArea (ha)%
Fluvisols6760.745.0
Luvisols4465.329.7
Calcisols2807.718.7
Cambisols818.25.4
Regosols168.91.1
Leptosols11.20.1
Table 2. Number of sample points by water feeding system and soil type.
Soils TypesWater Feeding System
RainfedIrrigated
Fluvisols212372
Luvisols192153
Calcisols13884
Cambisols10
Regosols52
Cambisols4836
Table 3. Variation of the exchangeable sodium content depending on the soil type and water feeding system.
Soil TypeExchangeable Na+ (cmol(+)·kg−1)
RainfedIrrigated
Fluvisols0.19a0.19a
Luvisols0.18a0.22b
Calcisols0.17a0.16a
Leptosols0.11n/d
Regosols0.120.08
Cambisols0.17a0.19b
Note: In any given row, the values followed by the same letter do not differ significantly between them (p < 0.05%).
Table 4. Variation of the exchangeable sodium percentage depending on the soil type and water feeding system.
Soil TypeESP (%)
RainfedIrrigated
Fluvisols0.85a0.94b
Luvisols0.67a0.76b
Calcisols0.47a0.46a
Leptosols0.43n/d
Regosols0.780.41
Cambisols0.76a1.03b
Note: In any given row, the values followed by the same letter do not differ significantly between them (p < 0.05%).
Table 5. Variation of the Cation Exchange Capacity (CEC) depending on the soil type and water feeding system.
CEC (cmol(+)·kg−1)
RainfedIrrigated
Fluvisols24.23a21.95b
Luvisols29.19a30.41a
Calcisols39.08a35.45b
Leptosols24.80n/d
Regosols15.6820.40
Cambisols24.27a19.73b
Note: In any given row the values followed by the same letter do not differ significantly between them (p < 0.05%).
Table 6. Distribution of the study area by different cation exchange capacity content classes.
Cation Exchange Capacity (cmol(+)·kg−1)Área (ha)%
0.0–15.0508.03.4
15.0–20.06073.040.4
20.0–25.03176.321.1
25.0–30.04746.031.6
>30.0528.73.5
Table 7. Distribution of the study area by different exchange sodium content classes.
Exchange Sodium (cmol(+)·kg−1)Área (ha)%
0.0–0.1233.81.6
0.1–0.19391.162.5
0.2–0.14310.028.7
0.3–0.1937.16.2
>0.41601.1

