Article

The Development of a GIS-Based Model for Campus Environmental Sustainability Assessment

by
Habib M. Alshuwaikhat
1,*,
Ismaila R. Abubakar
2,
Yusuf A. Aina
3,
Yusuf A. Adenle
1,* and
Muhammad Umair
1
1
Department of City and Regional Planning, King Fahd University of Petroleum & Minerals, KFUPM Box 1632, Dhahran 31261, Saudi Arabia
2
College of Architecture and Planning, University of Dammam, P.O. Box 2397, Dammam 31451, Saudi Arabia
3
Department of Geomatics Engineering Technology, Yanbu Industrial College, Yanbu 41912, Saudi Arabia
*
Authors to whom correspondence should be addressed.
Sustainability 2017, 9(3), 439; https://doi.org/10.3390/su9030439
Submission received: 9 January 2017 / Revised: 13 March 2017 / Accepted: 14 March 2017 / Published: 17 March 2017
(This article belongs to the Section Sustainable Education and Approaches)

Abstract

:
Sustainability indicators and assessments are vital in promoting campus sustainability. Despite the plethora of indicator frameworks, campus sustainability assessment in developing countries encounters many challenges including lack of, or restricted access to, data and difficulties in measuring indicators. There is also a limited application of Geographical Information Systems (GIS) in campus environmental sustainability assessment, although campus operations have spatial dimensions. This article proposes a GIS-based model for environmental sustainability assessment of campus operations and demonstrates its usefulness using King Fahd University of Petroleum and Minerals, Saudi Arabia. The model applies spatial analysis techniques, including inverse distance weighted (IDW) interpolation, to statistically assess the various campus operational activities by using land use data to estimate greenhouse gas emissions from energy use, water consumption, solid waste, and transportation. The integration of spatial dimension in the model facilitates the collection and measurement of spatially related indicators, helps identify hotspots of campus operations, and provides better visualization of the existing condition and future scenario of campus environmental sustainability status. This model can assist decision-makers to construct strategies for improving the overall environmental sustainability of university campuses. The paper concludes by highlighting how the model can address some challenges of campus sustainability assessment in developing countries.

1. Introduction

There is growing global concern about how to ensure long-term economic development while minimizing its adverse effect on the environment. Due to unsustainable resource use, humanity is facing multiple challenges, including environmental degradation, pollution, global warming, poverty, famine, and water stress. Without protecting the natural environment and human health, while promoting equity in meeting our needs, we run the risk of depriving our future generations of any chance to fulfill their own needs [1]. Not until recently, the concept of sustainability had been primarily applied to a city as an entity. However, within the last two decades, there is a growing focus on the sustainability of building blocks of cities. These building blocks include higher education institutions (HEIs), primarily university campuses. Thus, campus sustainability is becoming an increasingly important issue due to growing amount of resources and energy consumption, multiple operations and the resulting pollution taking place on campuses. Consequently, universities stakeholders (governments, staff, students, parents, alumni, and donors) are increasingly demanding universities to assess the sustainability of different aspects of campus activities and operations and implement strategies to ensure a more sustainable campus environment, and to influence their communities to embrace sustainable behaviors [2].
As sustainability assessment gained widespread recognition as one of the key dimensions of campus sustainability, multiple frameworks have been developed to assess the sustainability of university campuses [3,4,5]. However, there are still challenges in conducting campus sustainability assessment in developing countries. The challenges include lack of or restricted access to data and difficulty in assessing the environmental aspects of campus sustainability. While there is a growing body of literature on the role of GIS in urban sustainability [6,7,8], there are few studies that attempt to explore the role of GIS in campus sustainability assessment, even though GIS could “accelerate efforts to understand and address sustainability challenges” [9].
There is a wide application of GIS system in sustainability assessment. GIS has been utilized for sustainability assessment of a metropolitan area [6,10]. Graymore et al. [11] have developed a GIS-based multiple criteria analysis decision support system for progressing sustainability at regional level. Blaschke [12] has applied GIS for indicators development and sustainable regional planning. However, GIS application in campus sustainability assessment is limited, mainly used as a tool in deploying and implementing university environmental management system [13]. The need to incorporate GIS and spatial dimension into campus sustainability assessment is important because universities are akin to “mini-cities”, thus requiring an environmental assessment process similar to that of cities, as university campuses: (a) have large land areas and population sizes; (b) are often dispersed in many locations; and (c) have diverse land uses and complex operations and activities with spatial dimensions and substantial environmental impacts.
Therefore, this article presents the development of a GIS-Based model for assessing campus environmental sustainability at King Fahd University of Petroleum and Minerals (KFUPM) in Saudi Arabia. By integrating spatial dimension into sustainability assessment of the overall campus operations, the model can address some of the challenges of campus sustainability assessment in developing countries. The remaining parts of the article are organized as follows. In Section 2, the article reviews the imperative of campus sustainability assessment as well as the shortcomings of the existing campus sustainability assessment frameworks. Section 3 describes the research methodology, which includes a brief description of the research design, study area, selection of environmental sustainability indicators, data collection, and the GIS-based spatial analysis techniques utilized in the study. Section 4 presents and discusses the results of campus environmental sustainability assessment, enactment of the model, and modeling of future campus environmental sustainability scenario. Section 5 concludes the article and recommends future research.

2. Literature Review

2.1. The Imperative of Campus Sustainability Assessment

A sustainable campus is a community that “acts upon its local and global responsibilities to protect and enhance the health and well-being of humans and ecosystems” [5] (p. 30). Reference to sustainability in colleges and universities was first made by the Stockholm Declaration of 1972, which identified the correlation between the environment and humanity and advocated for universities to play a major role in achieving environmental sustainability. Thereafter, in 1990, administrators from about 300 HEIs from more than 39 countries on five continents signed the Talloires Declaration, which is a 10-point action plan for integrating sustainability and environmental education into research, teaching, campus operations and community outreach. A year later, in Halifax (Canada), university administrators once more intensified campaigns against the persistent and extensive global environmental degradation. During the Swansea Declaration of 1993, members from at least 399 universities in 47 Commonwealth nations stressed the need to discover ways universities could appropriately mitigate the difficulties of balancing human pursuit for technological advancement with environmental protection.
Thus, through charters and declarations as well as pressure from university stakeholders, universities are beginning to gauge their contributions towards achieving sustainability within and outside their campuses [14,15]. This is because universities play a key role in urban sustainability that include: (a) reducing the negative environmental impact of campus operations and collaborate with public and private sectors, organizations and communities to deploy and implement sustainable practices [16]; (b) producing knowledge and innovation technologies required to contribute in finding solutions to global environmental problems [17]; and (c) preparing future leaders, managers of companies and organizations, and entrepreneurs of new businesses, with competencies required to create a more sustainable communities [2,18,19].
As such, several universities are nowadays taking more responsibility in managing their environmental performance by conducting sustainability assessments and taking initiatives towards improving their campus environment [20,21]. Sustainability assessment has thus emerged as a policy tool whose main purpose is to guide planning decision-making towards environmental sustainability [22]. The term is operationalized in both theory and practice in two distinct ways. First, it is used in checking whether a community or organization is making progress towards sustainability: serving as a technique for performance testing or auditing. Second, it is used for impact assessment process to assess whether proposed policies, legislation, plans or projects are sustainable before their implementation [23]. The quality of sustainability assessment depends on the indicators used and several studies on living green and creating new sustainable communities have stressed the importance of deriving indicators and integrating GIS in sustainability assessment [6,10,11,13]. A university can assess to what extent it is moving towards sustainability based on the following seven core dimensions [24].
(a)
Teaching and curriculum that incorporate sustainability into learning capabilities such as knowledge, skills, and attitudes, so that students are prepared to deal with local and global sustainability issues;
(b)
Reorienting research and scholarship activities and funding to focus more on sustainability issues, interdisciplinary and new knowledge and technologies that can address the contemporary global challenges;
(c)
Campus operations that involve environmental sustainability of everything that keeps the university running, such as green buildings and transportation, sustainable waste management, water and energy conservation, pollution control, health, and wellbeing;
(d)
Institutional framework and governance that involves university policies, missions/visions, signing of declaration/charter and sustainability management;
(e)
Community outreach and collaboration on issues that enhance sustainable development, including community services, student exchange program and partnerships with public and private sectors, and non-governmental organizations;
(f)
On-campus experiences that utilize the university as a “living laboratory” where sustainable practices for students, faculty, and staff are available; and
(g)
Sustainability assessment and reporting, which is the subject of this study.
Within the last two decades, stakeholders have been exerting considerable pressure on universities to periodically conduct and report campus sustainability assessments [2,22]. Some benefits of the assessments include assisting universities to understand where they stand in terms of their sustainability goals or objectives as well as discover problem areas and develop strategies for improvement. Also of importance is the role universities are making in the community as well as that of the community on the universities; and to commit universities and their stakeholders to the course of sustainability [5,25]. According to Dalal-Clayton and Bass, there are three main approaches to sustainability assessment [26]:
(i) Indicator-based assessments: These rely on the use of indicators, chosen systematically to cover a wide range of issues that adequately portray sustainability conditions. As a similar set of indicators were usually used over time, current assessment is comparable with previous ones, thus allowing more consistent coverage from one assessment and reporting period to another. These approaches are not only comprehensive but they also systematically organize and prioritize issues as well as their indicators. Given that they allow clear identification of the strengths and weaknesses of universities, they are more suitable than other approaches for decision-making, performance monitoring, and strategy development. Lukman et al. posited further that because indicator-based assessments are more objective and transparent [27], they are more easily measurable and have higher performance when compared with the other two approaches.
(ii) Narrative assessments: These use a combination of texts, tables, graphs, and maps to describe the overall sustainability performance of a university or city. They represent the most familiar standard approach to environmental measurement. Notable examples are the global health, environment and development reports of the World Health Organization (WHO), UN-Habitat and the World Bank. The major strength of these approaches is that they are familiar, flexible and promote participation, and the assessment can be tailored to the technical skills of participants. However, these approaches are less suitable for campus sustainability assessment as they lack transparency and do not allow trends identification. In addition, parameters are neither consistent nor systematically chosen, thus limiting their worth for making decisions, monitoring progress and developing strategies.
(iii) Accounts of sustainability status: These involve the use of raw data, usually converted to a common unit for measuring and analyzing typically small aspects of environmental sustainability. These approaches can cover some aspects of campus’ environment, society and the economy, such as material and energy account, ecological footprint, and resource consumption, aggregated into a single statement of the sustainability status. Nevertheless, among the drawbacks of sustainability accounts that make them less suitable for campus sustainability assessment include their reliance on values, judgments, assumptions, as well as the lack of consistency, the possibility of omitting some parameters, and fewer opportunities for wide stakeholder involvement.
The development of sustainability assessment indicators has gone through many stages. In the 1970s, cities, agencies and organizations assess the performance of their systems based on financial, technical and social criteria. During the 1980s, carbon emissions, and environmental degradation were the prime focus of sustainability assessment practices. From 1990s, both academic research, as well as practice, started to look at environmental in conjunction with socio-economic issues for sustainability assessment, although sustainability assessment and reporting in many universities focuses more on campus greening [28].

2.2. Shortcomings of the Existing Campus Sustainability Indicator Frameworks

Campus sustainability assessment is primarily based on sets of indicators and guidelines formulated under a framework or a rating system, which compile information based on certain criteria and combine them during the assessment to come up with results regarding sustainability ranking or standing of a university campus. However, there is a lack of integration of sustainability assessment indicators with spatial dimension of academic campuses even though they have diverse land uses, complex operations and activities covering a substantial geographical area and with severe environmental impacts.
Certainly, spatial dimension is imperative for more effective environmental sustainability assessment. To more effectively carry out complex decision or problem solving such as sustainability assessment in large environments such as university campuses, there is the need to integrate data with spatial dimension and analyze data using spatial techniques. This need has been recognized and has given rise to integration of GIS into environmental sustainability assessment and a research stream called Spatial Decision Support Systems (DSS). As mentioned by Maniezzo et al., DSS integrates spatially referenced information in a decision-making environment to positively affect the performance of decision makers, showing how spatially integrated DSS can be used to bridge the gap between policy makers and complex computerized models [29].
However, a review of available literature indicates that no such kind of GIS integration with sustainability assessment campuses has been investigated, nor has any framework been formulated to integrate campus sustainability assessment indicators to their spatial domain. This is despite calls by several scholars for the integration of spatial dimension into sustainability assessment [6,7,8,12,13]. Even the popular campus sustainability assessment and rating systems, Sustainability Tracking, Assessment and Rating Systems (STARS) and Global Reporting Initiative (GRI), despite their strengths lack GIS integration in their campus assessment guidelines. These two systems are hereby analyzed because of the increasing trend in the number of HEIs using their guidelines. As shown in Table 1, the number of universities participating in STARS reporting more than tripled from 246 in 2011 to 787 in 2016, while those participating in GRI have increased six-fold from 12 to 72 within the same period.
The STARS framework is designed to incorporate all levels of academic institutions, both public and private. The system is designed to assess the sustainability of academic institutions irrespective of their history in sustainability assessment; it is equally feasible and applicable to starters as well as long-term users [33]. It encompasses long-term sustainability goals for HEIs planning to conduct sustainability assessment, as it focuses on academics, engagements, operations, and planning and administration [33]. It is one of the most widely used tools for campus sustainability assessment and certification, which has been adopted largely by North American universities. In their review of STARS, Sonetti et al. opined that its major strength is its preference for performance over strategy and sustainability appraisal based on results and current situation while enabling comparison among institutions using common criteria [34]. However, in STARS’ technical manual, the reference to GIS was only as a sustainability course for earning points if the focus of the HEI offering it is on sustainability applications or as a unit or module in a sustainability course [35]. Despite the availability of indicators with spatial dimension in the assessment criteria of STARS, its assessment framework used redundant criteria [36], assign similar weight to each category [30] and has limited ability to spatially assess campus environmental operational indicators, thus requiring more efforts to make it more acceptable to HEIs [36].
GRI is another framework for sustainability assessment and reporting. Though its guidelines were developed for companies, an increasing number of universities have adopted its guidelines (Table 1). Like the STARS, the GRI guidelines have assessment categories for various dimensions of sustainability [37] although the adoption of GRI at universities is still at an early stage [38,39]. According to Bice and Coates, the GRI framework has been useful in capturing the environmental aspects of sustainability at the universities [40]. However, the lack of spatial dimension in sustainability assessment of HEIs by both STARS and GRI show their inability to spatially referenced information in a decision-making environment that positively affect the performance of decision makers. Though the guidelines of GRI incorporates environmental aspects of performance indicators that include materials, energy, water, effluents and waste, emission, and transport [31], GIS and spatial dimension were not integrated into these indicators.
In general, the guidelines of both STARS and GRI frameworks neither include GIS nor integrate spatial dimension in campus sustainability assessment and reporting. These deficiencies could result to assessing land uses and campus operations individually and that campus managers require taking extra steps to interpret assessment result across the campus. Similarly, lack of GIS integration could lead to more cost in preparing, storing and updating data, including maps, as well as the lack of visualization of the state of campus environmental sustainability. Thus, the proposed model helps to fill these gaps.
Indeed, the importance of integrating GIS in campus environmental sustainability assessment includes the following.
  • GIS establishes a framework for collection, storage, analysis and display of both geographical as well as non-geographical data of university campus collected from multiple sources (university department, remote sensing images, fieldwork, etc.) which can then be consolidated, efficiently organized and managed for utilization as input into assessing the environmental sustainability of the campus [6,7,13].
  • In addition, GIS can be used to develop a database of environmental sustainability indicators and produce thematic maps to visualize the state of sustainability on a campus. Because GIS provides the integration of the indicators with their unique location, necessary linkage between the location and sustainability characteristics of campus buildings and land uses can be easily made [8,12].
  • GIS-based assessment framework can provide a comprehensive digital data base and indicators related to campus environment and operations (e.g., energy and water use, transportation, waste management, and air quality) that can be updated to assess campus sustainability after regular intervals of time. This data base will not only help in continuous monitoring of campus sustainability but will also save cost in campus sustainability assessment process [13].
  • Similarly, an integrated framework can provide the authorities with ample room to test various scenarios and situations, presently and in the future. GIS provides the user with the ability to visualize various situations using different parameters. Indicators can be manipulated and visualized to see the possible outcome of any sustainability initiative or measures. The GIS-based framework is also useful in sustainability reporting [6,7,8,9].
  • It could also assist in developing a university site plans and details of campus environment including buildings, research and storage facilities, utilities as well as condition of other land uses in the campus. It allows mapping areas with potential environmental risks and opportunities for improvement, which can assist in classifying structures and facilities based on their degree of environmental impacts [10,13].
  • Because GIS facilitates the extraction of data from secondary sources such as satellite imagery and online maps, spatially referenced data set can be developed which can assist minimize the problem of lack of access to data and reduce the costs of conducting sustainability assessment [6,12].

3. Methods

The research methodology involved indicator selection, identification of operational parameters of KFUPM academic campus, along with their measuring units, model development, and environmental sustainability assessment of the campus [2,24]. Data were collected from the KFUPM Project and Maintenance Department and field survey, which were used to develop a GIS-based database of the campus. By linking various land uses to their specific geographical locations, relevant information was collected, which together with selected indicators provides backend data support for model development and conducting the assessment.
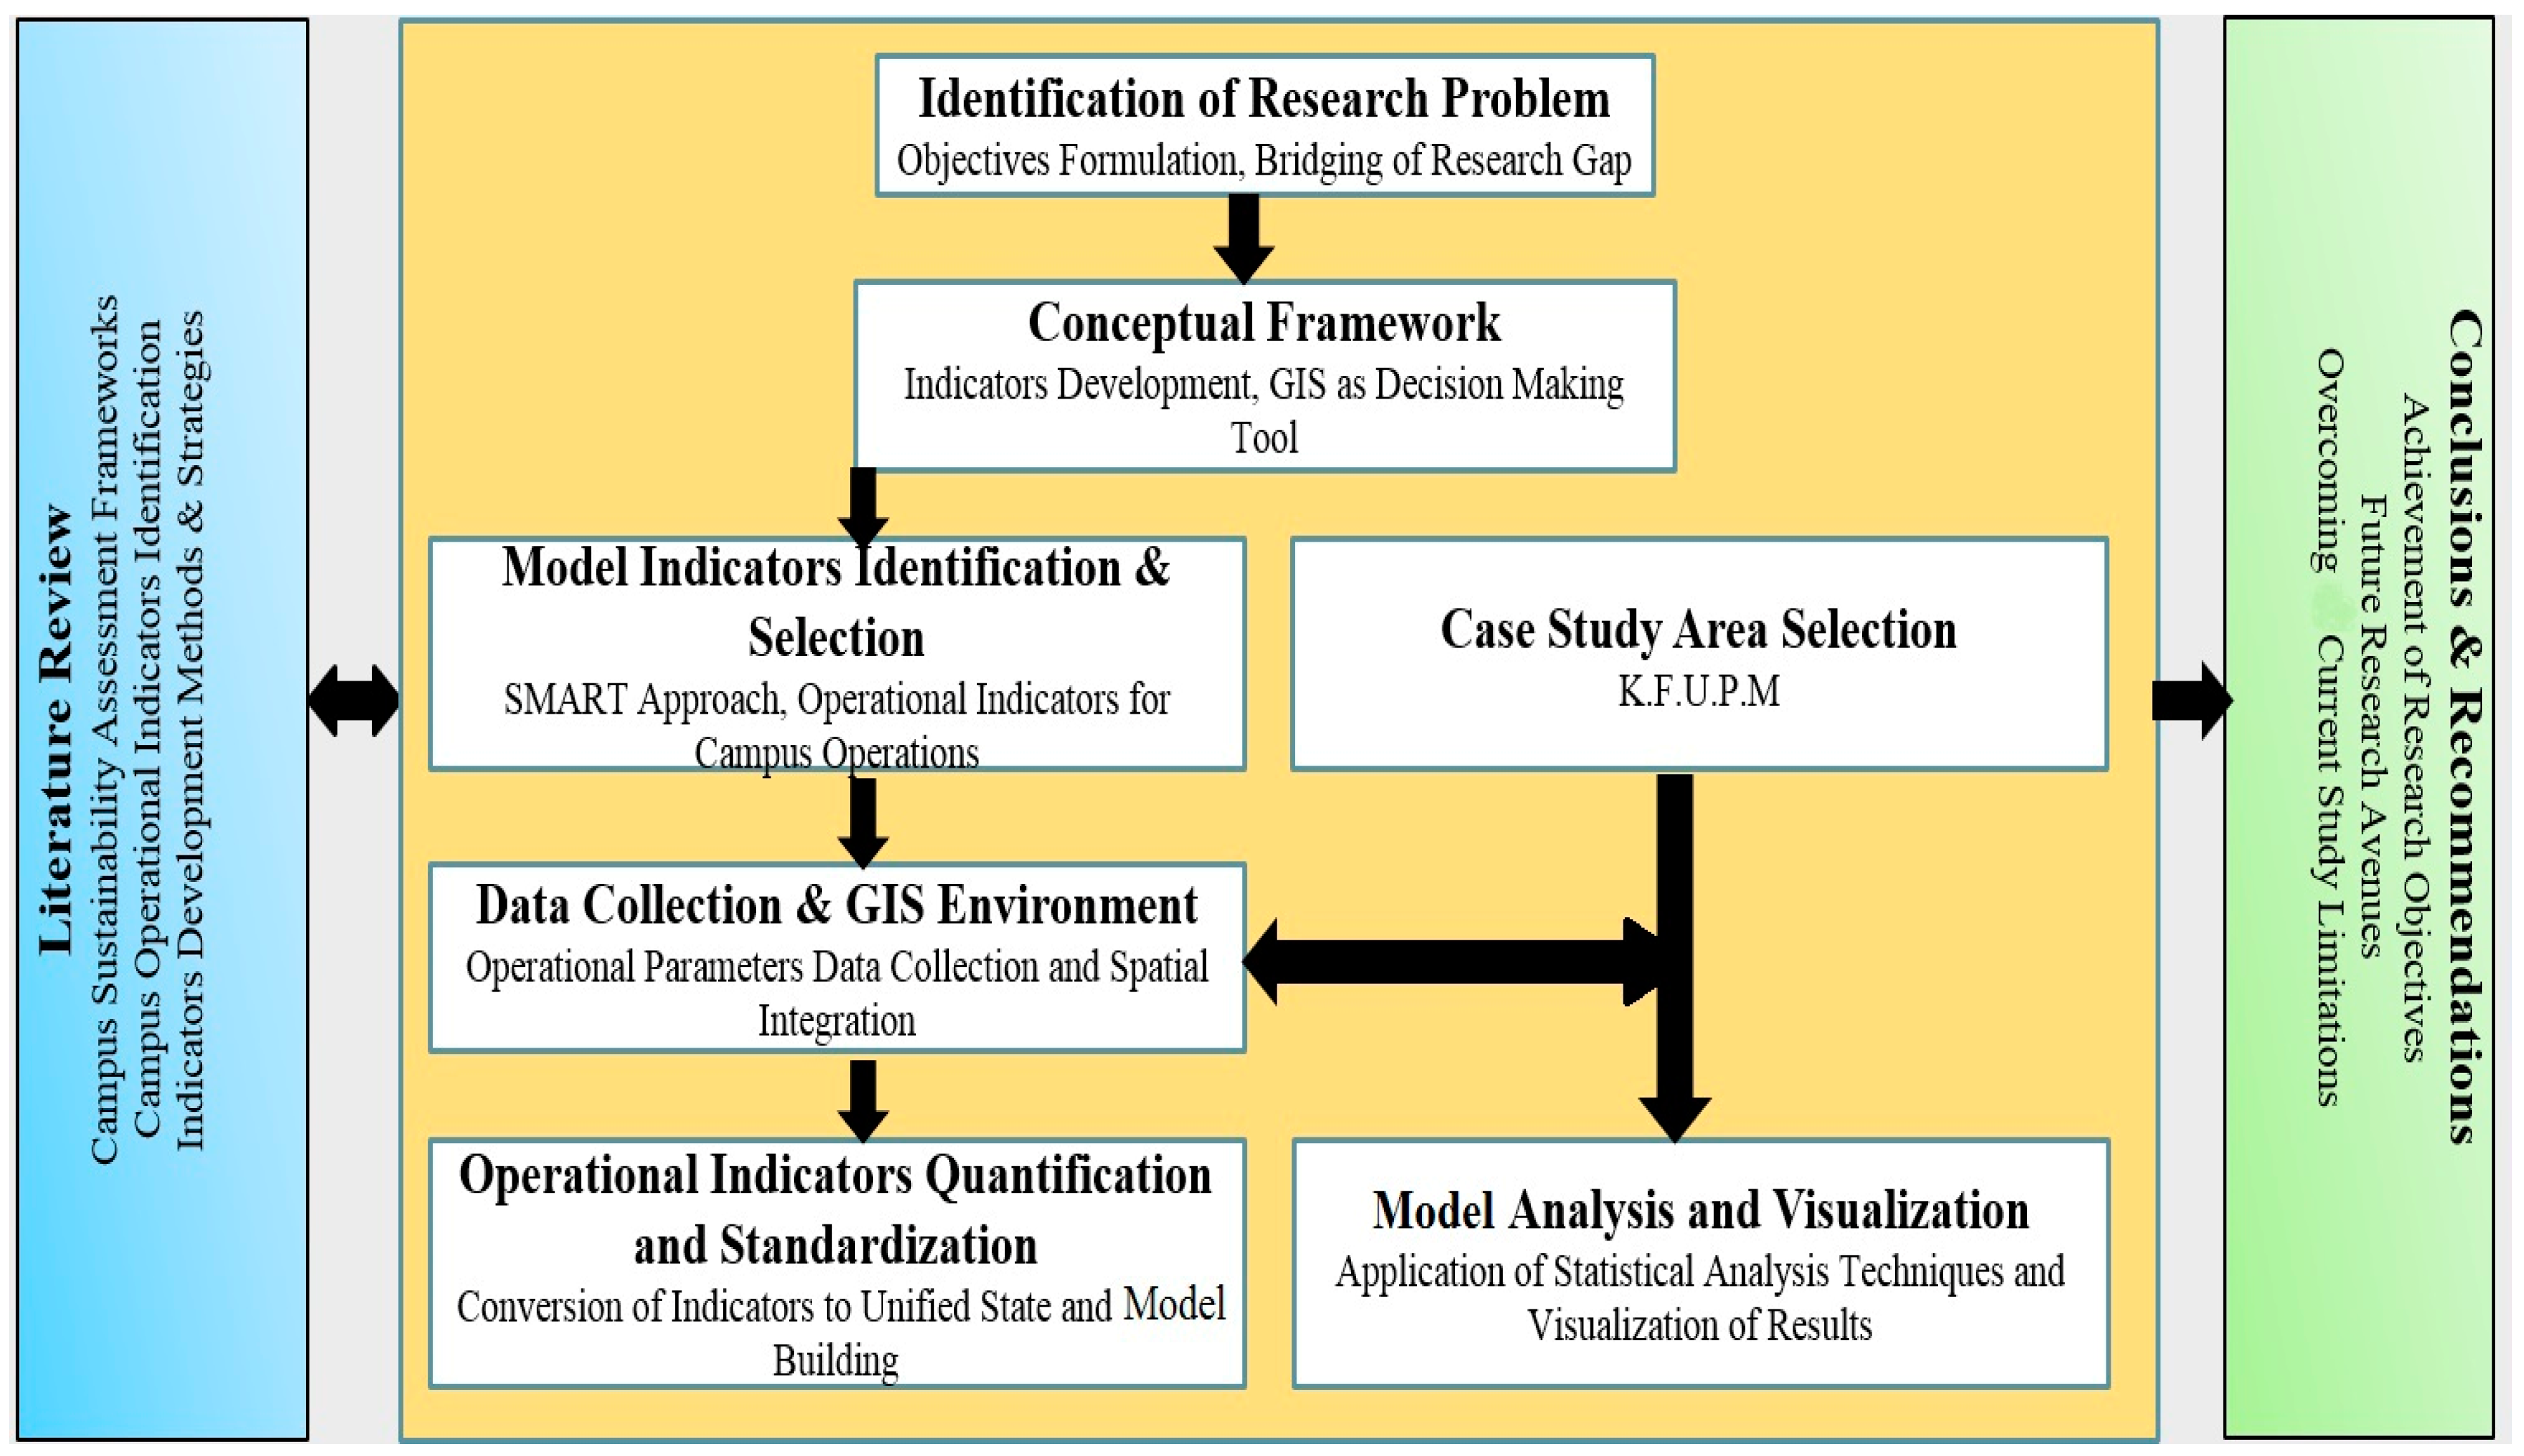
The research design, as shown in Figure 1, demonstrates the various stages of the study. Firstly, the research gap was determined from existing campus sustainability literature and practices around the world. Secondly, based on the identified sustainability assessment indicators in the literature, a conceptual framework was developed to serve as a basis for campus environmental sustainability assessment. Thirdly, SMART approach [41] was used to select relevant environmental indicators. Fourthly, the major challenge was to overcome the difficulty of using environmental indicator with different units of measurement and integrating spatial dimension into sustainability assessment. This challenge was surmounted using inverse distance weighted (IDW) interpolation technique within the developed GIS-based model. The IDW is a spatial analysis technique of interpolation which extracts and standardizes values for emissions from various land uses and other operational activities and enhances the visualization of the results which are presented as neat and smooth surfaces that allow for easy interpretation and reporting [42].

3.1. Study Area

King Fahd University of Petroleum and Minerals (KFUPM) is a technical university with a student and faculty population of about 10,000 and 1500 respectively that are mostly residing on campus. The university was established in 1963 as College of Petroleum and Minerals which in 1986 became a university and was renamed KFUPM. The University campus is in Dhahran which is part of Dammam Metropolitan Area along with cities of Al-Khobar and Dammam. The university campus is bounded by King Abdul-Aziz Airbase, Dhahran Techno Valley, and Saudi Aramco. It is located on the eastern coast of Saudi Arabia at about 15 km from the Arabian/Persian Gulf, about 45 km from King Fahd International Airport and 400 km away from Riyadh, the Kingdom’s capital. The prime rationale behind the selection of KFUPM as a case study area is the availability of both primary and secondary data. Secondly, being one of the premier higher institutions in the kingdom, the university provides ample opportunities for testing the model via conducting an environmental sustainability assessment of the university campus.

3.2. Selection of Campus Environmental Sustainability Indicators

Campus sustainability indicators are parameters that describe the state of a university campus, visualize the phenomena and highlight its trends, strengths and weaknesses by quantifying, analyzing and communicating complex and complicated information. Indicators form important ingredients for sustainability assessment and reporting when they are based on all dimensions of sustainability [43]. Given that indicators, and indicator frameworks are deemed as ways for operationalizing sustainability of cities and organization, it is imperative to select campus sustainability indicators using appropriate approach. This is because there are numerous sustainability indicators, which makes indicator selection process a serious challenge during campus sustainability assessment. The “SMART” approach [41], illustrated in Figure 2, ensures that five attributes of effective indicators have been taken into consideration in developing assessment framework: “Specific“ to avoid vagueness; “Measurable” to quantify the development numerically; “Achievable” to be objective oriented; “Relevant” which can be interpreted; and lastly “Time-bound” that it has certain time frame against which the change can be measured.
Consequently, the SMART approach was used to select the indicators for campus operational activities among the energy, building, waste management and transportation categories that play a vital role in campus environmental sustainability assessment [3,44]. Then the specific indicators in Table 2 were selected because they not only have a spatial dimension, but they are also among the major contributors to GHG emissions that need to be curbed in order to promote environmental sustainability of the campus.

3.3. Data Collection for Model Building and Spatial Analysis

KFUPM campus land uses were categorized into five has shown in Table 3. The data collection for developing the model included information regarding basic campus land use, energy consumption, campus transportation, water consumption and waste management. Data collection points from the campus are represented in Figure 3. The university campus covers about 76.4 hectares, with faculty and student housing covering more than half of the land area.
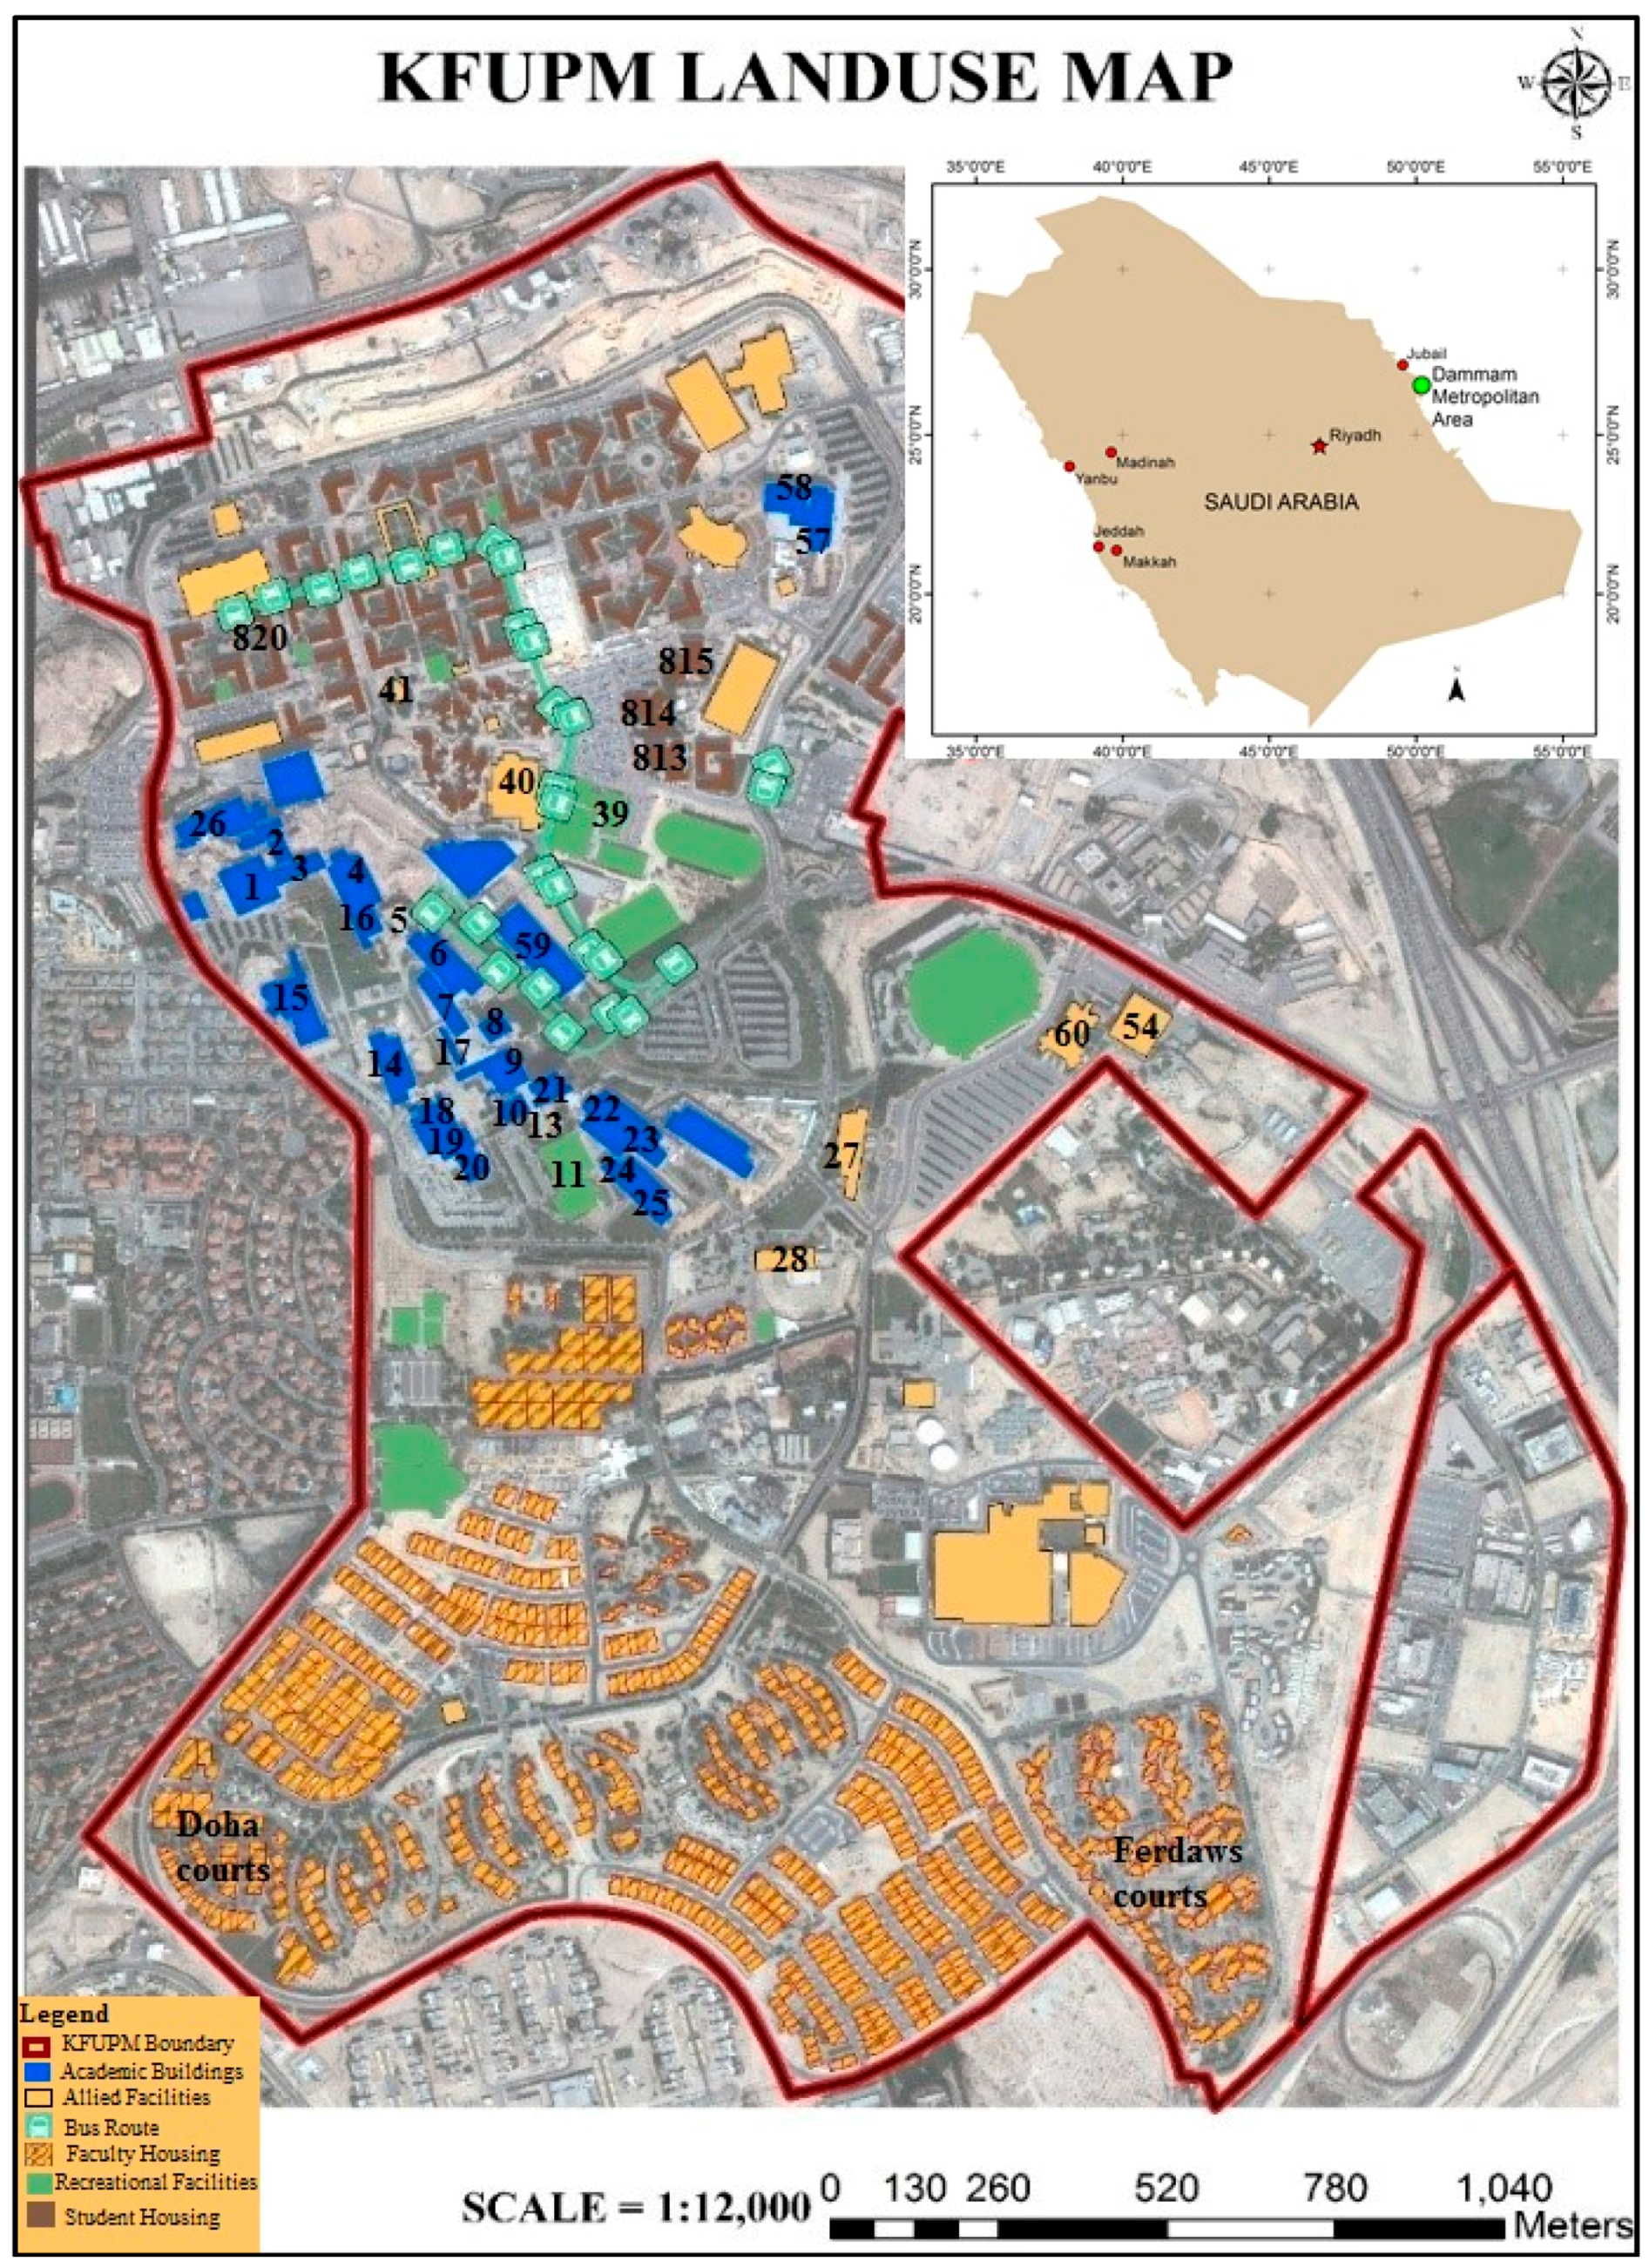
The data points were not selected from one single location or land use, rather they were distributed throughout the campus. They were selected using stratified sampling based on different land uses (Figure 4). After data collection, inverse distance weighted (IDW) interpolation, which is a spatial statistics technique of interpolating the values of the data points to statistically calculate and determine the values of various operational parameters of the campus. The IDW technique is a deterministic spatial interpolation method that uses the value of known locations and features to determine the value of unknown objects or features [42]. The influence of the value of a known point in determining the value of an unknown point is weighted by the distance between the points [42]. This technique and other GIS tools were used in developing the GIS-based campus environmental sustainability model and preparing and displaying the raster images for the current conditions of various operational parameters as well as for interpolating future scenarios. The usefulness of the IDW technique is in converting point data to campus-wide surface data. That is, the data for unknown points could be estimated thereby filling the data gaps.

3.4. GIS-Based Analytical Tool

The spatial package used in this study is ArcGIS 10.3® (ESRI, Redlands, CA, USA) with its Spatial Analyst extension. The buildings and land use dataset, as indicated in Section 3.3, was prepared in ArcGIS as shapefiles. The shapefiles were derived from a high-resolution satellite image, which was used as a baseline for the identification of various land uses and land features of the study area. The raster data, satellite images of KFUPM, was georeferenced using geo-referencing tools. Thereafter, the vector dataset for individual buildings was digitized on-screen and the various attributes and values of variables were added to the dataset. The attribute added to the dataset include information regarding the type of building, its area coverage and specific building number assigned to it by the university administration. The vector files and the information stored in them as attribute tables were the prime sources of the development of the model and for analyses. The data points (Section 3.3) were used to extract values of operational parameters (such as energy consumption) from the vector polygon, interpolate the values and convert the values to GHG emission.

4. Results and Discussion

4.1. Sustainability Assessment of KFUPM Campus Operations

This section presents the results of environmental sustainability assessment of KFUPM campus energy use, water consumption, solid waste management, transportation system and overall environmental quality of the campus conducted using the proposed model.

4.1.1. Energy Use

An academic campus, given its size and complex operations, utilize large amount of energy for various operations [2]. As the energy consumption rises, so also do emissions of greenhouse gasses (GHGs). Therefore, in the wake of recent developments in the field of sustainability, especially regarding university campuses, gauging and monitoring energy consumption by various activities is crucial. This monitoring and cataloging of energy will not only provide the trends of energy consumption over time, but it will also help in identifying major areas of academic campuses that consume high amount of energy towards designing mitigation initiatives.
The energy consumption tracking and monitoring at KFUPM campus, under the larger framework of environmental sustainability assessment, was done using the developed model. Although, the university does not have any on-site power production facilities either using non-renewable or renewable resources, the average daily electricity consumption was 18.5 MWh for the last five years. In trying to associate energy consumption with its geographical region, it was found out that the best way of achieving that is to connect the overall consumption with the square footage area coverage of the building. This was estimated by transforming raster data from the satellite image to vector format in the form of polygons and then multiplying the area by the number of floors of that building. The Standard International (SI) unit of kWh/m2 year [45] was used as the unit for energy consumption. This provides the necessary and logical connection with GIS environment that facilitated linking specific area coverage with the specific amount of energy consumption. It was discovered that the energy consumption for per square meter ranged from 70 to 300 kWh [46].
Figure 5 shows the GHGs emission from various academic buildings at KFUPM, highlighting different intensity levels. The hotspots for emissions in Figure 5 were Research Institute (Building 15); Colleges of Environmental Design and Industrial Management (Building 19 and 24); Administration Building (Building 21); and Buildings 22, 57, 58, and 59 (see Figure 4 and Figure 5). These buildings are hotspots for emissions of GHGs due to their functions of housing major academic and administration departments where laboratories, workshops, classrooms and so on are located. It must be noted here that for academic buildings, only energy consumption has been accounted for.

4.1.2. Water Consumption

The demand for water has risen exponentially in the recent past due to population expansion around the world. This scarcity demands careful usage of water for all applications, especially in the parts of the world where freshwater is scarce [47]. The GIS-based model utilized water operational indicators to assess water use within the academic campus and demonstrates, both graphically and statistically, water use at various parts of the campus.
Similar to increasing water consumption in the Kingdom of Saudi Arabia, the per capita water demand in KFUPM campus comes out to be 290 L per day. Albeit the water supplied to the campus is produced from desalination plants due to the absence of ground water. The water consumption for various residential buildings has been calculated based on the assumption that the total room occupancy stands at 90%. Furthermore, for the water consumption of faculty housing, household size of 6 was used, which is the standard average household size in Saudi Arabia.

4.1.3. Solid Waste Management

In the case of academic campuses, solid waste is mostly generated from housing, academic areas as well as support departments. The nature of waste produced varies greatly from one use to another. Keeping a check on the production of various kinds of waste from different land uses could provide an insight to minimize its production. The GIS-based model estimated the ratio of waste produced by various uses. Quantitative values, when combined with the location, portrays a clear picture of per capita waste generation and assists in determining the ideal strategy to reduce the amount of waste produced on the campus. Reduction in waste production for a sustainable campus will reduce the pollution caused by solid waste transportation and incineration, thus contributing to improvement in environmental sustainability. According to Ouda [48], the per capita solid waste generation in the Kingdom ranges from 1.2 to 1.4 kg. This standard was used to calculate the quantity of solid waste generated at KFUPM, which houses about 10,000 students and 986 faculty and staff members. The total waste generated on daily basis was found to be 14,282 kg. It is worth mentioning here that the assumptions used in calculating waste generation were the same as for water consumption for both student and faculty. Furthermore, the collection system is based on collection trucks, which collect and compresses the waste during collection and transfer. Most of the solid waste is disposed of in open landfill sites at the outskirts of the Dammam Metropolitan Area.
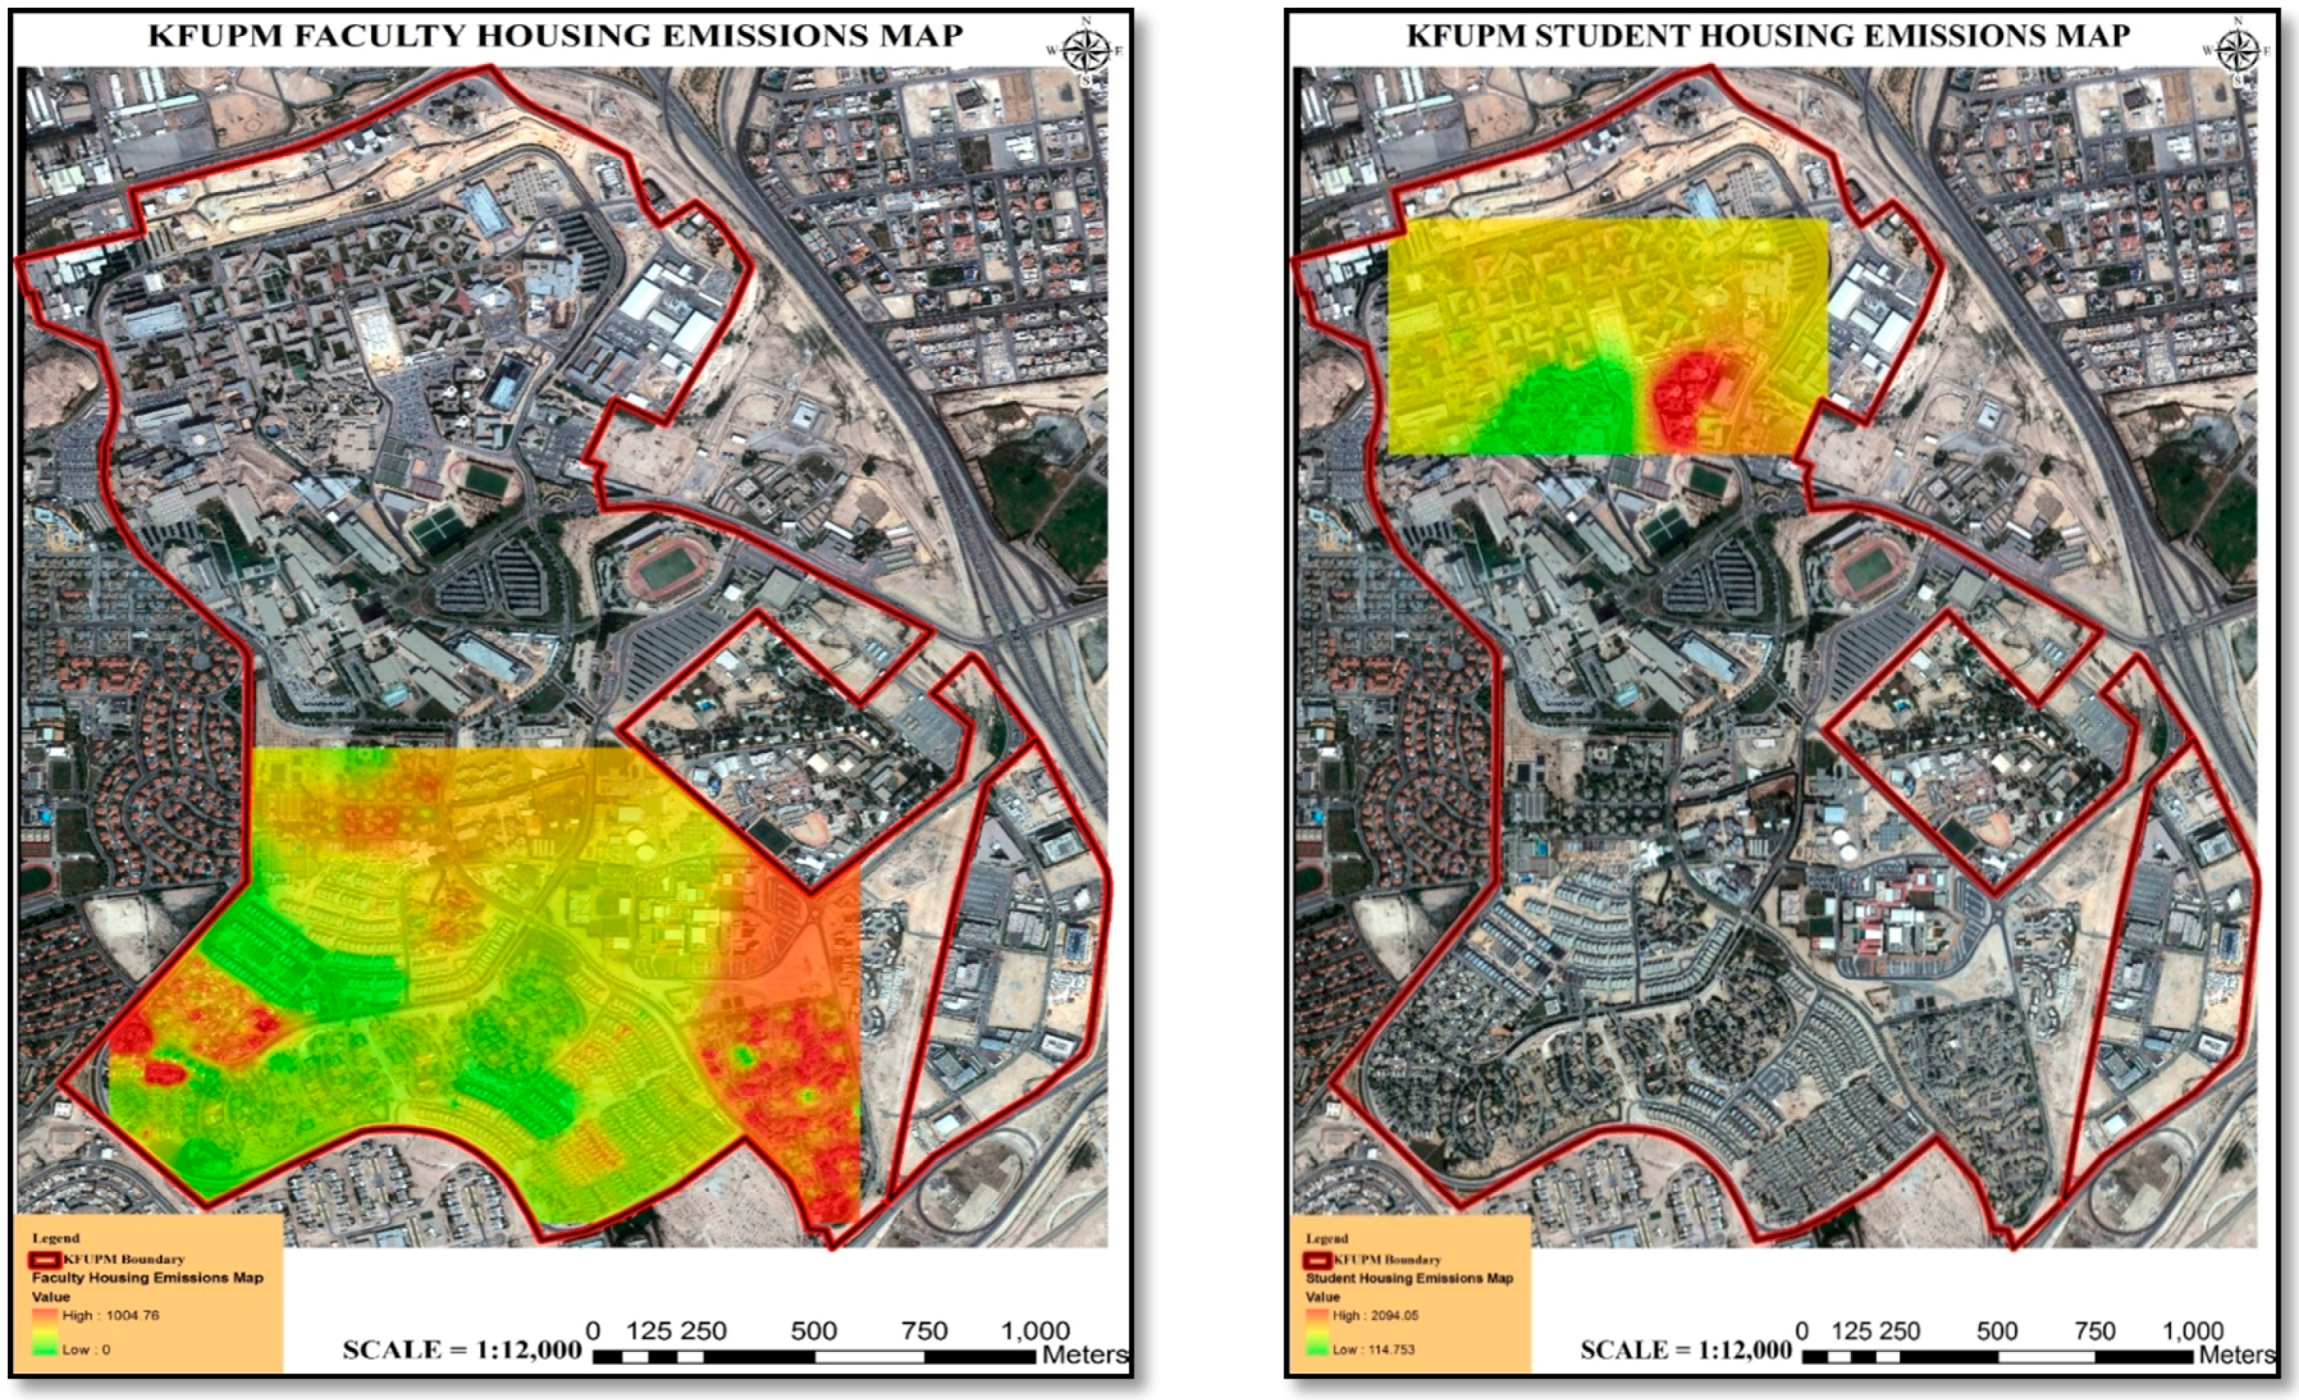
Figure 6 indicates GHGs emissions from faculty/staff as well as student housing at KFUPM. In preparation for the emissions map, energy consumption, waste generation, and water consumption have also been accounted for. Emission hotspots in the faculty housing are Ferdaws courts and Doha courts. Ferdaws courts are triple story residential complexes closely located, whereas Doha courts are double story houses. There are certain areas in faculty housing displaying zero emissions, these are residential buildings under construction, therefore, emissions from these land parcels are practically zero.
The Student Housing Emission Map displays that student housing Buildings 813, 814 and 815 are emitting more GHGs as compared to other building due to their activities. The case of student housing is no different from that of faculty housing and all operational parameters have been considered while preparing emissions map for student housing except transportation. Through the integration of spatial dimension to energy consumption, this analysis helps to identify and continuously monitor potential areas of high and low energy demands. This would assist campus management with ways to save cost by reducing the amount of energy consumption using energy-efficient appliances and conversation techniques.

4.1.4. Transportation System

Various transportation modes contribute differently to overall campus environment sustainability. KFUPM like many other large universities has bus transportation system. The system, which is being managed by the Department of Transportation, has a fleet of 43 buses providing comfortable and convenient transportation facilities to the university community. The total trip distance that is covered by one bus is 3.56 km. An assumption was made that the overall fleet utilization of buses stands at 90%, which amounts to 39 buses on daily basis available for transportation purposes. The interval between the buses is maintained at constant five minutes throughout the day of operation, commencing at 7:00 a.m. and lasting till 5:30 p.m. The mean time to complete the trip from the origin at Building 820 to Building 5 takes 7–9 min, whereas the return trip takes an average of 9–13 min. The roundtrip time is approximately 17 min.
To calculate the contribution of transportation to the overall campus environmental sustainability, the bus route (see Figure 4) was divided into 250 m intervals to gauge the amount of emissions produced. According to USA Environmental Protection Agency, an institutional bus running on diesel or gasoline fuel will produce an amount of 0.166 kg of CO2 per kilometer traveled [39]. Using this emission standard, the overall emissions of the transportation system come out to be 348 kg CO2 per day of operations. The hotspots of emissions and environmental impacts due to transportation systems have been shown in Figure 7.

4.1.5. Overall Environmental Sustainability of KFUPM Campus

GHG emission is one of the measures of environmental sustainability of any geographical area. In this study, energy use, water consumption, waste management, and transportation are combined and used to determine the overall emissions levels of the campus. The approach adopted in this study integrates the spatial dimension/location of various campus land uses towards finding a common unit by which all the parameters can be converted into. The amount of energy consumption, transportation service emissions, waste generation and water consumption were all converted into their GHG emissions factor to develop overall campus sustainability assessment output maps.
The spatial dimension helps assess the impact of a certain indicator or activity in a closed system of academic campuses [11]. Table 4 shows that indicators related to campus operations and management that have spatial dimensions and substantially contribute to GHG emissions. Then a GHG energy conversion factor was used to transform the indicators into GHG component using guidelines from the USA Environmental Protection Agency.
Table 4 is vital for the integration of various parameters of campus sustainability assessment. One unified unit of measurement helps integrate different parameters using common unit. The improvised unit of measurement is also the standard unit of measurement for emissions.
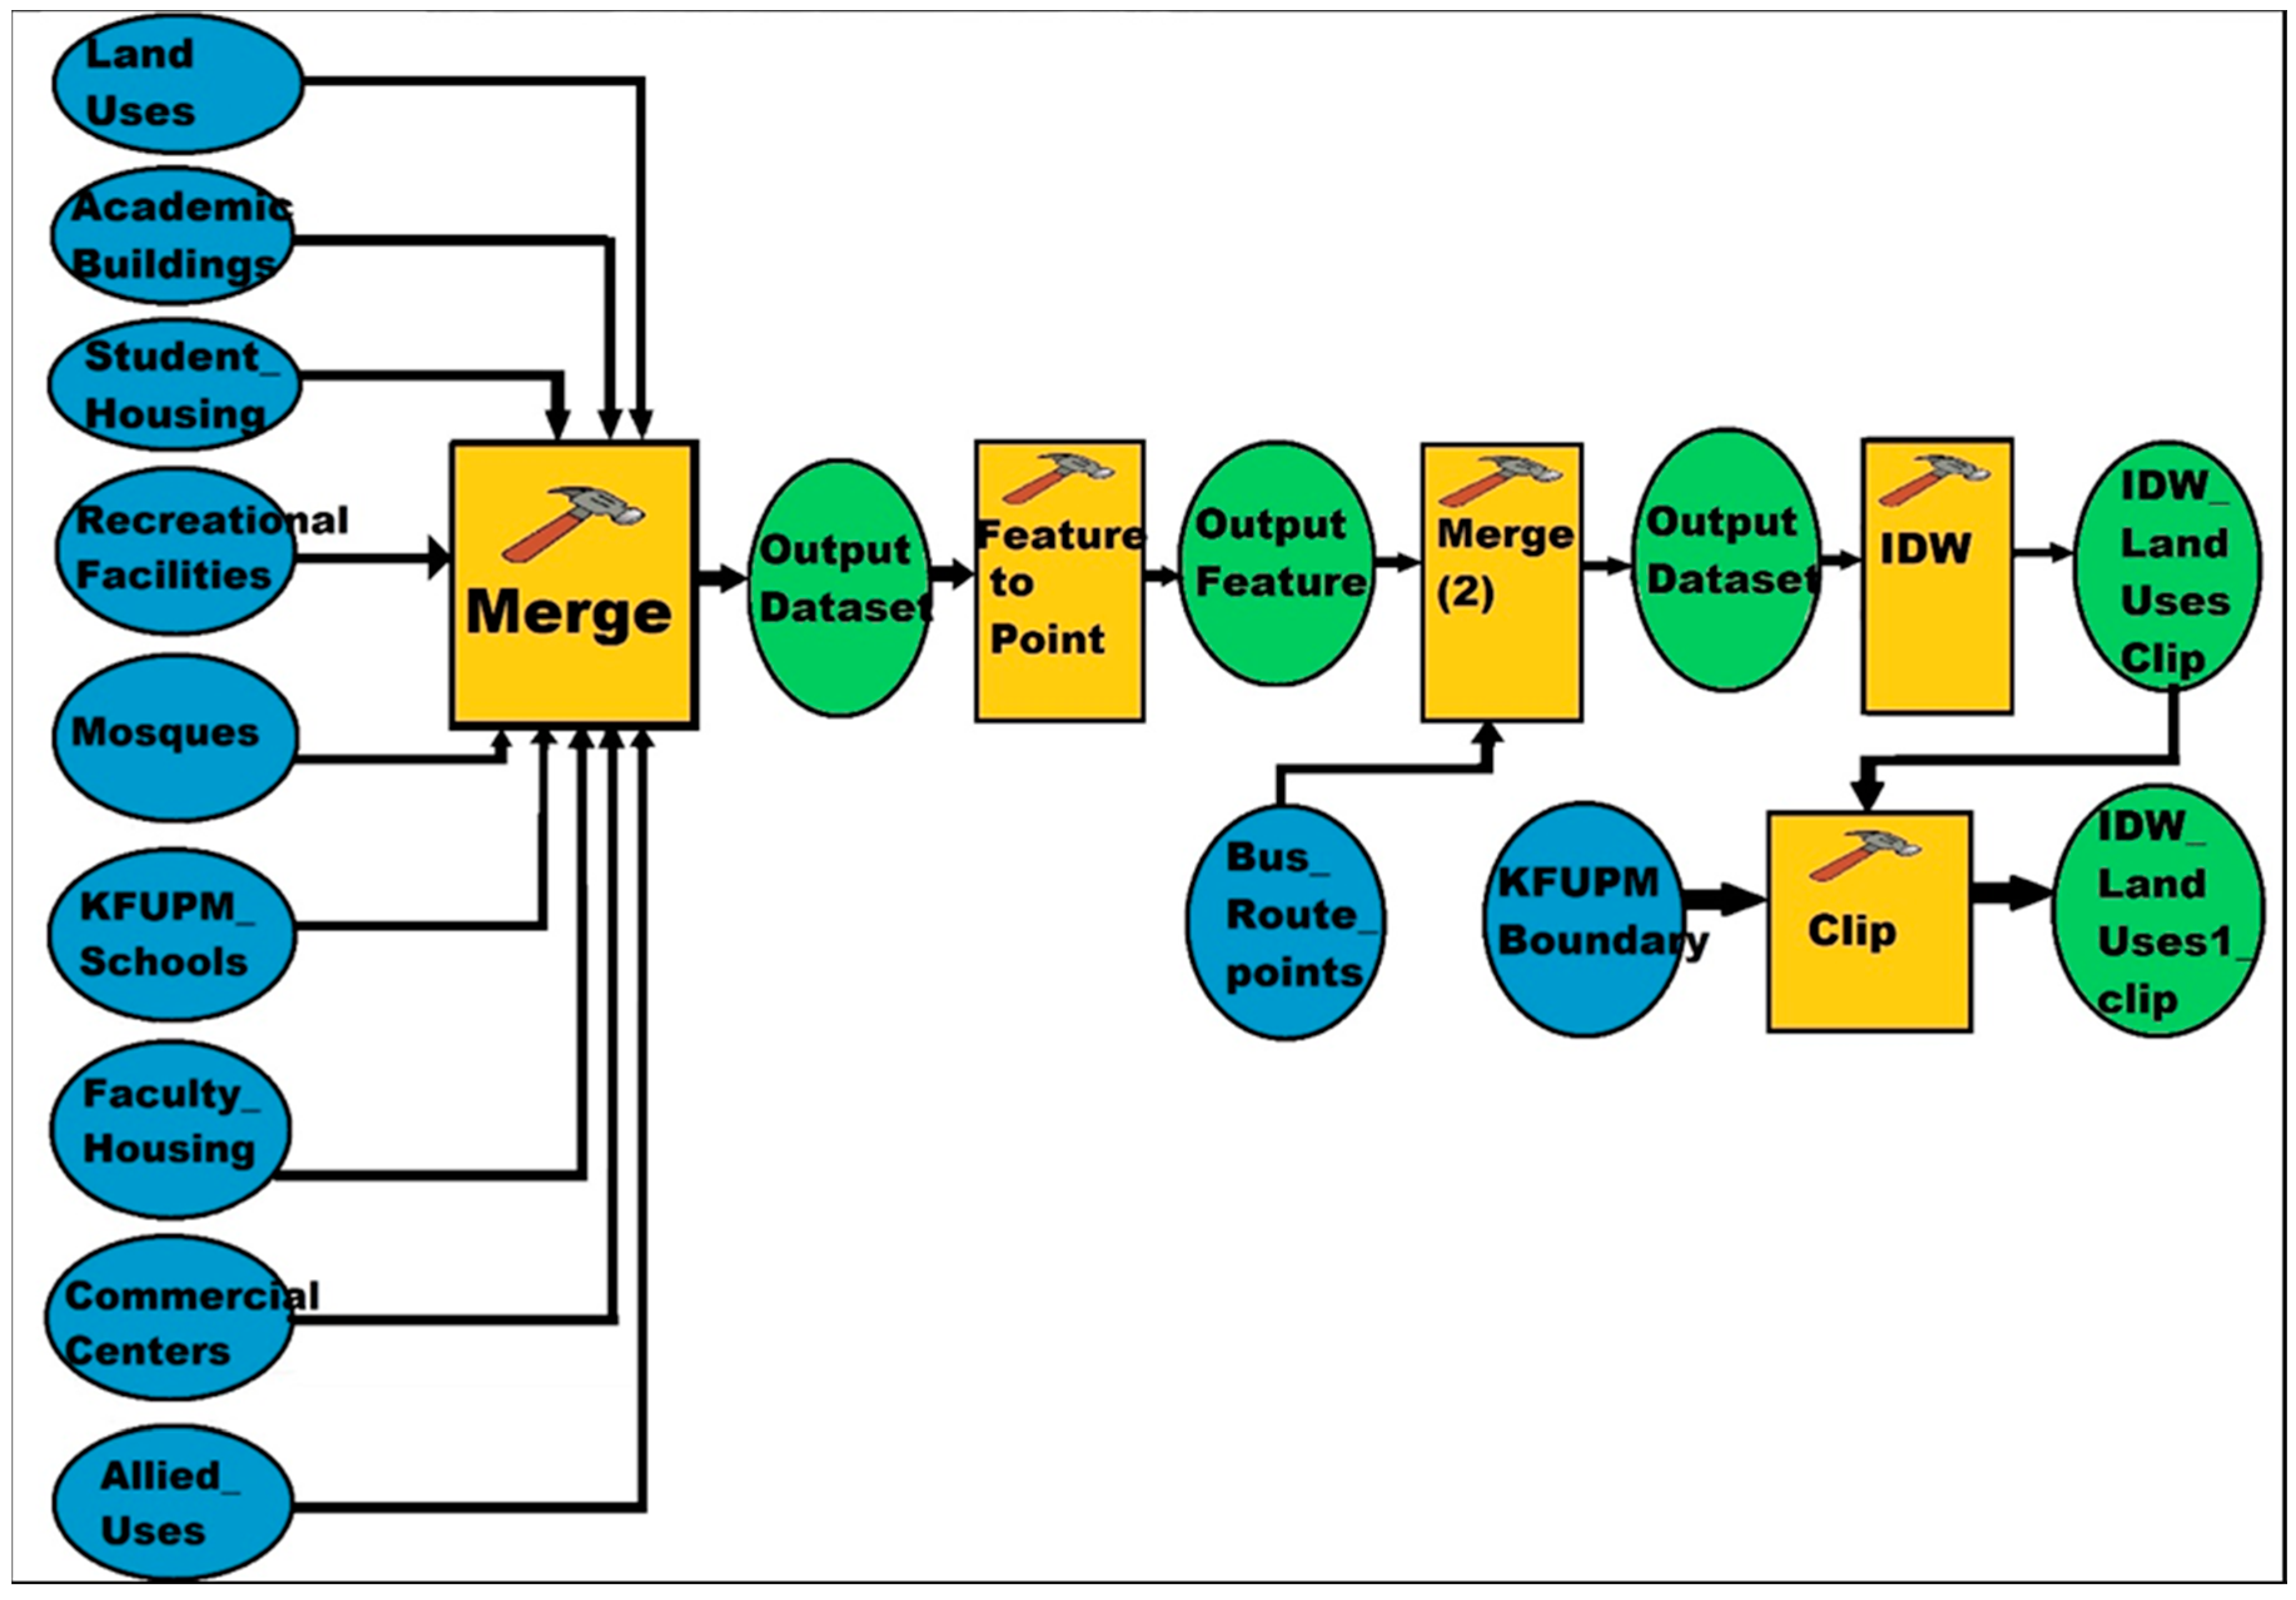
Figure 8 represents the schematic diagram of the campus sustainability assessment model in the GIS environment. The model comprises of the data sets prepared for specific tasks as well as the kind of analysis and operations required. Correct and sequential linkup and connections are required for building the model. In this study, the model developed to assess the sustainability of KFUPM campus comprises multiple data sets represented by the blue polygons in Figure 8, which consist of various existing campus land uses. These data sets were then linked up with the analysis need for assessing the sustainability of campus operations. Then the various datasets were merged into one single unit which combines all the attributes in the datasets. Secondly, the merged dataset was converted into point shapefiles for statistical analysis. Next, the point shapefiles were processed by Inverse Distance Weighted (IDW) method to determine the value of unknown features and locations. The output results are depicted by the green polygons in Figure 8. This method provided the whole picture of the campus condition from different land uses.

4.2. The Results of the Enactment of the GIS-Based Model

This section demonstrates how the model—processes the data provided as back-end information in the form of attribute table. After the derivation of the standard for various land uses from Table 4, energy consumption from various land uses and operational parameter values in 2016 was computed as shown in Table 5. As mentioned in Section 3.2, the indicators in Table 5 were selected because they are among the major indicators of the sustainability of campus operations, they have spatial dimensions and emit a substantial amount of GHG that need mitigation for promoting campus environmental sustainability.
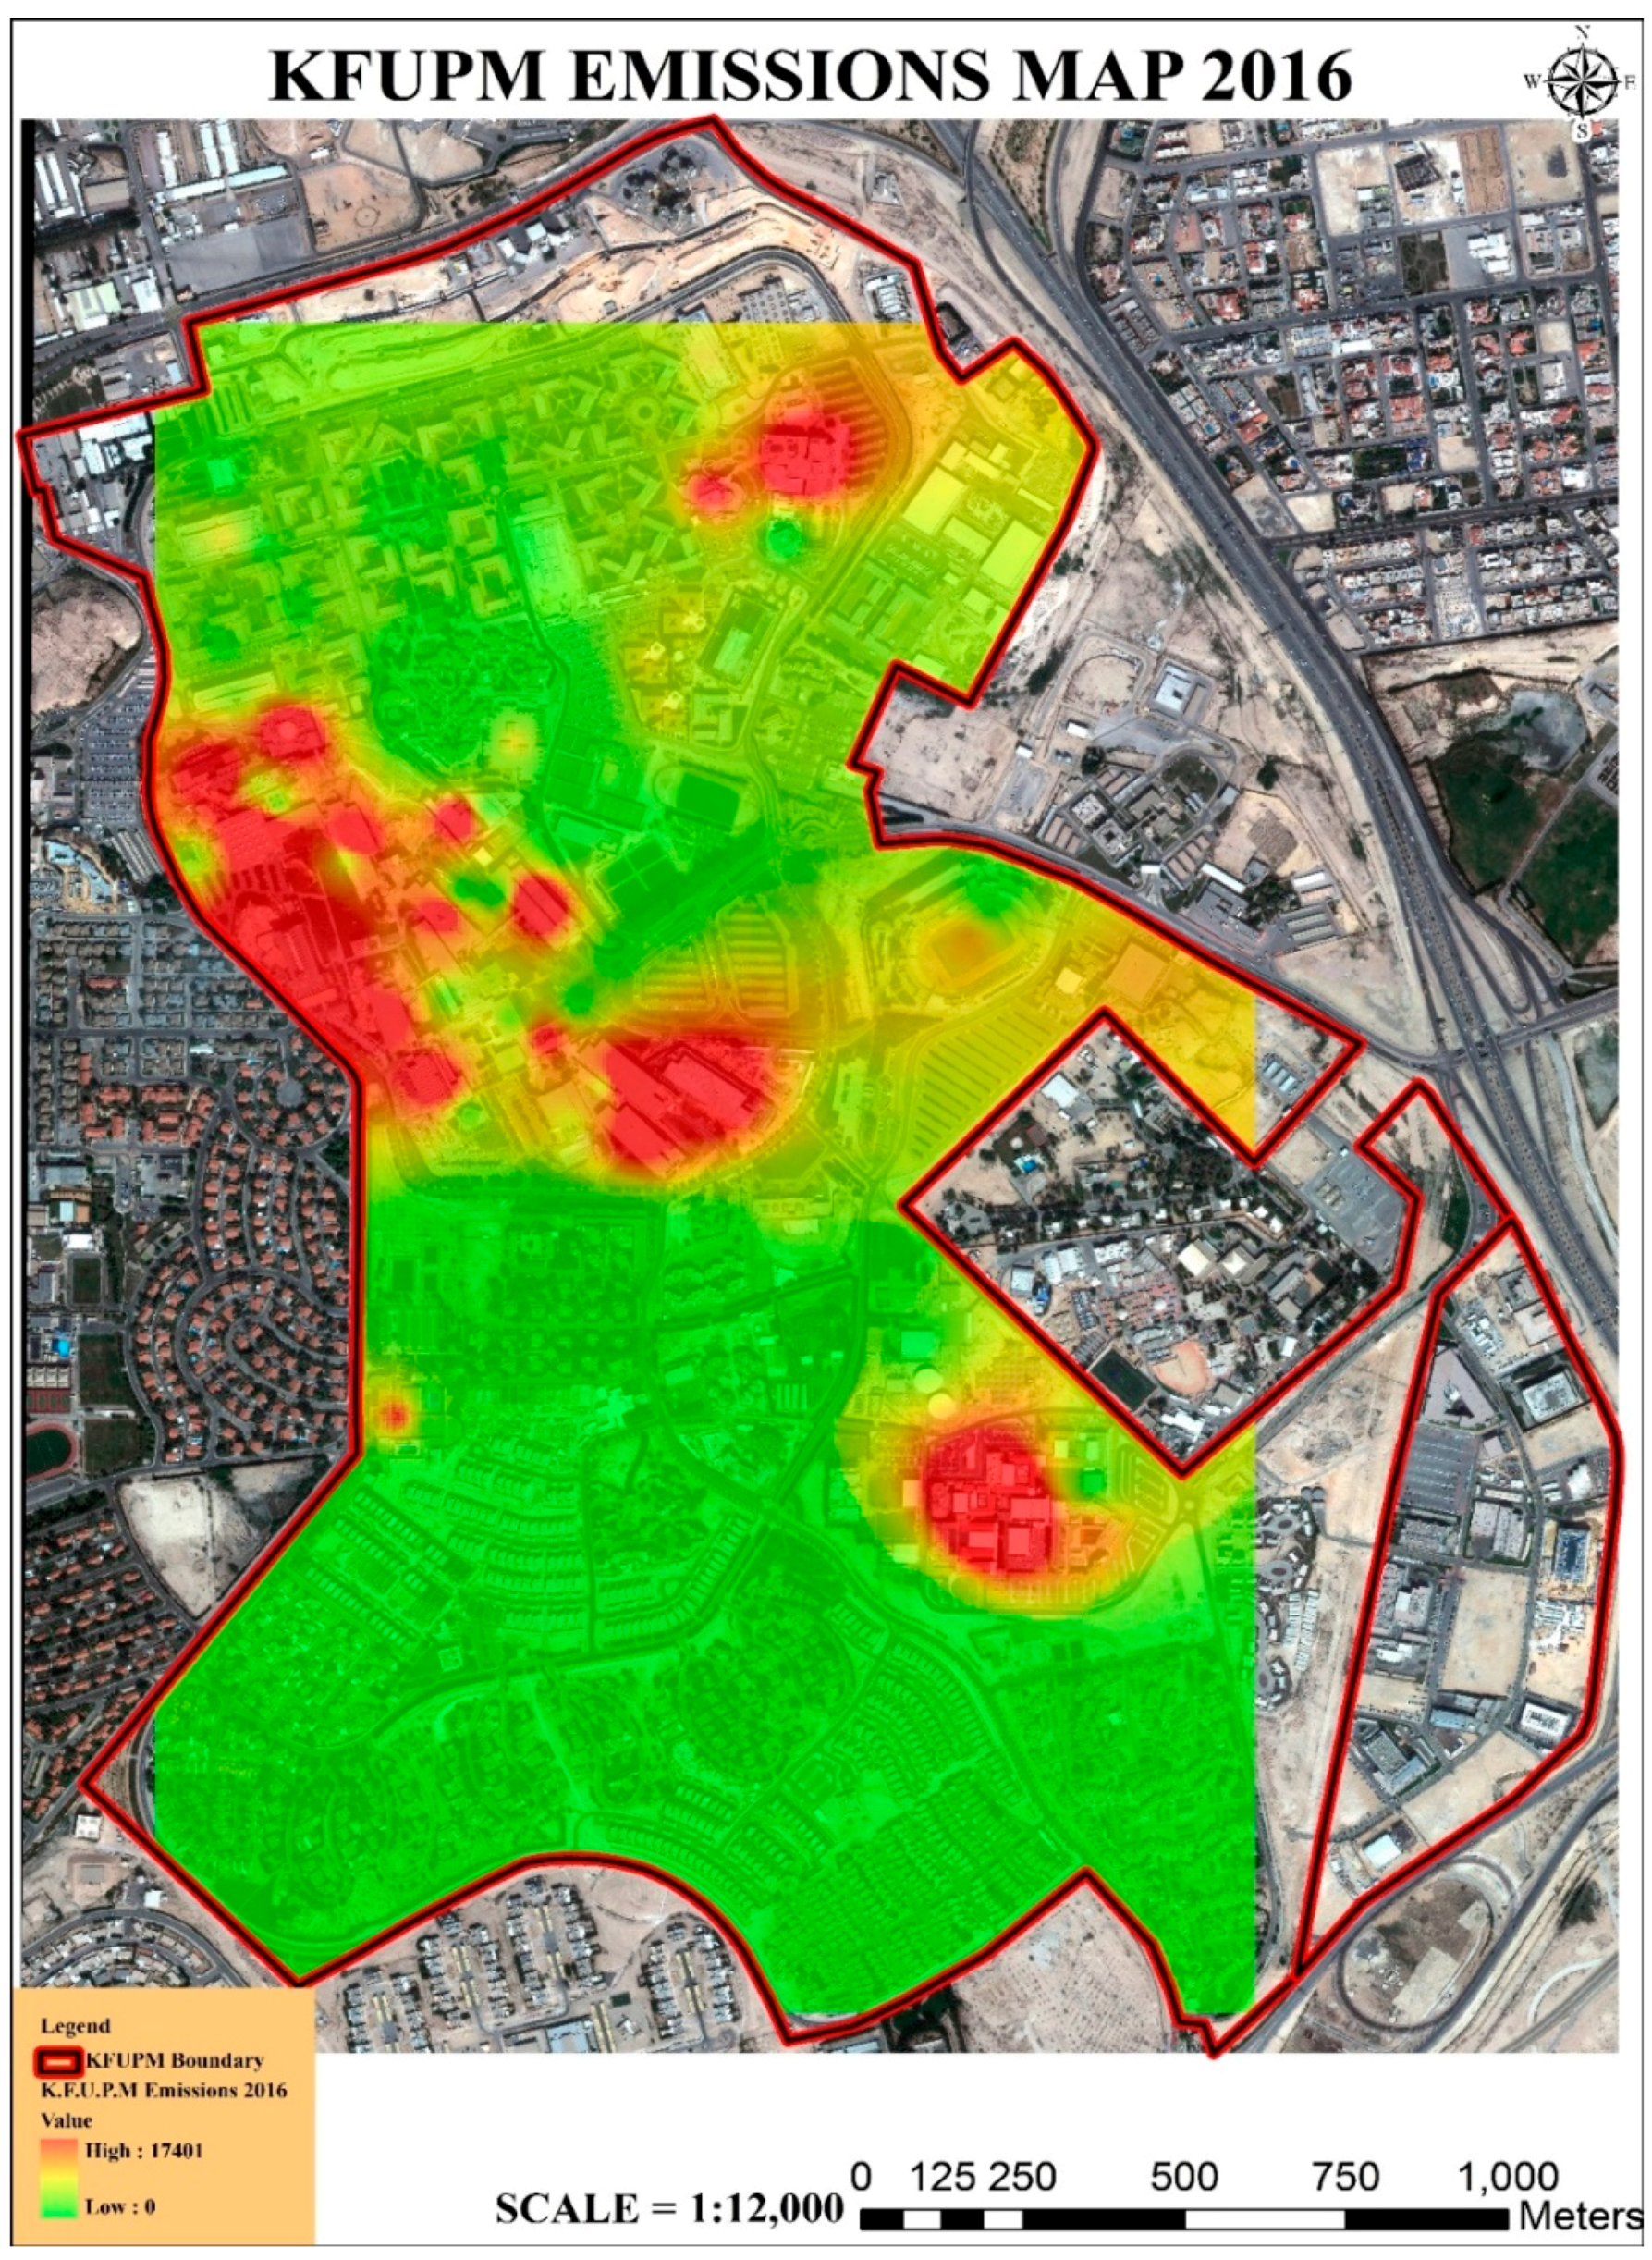
Different land uses, as well as transportation system, have varying energy demand, emission levels and geographical locations. The results in Table 5 show the 2016 per capita campus energy consumption, measured in kWh/m2 per annum. For example, the daily per capita waste generation and water consumption indicated are found to be about 1.4 kg and 290 L, respectively. Using the figures presented in Table 5, daily GHG emissions have been computed for analysis in the model analysis and production of raster maps. Consequently, when these emissions results are aggregated and integrated within the developed GIS-based model, the overall environmental sustainability assessment outcome for KFUPM campus is visually represented as a raster image that indicates the overall campus emission levels in 2016 (Figure 9).
The assessment outcome reveals that academic buildings are the hotspots for energy consumption and emission of GHGs. The maximum value of around 17.4 tons of CO2 equivalent has been observed around the academic buildings especially around the Administration Building (Building 24), Building 22, Parking Garage, and College of Industrial Management. Another hotspot for energy consumption is concentrated around the College of Environmental Design (Building 19), and Information Technology Centre (Building 14), as well as the KFUPM Mall, with a likely reason that these buildings cover vast floor area. Moreover, the proximity of Buildings 57 and 58 to the commercial center is another cause of those parts of the academic campus being identified as hotspots.
In addition, another hotspot that has been identified by the model is the KFUPM schools (elementary and high school). This land use, like main campus academic buildings, has a large concentration of buildings in a relatively small land parcel. As area coverage is accounted for analysis, multiple stories thus provide larger amounts in terms of emissions from energy consumption. Furthermore, the Ferdaws Courts (area for faculty and staff housing) was also found as a potential hotspot. This is likely because the three-story housing complexes were concentrated in a small area which can be attributed to higher energy consumption and GHG emission. Lastly, the University community center located in close vicinity to the faculty housing and campus stadium is among the major GHG emitters in the campus.

4.3. Modeling Future Environmental Sustainability Scenario of the Campus

This section models future environmental sustainability scenario of the campus. Since existing environmental sustainability situation has been mapped and visualized in the previous section, a future scenario for the next five years as an example, using the same indicators, has been envisioned to demonstrate another advantage of the model. The modeling result indicates a slight difference between existing and projected values that ranges from 5% to 10% in all the values except in transportation where it is 20%. The percentage change in the indicator values is represented in Table 6.
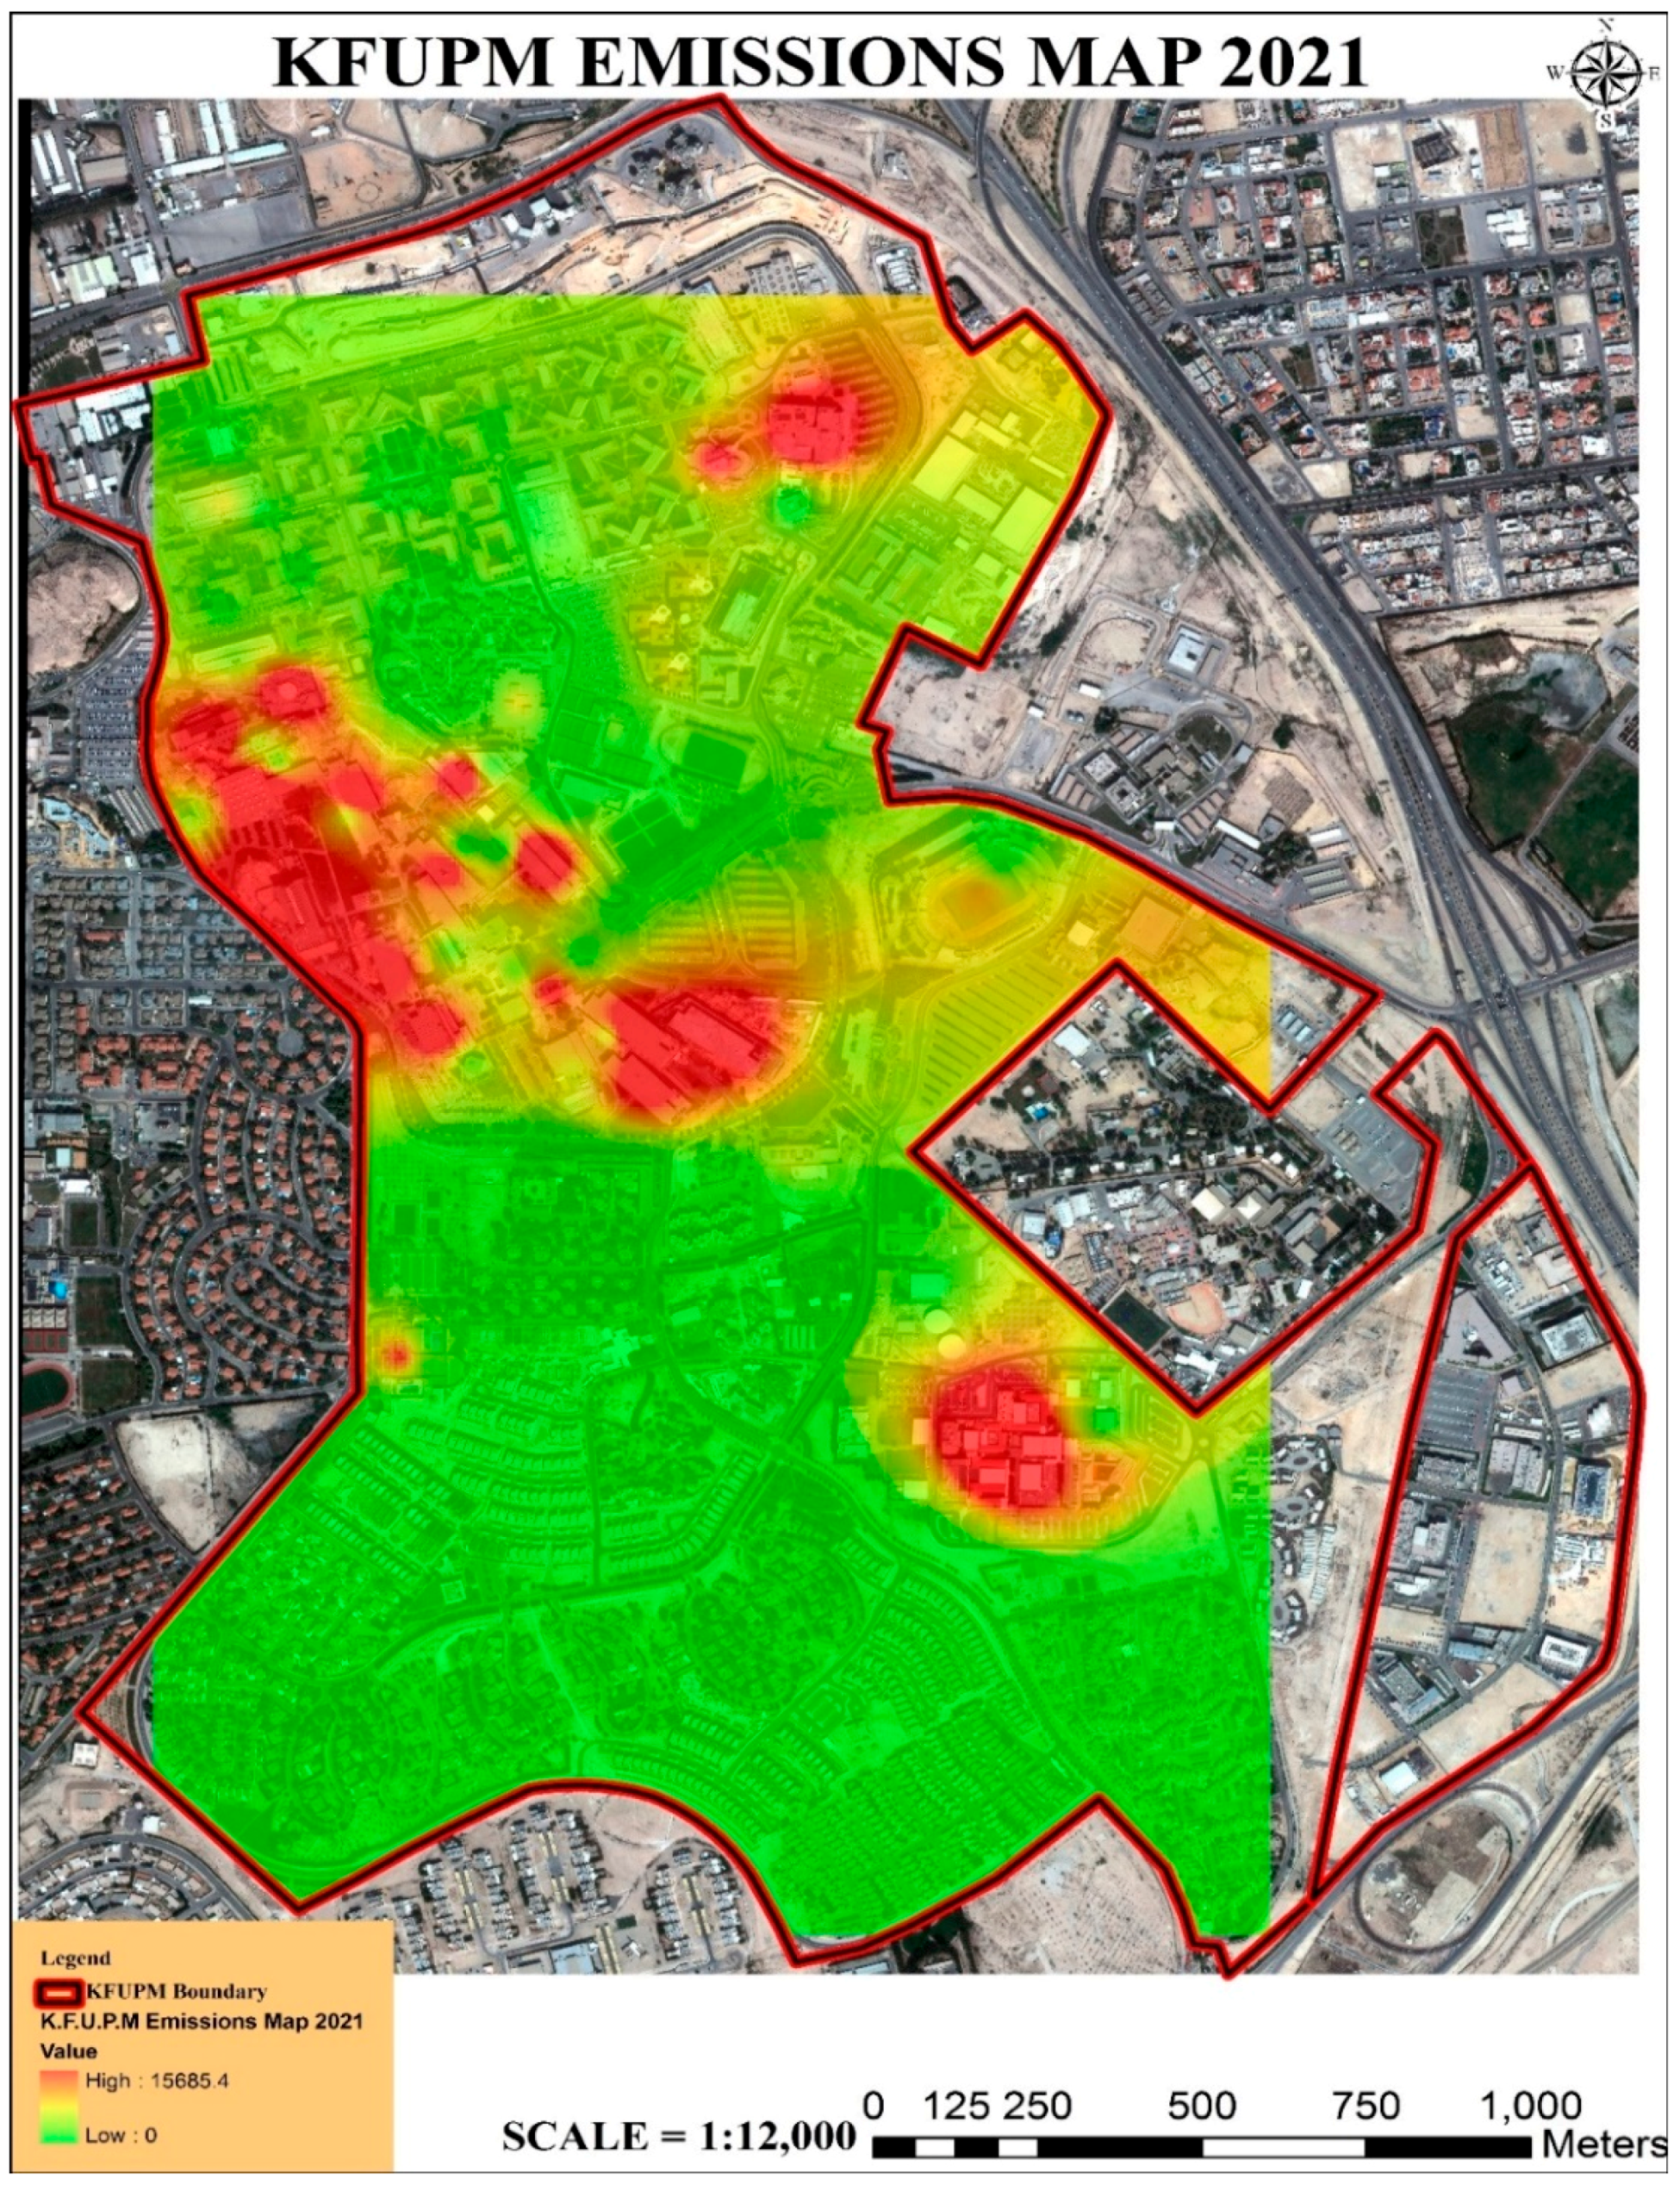
Based on the revised parameters for reduction of emissions by the year 2021, the model depicted the campus emissions scenario in Figure 10. It can be observed that there is predicted reduction in overall emission from approximately 18 tons of CO2 equivalent to almost 15.6 tons of emissions in five years. Although the emission hotspots are mostly the same as outlined in the discussion of model enactment, their impact has lowered because of values that are added as backend information for the GIS-based campus sustainability model. These lower values exhibit the working and application of the model. This model evidences that geographically integrated framework for campus sustainability assessment can provide the account of existing information as well as portray future scenarios for decision makers to come up with viable strategies for promoting campus environmental sustainability.
Additionally, the foundation has been laid in the GIS-based model whereby effects of various parameters can be observed. As mentioned earlier, this visualization capability of the proposed GIS-based model provides the university managers with a clear picture of progress or decline in campus environmental sustainability status. For example, future scenario depicting campus environmental sustainability assessment of KFUPM for 2021 (Figure 10) could help identify potential hotspot areas that need intervention.

5. Conclusions

Campus sustainability assessment frameworks are going through a rapid transformation and transition to encompass growing requirements and challenges in campus sustainability assessment. However, these frameworks have limited application of geographically-referenced indicators or utilizing GIS for campus sustainability assessment. Given that some academic institutes in North America are also backing away from the traditional assessment frameworks and are trying to develop their own systems points out the limitation of the existing frameworks to cater to emerging trends and needs [52].
To address this limitation, this article proposes a GIS-based model that could provide the university managers with a tool that can help assess the environmental sustainability of campus and better management of campus operations. With the integration of location and operational parameters of campus with a spatial dimension, and converting different parameters into emissions levels, campus environmental sustainability assessment can be done in a more organized and systematic way. GIS-based environmental assessment will help the campus managers to direct their energy and resources to potential hotspots for reduction and mitigation of adverse effects on overall campus environment. Integrating geographical feature with campus sustainability assessment system can also help in overcoming the challenges of the limited access to data and conducting campus sustainability assessment in in developing countries.
Finally, a GIS-based campus environmental sustainability assessment will provide a better visualization of campus environmental sustainability standing and an opportunity to examine various scenarios. This visualization will help employ a strategy that can yield the best results in reducing emissions from campus operations and help in achieving overall environmental sustainability [45]. Based on the findings of this study, the following implications are highlighted towards enhancing campus environmental sustainability assessment using GIS models. Firstly, campus sustainability assessment is a comprehensive exercise that needs to be institutionalized within the campus planning and maintenance departments. For the model to be effective, authorities and staff responsible for managing campus operations need to obtain accurate and updated data, given that only quality data can produce an accurate picture of the current situation and future scenarios. Secondly, campus sustainability assessment is temporal in nature, and as such periodic (annual or biannual) assessment should be carried out to keep the emissions and overall campus environmental sustainability in check. Thus, in the case of any observed anomalies, a prompt response can be initiated to address the issue.
In conclusion, this paper presented the development of a GIS-based model for sustainability assessment of campus operations and demonstrates how it can be deployed in KFUPM, Saudi Arabia. The integration of spatial dimension in the model helps collect and measure spatially-related indicators of campus operations and provides better visualization of campus environmental sustainability status. This model can also assist decision makers to design strategies for improving the environmental sustainability of university campuses. Future research is needed to explore other GIS applications in campus sustainability assessment, such as measuring the compactness of university campuses. It is also important to undertake a study to validate the model. One of the methods for model validation is to run mock analysis and compare the results with the existing situation.

Acknowledgments

The authors acknowledge the support of the National Plan for Science, Technology and Innovation (MAARIFAH), King Abdulaziz City for Science and Technology through the Science & Technology Unit at King Fahd University of Petroleum & Minerals, Saudi Arabia (Award number: 14-BUI109-04).

Author Contributions

Habib M. Alshuwaikhat is the PI of the project. He contributed in initiating and conceiving the topic of this paper, designing the research structure, providing guidance throughout the stages of model development and contributed significantly to methods, GIS analysis, results and discussion sections. Ismaila R. Abubakar and Yusuf A. Aina are co-investigators of the project. They both contributed in conceiving the research idea, designing the study structure, conducting the study and writing the paper. Yusuf A. Adenle and Muhammad Umair are the research assistants of the project that both contributed to data collection, model development, GIS analysis, and writing the paper.

Conflicts of Interest

The authors declare no conflict of interest.

References

  1. Brundtland Commission. Our Common Future: World Commission on Environment and Development; Oxford University Press: Oxford, UK, 1987. [Google Scholar]
  2. Alshuwaikhat, H.M.; Abubakar, I. An integrated approach to achieving campus sustainability: Assessment of the current campus environmental management practices. J. Clean. Prod. 2008, 16, 1777–1785. [Google Scholar] [CrossRef]
  3. New York University. Greening the Urban Campus: A Sustainability Assessment of New York University; New York University: New York, USA, 2006. [Google Scholar]
  4. University of Calgary. Stepping up Together: Institutional Sustainability Plan. A Framework for Excellence and Leadership in the Pursuit of Sustainability; University of Calgary: Calgary, AB, Canada, 2011. [Google Scholar]
  5. Cole, L.; Wright, T. Assessing Sustainability on Canadian University Campuses: Development of a Campus Sustainability Assessment Framework. Master’s Thesis, Royal Roads University, Victoria, BC, Canada, 2003. [Google Scholar]
  6. Alshuwaikhat, H.M.; Aina, Y.A. GIS-based urban sustainability assessment: The case of Dammam city, Saudi Arabia. Local Environ. 2006, 11, 141–161. [Google Scholar] [CrossRef]
  7. James, B.R. The Need for GIS in Urban Sustainability. Sensors and Systems, 18 May 2008. Available online: http://sensorsandsystems.com/the-need-for-gis-in-urban-sustainability/ (accessed on 16 August 2016).
  8. Stylianidis, E.; Karanikolas, N.; Kaimaris, D. A GIS for urban sustainability indicators in spatial planning. Int. J. Sustain. Dev. Plan. 2012, 7, 1–13. [Google Scholar] [CrossRef]
  9. Hwang, S. Placing GIS in sustainability education. J. Geogr. High. Educ. 2013, 37, 276–291. [Google Scholar] [CrossRef]
  10. Carsjens, G.J.; Ligtenberg, A. A GIS-based support tool for sustainable spatial planning in metropolitan areas. Landsc. Urban Plan. 2007, 80, 72–83. [Google Scholar] [CrossRef]
  11. Graymore, M.L.; Wallis, A.M.; Richards, A.J. An Index of Regional Sustainability: A GIS-based multiple criteria analysis decision support system for progressing sustainability. Ecol. Complex. 2009, 6, 453–462. [Google Scholar] [CrossRef]
  12. Blaschke, T. GIS-based regionalization of indicators and eco-balances for a sustainable regional planning. In Human Dimensions Research in Austria and Central European Countries; Prettenthaler, F., Ed.; University of Graz: Graz, Austria, 2001. [Google Scholar]
  13. Abubakar, I.R. The role of GIS in the planning, implementation and management of university environmental management system—Case of KFUPM, Saudi Arabia. In Proceedings of the 2nd National GIS Symposium in Saudi Arabia, Dammam, Saudi Arabia, 23–25 April 2007.
  14. Lozano, R.; Lozano, F.J.; Mulder, K.; Huisingh, D.; Waas, T. Advancing higher education for sustainable development: International insights and critical reflections. J. Clean. Prod. 2013, 48, 3–9. [Google Scholar] [CrossRef]
  15. Ferrer-Balas, D.; Buckland, H.; de Mingo, M. Explorations on the University’s role in society for sustainable development through a systems transition approach. Case-study of the Technical University of Catalonia (UPC). J. Clean. Prod. 2009, 17, 1075–1085. [Google Scholar] [CrossRef]
  16. Disterheft, A.; da Silva Caeiro, S.S.F.; Ramos, M.R.; de Miranda Azeiteiro, U.M. Environmental Management Systems (EMS) implementation processes and practices in European higher education institution—Top-down versus participatory approaches. J. Clean. Prod. 2012, 31, 80–90. [Google Scholar] [CrossRef]
  17. Townsend, J.; Barrett, J. Exploring the applications of carbon footprinting towards sustainability at a UK university: Reporting and decision making. J. Clean. Prod. 2015, 107, 164–176. [Google Scholar] [CrossRef]
  18. Velazquez, L.; Munguia, N.; Platt, A.; Taddei, J. Sustainable University: What can be the matter? J. Clean. Prod. 2006, 14, 810–819. [Google Scholar] [CrossRef]
  19. Abubakar, I.; Al-Shihri, F.; Ahmed, S. Students’ Assessment of Campus Sustainability at the University of Dammam, Saudi Arabia. Sustainability 2016, 8, 59. [Google Scholar] [CrossRef]
  20. Brix, A.; Brydon, T.; Davidian, E.; Dinse, K.; Vidyarthi, S. Toward Sustainable Campus Communities: Evaluating Alternative Development Scenarios. Master’s Project, University of Michigan, Ann Arbor, MI, USA, 2006. [Google Scholar]
  21. Shriberg, M. Institutional assessment tools for sustainability in higher education: Strength, weakness, and implications for practice and theory. Int. J. Sustain. High. Educ. 2002, 3, 254–270. [Google Scholar] [CrossRef]
  22. Lozano, R. The state of sustainability reporting in universities. Int. J. Sustain. High. Educ. 2011, 12, 67–78. [Google Scholar] [CrossRef]
  23. Brinkhurst, M.; Rose, P.; Maurice, G.; Ackerman, J.D. Achieving campus sustainability: Top-down, bottom-up, or neither? Int. J. Sustain. High. Educ. 2011, 12, 338–354. [Google Scholar] [CrossRef]
  24. Lozano, R.; Ceulemans, K.; Alonso-Almeida, M.; Huisingh, D.; Lozano, F.J.; Waas, T.; Hugé, J. A review of commitment and implementation of sustainable development in higher education: Results from a worldwide survey. J. Clean. Prod. 2015, 108, 1–18. [Google Scholar] [CrossRef]
  25. Legacy, C. Campus Sustainability: Sustainability Assessment Framework at the University of Waterloo. Capstone Project. 2004. Available online: http://environment.uwaterloo.ca/research/watgreen/projects/library/w04sustframework.pdf (accessed on 29 February 2016).
  26. Dalal-Clayton, B.; Bass, S. Sustainable Development Strategies: A Resource Book; Earthscan Publications Ltd.: London, UK, 2002. [Google Scholar]
  27. Lukman, R.; Krajnc, D.; Glavic, P. University ranking using research, educational and environmental indicators. J. Clean. Prod. 2010, 18, 619–628. [Google Scholar] [CrossRef]
  28. Müller-Christ, G.; Sterling, S.; van Dam-Mieras, R.; Adomßent, M.; Fischer, D.; Rieckmann, M. The role of campus, curriculum, and community in higher education for sustainable development—A conference report. J. Clean. Prod. 2014, 62, 134–137. [Google Scholar] [CrossRef]
  29. Maniezzo, V.; Mendes, I.; Paruccini, M. Decision support for siting problems. Decis. Support Syst. 1998, 23, 273–284. [Google Scholar] [CrossRef]
  30. Urbanski, M.; Filho, W.L. Measuring sustainability at universities by means of the Sustainability Tracking, Assessment and Rating System (STARS): Early findings from STARS data. Environ. Dev. Sustain. 2015, 17, 209–220. [Google Scholar] [CrossRef]
  31. Global Reporting Initiative (GRI). Available online: https://www.globalreporting.org/SiteCollectionDocuments/GRI-Reports-List-Limited.zip (accessed on 5 October 2016).
  32. Sustainability Tracking, Assessment and Rating Systems (STARS). Available online: https://stars.aashe.org/institutions/participants-and-reports/ (accessed on 5 October 2016).
  33. Association for the Advancement of Sustainability in Higher Education (AASHE). STARS Technical Manual 2.0; Association for the Advancement of Sustainability in Higher Education (AASHE): Denver, CO, USA, 2014. [Google Scholar]
  34. Sonetti, G.; Lombardi, P.; Chelleri, L. True green and sustainable university campuses? Toward a clusters approach. Sustainability 2016, 8, 83. [Google Scholar] [CrossRef]
  35. Association for the Advancement of Sustainability in Higher Education (AASHE). 2014, STARS Technical Manual 2.1. Administrative Update Two. January 2017. Available online: http://www.aashe.org/files/documents/STARS/2.0/stars_2.1_technical_manual_-_administrative_update_two.pdf (accessed on 20 February 2017).
  36. Shi, H.; Lai, E. An alternative university sustainability rating framework with a structured criteria tree. J. Clean. Prod. 2013, 61, 59–69. [Google Scholar] [CrossRef]
  37. Global Reporting Initiative (GRI). GRI and Sustainability Reporting. Available online: https://www.globalreporting.org/information/sustainability-reporting/Pages/default.aspx (accessed on 29 February 2016).
  38. Alonso-Almeida, M.D.; Marimon, F.; Casani, F.; Rodriguez-Pomeda, J. Diffusion of sustainability reporting in universities: current situation and future perspectives. J. Clean. Prod. 2015, 106, 144–154. [Google Scholar] [CrossRef]
  39. Vasquez, L.; Iriarte, A.; Almeida, M.; Villabobos, P. Evaluation of greenhouse gas emissions and proposals for their reduction at a university campus in Chile. J. Clean. Prod. 2015, 108, 924–930. [Google Scholar] [CrossRef]
  40. Bice, S.; Coates, H. University sustainability reporting: Taking stock of transparency. Tert. Educ. Manag. 2016, 22, 1–18. [Google Scholar] [CrossRef]
  41. Shahin, A.; Mahbod, M.A. Prioritization of key performance indicators: An integration of analytical hierarchy process and goal setting. Int. J. Product. Perform. Manag. 2007, 56, 226–240. [Google Scholar] [CrossRef]
  42. Environmental Systems Research Institute. IDW. Retrieved from ArcGIS 9.2 Desktop Help. Available online: http://webhelp.esri.com/arcgisdesktop/9.2/index.cfm?TopicName=IDW (accessed on 19 May 2016).
  43. Singh, R.K.; Murty, H.R.; Gupta, S.K.; Dikshit, A.K. An overview of sustainability assessment methodologies. Ecol. Indic. 2009, 15, 281–299. [Google Scholar] [CrossRef]
  44. Association for the Advancement of Sustainability in Higher Education (AASHE). STARS Overview. Available online: https://stars.aashe.org/pages/about/stars-overview.html (accessed on 29 February 2016).
  45. Perez-Lombard, L.; Ortiz, J.; Pout, C. A review on buildings energy consumption information. Energy Build. 2008, 394–398. [Google Scholar] [CrossRef]
  46. Iwaro, J.; Mwasha, A. A review of building energy regulation and policy for energy conservation in developing countries. Energy Policy 2010, 38, 7744–7755. [Google Scholar] [CrossRef]
  47. Alshuwaikhat, H.M.; Adenle, Y.A.; Saghir, B. Sustainability Assessment of Higher Education Institutions in Saudi Arabia. Sustainability 2016, 8, 750. [Google Scholar] [CrossRef]
  48. Ouda, O.K. Reviewing the Waste to Energy Potential in Saudi Arabia; Prince Muhammad Bin Fahd University: Dammam, Saudi Arabia, 2013; Available online: http://www.pmu.edu.sa/kcfinder/upload/files/Reviewing_the_Waste_to_Energy_Potential_in_Saudi_Arabia.pdf (accessed on 29 February 2016).
  49. Yutong. ZK6108HGH-Yutong. Available online: http://www.eobus.com/bus/168.htm (accessed on 25 April 2016).
  50. Wang, Z.; Geng, L. Carbon emission calculation from municipal solid waste and the influencing factors analysis in China. J. Clean. Prod. 2015, 104, 177–184. [Google Scholar] [CrossRef]
  51. SIDEM VEOLIA. SIDEM VEOLIA-FAQ. Available online: http://www.sidem-desalination.com/Process/FAQ/#c12260057721 (accessed on 25 April 2016).
  52. Alshuwaikhat, H.M.; Abubakar, I.R.; Aina, Y.A.; Saghir, B. Networking the Sustainable Campus Awards: Engaging with the Higher Education Institutions in Developing Countries. In Handbook of Theory and Practice of Sustainable Development in Higher Education; Springer International Publishing: Cham, Switzerland, 2017; pp. 93–107. [Google Scholar]
Figure 1. Study methodology demonstrating the various stages of the study.
Sustainability 09 00439 g001
Figure 2. SMART approach used in the development of campus sustainability indicators.
Sustainability 09 00439 g002
Figure 3. KFUPM data points map.
Sustainability 09 00439 g003
Figure 4. GIS-based land use map.
Sustainability 09 00439 g004
Figure 5. KFUPM academic buildings emissions map.
Sustainability 09 00439 g005
Figure 6. KFUPM faculty and student housing emissions map.
Sustainability 09 00439 g006
Figure 7. KFUPM transportation emissions map.
Sustainability 09 00439 g007
Figure 8. GIS-based model for assessing sustainability of campus operations.
Sustainability 09 00439 g008
Figure 9. KFUPM campus emissions map 2016.
Sustainability 09 00439 g009
Figure 10. KFUPM campus projected emission levels by 2021.
Sustainability 09 00439 g010
Table 1. University participation in STARS and GRI, 2011–2016.
Guideline and Reporting Framework2011 *2014 *2016 **Increase 2011–2016
STARS246537787320%
GRI125372600%
Source: * [22,30]; ** [31,32].
Table 2. Campus environmental sustainability assessment indicators.
CategoryIndicatorSpecificMeasurableTimeframeSpatial Dimension
EnergyTotal electricity useYesYes (Kwh)24 hYes
BuildingsWater useYesYes (Gallon)24 hYes
Waste ManagementSolid wasteYesYes (Tons)24 hYes
TransportationTotal hours of campus transport operationsYesYes24 hYes
Total fuel usage in campus vehiclesYesYes (Gallon)24 hYes
Air QualityGreenhouse gas (GHG) emissionYesYesYesYes
Table 3. KFUPM land use distribution.
Land UseArea (m2)%
Academic Buildings113,48014.84
Allied Facilities125,77516.45
Faculty Housing357,01746.7
Recreational Spaces91,26011.94
Student Housing76,95310.07
Total764,485100
Table 4. Indicators standardization and conversion.
UseConsumption UnitsStandard UsedGHG Conversion Factor
Energy ConsumptionkWh 70–300 kWh/m2 [46]0.391 kg CO2 e/kWh [39]
Transportationkm/L4.3 km/L [49]0.166 kg CO2 e/km [39]
Waste Generationkg/c/Day1 kg [48]0.79–1.16 kg CO2 e/kg [50]
Water ConsumptionL/c/Day or m37–18 kWh/m3 [51]0.391 kg CO2 e/kWh [39]
Table 5. Indicator used for model computation and their units.
Indicator UseValue
Energy ConsumptionAcademic Buildings300 kWh/m2
Allied Uses300 kWh/m2
Commercial300 kWh/m2
Dinning300 kWh/m2
Faculty Housing240 kWh/m2
Mosque150 kWh/m2
Parking70 kWh/m2
Recreation300 kWh/m2
Schools260 kWh/m2
Student Housing240 kWh/m2
Waste Generation Campus-wide1.4 kg/c/Day
Water ConsumptionCampus-wide 290 L/c/Day
TransportationCampus-wide 39 Buses
Table 6. Comparing indicators values from model computation 2021 and 2016.
Indicator Use20162021Change
Energy ConsumptionAcademic Buildings300 kWh/m2270 kWh/m210%
Allied Uses300 kWh/m2270 kWh/m210%
Commercial300 kWh/m2270 kWh/m210%
Dinning300 kWh/m2270 kWh/m210%
Faculty Housing240 kWh/m2216 kWh/m210%
Mosque150 kWh/m2143 kWh/m25%
Parking70 kWh/m263 kWh/m210%
Recreation300 kWh/m2270 kWh/m210%
Schools260 kWh/m2234 kWh/m210%
Student Housing240 kWh/m2216 kWh/m210%
Waste Generation Campus-wide1.4 kg/c/Day1.3 kg/c/Day7%
Water ConsumptionCampus-wide290 L/c/Day260 L/c/Day10%
TransportationCampus-wide39 Buses24 Buses20%