Article

Analysis of Low-Carbon Economy Efficiency of Chinese Industrial Sectors Based on a RAM Model with Undesirable Outputs

Department of Economics and Management, North China Electric Power University, Baoding 071003, China
*
Author to whom correspondence should be addressed.
Sustainability 2017, 9(3), 451; https://doi.org/10.3390/su9030451
Submission received: 31 January 2017 / Revised: 6 March 2017 / Accepted: 16 March 2017 / Published: 18 March 2017
(This article belongs to the Section Energy Sustainability)

Abstract

:
Industrial energy and environment efficiency evaluation become especially crucial as industrial sectors play a key role in CO2 emission reduction and energy consumption. This study adopts the additive range-adjusted measure data envelope analysis (RAM-DEA) model to estimate the low-carbon economy efficiency of Chinese industrial sectors in 2001–2013. In addition, the CO2 emission intensity mitigation target for each industrial sector is assigned. Results show that, first, most sectors are not completely efficient, but they have experienced and have improved greatly during the period. These sectors can be divided into four categories, namely, mining, light, heavy, and electricity, gas, and water supply industries. The efficiency is diverse among the four industrial categories. The average efficiency of the light industry is the highest among the industries, followed by those of the mining and the electricity, gas, and water supply industries, and that of the heavy industry is the lowest. Second, the electricity, gas, and water supply industry shows the biggest potential for CO2 emission reduction, thus containing most of the sectors with large CO2 emission intensity mitigation targets (more than 45%), followed by the mining and the light industries. Therefore, the Chinese government should formulate diverse and flexible policy implementations according to the actual situation of the different sectors. Specifically, the sectors with low efficiency should be provided with additional policy support (such as technology and finance aids) to improve their industrial efficiency, whereas the electricity, gas, and water supply industry should maximize CO2 emission reduction.

1. Introduction

The Chinese economy has maintained an average annual growth rate of approximately 10% since the implementation of the reform and opening up policy [1]. The GDP of China grew from 149.541 billion US$ in 1978 to 11.008 trillion US$ in 2015 [2], which corresponds to nearly 13% of the global total share from approximately 1.8%, thus making China the second largest economy in the world. However, the rapid growth of the GDP has resulted from a series of events that are closely associated with the depleting energy resource and environmental degradation [3,4,5]. Specifically, the energy consumption of China has been ranked first in the world [6,7], reaching 4.258 billion tons of standard coal equivalent in 2014 (more than l2.3% of that in 2013) and accounting for 23% of the world’s total [8]. Meanwhile, the energy consumption generates large quantities of undesirable gases, including CO2, which contributes largely to global warming. According to statistics, the Chinese CO2 emissions reached 9153.9 bt (27.3%) in 2015, which is the largest share of emissions [9]. Consequently, the low efficiency of energy utilization and heavy pollution impedes sustainable development seriously [10]. To address this issue, China announced a mandatory CO2 emissions reduction target of 40%–45% per unit GDP until 2020 relative to the level in 2005. This goal is officially incorporated into the long-term plan for national economic and social development.
The national economy of China has been overwhelmingly dominated by the industry, which shares more than 40% of the GDP [2]. However, economic growth inevitably causes adverse impacts. The energy consumption of the industry in 2014 accounted for more than 69% of China’s total, and the energy consumption-related CO2 emissions accounted for 60% of China’s total [2]. Consequently, the industry plays a critical role in energy saving and emission reduction in China. Currently, China is in the accelerated development stage of industrialization, the completion of which is a long process. Meanwhile, the requirement for energy consumption and CO2 emissions is still strong [11], while the energy consumption structure cannot be changed immediately. Furthermore, the different industrial sectors have disparities of different aspects, such as energy consumption, industrial structure, and technology innovation. Thus, an objective evaluation should be especially conducted in the industrial sectors, and the emission reduction target must be allocated among the sectors with clear objectives of carbon emission reduction. The evaluation results will be meaningful and valuable for realizing the current environmental condition, realizing the efficiency promotion potential of the industry, and thus formulating practical schemes for sustainable development and implementing effective controls for environmental protection [12].
The data envelope analysis (DEA) model provides an effective non-parametric method for evaluating the relative efficiency of the homogeneous decision-making units (DMUs) with multiple inputs and outputs [13,14,15,16]. This model has been widely applied to the measurement of the environmental efficiency of an industry [17,18]. For example, Wu et al. [19] measured industrial energy efficiency performance through several environmental DEA models related with CO2 emission. Wang and Wei [20] applied a newly developed DEA-based method to evaluate the regional emission efficiency of the industrial sectors in 30 major cities of China in 2006–2010. Li et al. [21] measured the energy efficiency of Chinese industrial sectors from 2001 to 2010 using the improved super-slack-based measure (SBM) model. Zhang et al. [22] evaluated the industrial CO2 emission efficiency, emission reduction potential, and profits brought by emission reduction in 30 provinces of China in 2005–2012. However, most previous studies ignored the undesirable outputs, such as environmental pollution [23,24], which exist as an obvious by-product of industrial activities [25]. On this note, any efficiency evaluation that is blind to this point cannot explain the real production process and leads to unreliable results. Scholars have made numerous attempts to combine the undesirable outputs with efficiency measurements. For example, Haynes et al. [26], Reinhard et al. [27], and Hailu et al. [28] treated the outputs as direct inputs, whereby outputs are maximized and inputs are minimized simultaneously. Scheel [29] and Zhu [30] proposed converting the undesirable outputs into desirable outputs based on the reciprocal conversion method [31]. Seiford et al. [32] used the data transition method to handle the undesirable outputs. Chung et al. [33] extended the radial-based model proposed by Färe et al. [34], who suggested the directional distance function (DDF) approach, in which each DMU can simultaneously increase its desirable and undesirable outputs through the same degree of proportionality within the production possibility set. Nearly all conventional DEA models are restricted to radial and oriented measurement and do not consider the effects of slack variables. This may induce biased estimation results. Although this approach can deal with the undesirable outputs in an efficiency evaluation successfully, DDF essentially belongs to radial-oriented measurement [35,36,37].
Tone [38] proposed the SBM model, which, unlike the traditional model, is an additive non-racial, non-oriented approach [39]. In this approach, slack variables are directly added into the target function [40]. This model overcomes the drawback in other efficiency measures and provides a more accurate efficiency measurement that addresses the problem of undesirable outputs. However, the approach was somewhat argued by Sueyoshi et al. [23] because the indicator selection of the SBM model was subjective and the efficiency of the same DMUs under different direction vectors was inconsistent. Cooper et al. [41] introduced the range-adjusted measure (RAM) model to measure the unified efficiency of the desirable and undesirable outputs. Subsequently, Sueyoshi et al. [23] extended the RAM model, wherein input excesses and output shortfalls, which are recognized as slacks, are considered in the model based on the additive structure. The RAM model removes the separation of the input and output orientations, and the radial limitation avoids the influence of subjective parameters.
Consistent with the output-oriented optimization, the RAM model has three types [41]: PE-RAM (operational efficiency), CE-RAM (carbon environmental efficiency), and LCE-RAM (low-carbon economy efficiency). The PE-RAM model only considers the desirable outputs in the optimization process, ignores the environmental regulation, and measures the economic efficiency. The CE-RAM model only considers the undesirable outputs and eventually obtains the environmental efficiency. The LCE-RAM model accounts for the desirable and undesirable outputs and attains low-carbon economy efficiency, that is, unified efficiency, to acquire a win–win situation for economic growth and environmental protection.
This study separates inputs into energy and non-energy given the influence of the energy substitution effect [42]. The energy inputs could replace the non-energy inputs in the efficiency accounting process, and the negative shift of an energy input is also used in attaining the efficient frontier for a desirable output [43]. Thus, the energy slack variable indicates whether the energy can increase or decrease with the separation of the positive and negative parts.
The study aims to intensively investigate the status of the industrial economic–environment performance in China not only by measuring the level and variance trend of the industrial low-carbon economy efficiency in China but also by assigning CO2 emission intensity mitigation to 36 industrial sectors. The LCE-RAM model is applied appropriately to realize this study objective because this approach measures efficiency by integrating environment efficiency with economic efficiency.
This study provides a comprehensive efficiency model that integrates desirable and undesirable outputs into the Chinese industrial sectors unlike the previous studies, which did not incorporate the undesirable outputs in their framework. This study is also one of the first applications of the RAM model in the industrial sectors.
This study carefully introduces the LCE-RAM model and the distribution model of the CO2 emission intensity mitigation target in Section 2 to evaluate industrial performance concisely. Section 2 also discusses the data and variables utilized in the efficiency evaluation. Section 3 presents the primary results of the paper. Details of the efficiency results and the CO2 emission intensity mitigation targets are discussed in Section 4. Section 5 provides the summary and a discussion of several extensions of the paper.

2. Materials and Methods
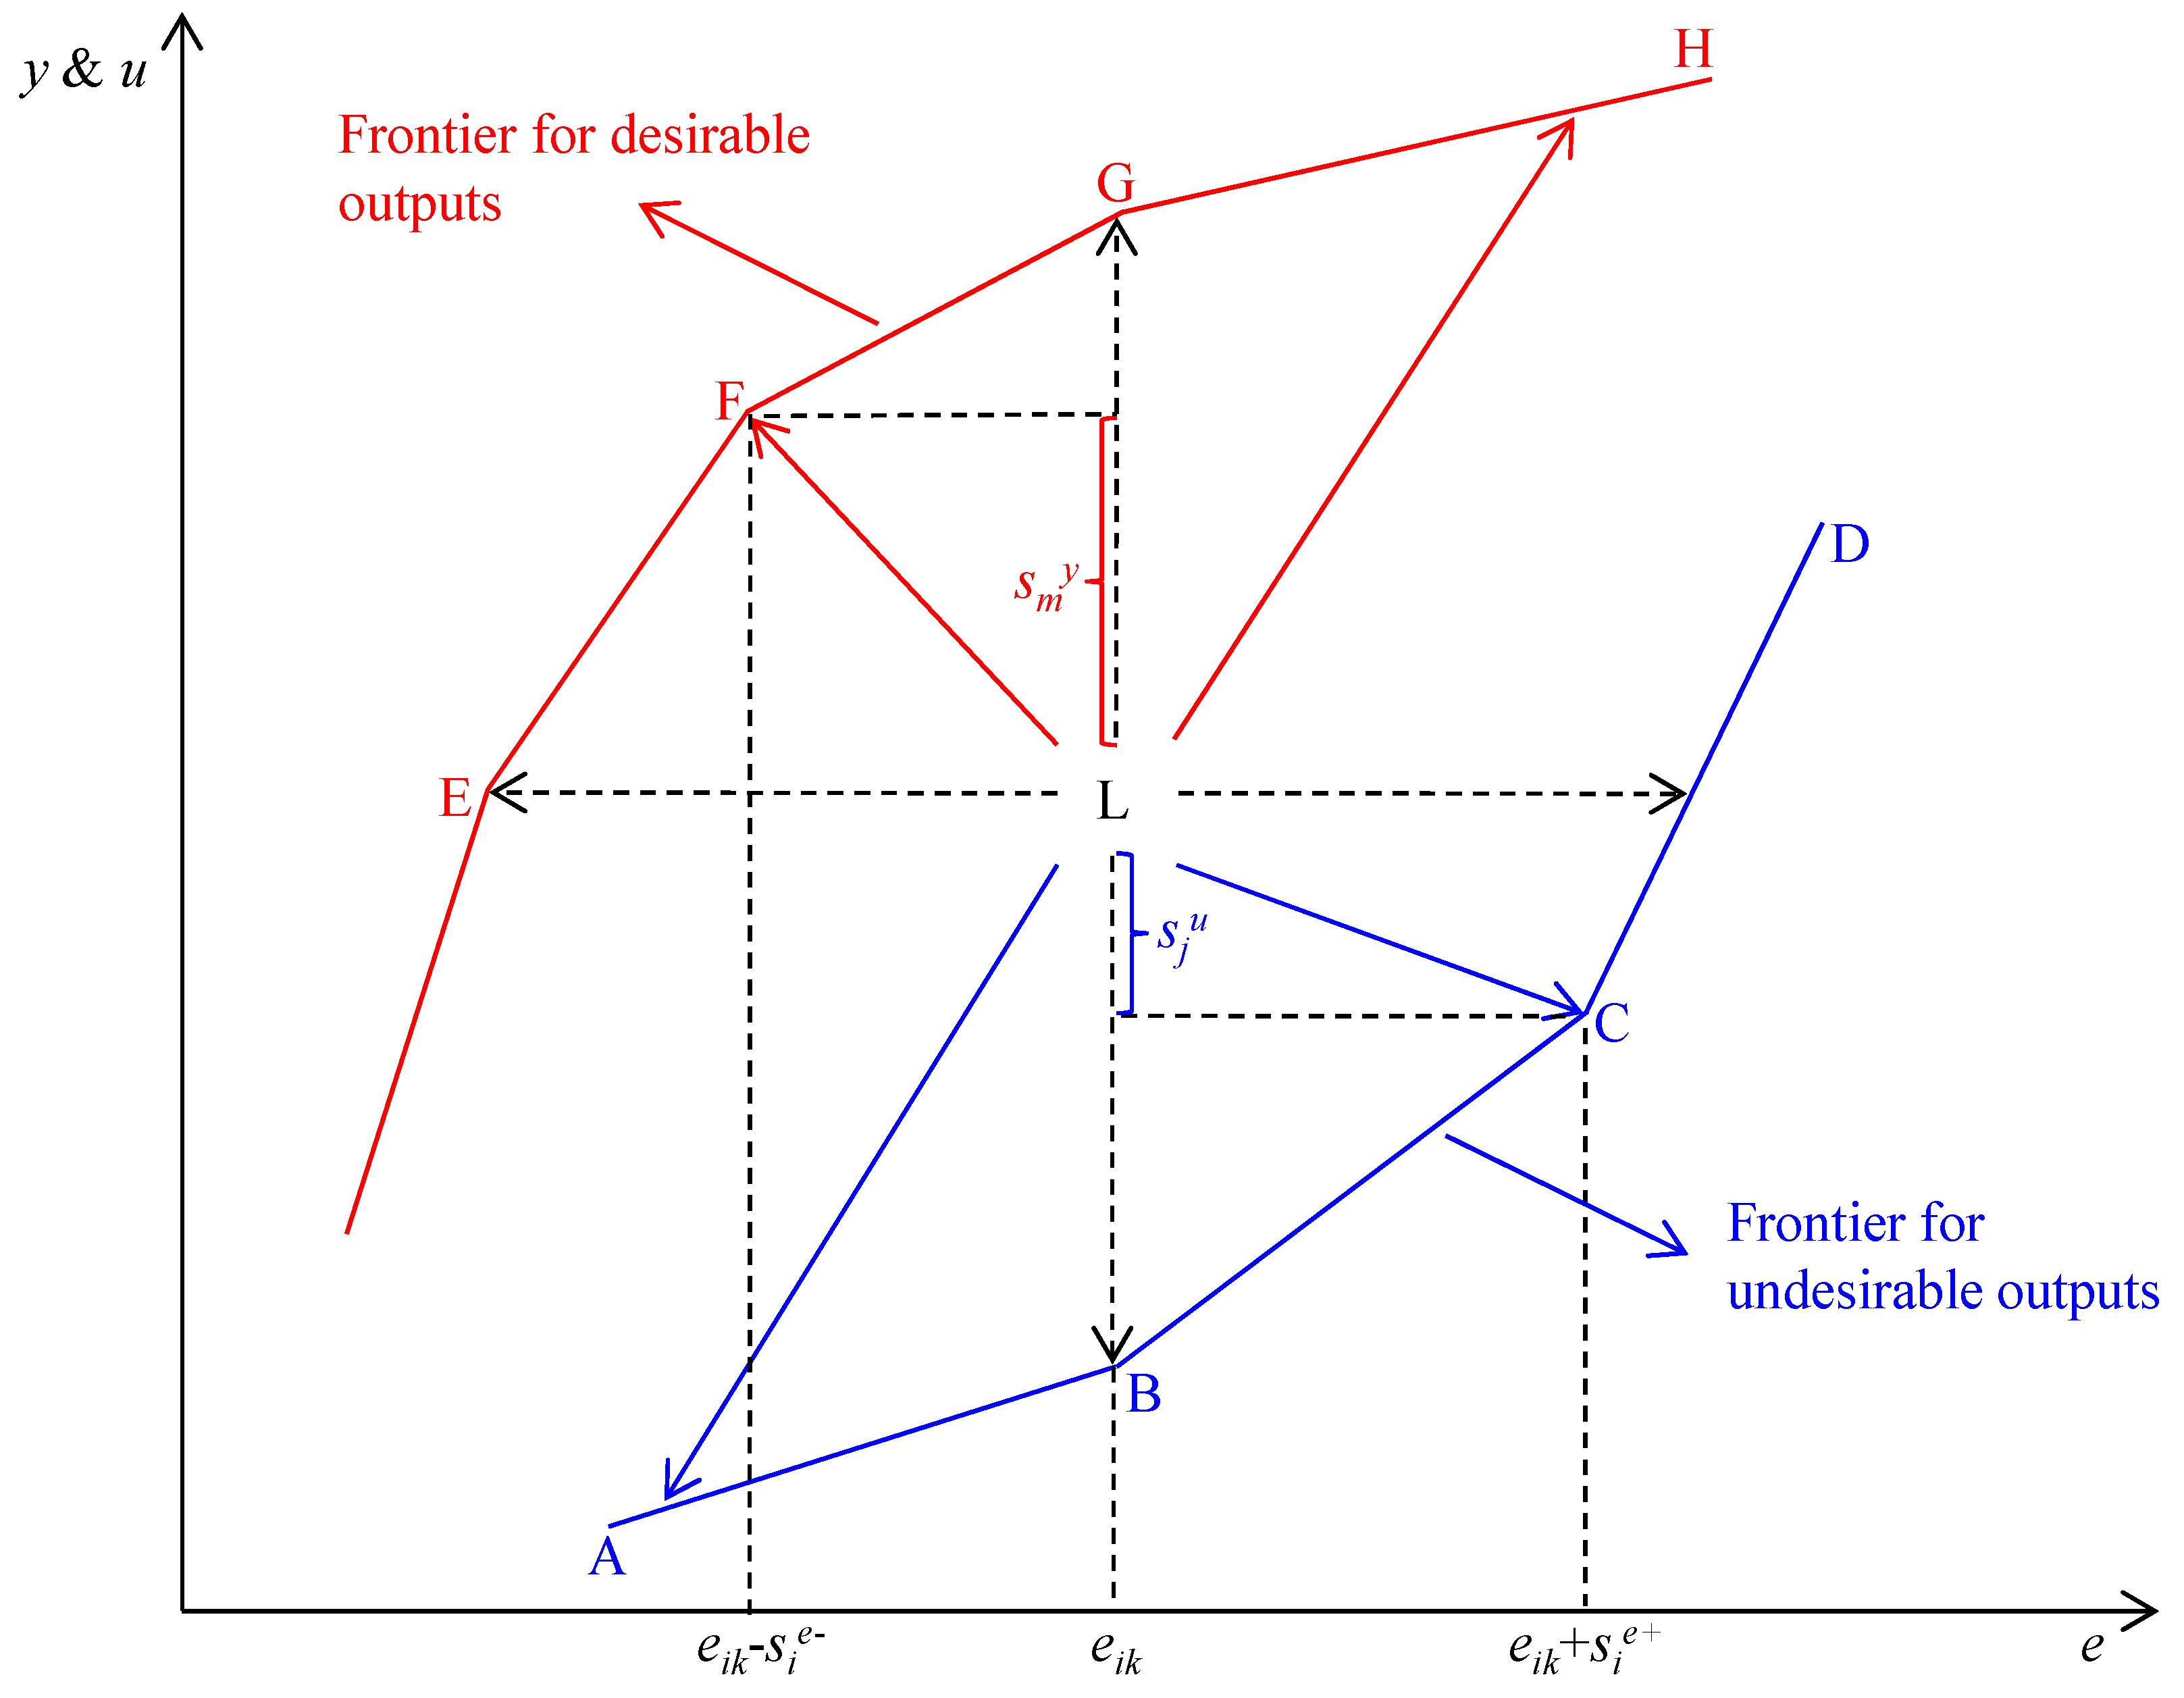
2.1. LCE-RAM Model

This study assumes a production system with K DMUs, in which the lth DMU (l ϵ [1, K]) uses N non-energy inputs (such as labor and capital) of xl = (x1l, x2l, …, xNl) and I energy inputs of el = (e1l, e2l, …, eIl) to produce M desirable outputs (such as industrial value) of yl = (y1l, y2l, …, yMl) and simultaneously yield J undesirable outputs (such as CO2) of ul = (u1l, u2l, …, uJl). Thus, the production possibility sets, which divide inputs into non-energy and energy, include desirable and undesirable outputs that can be expressed as:
P(x, e) = {(x, e, y, u);(x, e) can produce (y, u)}.
s n x is the excess input for non-energy inputs, considering s n x (n = 1, 2, …, N), s i e - (i = 1, 2, …, I), s i e + (i = 1, 2, …, I), s m y (m = 1, 2, …, M), and s j u (j = 1, 2, …, J) as the slack variables. The plus or minus in s i e - and s i e + indicates energy expansion and cut two projection directions, respectively. In an actual measurement, s i e - and s i e + cannot co-exist, that is, energy consumption cannot decrease and increase concurrently. s j u stands for the excessive emissions of pollutants.
This study integrates energy, CO2 emissions, and economic growth into a framework to realize a reasonable judgment on the current level of coordination among these variables to present a comprehensive efficiency model as follows:
R A M l = max n = 1 N s n x * R n x + i = 1 I s i e + * + s i e * R i e + m = 1 M s m y * R m y + j = 1 J s j u * R j u N + M + I + J s . t . { k = 1 K λ k x n k + s n x = x n l , n = 1 , 2 , ... , N ; k = 1 K λ k e i k s i e + + s i e = e i l , i = 1 , 2 , ... , I ; k = 1 K λ k y m k s m y = y m l , m = 1 , 2 , ... , M ; k = 1 K λ k u j k + s j u = u j l , j = 1 , 2 , ... , J ; k = 1 K λ k = 1 ; λ k 0 , k = 1 , 2 , ... , K ; s n x , s m y 0 ; s i e + , s i e 0 , s i e + s i e = 0 ; s j u 0. .
In the above formula, the slack variables are incorporated into the subject function, which is the necessary condition of optimality. Then, the optimal RAM scores can be measured for the sectors in each period through Equation (2). To overcome the unbounded solution, Equation (2) is required to satisfy the nonlinear condition s i e + × s i e = 0 , which implies that the slack variables are mutually exclusive. R n x (n = 1, 2, …, N), R i e (i = 1, 2, …, I), R m y (m = 1, 2, …, M), and R j u (j = 1, 2, …, J) represent the maximum possible values of inefficiency for non-energy inputs, energy inputs, desirable outputs, and undesirable outputs, respectively. These variables are determined by the upper and lower bounds in the following manner:
{ R n x = ( x n k ) max ( x n k ) min , ( n = 1 , 2 , ... N ) R i e = ( e i k ) max ( e i k ) min , ( i = 1 , 2 , ... I ) R j u = ( u j k ) max ( u j k ) min , ( j = 1 , 2 , ... J ) R m y = ( y m k ) max ( y m k ) min , ( m = 1 , 2 , ... M ) .
Then, the low-carbon economy efficiency of the lth DMU can be defined as follows:
θ = 1 R A M l
The efficiency status requires all slacks to be zero in the model. At this time, the industry is at a Pareto optimal level. Otherwise, the DMU is inefficient, and the inputs and outputs can be further improved.
The unified efficiency reflects the reasonable judgment of the coordination between economic growth and emission reduction control; its improvement requires considering the economic and environmental efficiency. Therefore, the LCE-RAM model holds two frontiers based on dual output as depicted in Figure 1. The horizontal axis represents the energy input, the vertical axis denotes desirable and undesirable outputs, the contour line (EFGH) indicates an efficient frontier for a desirable output, and the contour line (ABCD) indicates an efficient frontier for an undesirable output. Specifically, the inefficient sector L can achieve an efficient frontier for a desirable output by moving along LF through increasing the desirable output to ymk + s m y from ymk while reducing the energy consumption to eik s i e - from eik. By contrast, the projection from L along the directions close to H expresses an extensive economic growth trend because expanding a desirable output is accompanied by the deterioration in energy consumption. Similarly, industry L can attain a frontier for undesirable output by shifting toward the LA and LC directions. The former projection is referred to as natural reduction. In this case, the industry achieves CO2 emission reduction by decreasing the energy input. The latter implies significant management improvements via optimizing the energy structure or utilizing new generation technology and equipment. Hence, the CO2 emissions are reduced by s j u , although the energy consumption is improved to eik + s i e + from eik.

2.2. Assignment Model of the CO2 Emission Intensity Mitigation Target

As mentioned, a joint emission reduction agreement is unnecessary in reaching the low-carbon goal because the economic growth modes and industrial structures, including the energy consumption structures of the different Chinese industrial sectors, vary considerably. Simply restricting the polluting industries and developing the low emission industries can reduce emissions to some extent but is not conducive to economic development. Hence, the target setting approach should consider industrial differentiation. Therefore, in terms of the reduction targets and requirements of economic development, rationally allocating the emission allowances to each sector will help relieve the burden of emission reduction, define responsibilities clearly, and adjust the industry and energy structure properly, which can promote the transformation toward a low-carbon economy and ensure economic development sustainably. This study considers the CO2 emission intensity as an indicator in formulating the mitigation assignment targets to ensure an effective and fair distribution. This study also investigates the capacity of each DMU to increase output and reduce emission because of the industrial structural adjustment, and adds them into the objective function, eventually providing the plan for allocating emission allowances to each industry.

2.2.1. Industrial Output and CO2 Emission Potential Measurement

The LCE-RAM model is based on slack variables, which represent the inefficiency level. Hence, according to Cooper [41], the desirable outputs inefficiency and undesirable outputs inefficiency can be decomposed as follows:
N E y = 1 1 θ × m = 1 M s m y / R m y ( N + M + I + J ) ,
N E u = 1 1 θ × j = 1 J s j u / R j u ( N + M + I + J ) .
Based on the definition of variable specific inefficiency proposed in Equations (6) and (7), the improvement potential for industrial output and CO2 emission can be obtained as follows:
y p k = ( N E y ) k × y k ,
u p k = ( N E ) u k × u k .

2.2.2. Assignment of CO2 Emission Intensity Mitigation Target

Considering the stated mitigation target (40%–45%), the CO2 emission intensity mitigation targets in 2013 are mathematically expressed as follows:
D 2020 = ( 1 I ) × D 2005 ,
A D = ( D 2020 D 2009 ) 11 ,
D 2013 = D 2009 + 4 A D .
In Equation (9), I is the CO2 emission intensity mitigation target, which is 45%, proposed by the Chinese government. AD is the annual average emission intensity mitigation value from 2009–2020. D2009 and D2005 are the actual CO2 emission intensity values for all the industries in years 2009 and 2005, respectively. D2020 and D2013 are the CO2 emission intensity target values for all the industries in the years 2020 and 2013, respectively.
The realization of this CO2 emission intensity mitigation goal for the entire industry can be translated into an absolute output-increasing target and a CO2 mitigation target at the industry level and be assigned to varied sectors. Thus, the ideal industrial output and CO2 emission target for each sector after adjustment can be presented as
y m k = y k + Δ y k ,
u m k = u k Δ u k .
Therefore, the CO2 emission intensity mitigation targets for the different sectors in 2013 can be reached through the following model:
max l = k = 1 K Δ u k u k + k = 1 K Δ y k y k s . t . { u m k y m k = ( u k Δ u k ) ( y k + Δ y k ) = D 2013 0 Δ u k u p k 0 Δ y k y p k k = 1 , 2 , ......36 ,
where u m k is the target value of the undesirable output for sector k, and y m k is the target value of the industrial output for sector k.
Then, the target CO2 emission intensity for sector k can be obtained as:
d m k = u m k y m k .
The proportion of CO2 emission intensity mitigation for the industrial sector in 2013 can be expressed as follows:
R k = 1 d a k / d m k ,
where d a k is the actual CO2 emission intensity for industry k in 2013.

2.3. Data and Variables

Given the availability and integrity of the data, this study selects 36 sub-industries, excluding “other mining industries” and other industries, in China between 2001 and 2013 as the research objects because of the absence of relevant data from these sectors (Table 1). For a detailed study, the 36 sub-industries are classified into four industrial categories, namely, mining, light, heavy, and electricity, gas, and water supply industries, according to the “classification and code standard of the national economy industry” released by the National Bureau of Statistics of China [13].
In studies on environmental efficiency, input indicators generally include non-energy (e.g., capital and labor) and energy inputs, while outputs are generally divided into desirable (industrial output) and undesirable outputs (CO2 emissions) [44]. Specific instructions and related statistical description follows (the dataset is listed in Table 2).
Labor. This term describes the average number employees in the enterprises over the designated scale as the proxy for labor input.
Capital. This term describes the utilization of the outstanding net value of fixed assets of the enterprises over the designated scale as the proxy for capital input.
Energy. The energy consumption of industrial enterprises includes all types of energy (e.g., coal, oil, gas, and electricity), and all energy consumption data are converted into tons of coal equivalent (TCE).
Desirable output. The gross output value of the enterprises over the designated scale as a desirable output expects a yield from the industrial output in 2013, and missing data by the two moving averages are obtained. These values have been adjusted from a nominal value to exclude the effects of general price level changes between 2001 and 2013.
Undesirable output. The calculation of the CO2 emissions is guided by the 2006 Intergovernmental Panel on Climate Change (IPCC) guidelines for the National Greenhouse Gas Inventories and is based on the total amount of fuels combusted and the averaged carbon content of the fuels [45].
The above data are collected from the statistical and energy statistical yearbooks of China [46]. Table 1 presents the descriptive statistics of the input and output data of the 36 major industrial sectors in China from 2001–2013.

3. Results

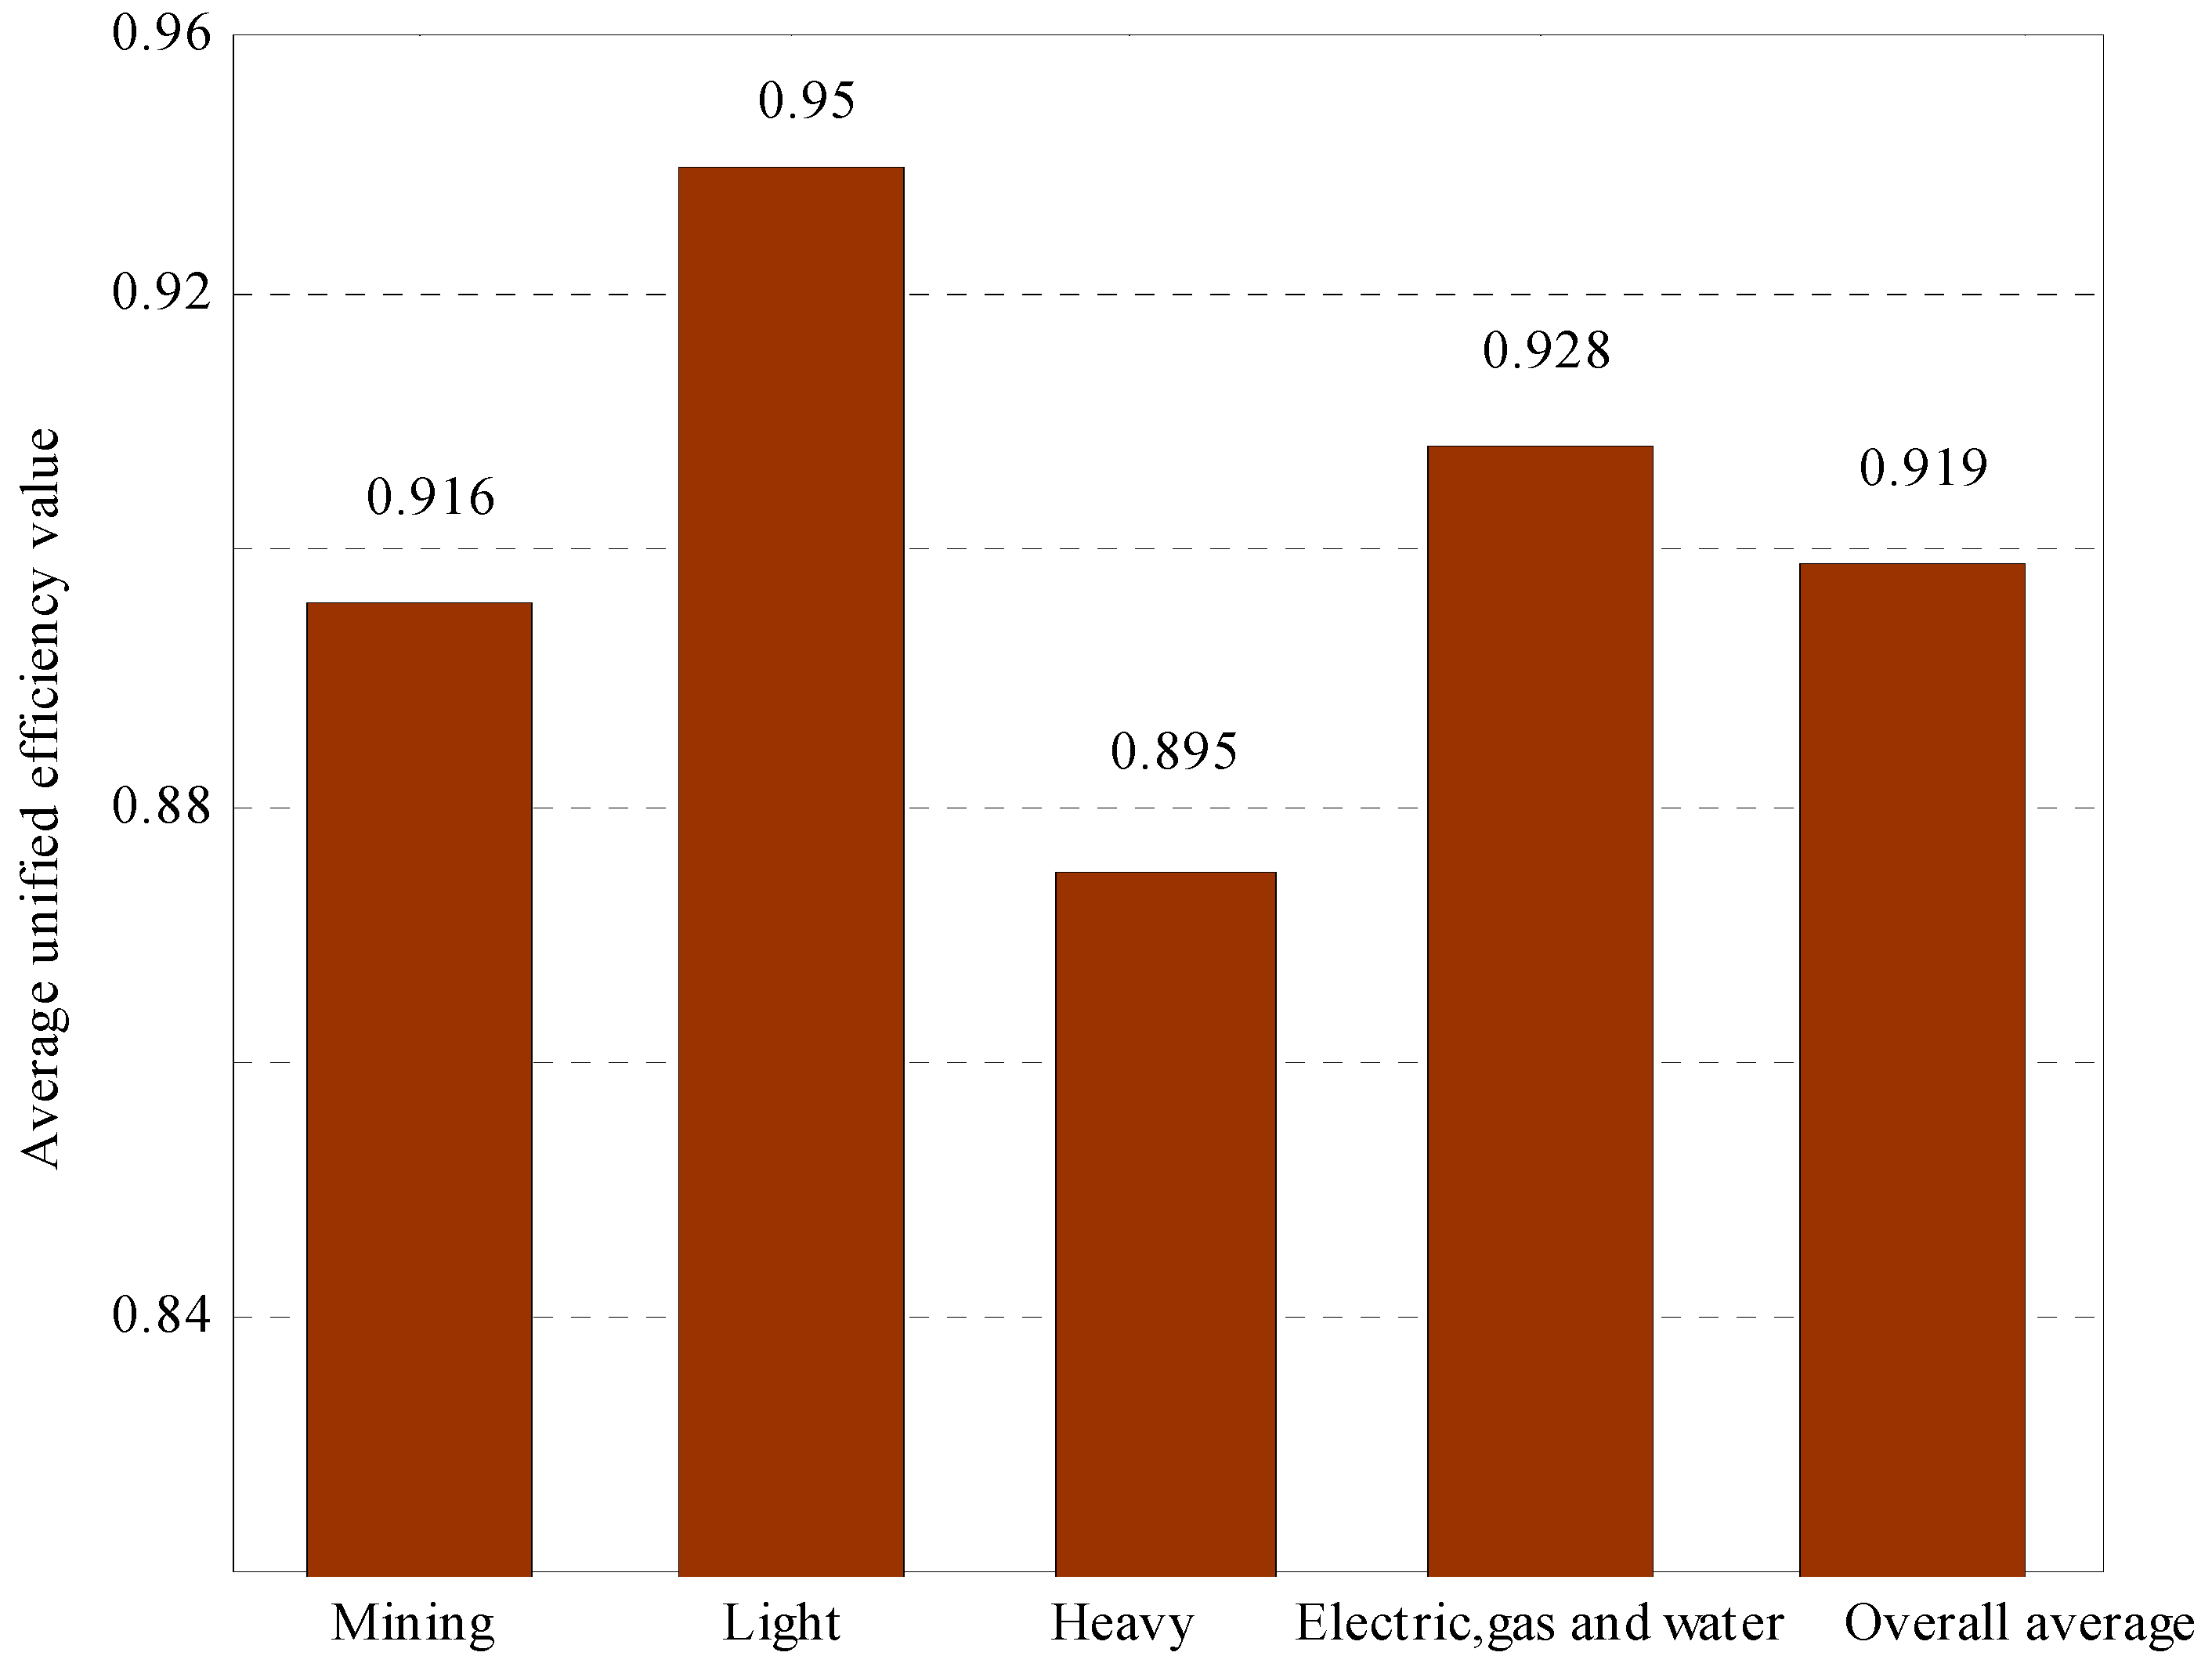
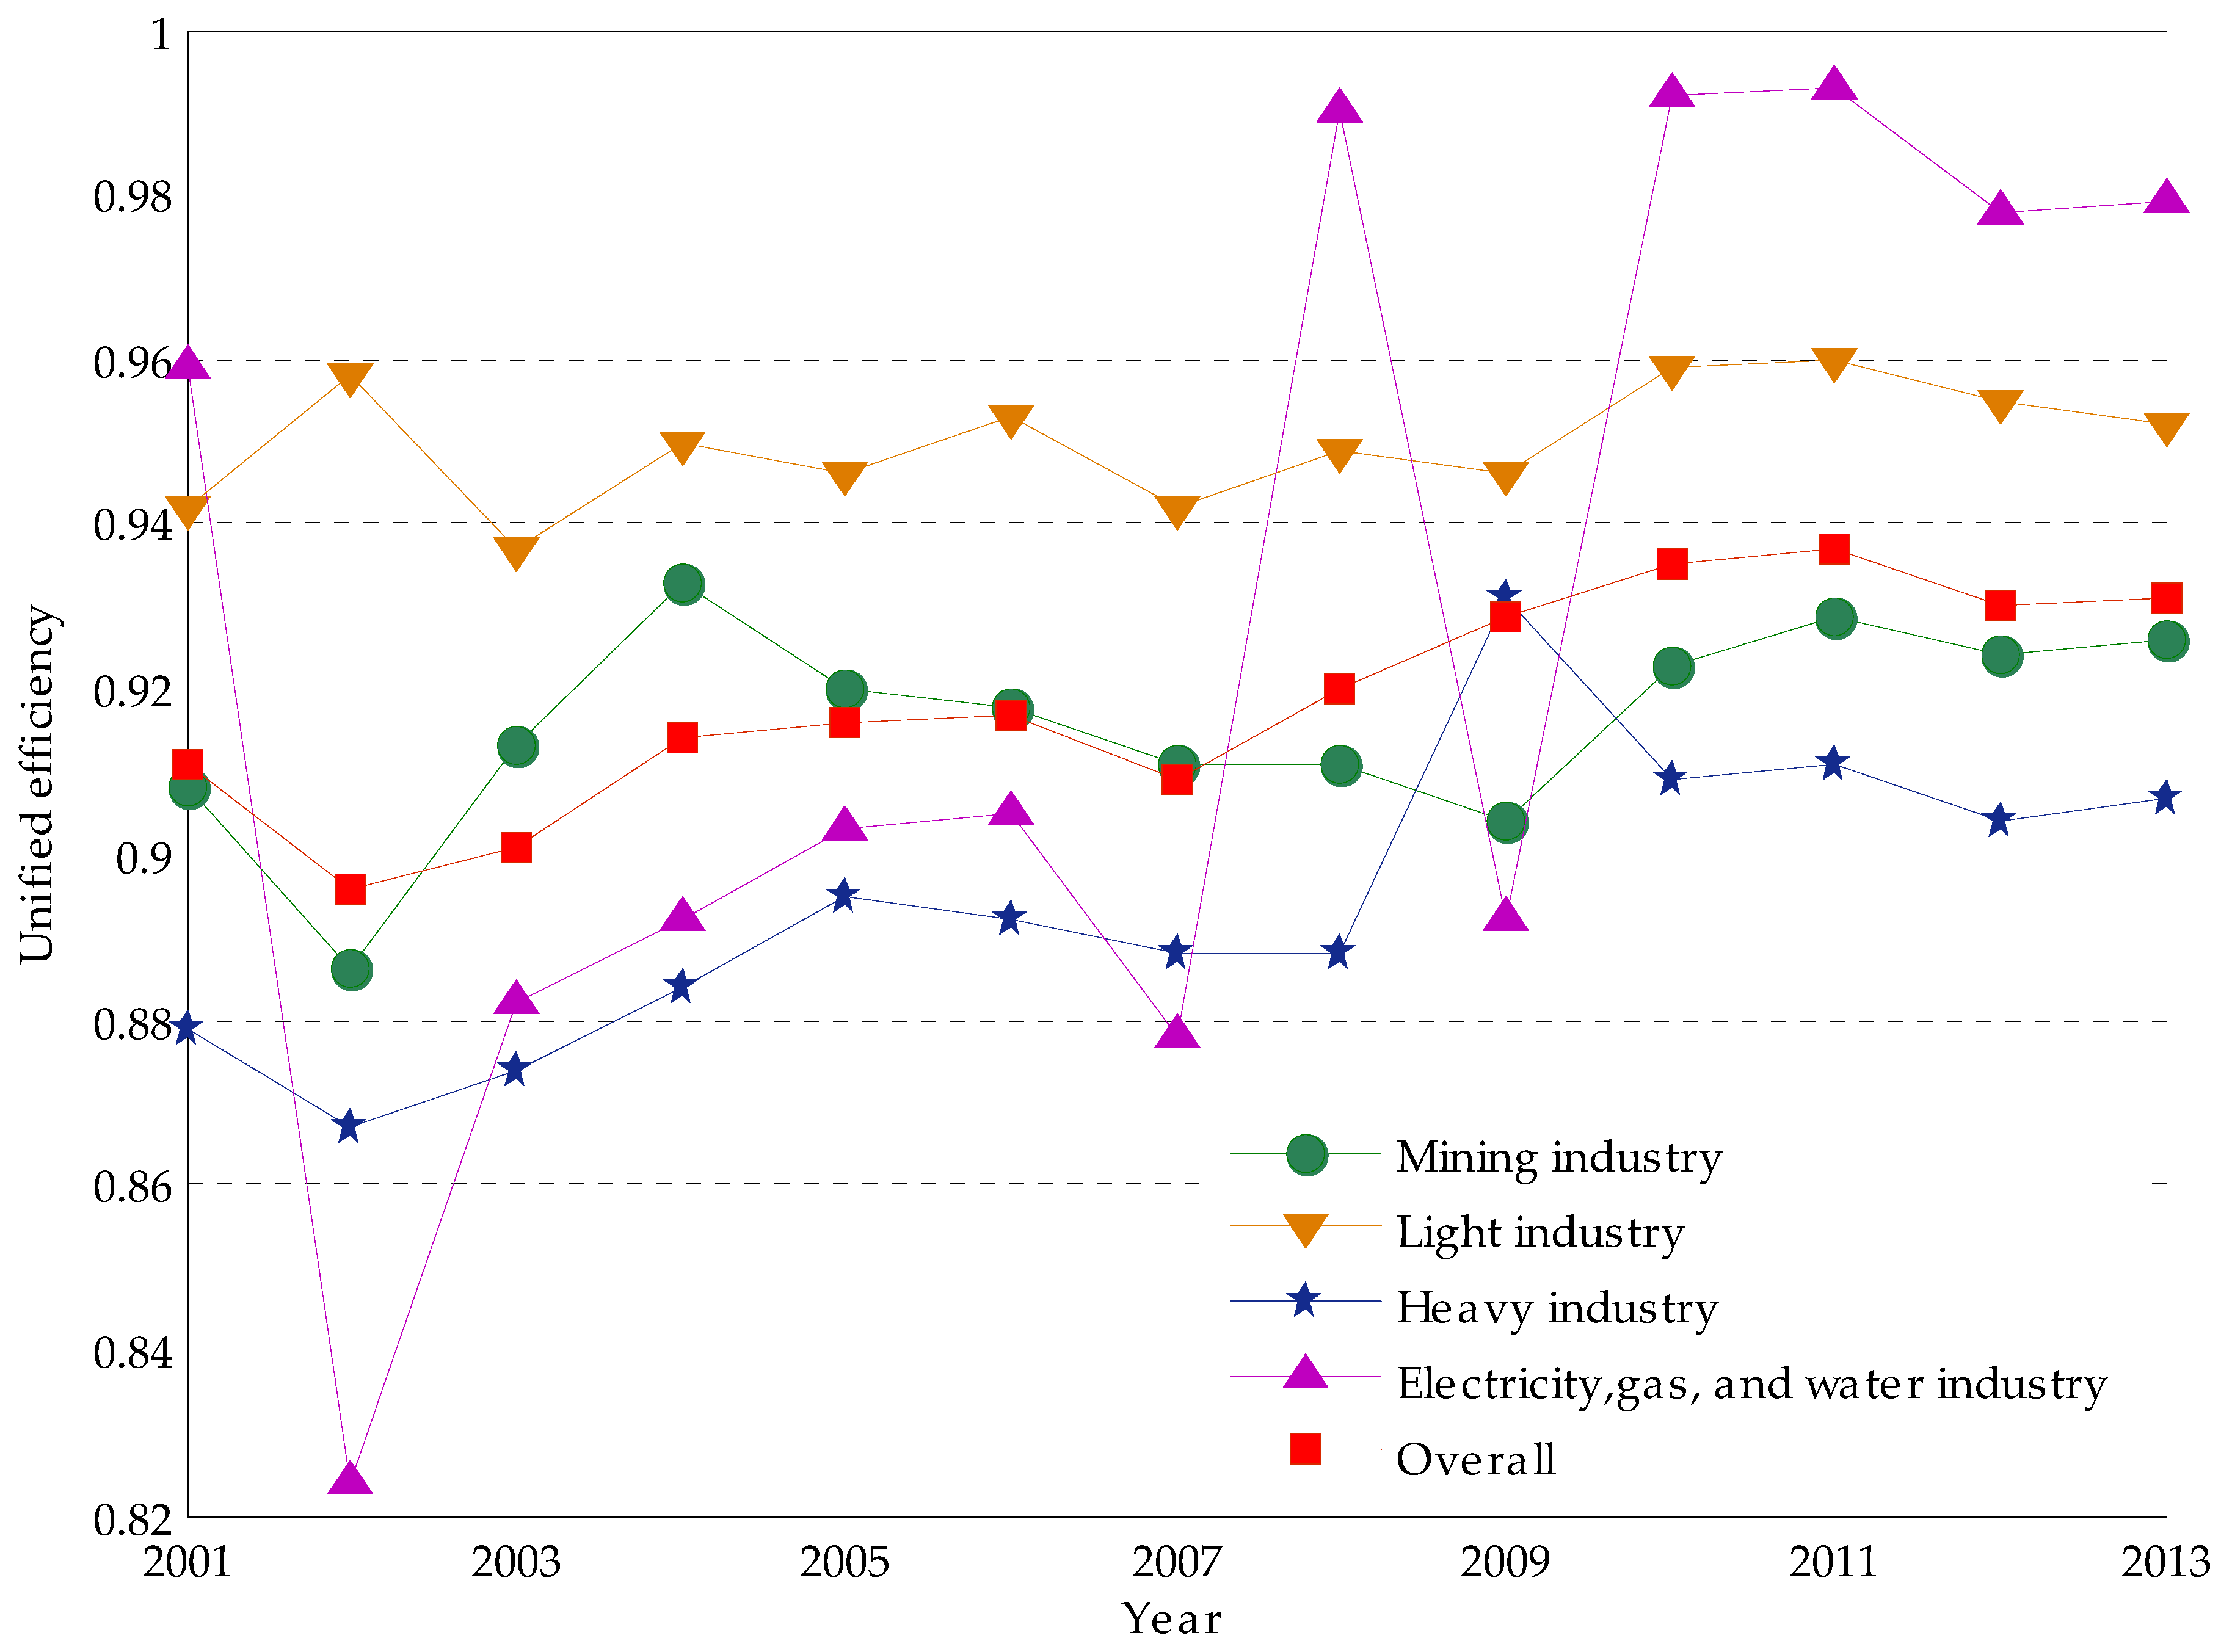
3.1. Low-Carbon Economy Efficiencies of the Four Major Industrial Categories and Their Trends

Figure 2 illustrates the evolving trends, the average unified efficiency values of the Chinese industry, and the four categories that experienced a marked increase in the study period. The mining and the light industries grew at a stable rate in terms of efficiency and maintained an upward trend for the overall performance. The efficiency of the heavy industry fluctuated acutely in 2008–2010 and maintained a slight fluctuation since then. The efficiency of the electricity, gas, and water supply industry fluctuated dramatically, and showed a drastic drop to the lowest value in 2002 at approximately 0.82 and increased sharply in 2007 and 2009 with the main peak at approximately 0.99 in 2008 and 2010. This industry also improved the most among the four major categories. The efficiency of the electricity, gas, and water supply industry was obviously lower than the light industry in 2002–2010, but the growth rate of the former was faster than that of the latter; thus, it outperformed the light industry after 2010 and has demonstrated stability since then.

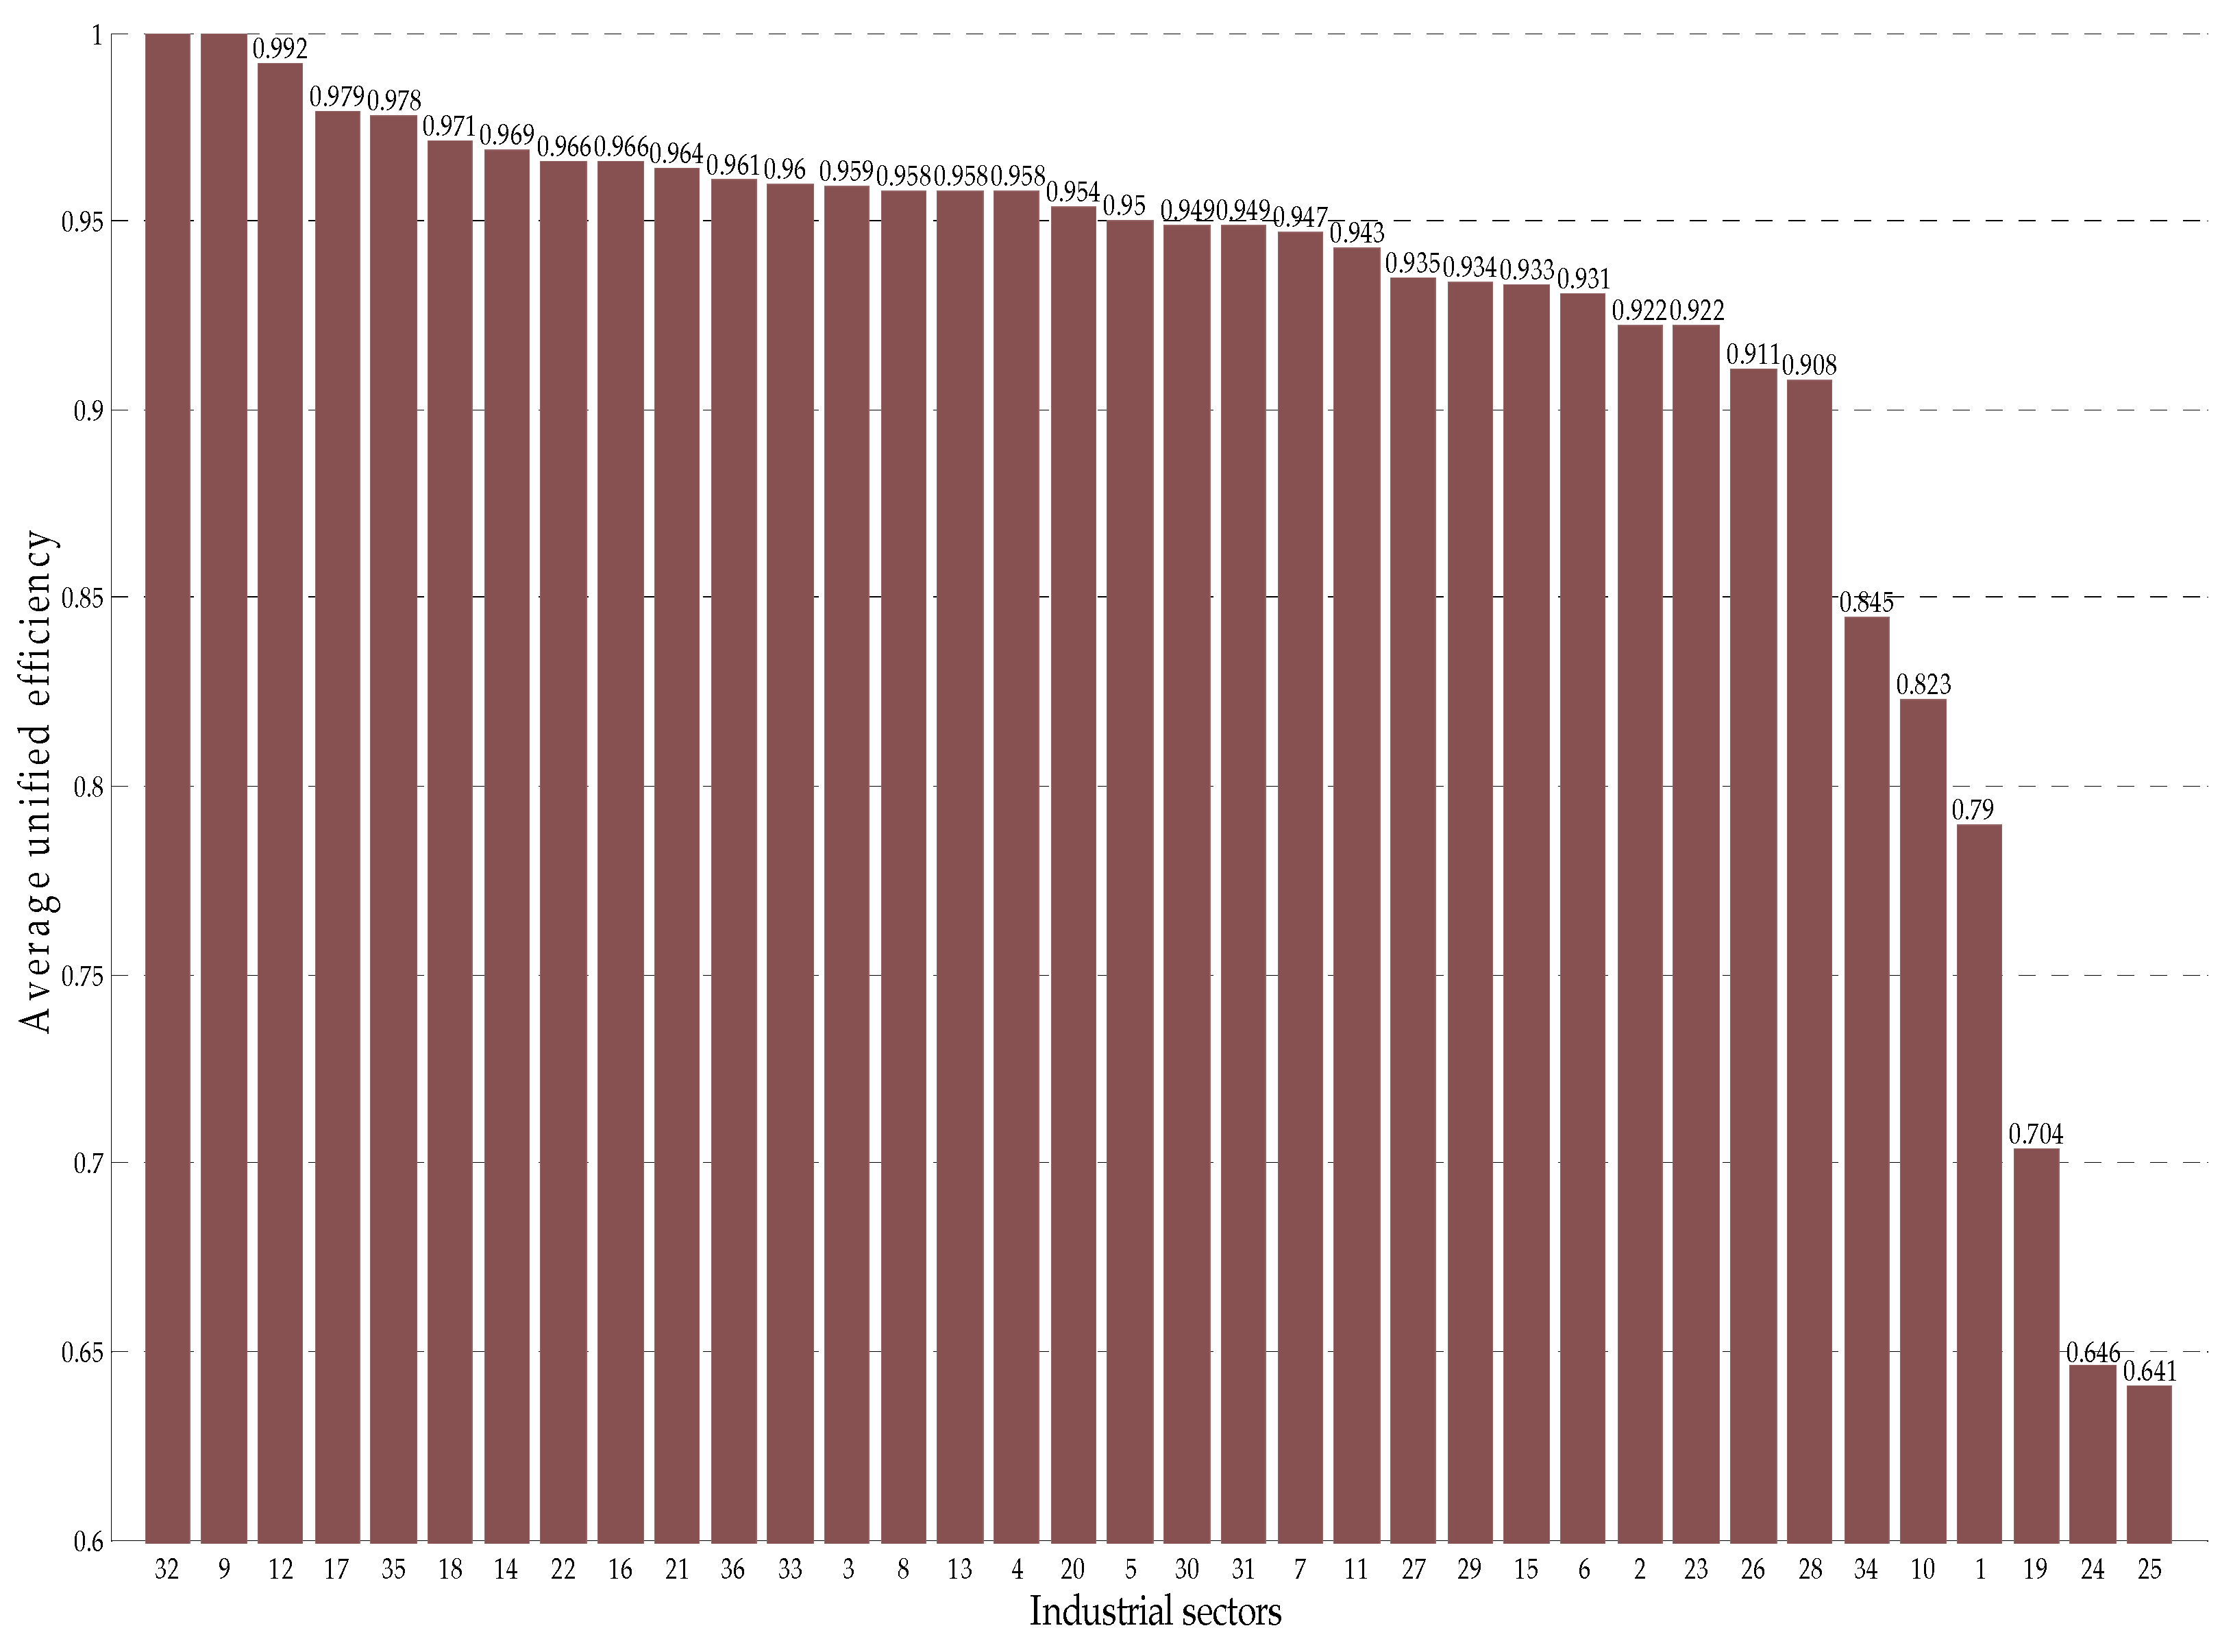
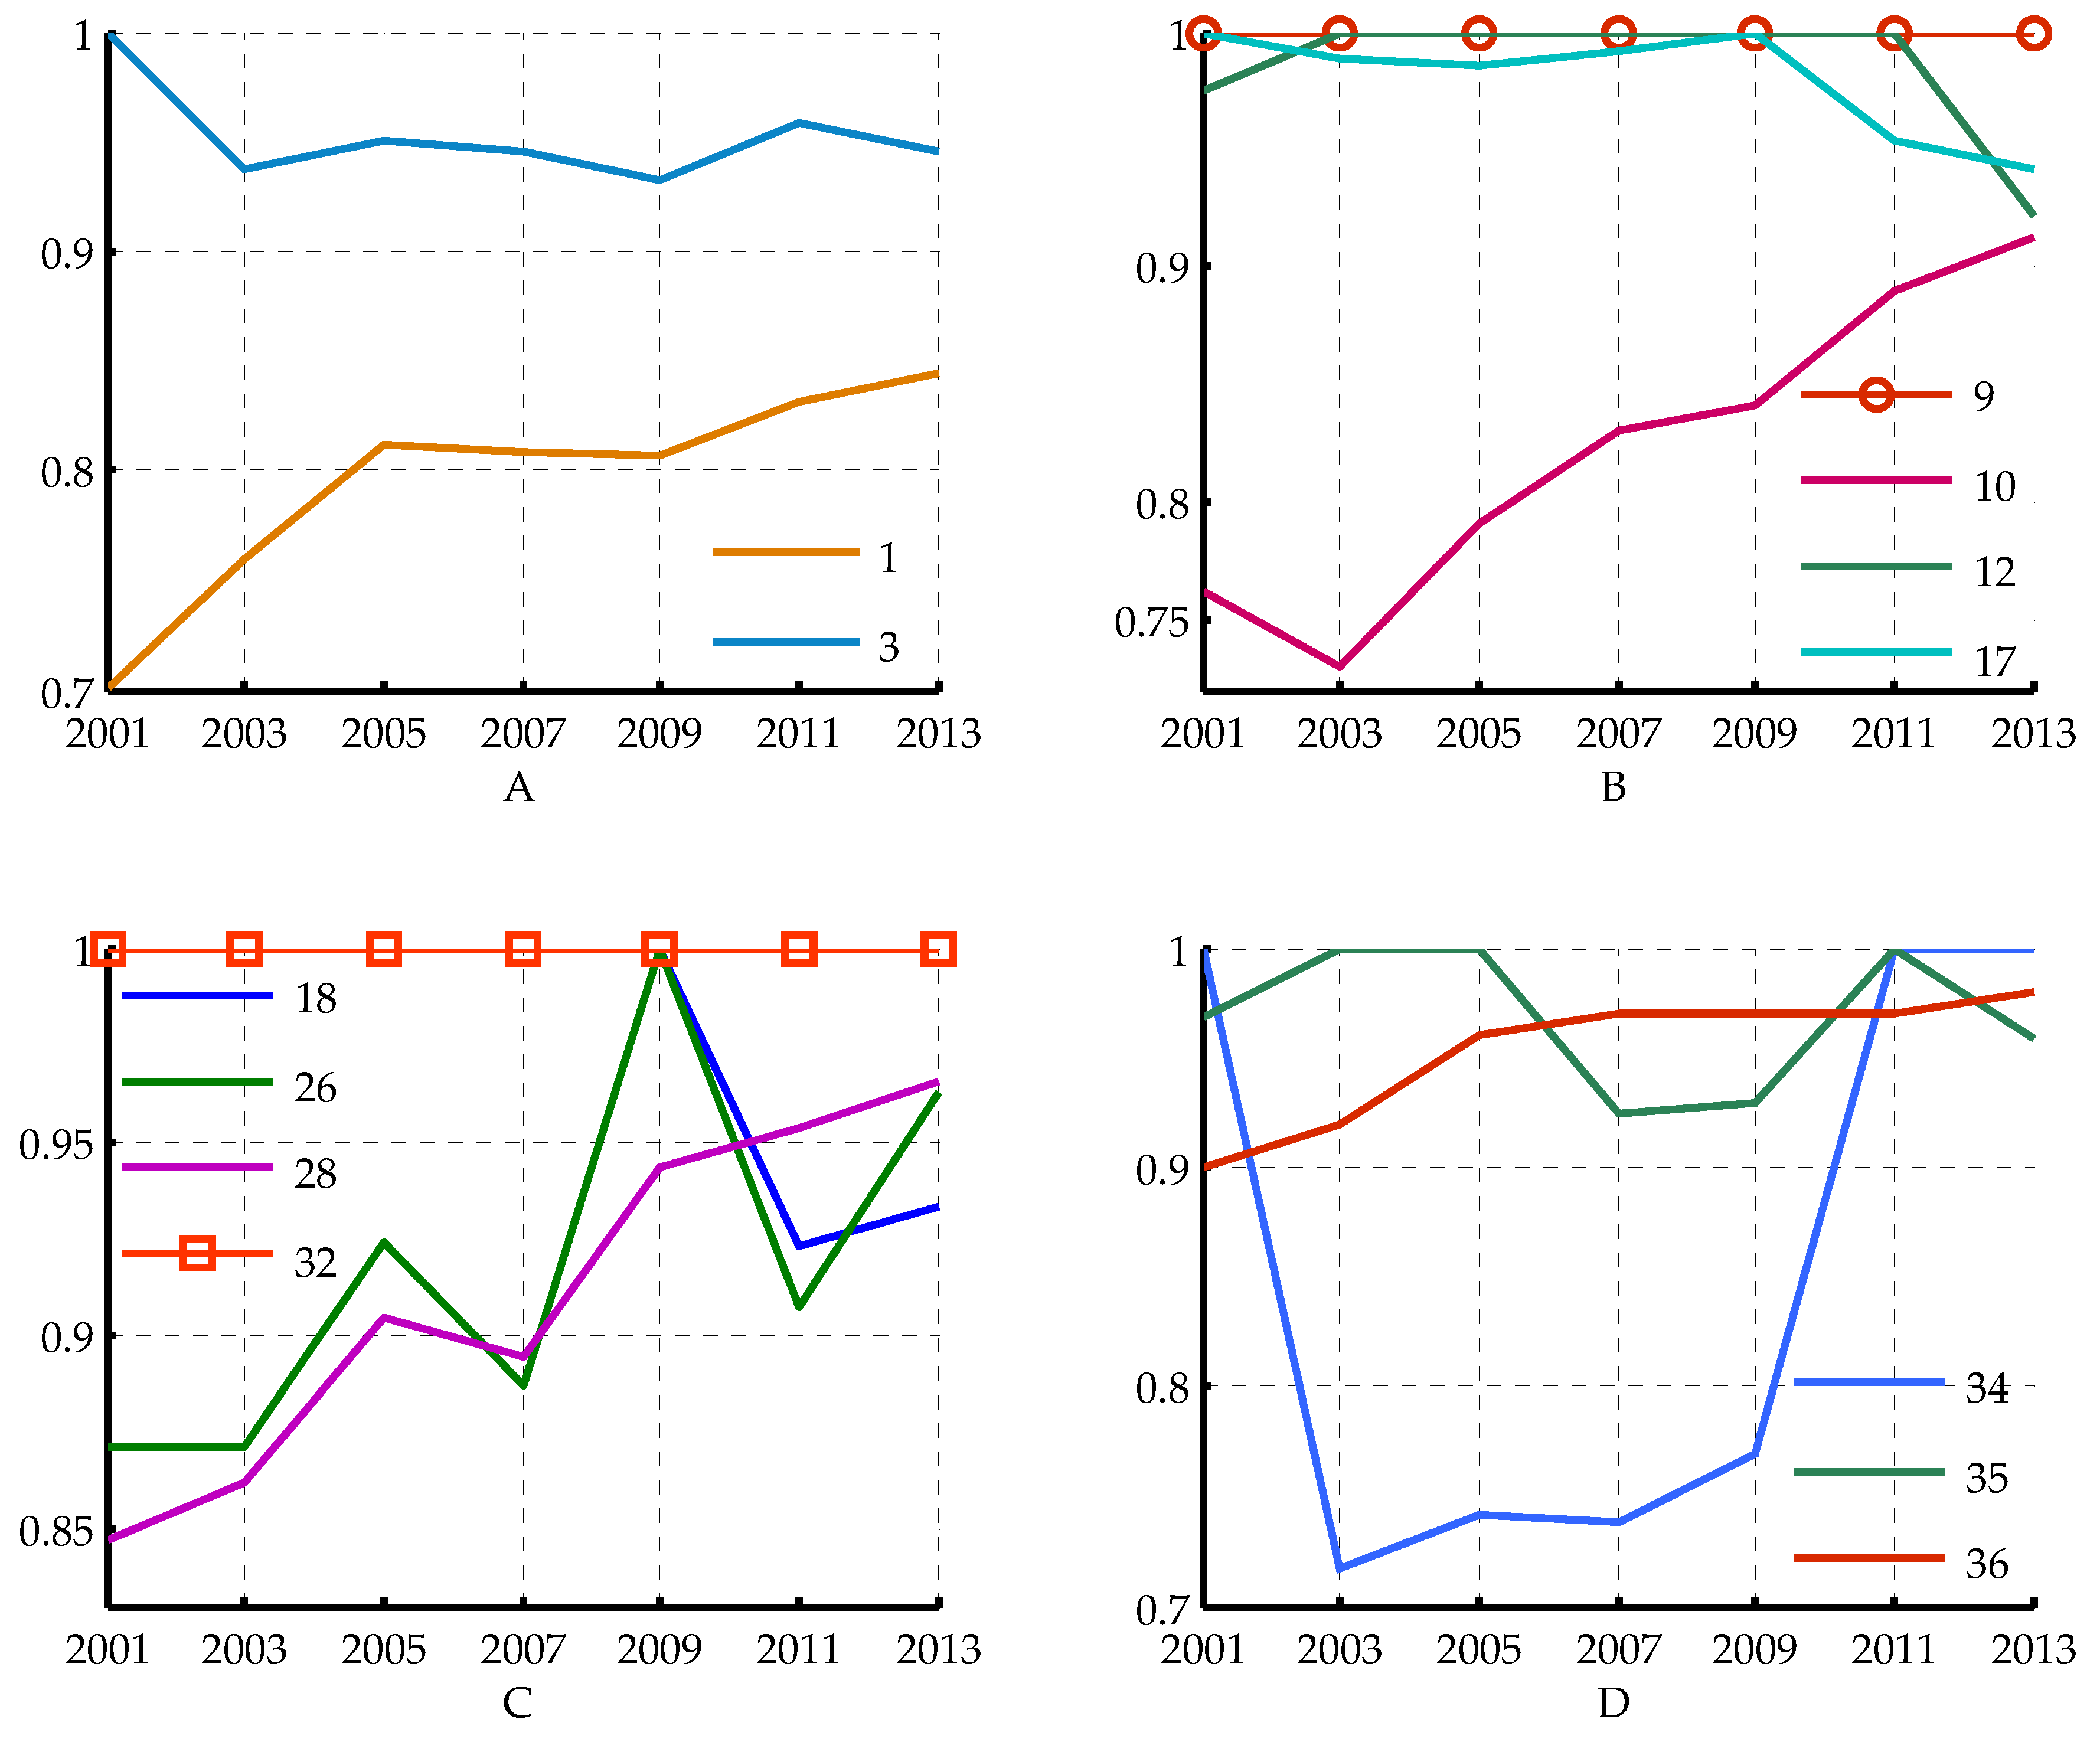
3.2. Efficiency Characteristics of Industrial Sectors

The average low-carbon economy efficiency values of the different categories vary considerably as illustrated in Figure 3. The light industry has the highest unified efficiency (0.950). The industrial sectors, such as the tobacco, fur, feather, and leather manufacturing; manufacturing of instruments and cultural and official mechanics industry, with high levels of efficiency, belong to the light industry. The electricity, gas, and water supply industry ranks second (0.928), followed by the mining industry with an average value of 0.916, which is slightly lower than the average overall efficiency. The low-carbon economy efficiency of the heavy industry (0.895) is the worst, with an approximate room of 10.5% for efficiency improvement related to the efficient frontier. The least efficient sectors, such as the manufacturing of chemical industry, manufacturing of non-metal products industry, and smelting and rolling process of non-ferrous metal industry, belong to the heavy industry. The largest low-carbon economic efficiency gap, which is between the best and the worst performing Chinese industrial categories, is approximately 0.055.
The results for the various sectors are arranged in Table 3 and are also depicted in Figure 4. The differentiation in efficiency level is apparent for the 36 major industrial sectors in China. Nearly all of these sectors show an upward trend, and only a few sectors present a downward trend. The efficiency value and the growth rate of each sector in the different years are distinguishable from each other. Additionally, Figure 4 shows that the average unified efficiencies of most of the sectors are over 0.90, and over half of these sectors surpass 0.95. However, several industrial sectors hold relatively low unified efficiency values; for example, the unified efficiency of the textile industry is 0.823 and that of the production and supply of electricity and power industry is 0.845. The coal mining and washing and the manufacturing of chemical industries have the unified efficiencies of 0.704 and 0.790, respectively. The efficiencies of the manufacturing of non-metal product and the smelting and rolling process of non-ferrous metal industries are 0.646 and 0.64, respectively, which are much lower than 0.70, suggesting that these two sectors can potentially improve by no less than 35%.
Two sectors (Figure 5B,C), namely, the tobacco and the manufacturing of communication device and computer industries, exhibited the best efficiency performances and showed no variation over the entire period. The leather, fur, and feather manufacturing industry and the oil processing, coking, and nuclear fuel processing industry (Figure 5B,C) were often at the efficient frontier, except in certain years. The efficiencies of the textile industry and the smelting and rolling process of ferrous metal and manufacturing of ordinary machinery industry improved significantly over time (Figure 5B,C) but were still far from the efficient frontier. The ferrous metal mining, the furniture manufacturing, and the manufacturing of transportation and equipment industries (Figure 5A,C) experienced a decline in the study period, which suggests non-performance in an efficient way. The efficiency of production and supply in the electricity and power industry (Figure 5D) fluctuated acutely and showed a dynamic change, which first rose and then dropped, exhibiting a U-type curve. Furthermore, the unified efficiencies of most of the industrial sectors, such as the coal mining and washing, manufacturing of ordinary machinery, and water production and supply industries, continuously increased in the study period, and positive changes occurred.

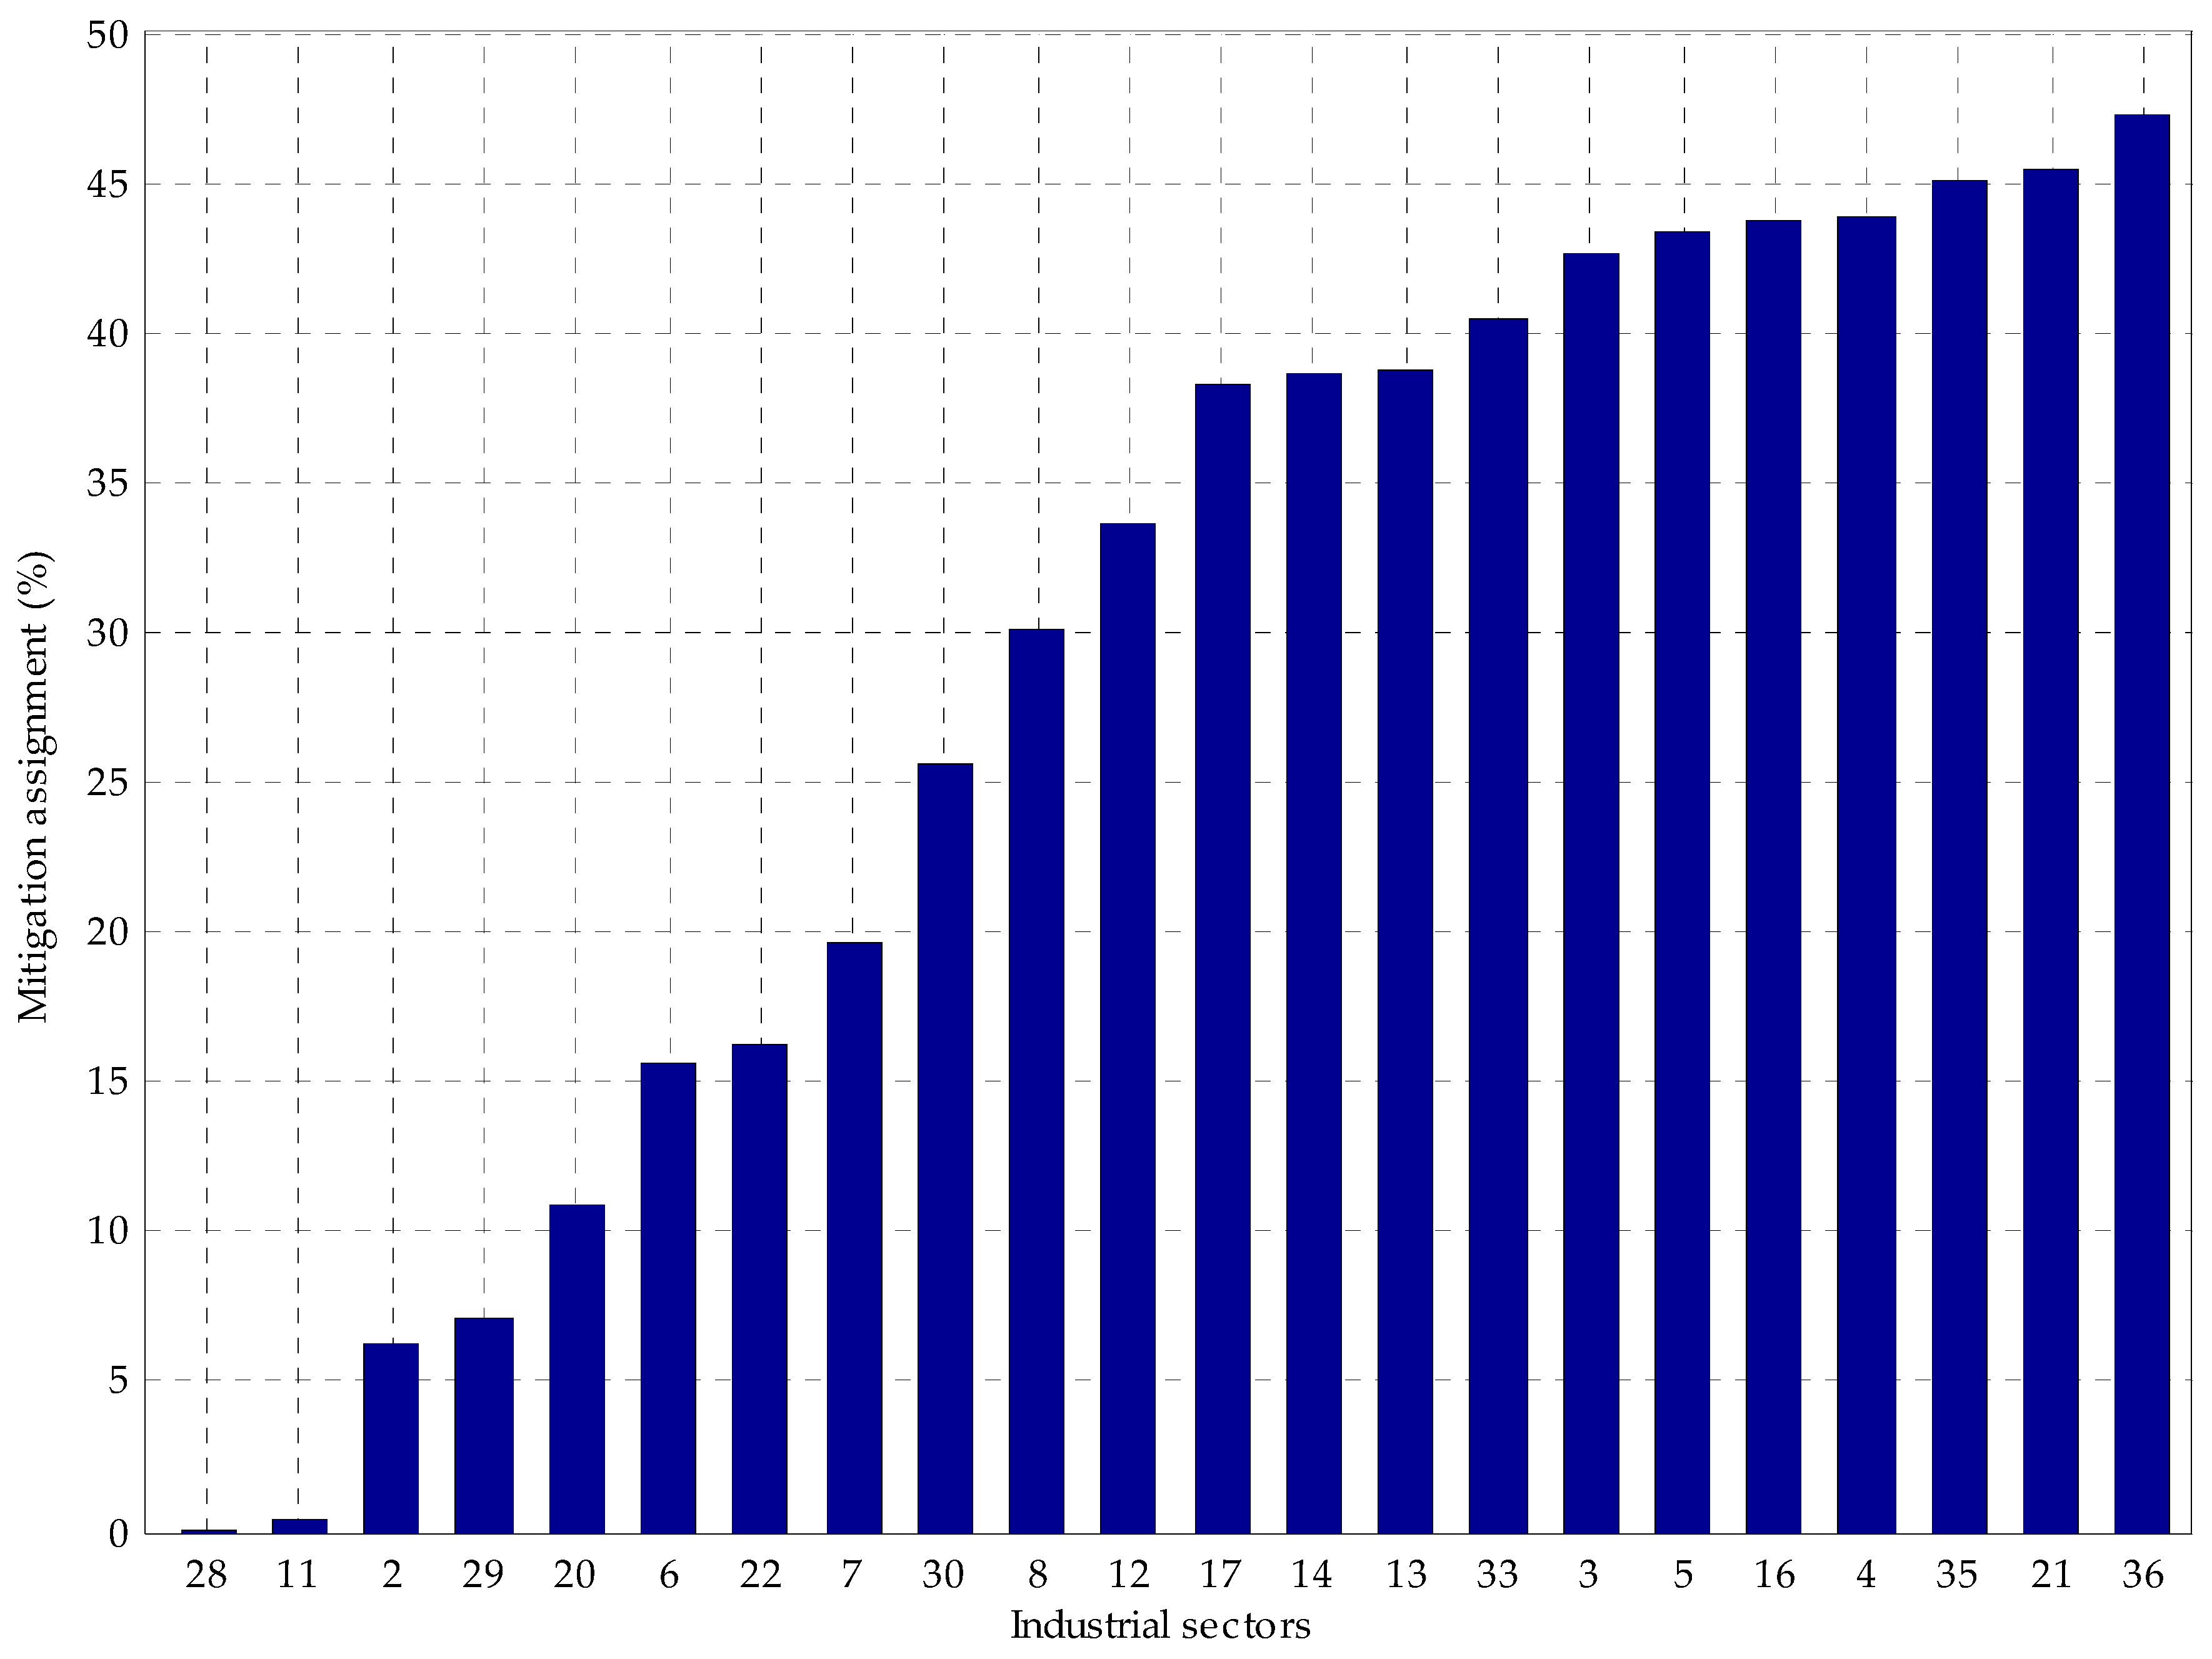
3.3. Assignment of CO2 Emission Intensity Mitigation Target

The allocation of CO2 emission intensity mitigation targets for the 36 industrial sectors in 2013 is illustrated and compared in Figure 6 and Table 4, respectively. The tobacco industry, the manufacturing of communication device, computers, and other electronic equipment industry, and the production and supply of electricity and power industry were efficient in 2013 and lay on the efficient frontier. Their environmental and economic inefficiencies are zero (Table 4), indicating that no room for improvement is observed. Thus, these sectors appear to have zero ratio for CO2 emission intensity mitigation. In addition, the coal mining and washing industry, the textile industry, the papermaking and paper products industry, the oil processing, coking, and nuclear fuel processing industry, the manufacturing of chemical industry, and six other sectors also have 0% CO2 emission intensity mitigation targets. At least one of their economic or environmental inefficiencies is zero or near zero. Thus, limitations of potential space exist for increasing output or reducing CO2 emission, resulting in CO2 emission intensity mitigation targets of zero. In Equations (4) and (5), the economic and environmental inefficiencies have a positive correlation with their slack variables. Accordingly, the desirable and undesirable output slack variables of a sector are equivalent to the mitigation target allocated. In Figure 6, the emission intensity mitigation spaces of the oil and natural gas mining industry, the textile, clothes, shoes, and hat manufacturing industry, the manufacturing of ordinary machinery industry, and the manufacturing of special equipment industry are relatively small, which are less than 10%. The proportions of reducible CO2 emission intensity of the beverage manufacturing industry, the leather, fur, and feather manufacturing industry, the furniture manufacturing industry, and six other sectors are between 20%–40%; these sectors belong to the light industry or are the equipment manufacturing industries. Furthermore, the ferrous metal mining industry, the non-metal mining industry, and three other sectors can reduce the CO2 emission intensity by 40%–45% (close to the 40%–45% goal). Among these five sectors, the ferrous metal mining industry, the non-ferrous metal mining industry, and the non-metal mining industry are from the mining industry category; the press and intermediary replication industry is from the light industry; and the manufacturing of instruments, cultural, and official mechanics industry is from the heavy industry. The top three sectors with high allocations of CO2 emission intensity mitigation from the highest to the lowest are the water production and supply industry, the manufacturing of chemical fiber industry, and the gas production and supply industry (47.28%, 45.47%, and 45.1%, respectively). A large allocation means a large reduction potential. Notably, these sectors with high allocation of emission intensity mitigation are generally efficient according to the comparison of Figure 4 and Figure 6.

4. Discussion

4.1. General Analysis of the Low-Carbon Economy Efficiency

Overall, the low-carbon economy efficiencies of the four industrial categories improved over the whole study period. The efficiencies of the four categories somewhat differed. The light industry showed a better low-carbon economic performance than the three other sectors, indicating that the industrial category depends minimally on resources and develops intensively. Meanwhile, the technology and equipment of the light industry are close to world leading standards. The efficiencies of electricity, gas, and water supply industry was generally higher than that of the mining industry. The mining industry is reliant on high CO2 emissions, and thus depends on technology breakthroughs, such as clean coal technologies to mitigate pollution. Furthermore, supporting its sustainable development is crucial. The heavy industry was the least efficient. It is energy intensive, has an extensive development mode, and lags in terms of technology equipment because the industrial efficiency is not improving.

4.2. Analysis of the Low-Carbon Economy Efficiency of the Sectors

A significant difference in the inputs and outputs of various sectors leads to the considerable difference in low-carbon economy efficiencies. The mean values of the unified efficiencies for the leather, fur, and feather manufacturing industry, the cultural, educational, and sport goods manufacturing industry, and others that exceed 0.96 are close to the efficient frontier. The unified efficiency of the coal mining and washing industry is 0.790, which means that this industry can be upgraded by at least 20% to reach the efficient frontier. The average efficiency values of the manufacturing of non-metal products industry and the smelting and rolling process of non-ferrous metal industry are less than 0.7, which is far from the efficient frontier and have an enormous potential for improvement. These low efficiency sectors are mainly distributed in the heavy industry, which has a serious energy wastage and heavy environment load issues. The growth rate of the low-carbon economy efficiencies of the oil processing, coking, and nuclear fuels processing industry, the manufacturing of plastics industry, and the manufacturing of non-metal product industry are negative compared with the other sectors that play a more prominent role in the efforts of China toward efficiency improvement.
The low-carbon economy efficiencies of the tobacco, the communications equipment, computers, and other electronic equipment manufacturing, and the production and supply of water industries are high. These industries generally have lower energy consumption and release less pollution, thus attaining high unified efficiencies. However, the insufficient use of labor, capital, and limited scale structure leads to the poor efficiency performance of chemical raw materials, the chemical product manufacturing industry, and several other industries. Moreover, the coal mining and washing and the ferrous metal smelting and rolling processing industries also show relatively low unified efficiencies. Notably, these sectors are capital-intensive and consumes excessive energy. By contrast, the oil and gas industry is characterized by scarce labor input and shortage of resources, but acquires a high efficiency. This case indicates that the oil and gas industry has serious problems in terms of management mechanism, such as insufficient structure, causing dysfunctions among human resources and restricting the development of the industry. Therefore, the execution of stringent controls to expedite the improvement of management and the optimization of resource allocation is a practical way of improving the efficiency.

4.3. Assignment Analysis of the CO2 Emission Intensity Mitigation Targets

The results for each sector identified above are closely linked with the improvement potential measured because the approach for the emission intensity mitigation target assignment measures the variable specifics according to the improvement potential associated with industrial outputs and CO2 emissions.
The manufacturing of communication devices, computers, and other electronics and production industry and the production and supply of electricity and power industry lie on the efficient frontier. Minimal possibilities to attain further improvement in the current investment and technology level exist in these industries. Thus, upgrading the industrial structure and accelerating the technology progress are the inevitable options for further reduction. The manufacturing of the chemical fiber industry and the gas production and supply industry with high economic and CO2 emissions inefficiency characteristics have relatively high emission intensity mitigation targets, indicating significant room for CO2 emissions reduction and GDP increase. Accordingly, these industries are the key sectors in pollutant reduction. The water production and supply industry have a strenuous task and has the biggest CO2 intensity reduction potential at approximately 47.28%, indicating that the industry will have the largest contribution in terms of energy sources conservation and pollution reduction.

5. Conclusions

This study investigates the low-carbon economy efficiencies of the industrial sectors in China using the RAM model, which accounts for the desirable and undesirable outputs in the production process and measures the CO2 emission intensity mitigation targets of 36 industrial sectors in the period of 2001–2013, providing a reasonable perspective for objectively evaluating the industry emission performance. The main conclusions of this study are as follows.
The average unified efficiencies of the Chinese industrial sectors exhibit an increasing trend over the study period. However, the efficiency of the entire industry is not optimistic (which is an average of 0.919) and demands further improvement. Comparative disparities exist among the industrial categories, and the order in a descending efficiency is: light industry; mining industry; electricity, gas, and water supply industry; and heavy industry. Furthermore, a marked difference is observed in the efficiencies of the sub-industries of these sectors. No sector has reached complete efficiency, except the tobacco manufacturing and the manufacturing of communication devices, computers, and other electronics industries throughout the period. Therefore, most of the industry sectors in China still have areas for improvement in terms of efficiency. For example, the smelting and rolling process of the non-ferrous metal industry has the lowest efficiency (0.641), which is far from ideal.
Furthermore, the target distributions are differentiated by the different sectors because great disparities exist in the output increase potentials and CO2 emission mitigations of the sectors. In the distribution of CO2 emission intensity mitigation targets, the electricity, gas, and water supply and the mining industries have higher ratios than the light and the heavy industries in the overall level and the number of sectors. The former two sectors include most of the sectors with reduction ratios above 40%. Thus, these sectors are faced with the pressure and challenge of assuming responsibility for emission reductions.
To achieve sustainable economic, resource, and environmental development, the Chinese government should exert efforts in promoting optimization and industrial structure upgrade to control energy consumption and shut down enterprises with high pollution emissions and energy consumption. In addition, the Chinese government should aim to veer away from the crude and quantitative mode of economic growth and enhance efficiencies to catch up with industries in the efficiency frontier. The emission reduction policies should be diverse and flexible and should consider the condition of the specific industrial sectors and categories. The industry should acquire advanced management experience, expand investments in labor and capital resources, and strengthen the exchanges in low-carbon technologies among sectors.

Acknowledgments

This study was supported by the National Natural Science Foundation of China (NSFC) (Grant Nos. 71471061 and 71201057).

Author Contributions

Ming Meng contributed to the concept and design of this article. Yanan Fu wrote the paper. Tianyu Wang reviewed the whole paper. Kaiqiang Jing provided some useful advice.

Conflicts of Interest

The authors declare no conflict of interest.

References

  1. International Enegy Agency. Statistic, Statistic Search. Available online: http://www.iea.org/statistics/statisticssearch/ (accessed on 23 October 2016).
  2. World Bank. Data. Available online: http://data.worldbank.org/indicator/NY.GDP.MKTP.CD?locations=CN (accessed on 23 October 2016).
  3. Xie, B.C.; Shang, L.F.; Yang, S.B.; Yi, B.-W. Dynamic environmental efficiency evaluation of electric power industries: Evidence from OECD (Organization for Economic Cooperation and Development) and BRIC (Brazil, Russia, India and China) countries. Energy 2014, 74, 147–157. [Google Scholar] [CrossRef]
  4. Cherniwchan, J. Economic growth, industrialization, and the environment. Resour. Energy Econ. 2012, 34, 442–467. [Google Scholar] [CrossRef]
  5. Yang, Q.; Wan, X.; Ma, H. Assessing green development efficiency of municipalities and provinces in China integrating models of super-efficiency DEA and malmquist index. Sustainability 2015, 7, 4492–4510. [Google Scholar] [CrossRef]
  6. Wang, K.; Yu, S.; Zhang, W. China’s regional energy and environmental efficiency: A DEA window analysis based dynamic evaluation. Math. Comput. Model. 2011, 58, 1117–1127. [Google Scholar] [CrossRef]
  7. Bian, Y.; He, P.; Xu, H. Estimation of potential energy saving and carbon dioxide emission reduction in China based on an extended non-radial DEA approach. Energy Policy 2013, 63, 962–971. [Google Scholar] [CrossRef]
  8. National Bureau of Statistics of the People’s Republic of China. China Statistical Yearbook. Available online: http://www.stats.gov.cn/tjsj/ndsj/ (accessed on 23 October 2016). (In Chinese)
  9. BP. Energy Economics. Available online: http://www.bp.com/en/global/corporate/energy-economics/statistical-review-of-world-energy/co2-emissions.html (accessed on 23 October 2016).
  10. Zhou, D.; Zhao, X. Industrial performance of the renewable resources industry in China. Sustainability 2015, 7, 11777–11798. [Google Scholar] [CrossRef]
  11. Wang, Q.; Zhou, P.; Zhao, Z.; Shen, N. Energy efficiency and energy saving potential in China: A directional meta-frontier DEA approach. Sustainability 2014, 6, 5476–5492. [Google Scholar] [CrossRef]
  12. Dyckhoff, H.; Allen, K. Measuring1 ecological efficiency with data envelopment analysis (DEA). Eur. J. Oper. Res. 2001, 132, 312–325. [Google Scholar] [CrossRef]
  13. Li, G.; Huang, D.; Li, Y. China’s input-output efficiency of water-energy-food nexus based on the Data Envelopment Analysis (DEA) model. Sustainability 2016, 8, 927. [Google Scholar] [CrossRef]
  14. Yan, Q.Y.; Jie, T. Biomass power generation industry efficiency evaluation, in China. Sustainability 2014, 6, 8720–8735. [Google Scholar] [CrossRef]
  15. Liu, J.S.; Lu, L.Y.; Lu, W.M.; Lin, B.J.Y. Data envelopment analysis 1978–2010: A citation-based literature survey. Omega 2013, 41, 3–15. [Google Scholar] [CrossRef]
  16. Lin, W.; Chen, B.; Xie, L.; Pan, H. Estimating energy consumption of transport modes in China using DEA. Sustainability 2015, 7, 4225–4239. [Google Scholar] [CrossRef]
  17. Wu, J.; An, Q.; Yao, X.; Wang, B. Environmental efficiency evaluation of industry in China based on a new fixed sum undesirable output data envelopment analysis. J. Clean. Prod. 2014, 74, 96–104. [Google Scholar] [CrossRef]
  18. Zhou, G.; Chung, W.; Zhang, Y. Measuring energy efficiency performance of China’s transport sector: A data envelopment analysis approach. Expert. Syst. Appl. 2014, 41, 709–722. [Google Scholar] [CrossRef]
  19. Wu, F.; Fan, L.W.; Zhou, P.; Zhou, D.Q. Industrial energy efficiency with CO2 emissions in China: A nonparametric analysis. Energy Policy 2012, 49, 164–172. [Google Scholar] [CrossRef]
  20. Wang, K.; Wei, Y.M. China’s regional industrial energy efficiency and carbon emissions abatement costs. Appl. Energy 2014, 130, 617–631. [Google Scholar] [CrossRef]
  21. Li, H.; Shi, J.F. Energy efficiency analysis on Chinese industrial sectors: An improved Super-SBM model with undesirable outputs. J. Clean. Prod. 2014, 65, 97–107. [Google Scholar] [CrossRef]
  22. Zhang, Y.J.; Hao, J.F.; Song, J. The CO2, emission efficiency, reduction potential and spatial clustering in China’s industry: Evidence from the regional level. Appl. Energy 2016, 174, 213–223. [Google Scholar] [CrossRef]
  23. Sueyoshi, T.; Goto, M. DEA approach for unified efficiency measurement: Assessment of Japanese fossil fuel power generation. Energy Econ. 2011, 33, 292–303. [Google Scholar] [CrossRef]
  24. Baležentis, T.; Li, T.; Streimikiene, D.; Baležentis, A. Is the Lithuanian economy approaching the goals of sustainable energy and climate change mitigation? Evidence from DEA-based environmental performance index. J. Clean. Prod. 2016, 116, 23–31. [Google Scholar] [CrossRef]
  25. Zhang, J.; Zeng, W.; Wang, J.; Yang, F.; Jiang, H. Regional low-carbon economy efficiency in China: Analysis based on the Super-SBM model with CO2, emissions. J. Clean. Prod. 2015, in press. [Google Scholar] [CrossRef]
  26. Haynes, K.; Ratick, S.; Cumming, S.J. Pollution Prevention Frontiers: A Data Envelopment Simulation; University of Illinois Press: Champaign, IL, USA, 1997. [Google Scholar]
  27. Reinhard, S.; Lovell, C.A.K.; Thijssen, G.J. Environmental efficiency with multiple environmentally detrimental variables: Estimated with SFA and DEA. Eur. J. Oper. Res. 2000, 121, 287–303. [Google Scholar] [CrossRef]
  28. Hailu, A.; Veeman, T.S. Nonparametric productivity analysis with undesirable outputs: An application to the Canadian pulp and paper Industry. Am. J. Agr. Econ. 2001, 83, 605–616. [Google Scholar] [CrossRef]
  29. Scheel, H. Undesirable outputs in efficiency valuations. Eur. J. Oper. Res. 2001, 132, 400–410. [Google Scholar] [CrossRef]
  30. Maleyeff, J. Quantitative Models for Performance Evaluation and Benchmarking: DEA with Spreadsheets and DEA Excel Solver; Springer: Berlin, Germany, 2005. [Google Scholar]
  31. Zhou, Y.; Liang, D.; Xing, X. Environmental efficiency of industrial sectors in China: An improved weighted SBM model. Math. Comput. Model. 2013, 58, 990–999. [Google Scholar] [CrossRef]
  32. Seiford, L.M.; Zhu, J. Modeling undesirable factors in efficiency evaluation. Eur. J. Oper. Res. 2002, 142, 16–20. [Google Scholar] [CrossRef]
  33. Chung, Y.H.; Färe, R.; Grosskopf, S. Productivity and undesirable outputs: A directional distance function approach. J. Environ. Manag. 1997, 51, 229–240. [Google Scholar]
  34. Färe, R.; Grosskopf, S.; Pasurka, C.A. Environmental Production Functions and Environmental Directional Distance Functions: A Joint Production Comparison. Soc. Sci. Electron. Publ. 2004. [Google Scholar] [CrossRef]
  35. Boyd, G.A.; Tolley, G.; Pang, J. Plant Level Productivity, Efficiency, and Environmental Performance of the Container Glass Industry. Environ. Res. Econ. 2002, 23, 29–43. [Google Scholar] [CrossRef]
  36. Färe, R.; Grosskopf, S.; Weber, W.L. Shadow prices and pollution costs in U.S. agriculture. Ecol. Econ. 2006, 56, 89–103. [Google Scholar] [CrossRef]
  37. Watanabe, M.; Tanaka, K. Efficiency analysis of Chinese industry: A directional distance function approach. Energy Policy 2007, 35, 6323–6331. [Google Scholar] [CrossRef]
  38. Tone, K. A slacks-based measure of efficiency in data envelopment analysis. Eur. J. Oper. Res. 2001, 130, 498–509. [Google Scholar] [CrossRef]
  39. Chang, Y.T.; Zhang, N.; Danao, D.; Zhang, N. Environmental efficiency analysis of transportation system in China: A non-radial DEA approach. Energy Policy 2013, 58, 277–283. [Google Scholar] [CrossRef]
  40. Li, T.; Baležentis, T.; Makutėnienė, D.; Streimikiene, D.; Kriščiukaitienė, I. Energy-related CO2, emission in European Union agriculture: Driving forces and possibilities for reduction. Appl. Energy 2016, 180, 682–694. [Google Scholar] [CrossRef]
  41. Cooper, W.W.; Park, K.S.; Pastor, J.T. RAM: A Range Adjusted Measure of Inefficiency for Use with Additive Models, and Relations to Other Models and Measures in DEA. J. Prod. Anal. 1999, 11, 5–42. [Google Scholar] [CrossRef]
  42. Renshaw, E.F. Energy efficiency and the slump in labor productivity in the USA. Energy Econ. 1981, 3, 36–42. [Google Scholar] [CrossRef]
  43. Zhou, P.; Ang, B.W. Linear programming models for measuring economy-wide energy efficiency performance. Energy Policy 2008, 36, 291l–2916. [Google Scholar] [CrossRef]
  44. Wang, Q.; Zhou, P.; Zhou, D. Efficiency measurement with carbon dioxide emissions: The case of China. Appl. Energy 2012, 90, 161–166. [Google Scholar] [CrossRef]
  45. Eggleston, H.S.; Buendia, L.; Miwa, K.; Ngara, T.; Tanabe, K. 2006 IPCC Guidelines for National Greenhouse Gas Inventories; Institute for Global Environmental Strategies: Kanagawa, Japan, 2006. [Google Scholar]
  46. National Bureau of statistics Energy Statistics Division National Energy Bureau. China Energy Statistical Yearbook; China Statistical Publishing House: Beijing, China, 2014.
Figure 1. Visual structure of unified efficiency [19].
Sustainability 09 00451 g001
Figure 2. Efficiencies of four major industrial categories in China from 2001 to 2013.
Sustainability 09 00451 g002
Figure 3. Average unified efficiency values for the four major industrial categories in China.
Sustainability 09 00451 g003
Figure 4. Average unified efficiency values for the 36 Chinese industrial sectors in 2001–2013.
Sustainability 09 00451 g004
Figure 5. Efficiency tendency of selected Chinese industrial sectors in 2001–2013. Note: (A) is for the mining industry; (B) is for the light industry; (C) is for the heavy industry; and (D) is for the electric, gas, and water supply industry.
Sustainability 09 00451 g005
Figure 6. Industrial CO2 intensity mitigation targets for the different sectors.
Sustainability 09 00451 g006
Table 1. Names and details of 36 sub-industries.
Industry ClassificationIndustry CodeIndustry Name
Mining industry1Coal mining and washing
2Oil and natural gas mining
3Ferrous metal mining
4Non-ferrous metal mining
5Non-metal mining
Light industry6Agricultural product processing
7Food manufacturing
8Beverage manufacturing
9Tobacco manufacturing
10Textile industry
11Textile clothes, shoes, hats manufacturing
12Leather, fur, feather manufacturing
13Wood processing, wood, bamboo, cane, palm, and straw manufacturing
14Furniture manufacturing
15Papermaking and paper products
16Press and intermediary replication
17Cultural, educational, and sport goods manufacturing
Heavy industry18Oil processing, coking, and nuclear fuels processing
19Manufacturing of chemical
20Manufacturing of medicines
21Manufacturing of chemical fiber
22Manufacturing of rubber
23Manufacturing of plastics
24Manufacturing of non-metal products
25Smelting and rolling process of non-ferrous metal
26Smelting and rolling process of Ferrous metal
27Manufacturing of metal products
28Manufacturing of ordinary machinery
29Manufacturing of special equipment
30Manufacturing of transportation and equipment
31 Manufacturing of electric machines
32Manufacturing of communication device, computers and other electronic
33Manufacturing of instruments, cultural and official mechanics
Electricity, gas and water industry34Production and supply of electricity, power
35Gas production and supply
36Water production and supply
Table 2. Descriptive statistics of input and output variables, 2001–2013.
IndicatorsNon-Energy InputsEnergy InputDesirable OutputUndesirable Output
VariablesLabor (x1)Capital (x2)Energy (e)Industrial output (y)CO2 emission (u)
Unit104 person109 Yuan104 TCE109 Yuan104 Tons
Min1430,505.5659,887.774.37211.07
Max945.347.1639.1299,652.67213,291
945.34
Media134.9968.531069.774513.8814,397.85
Mean206.832153.893971.39452.204537.48
Note: Each sample has 468 observations; each panel data includes five indicators of 36 industrial sectors from 2001 to 2013. TCE = ton of standard coal equivalent.
Table 3. Unified efficiency of the 36 Chinese industrial sectors in 2001–2013.
Industry Classification2001200320052007200920112013Mean
Mining industry10.7010.7600.8110.8090.8070.8310.8440.795
20.9090.9170.9370.9380.9260.9340.9320.928
31.0000.9380.9500.9450.9320.9590.9460.953
40.9720.9840.9510.9390.9320.9590.9520.956
50.9570.9670.9510.9260.9240.9600.9550.949
Light industry60.9130.9070.9390.9030.9120.9490.9450.924
70.9480.9510.9580.9060.9340.9530.9450.942
80.9280.9360.9630.9760.9670.9730.9650.958
91.0001.0001.0001.0001.0001.0001.0001.000
100.7620.7300.7900.8310.8410.8890.9130.822
110.9300.8930.9141.0000.9430.9700.9660.945
120.9751.0001.0001.0001.0001.0000.9220.985
130.9770.9750.9490.9300.9210.9580.9510.952
141.0001.0000.9490.9280.9170.9560.9510.957
150.9020.8920.9280.9170.9460.9580.9690.930
160.9640.9740.9760.9280.9760.9630.9540.962
171.0000.9880.9850.9911.0000.9530.9420.980
Heavy industry181.0001.0001.0001.0001.0000.9230.9330.979
190.6650.6420.6880.7030.7480.7700.7790.714
200.9360.9290.9550.9660.9600.9680.9680.955
210.9300.9550.9760.9560.9600.9660.9590.957
220.9650.9750.9680.9390.9760.9810.9570.966
230.9540.9360.9400.9610.9380.9600.7900.926
240.6150.5820.6480.6990.7160.7320.5550.650
250.6010.5690.5510.5521.0000.5680.9070.678
260.8710.8710.9240.8871.0000.9070.9630.918
270.9250.9160.9310.9410.9180.9440.9450.931
280.8470.8620.9040.8940.9430.9530.9650.910
290.8810.8950.9390.9320.9540.9670.9580.932
301.0001.0000.9370.9250.9500.9710.9640.964
310.9040.8771.0000.9310.9161.0000.9210.936
321.0001.0001.0001.0001.0001.0001.0001.000
330.9750.9800.9540.9230.9230.9610.9500.952
Electricity, gas, and water industry341.0000.7170.7410.7390.7701.0001.0000.852
350.9691.0001.0000.9250.9291.0000.9580.969
360.900.920.960.970.970.970.980.953
Mean 0.9100.9010.9160.9090.9290.9360.9310.919
Table 4. Indicators for emission reduction potential.
Sector Code N E C O 2 N E G D P y p k u p k Sector Code N E C O 2 N E G D P y p k u p k
10.000.130.002800.87190.000.400.0040,267.87
20.070.16288.861886.88200.310.114569.19603.66
30.280.271083.362034.72210.330.281824.841469.73
40.300.27616.521294.26220.190.081169.721151.17
50.330.25871.18998.34230.000.380.0033,847.26
60.190.165263.331619.74240.000.440.0093,540.70
70.280.203132.64927.29250.090.354408.5719,849.17
80.320.113470.97424.20260.220.094664.171560.95
90.000.000.000.00270.180.073791.77823.33
100.000.190.004160.45280.000.000.001.98
110.000.000.0013.71290.210.075349.97239.45
120.250.172044.25377.91300.330.2624,686.972349.50
130.280.222344.53927.49310.170.198642.172049.33
140.300.211441.81163.64320.000.000.000.00
150.000.260.002771.89330.310.222897.1546.44
160.350.241577.57382.61340.000.000.000.00
170.300.20930.89230.07350.340.26724.82484.42
180.000.390.0011,328.73360.570.18462.46800.32

