
Develop Eco-Friendly Enterprise: Aligning Enablers with Strategy

1
Department of Information Management, Dayeh University, Changhua 51591, Taiwan
2
Program in Management, Dayeh University, Changhua 51591, Taiwan
3
College of Economics and Management, Nanjing University of Aeronautics and Astronautics, Nanjing 210016, China
*
Author to whom correspondence should be addressed.
Sustainability 2017, 9(4), 570; https://doi.org/10.3390/su9040570
Submission received: 26 January 2017
/
Revised: 15 March 2017
/
Accepted: 26 March 2017
/
Published: 8 April 2017
Abstract
:Environmental friendliness has been regarded as a fundamental characteristic of sustainability and competitiveness, yet such eco-friendliness is often not performed well. Based on the relationship matrix in the Quality Function Deployment (QFD) method and fuzzy logic, this paper presents an original integrated approach that, by linking competitive bases, green capabilities, and providers, aims at identifying the most appropriate providers to be implemented by companies starting from competitive characteristics. As an illustration, an international electronics-related manufacturing firm’s eco-friendliness developing project is cited which provides evidence of a robust method that can improve the eco-friendliness of an enterprise and enhance competitive advantage. The approach allows for avoiding the risk of misalignments between green providers and competition requirements for practitioners that seek to implement green supply chain management systems.
1. Introduction
Anthropogenic climate disruption has become a pivotal constraining factor of socioeconomic development in the twenty-first century [1,2]. Traditional industries have created wealth and contribute to the progress of civilization, but have generated calamities for humans, such as the depletion of resources, environmental pollution, and ecological imbalances. Thus, preventive approaches need to be adopted in order to protect environmental damages. Environmental concerns from consumers, governments, and academics have encouraged businesses to introduce environmentally friendly practices that are able to mitigate negative impacts on the environment, (e.g., green management, green marketing, green production, green innovation [3]). In fact, firms have long recognized that being competitive depends on their internal operations as well as the entire supply chain [4,5]. Thus, the management of supply chain is the key to business sustainability.
Green Supply Chain Management (GSCM) is a modern approach that balances environmental impact and resource efficiency and transcends firms’ boundaries [6]. The theoretical foundation of GSCM is based on the theory of green design, manufacturing, and supply chain management technology. The aims of GSCM are to minimize negative environmental impact and to maximize resource efficiency throughout the manufacturing process, which consists of acquisitions of raw materials, processing, packing, transportation, and waste disposal alternatives (e.g., recycling). The GSCM process has become a role model in developing eco-friendly enterprises and serves as a cornerstone of guiding businesses to meet tighter environmental regulations [7].
Adopting GSCM approaches has several advantages for businesses. Developing new markets, minimizing production waste, increasing productivity, enhancing corporate reputation, improving long-term profitability, and raising corporate competitiveness in line with the trend of environmental consciousness are all possible benefits of employing GSCM [8]. Environmental management is considered an ideal strategy for a firm to position itself as an environmentally friendly business under the rising trend of tougher environmental regulations such as the Restriction of Hazardous Substances and Waste Electronics and Electrical Equipment [4].
The concept of the green supply chain was first proposed by the Manufacturing Research Association at Michigan State University in 1996 [9]. Recently, the green supply chain has drawn academics’ interests. Many studies have been conducted and the foci of the GSCM were on the concept and connotations of the green supply chain, the design and structure of GSCM [10], the environment assessment of supply chain management [11], the metrics or identification criteria for GSCM implementation [6,12], GSCM implementation strategies [13], green purchasing/supply chain decision-making dilemma, theoretical research on the green supply chain, as well as GSCM business performance [13,14,15]. Each GSCM related study or technique employed has addressed different insights, but a lack of holistic perspectives becomes an issue since green capabilities and assessments possessed by firms should be closely linked to GSCM drivers and green providers [14,16,17]. Therefore, a broader perspective is needed to examine the development of eco-friendly enterprises.
The purpose of eco-friendly development planning is to efficiently use limited resources with the aim of creating business value and maintaining sustainability. Researchers [18,19] indicate that a firm’s value can be maximized and treats can be minimized if sound strategies are well planned and executed (e.g., meeting new-market requirements) while a firm is not over-dependent on isolated organizational strategies [20]. Thus, for achieving the goal of being an eco-friendly enterprise, firms have to develop step-by-step procedures to ensure that green providers can satisfy the requirements of green capability, to integrate with GSCM drivers, and, thereby, to ultimately transform needed attributes to sustainable advantages [16,17]. To develop an eco-friendly enterprise, the deployment and alignment among GSCM drivers, green capabilities, and providers is vital. Previous studies [11,16,21] have paid attention to how to establish an eco-friendly enterprise. However, the details of how GSCM objectives can be translated into action plans are insufficient. In fact, prior approaches do not directly address the relationships among GSCM drivers, green capabilities, and the qualifications of green providers.
The house of quality (HOQ) in the quality function deployment method is a useful tool to connect components in terms of theoretical rationales and processes [22]. However, due to broad definitions of green attributes, the results of evaluation are compromised with uncertainties. In addition, fuzzy logic is employed in this study since it is a useful tool to identify the ambiguities and multiplicity of linguistic judgment meanings that are required for the expressions of green attributes [7]. For the purpose of helping managers to achieve the goal of building eco-friendly enterprises, the study proposed a method that was based on fuzzy logic and the relationship matrix in the QFD to assess supply chain members from GSCM drivers in business environments. A fuzzy green integrated capability index (FGICI) was developed to measure an enterprise’s eco-friendliness level (EFL). Green capability merit ratings and individual average relation weight with green drivers were generated to assess those targeting enterprises. To identify the principal obstacles in the eco-friendliness level, a fuzzy importance enhancement index (FIEI) is also defined in this study. The FIEI comprises the green provider merit rating and its average relation weight with its capabilities. This study also reports how this robust approach was applied for a Taiwanese electronics-based firm. The results of the study revealed that the proposed framework and procedures can be applied for enhancing the eco-friendliness of an enterprise as well as to secure a competitive advantage.
2. Eco-Friendly Enterprise Conceptual Model
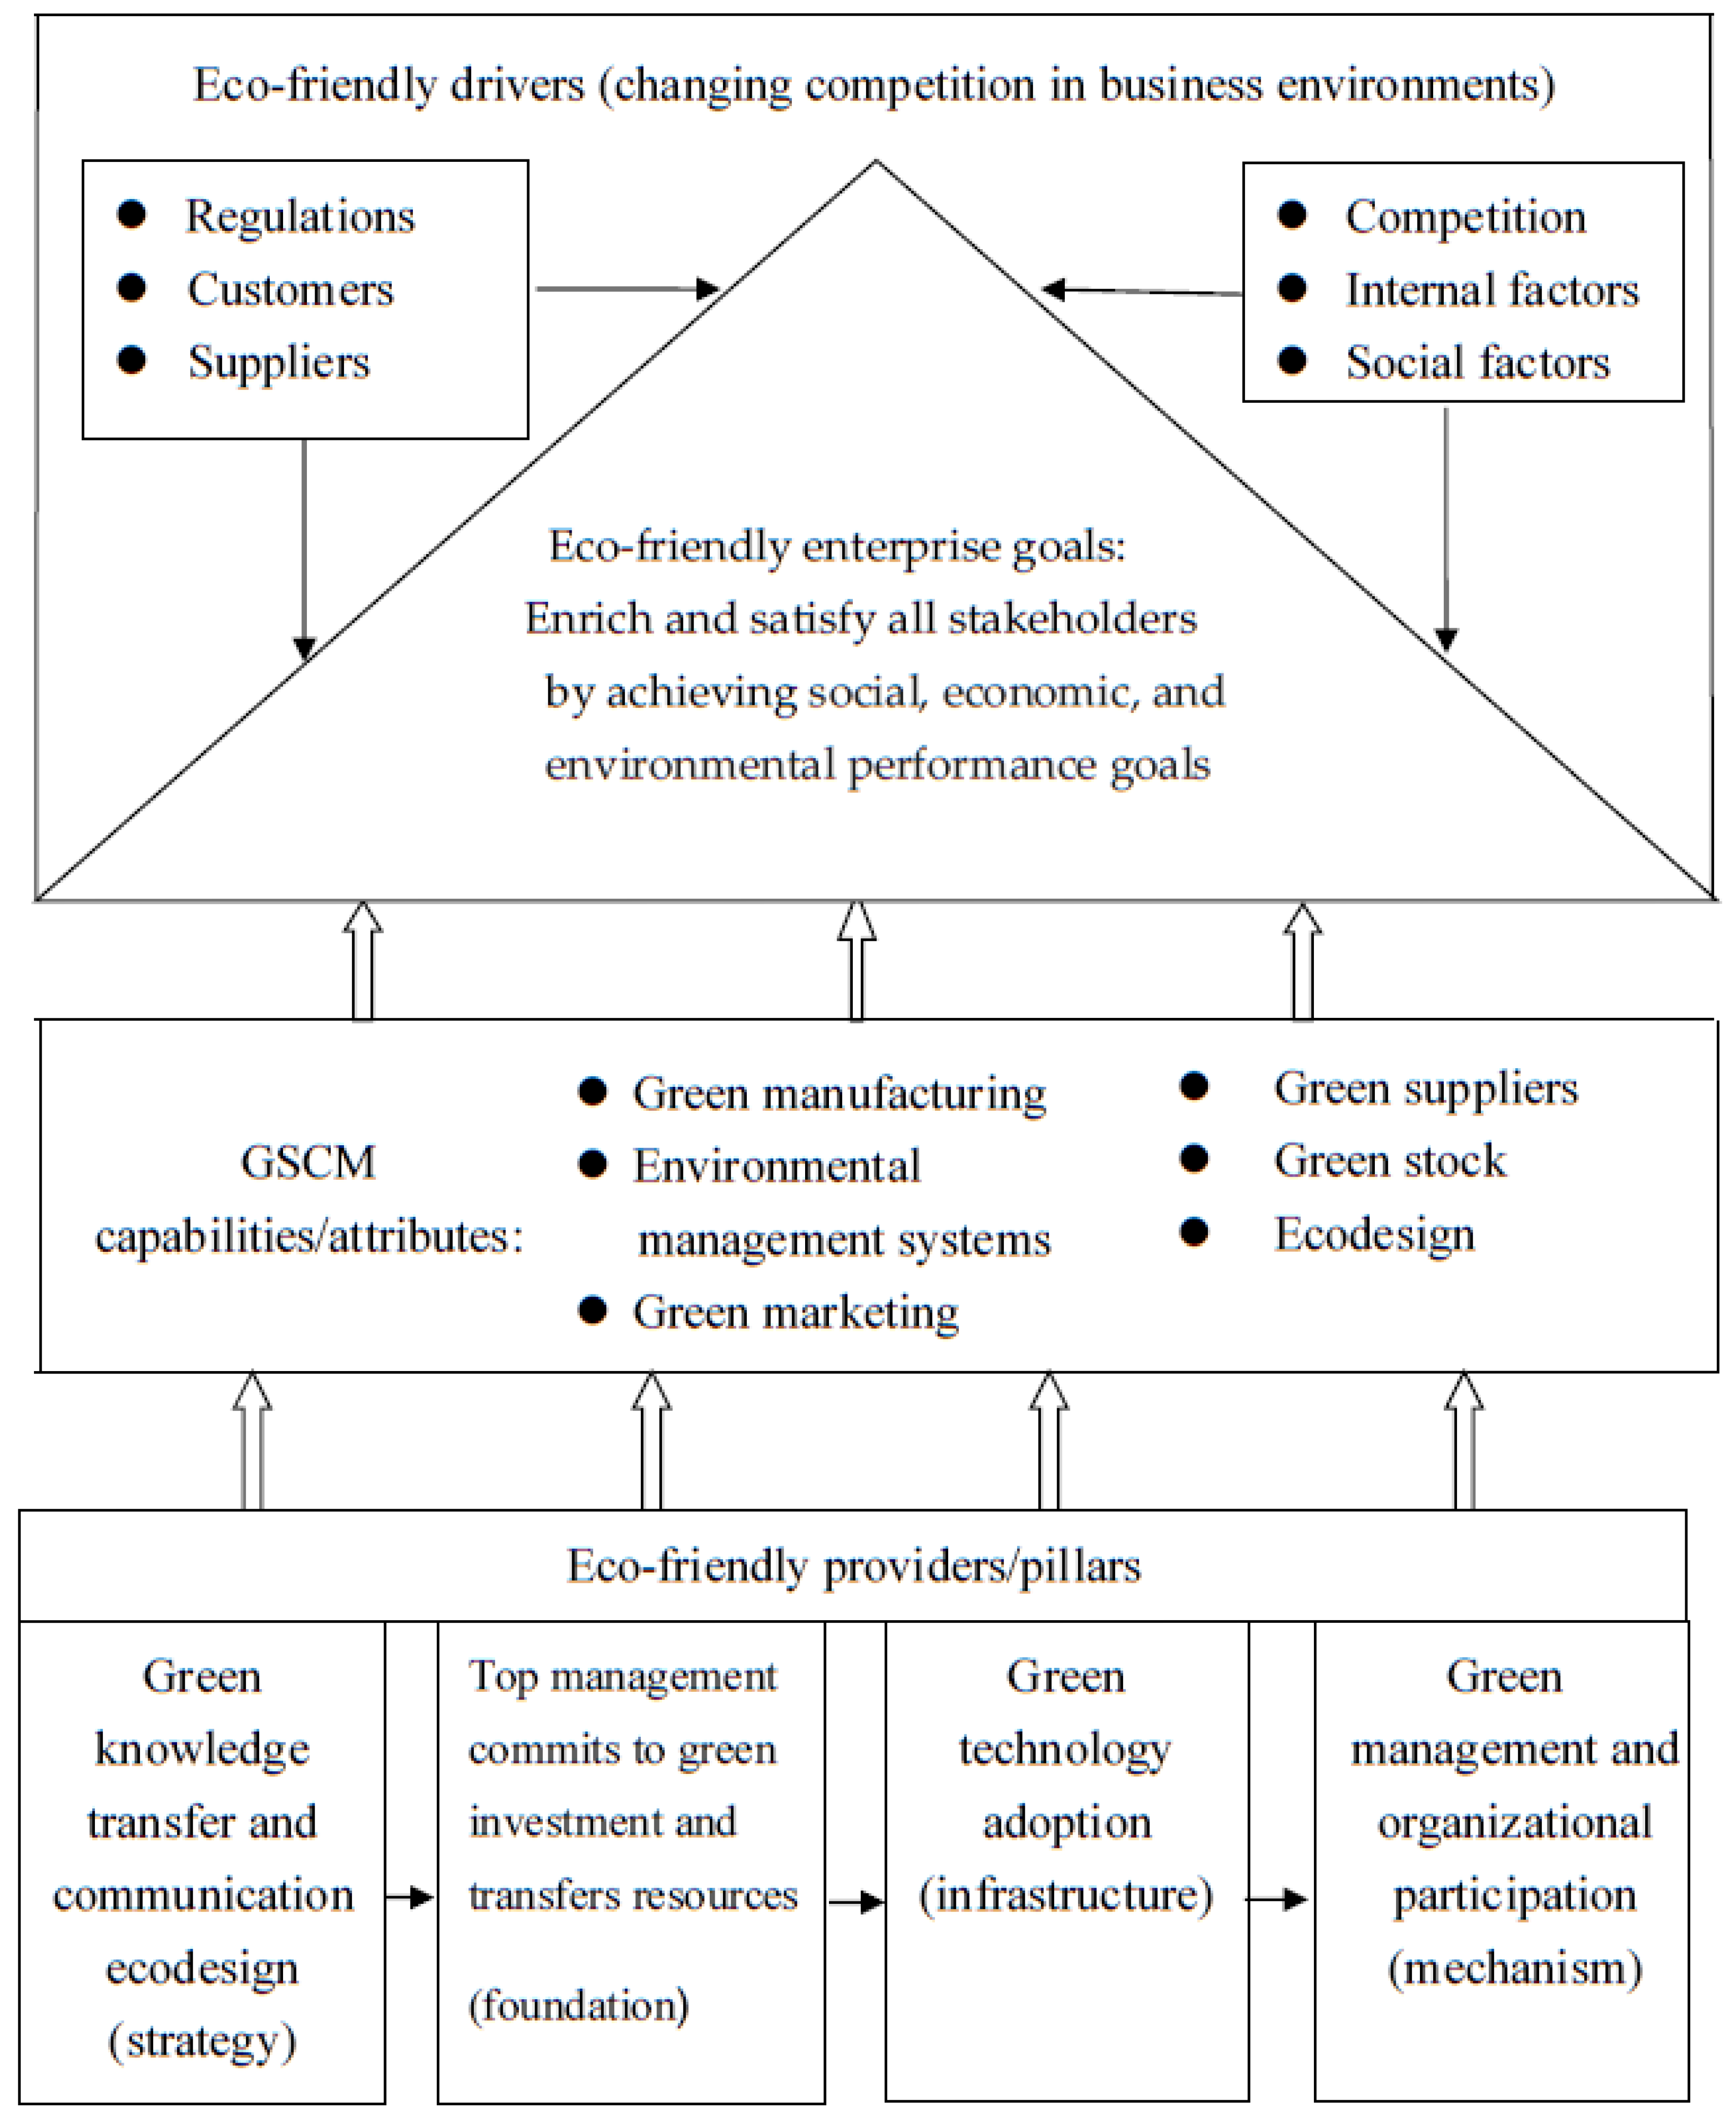
The goal of an eco-friendly enterprise is to have its employees, customers, and stakeholders to agree with its environmental concerns. The tougher international environmental regulations and consumers’ growing environmental consciousness become crucial factors for businesses worldwide [4,23]. Therefore, proper environmental management plays a critical role for modern enterprises. To enhance the notion of environmental stewardship, the concepts of environmental management (e.g., green management, green marketing, green production, and green innovation) are currently being pursued. Being eco-friendly, an enterprise should have several distinguishing green attributes. Based on the literature [1,19,23,24,25,26,27,28,29], we developed an eco-friendly enterprise conceptual model, as shown in Figure 1, to provide insights into what constitutes eco-friendly attributes and the providers of an eco-friendly enterprise.
Gaining competitive advantages and economic performance are essential to businesses of all kinds. Eco-friendly enterprises are no exception [13,30]. Each enterprise needs to know its internal and external environments and to exploit possible opportunities that enable the enterprise to succeed. Mitigating negative environmental impacts is not a novel concept. In fact, environmental degradation is currently taking place at a substantial scale and at a faster rate than ever before. Certain phenomena (e.g., global warming) have been observed. With tighter international environmental regulations and the increase in consumers’ environmental consciousness, businesses face more challenges. Different enterprises and industrial profiles would have different environmental problems needed to be solved, but certain common traits in terms of GSCM drivers [1,12,23,24,28,31] in a business environment can be categorized as follows: (a) organization related; (b) government regulation and legislation; (c) customer demand; (d) external competitors; (e) society or non-organizational stakeholder groups; and (f) pressure from supply chain partners. These GSCM drivers continue to exercise their functions and are the driving forces to ensure that governments and businesses take more responsibilities to protect environments.
Eco-friendly enterprises are distinguished in certain areas. Researchers have made efforts to identify green capabilities from which enterprise leaders consider the most important issues based on their own visions, goals, and strategies for GSCM [14,26,32,33]. Shang et al. [32] examined GSCM capabilities among electronics-related manufacturing firms in Taiwan and grouped a set of 37 green capabilities into six principal categories: (a) green manufacturing and packaging; (b) ecodesign; (c) environmental participation; (d) environmentally friendly purchasing; (e) green marketing; and (f) green stocks. These attributes, representing most aspects of eco-friendliness, can be used to manage all GSCM drivers in an enterprise. In addition, Olugu et al. [26] identified and developed 10 measures with 49 metrics and six measures with 23 metrics for forward and backward chains, respectively. Regarding the selection of a suitable green supplier, Tseng [33] identified 16 GSCM criteria for the development of manufacturing firms, as follows: (a) delivery reliability; (b) supplier profitability; (c) relationship with the supplier; (d) green technology capabilities; (e) conformance quality; (f) supplier flexibility; (g) service quality; (h) green-purchasing capabilities; (i) life cycle assessment; (j) green design; (k) green certification; (l) internal green production plans; (m) management support; (n) green production; (o) the reduction of hazardous materials in the production process; and (p) environmental management systems.
An eco-friendly enterprise requires being responsive to green management practices. Green providers also need to perform identified green characteristics. Supply chain strategies, structures, core competencies, supply chain processes, and information systems are key to determining qualified green providers [12,13,19,24,25,34]. From the viewpoint of green supplier development practices, Bai and Sarkis [25] grouped a set of 30 green provider characteristics into three major categories: (a) green knowledge transfer and communication; (b) investment and resource transfer; and (c) management and organizational practices. Azevedo et al. [19] identified 10 criteria that are the most critical green practices as indicated by the managers of a Portuguese automotive supply chain. These criteria are as follows: (a) developing environmentally friendly products; (b) implementing environmentally friendly internal operations; (c) gaining recognition for environmentally positive behaviors; (d) environmentally friendly purchasing; (e) environmental collaboration with customers; (f) encouraging suppliers to adopt more environmentally friendly behaviors; (g) interacting with customers to change product specifications; (h) reverse logistics; (i) ISO 14001 certification; and (j) waste minimization. A GSCM development literature review conducted by Dubey et al. [34] reported five principal components encompassing 26 GSCM providers. These providers were: (a) top-management commitment; (b) institutional pressure; (c) supplier relationship management; (d) total quality management; and (e) green technology adoption. In summary, researchers have made efforts to identify diverse aspects of GSCM drivers, green capabilities, and providers. However, no single set of GSCM drivers, green capabilities, and providers reflects a full spectrum of possible practices.
In the literature, researchers [14,25,35] have proposed a conceptual model for eco-friendly practices. The goal of eco-friendly development planning is to effectively connect the resources possessed by enterprises so that negative environmental issues can be prevented or even eliminated. Study results [16,17,36] have shown that the GSCM priority is to understand the relationships among GSCM drivers as well as green capabilities and providers. Thus, both capabilities and providers can be synthesized with GSCM drivers and to turn them into a competitive advantage. However, a paucity of holistic methods exists concerning organizational deployment and integration among GSCM drivers in the business environment, green capabilities and providers [14,16,17].
The aim of the Quality Function Deployment (QFD) method focuses on detailed pre-planning process in order to deploy customer needs and the specification of a new product [37]. It uses several house of quality (HOQ) charts to describe the relationship to each other all through the new product project: product engineering, parts deployment, process planning, and product. There are seven major aspects in the basic HOQ format: (a) customer needs (CNs); (b) the importance of CNs; (c) design requirements (DRs); (d) a relationship matrix for CNs and DRs; (e) correlation among DRs; (f) competitor analysis; and (g) the prioritization of DRs. A simplified HOQ matrix is called a relationship matrix, in which the competitor analysis and correlation analyses among DRs are removed. In this study, a simplified HOQ matrix was used to analyze and deploy the relationships among GSCM drivers in the business environment, green capabilities, and select suitable green providers.
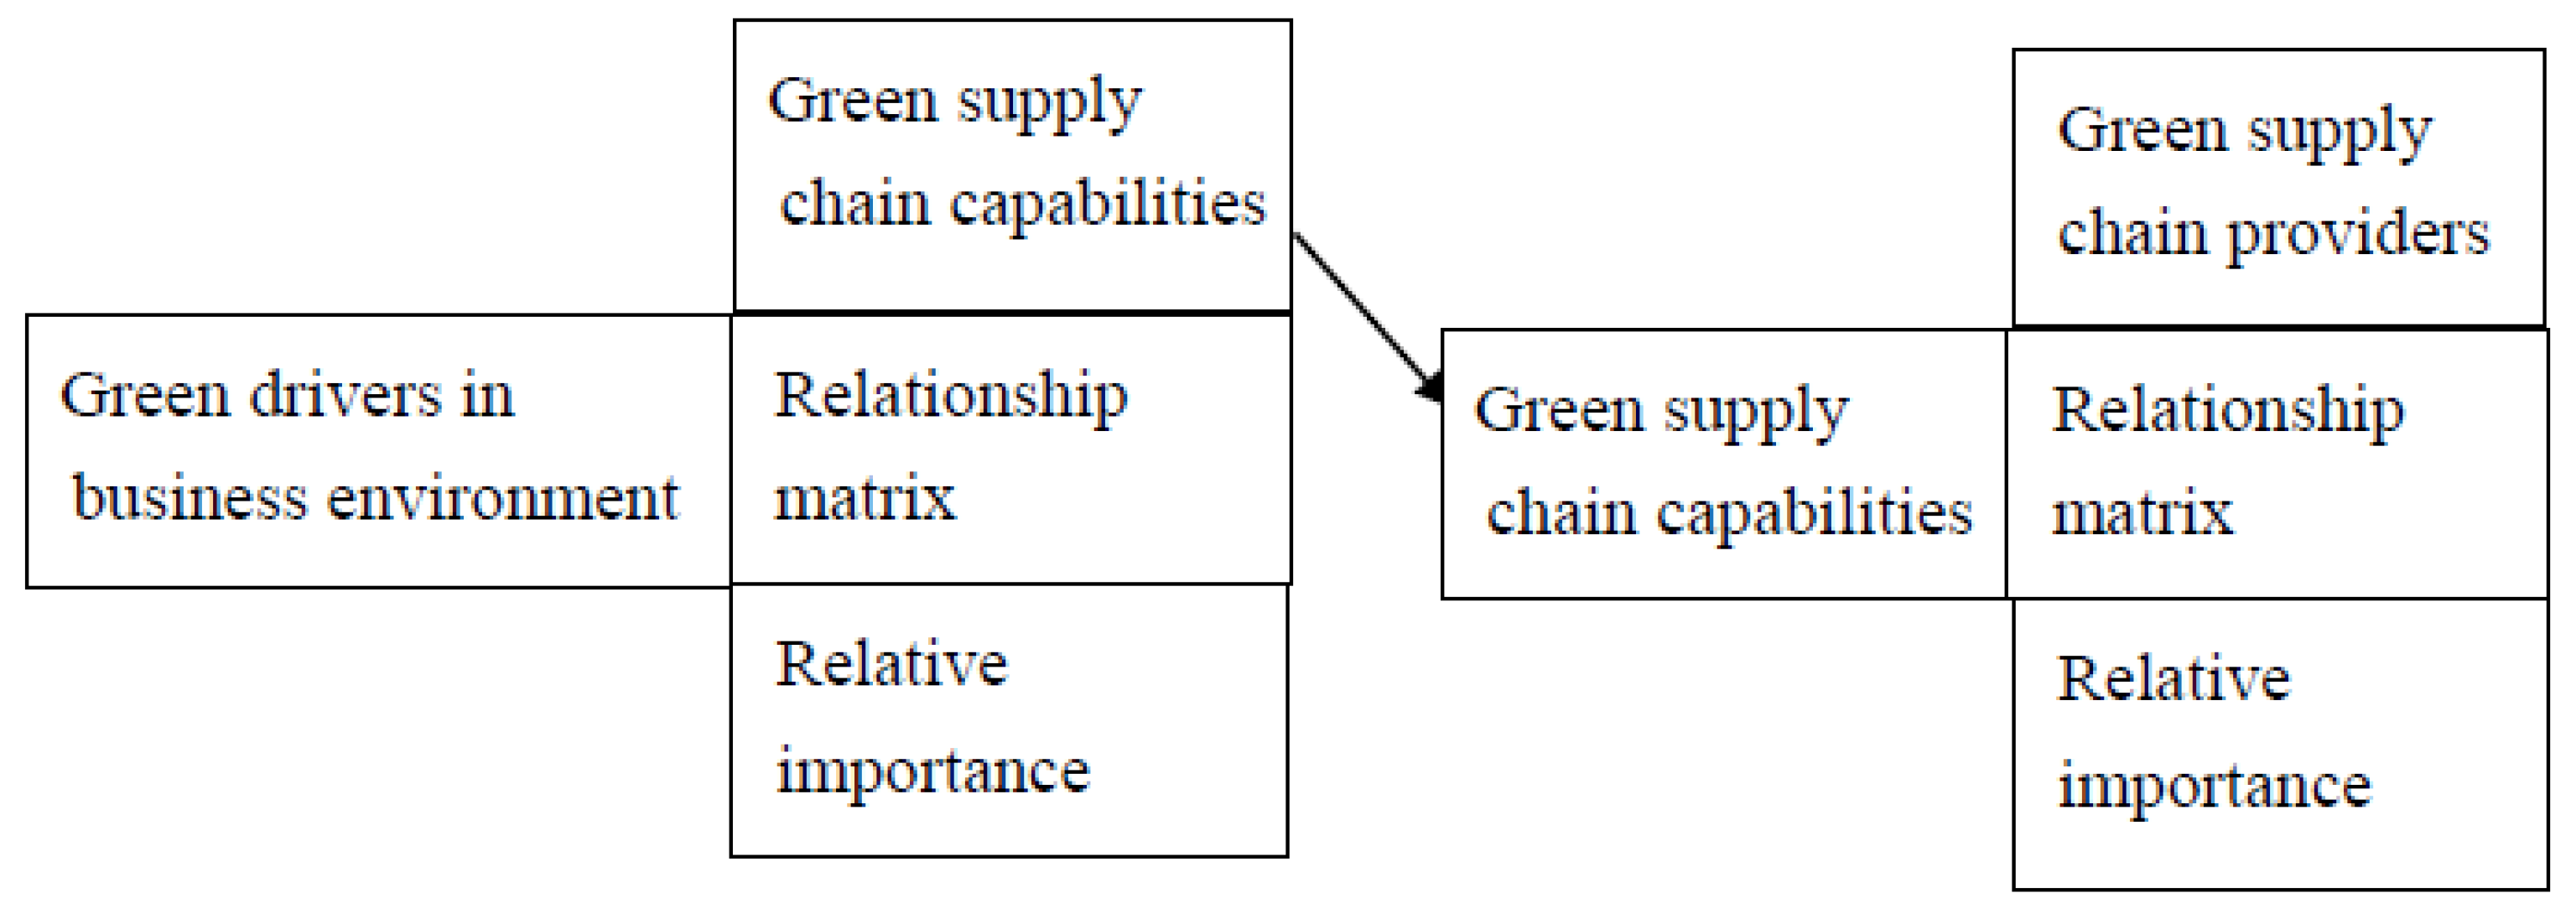
Although QFD has been proposed as a customer-driven product development and delivery methodology, an enterprise can use a QFD approach to achieve various strategic goals [22,38,39,40]. To help managers measure eco-friendliness more efficiently, the eco-friendly enterprise conceptual model and the relationship matrix in the QFD method were applied in this study. In addition, this study proposes a novel systematic model for alignment and integration. By doing so, green providers can assess their green capabilities and cope with green drivers (Figure 2). This model is described as follows:
- Deploying a green strategy: identifying green capabilities that can provide the strength required for responding to problems associated with environmental impacts and searching for a competitive advantage by relying on close connections and the coordination of GSCM drivers and green capabilities.
- Aligning green ingredients: finding green providers constituting the means by which the needs of an enterprise related to green capabilities can be met by relying on close connections and the coordination of green capabilities and providers.
3. Fuzzy Logic
For applying the method, this section describes the characteristics of fuzzy logic. For more information concerning fuzzy logic, please refer to Klir et al. [41].
3.1. Linguistic Variables
The linguistic variable is a variable whose values are words or sentences in natural or artificial language. For example, “good”, ”fair”, “poor” are all linguistic variables. A linguistic variable can usually be used for examining human reasoning, which is vague and imprecise (e.g., hot, old, and beautiful), in order to be reasonably described in conventional quantitative expressions. Furthermore, by the approximate reasoning of fuzzy logic, the linguistic value can be translated by a fuzzy number. For example, for the linguistic variables, {Worst, Very Poor, Poor, Fair, Good, Very Good, Excellent}, the fuzzy numbers approximate to these linguistic rating values are represented in Table 1. Even though there are many forms of fuzzy numbers for representing linguistic values, in this study, the weight of importance and the rating of the effect of each criterion are assessed by linguistic variables and triangular fuzzy numbers were used to approximate the linguistic variables because experts can specify them easily. Triangular fuzzy numbers can comply immediately with the relevant optimization criteria in certain weak assumptions [42].
Fuzzy logic is a useful approach to understand, quantify, and manage uncertain and vague risk data. It is extensively applied in several fields including managerial decision-making [43]. For example, it has been applied into developing an integrated risk assessment framework for supply chains [44]. To help organizations build influential factors in knowledge management implementation, a fuzzy success possibility index developed by Chang and Wang [39] to provide a platform for the development of knowledge management. Lin and Chen [45] proposed a fuzzy-possible-success-rating for evaluating go/no-go decisions for novel product screening based on competitive advantages, superiority, technological suitability, and risk in product marketing. Using the decision-making trial and evaluation laboratory (DEMATEL) technique with intuitionistic fuzzy sets, Govindan et al. [29] developed an intuitionistic fuzzy-based DEMATEL method for managing critical and causal relationships between GSCM practices and performance. Furthermore, combining fuzzy set theory with the DEMATEL method, Wu et al. [1] created a hybrid approach to investigate the effects of each criterion in GSCM practices. To enhance the quality of decision-making and reliability in decision-making processes, Wu [46] and Lin [17] proposed the fuzzy DEMATEL method for evaluating criteria based on the relationships between causes and effects for groups associated with quadrant identification.
3.2. Algorithm for Fuzzy Weighted Average
Fuzzy weighted average represents that an aggregate of the criteria ratings and their relative weightings is a very suitable approach for multicriteria decision-making. It represents the overall performance or capability of an event or person. There are several algorithms devised for calculating fuzzy weighted averages [47,48]. The method developed by Kao and Liu [48], called a fractional programming approach, was selected in the current study for computing the fuzzy weighted average efficiently.
Let R1, R2, …, Rn and W1, W2, …, Wn denote the fuzzy ratings and fuzzy importance weights of the criteria, respectively. With n criteria, the fuzzy weighted average Y of Ri and Wi is defined as
Following the variable transformation and the fractional programming approach [48] by letting and vi = twi, the lower and upper bounds of the specific α-cut of Y can be transformed to the conventional linear program and solved using the following formulation:
Finally, the membership function Y can be constructed by setting out different α-cut values.
3.3. Fuzzy Ranking Method
Fuzzy numbers can’t be ranked as are real numbers. Several fuzzy ranking methods have been developed for comparing fuzzy numbers in literature [49,50]. Fuzzy number ranking in the current study is based on the left-and-right fuzzy ranking method by Chen and Hwang [49] because it preserves the ranking order and considers the absolute location of each fuzzy number. However, the definition of fuzzy maximizing and minimizing sets can affect the ranking score.
According to the left-and-right fuzzy ranking method, the fuzzy maximizing and minimizing sets are defined as:
Suppose a triangular fuzzy number M defined as: fM: R→ [0, 1] with a triangular membership function as:
The right and left fuzzy score for M can be respectively obtained as:
Finally, the fuzzy score of M can be obtained by combining the left and right, as shown in Equation (7):
4. Fuzzy QFD-Based Model for Eco-Friendly Enterprise Development and Evaluation
To achieve eco-friendly enterprise, the plan for deploying and aligning of GSCM drivers, green capabilities, and providers and transforming them into a competitive edge are critical. This is because only the green providers consistently fit green capabilities and transform into a competitive advantage, and then the green capabilities can cope with GSCM drivers and eco-friendliness can achieve. Due to an either “imprecise” or “vague” definition of green attributes and their relationships, the aligning and deploying evaluation process is associated with uncertainties and ambiguity. Managers must make decisions by considering a group of non-numerical values green attributes and relationships. Although none of attributes may meet the need of a particular enterprise, managers still must be considered in the evaluation process. Thus, the tradition evaluation approaches, such as analytical hierarchical process (AHP) or multiple attribute decision making (MADM), cannot conduct such evaluations effectively. In company, the strategic planning evaluation is always made primarily based on the opinions of experts because they have the ability to understand and analyze obscure or imprecise events that are not easily incorporated into existing analytical methods. According to Karwowski and Mital [51], in circumstances where evaluators cannot conduct substantive assessments, linguistic expressions are used to estimate ambiguous events. Linguistic terms typically have vague meanings. One approach to capturing the meanings of linguistic terms is the fuzzy logic approach to associate each term with a possibility distribution [52].
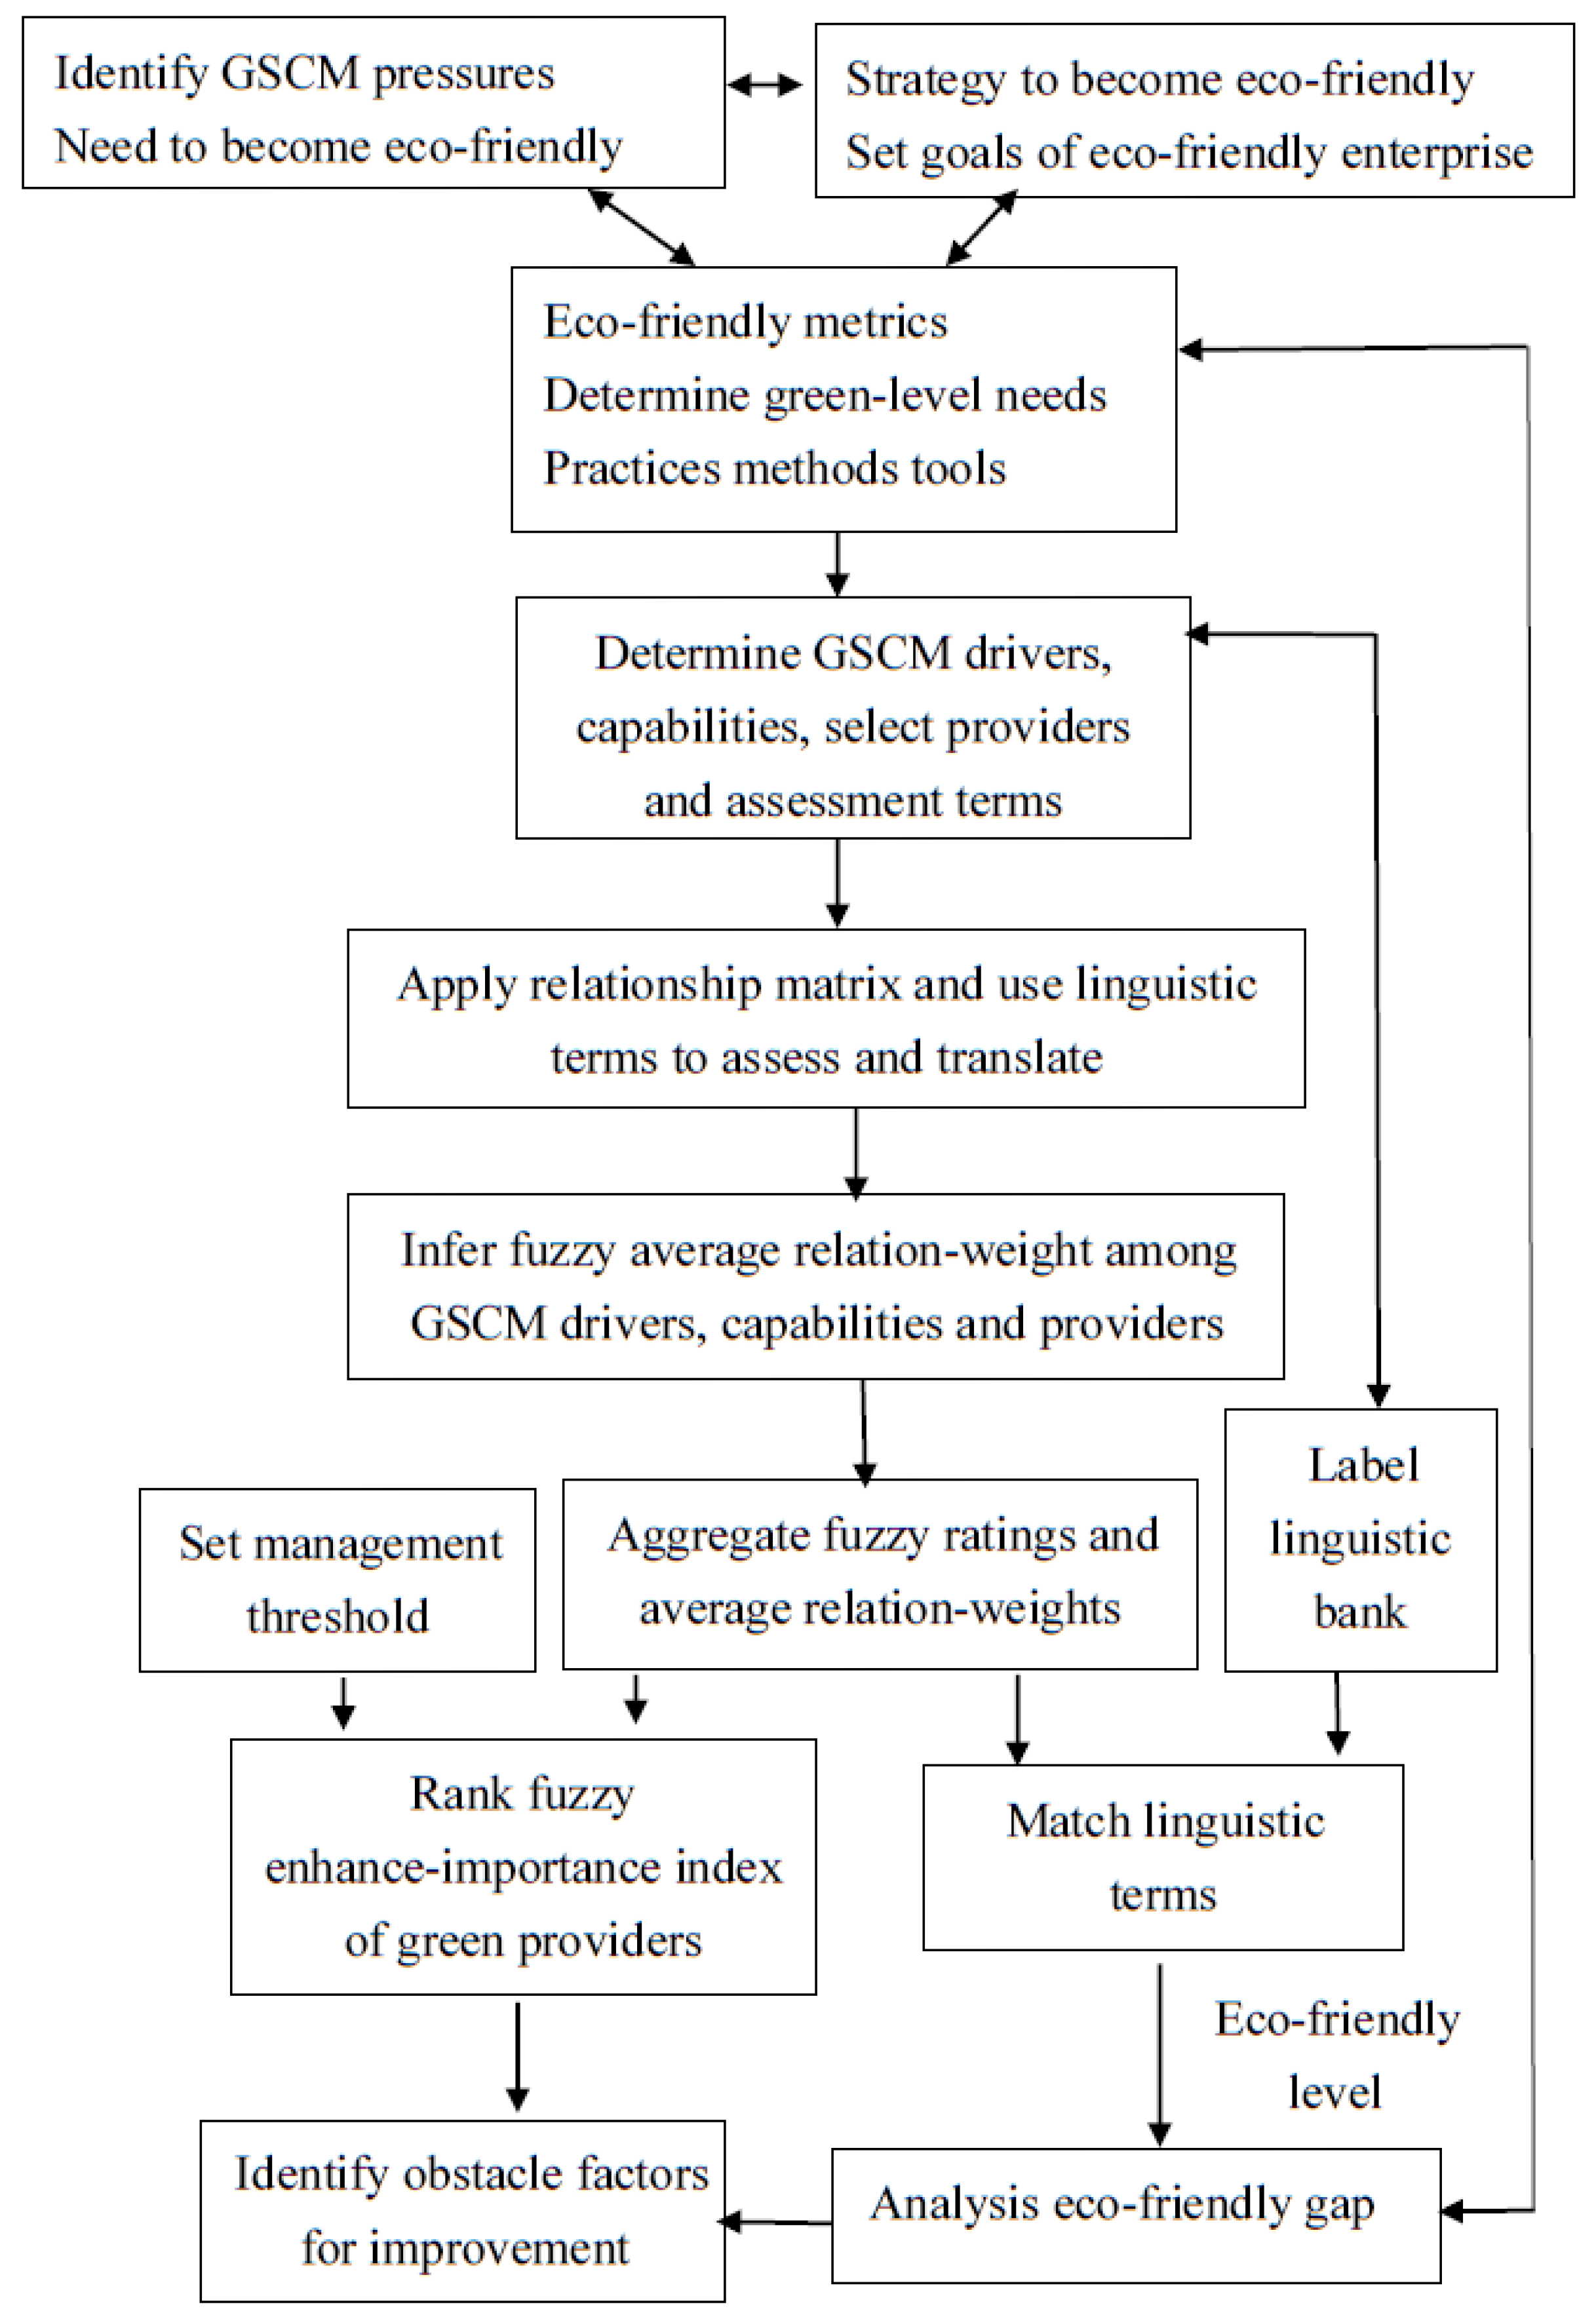
According to the eco-friendliness development plan conducted by researchers [14,16,17], the green capabilities and assessments should be closely linked and coordinated with GSCM drivers and green providers. However, the theme of enterprise eco-friendliness has failed to be sufficiently addressed in the literature concerning. In addition, the relevant perspectives and the relationship matrix in the quality function deployment (QFD) method provide an excellent tool for solving the linking processes problems. To assist managers in enhancing firms’ eco-friendliness, by using the QFD relationship matrix and fuzzy logic, a fuzzy logic–QFD eco-friendliness-enhancing model (FLQFDEFEM) composed of four major components (Figure 3) was developed for eco-friendly enterprise development and evaluation. GSCM drivers were first identified through a business environment survey. Afterward, the goals of eco-friendliness were set up, and the attributes of green capabilities for assessment were identified. The required green providers for measurement were then selected. Second, apply the relationship matrix to align the drivers, capabilities, and providers, and to further analyze the fuzzy average relation weight. Third, synthesize the fuzzy ratings and average relation weights of the capabilities to obtain the fuzzy green integrated capability index (FGICI) of the enterprise and to match the FGICI with an appropriate linguistic term of eco-friendly label. Finally, synthesize the fuzzy ratings and average relation-weights of the providers to obtain the FIEI. They were further rank-ordered to identify the major obstacles and enabled researchers to conduct the proactive implementation of the appropriate ameliorative measures.
5. Case Study: Eco-Friendly Enterprise Development and Evaluation of a Taiwanese Electronics Company
This section presents an eco-friendly development project at EA Optronics company in Hsinchu, Taiwan (company names were anonymous to encourage participants’ participation) to detail the FLQFDEFEM and show how it can be used in an eco-friendly development. Every enterprise is typically recognized to have its own operational business objectives and strategy. Thus, applied in a specific situation or enterprise, this should be modified or extended to meet their requirement.
5.1. Subject of Case Study
EA Optronics is an internationally famous electronics-related manufacturing firm, particularly noted for its TFT (Thin-Film Transistor)-LCD panels and green energy industry. Its annual revenue was approximately US$13 billion in 2014. EA Optronics engages marketing and service operations all over the world, focusing on the Asia-Pacific region, Europe, and America. The supporting dealers and distributors are located in more than 50 countries. In the twenty-first century, the market for IT products has matured. Low-cost production in developing nations has proliferated. Thus, EA Optronics has been forced to be more locally oriented in response to an uncertain business environment. Such changes have profoundly challenged EA Optronics. To maximize social, economic, and environmental performance, EA Optronics has strived to become a major global supplier to reduce environmental consequences for the purpose of satisfying its stakeholders, achieving time-to-market reductions, lowering the total cost of ownership, and enhancing overall competitiveness.
The IT product supply chain is characterized by dynamics and volatile product demand. EA Optronics has recognized environmental management to be a key strategic issue, with the potential to have a lasting impact on the company’s reputation, competitiveness, and performance. The executive team at EA Optronics continues to face challenges in terms of how to manage GSCM practices in an efficient fashion. The firm is considering to develop green factors as a means to promote the company and its products. Since the eco-friendly enterprise has been advocated as the twenty-first-century business paradigm and is perceived as the ideal strategy for companies seeking to enhance their environmental performance, to attain competitive advantages, and to secure their position as international leaders, and the management team at EA Optronics sets a goal of being an eco-friendly enterprise through continuous improvements. An analysis and evaluation committee (composed of one professor, three company managers, and two GSCM professionals with extensive consulting experience) led by the executive vice president was organized. This committee was selected from the most knowledgeable persons who were mastered in GSCM principles and whose responsibilities included investigating and rectifying problems. Each member presented his/her concerns to the evaluation, which had to be reconciled by reaching a consensus. This was a necessary procedure because the success of the project requires the participation and contribution of all departments in company.
5.2 Applying the FLQFDEFEM to the Eco-Friendly Enterprise Development Project at EA Optronics
When EA Optronics set the goal of achieving an excellent eco-friendly enterprise based on social, economic, and environmental performance through GSCM implementation, the committee had several questions such as “Precisely what is eco-friendliness, and how can it be measured?”; “How can both analytical and intuitive understandings of eco-friendliness be developed in a particular business environment?”; and “How can GSCM be enhanced at EA Optronics?” Answering such questions necessitates knowledge on what to measure, how to measure it, how to evaluate the results, and how to conduct improvements based on the findings. Moreover, how to link GSCM drivers, green capabilities, and providers to ensure that providers can enhance the capabilities and that the capabilities can cope with GSCM drivers, as well as how to translate them into a competitive advantage, must be considered if a company is to become eco-friendly. Although critical concepts and steps for development have previously been identified, no systematic tool is available for aligning these concepts. Moreover, because the ill-defined and ambiguous elements concerning exists in green attributes and their interrelationships, it is difficult to determine whether a value (e.g., 0.2) is low or another value (e.g., 0.3) is also low, and experts can only differentiate easily among low, medium, and high relationships. Therefore, they decided to use linguistic terms for measuring the ambiguous green attributes. Furthermore, the CEO expressed a desire to pursue a method that takes the uncertainties of each attribute into consideration, yet maintains the multiple properties to provide a helical assessment of the eco-friendly performance for the GSCM. Fuzzy logic can be a useful tool for applying in this context, instead of as a single value as in traditional methods, since linguistic variables contain ambiguities and multiple meanings, and the information obtained can be expressed as a range in a fuzzy set. On the basis of the procedures of the FLQFDEFEM model, the eco-friendly enterprise development plan was implemented and achieved the goal. The initiate eco-friendly enterprise development project is summarized as follows:
5.2.1. Identify GSCM Drivers, Green Capabilities and Providers for the Assessment
To enhance and achieve eco-friendliness, the deployment and linkage of GSCM drivers, green capabilities, and providers, as well as their transformation into a competitive advantage are critical. Because each company is different and faces different challenges, a full spectrum of questions can hardly be presented completely. To elicit assessment criteria reflecting the nature and entire set of GSCM attributes, the experts reviewed and discussed a series of global environmental regulations, government regulations and legislation, changes in the business environment, as well as environmental impacts. A survey was conducted. To facilitate members’ holistic understandings of the current conditions, a meeting was held. The major contents were as follows:
- The organization’s environmental goals and strategies: the overall objective in addressing environmental issues to achieve an excellent eco-friendly enterprise according to social, economic, and environmental performance; the general attitude toward environmental legislation and impacts; internal environmental management; and recovery investment.
- Supply chain policy and characteristics: supply chain priorities (social, economic, and environmental performance), the supply chain process, supplier selection, perceived environmental issues, drivers, core business and competencies, and specific supply chain management problems.
- Business structure: organization, process, IT, product design, and purchasing management, and providing the capabilities for GSCM enhancement, including GSCM project descriptions and support by management as well as other departments.
- GSCM practices: those performed in response to environmental issues, such as corporate social responsibility reports, annual environmental and financial reports, supplier evaluation questionnaires, internal newsletters, collaborating with customers and suppliers, GSCM projects, main project drivers, inhibitors, and techniques for overcoming them, approaches to measuring the impact of the GSCM project, lessons learned, and the project as piloted within a particular area of the organization or introduced throughout the entire organization from the start.
Based on the results of the discussion, the committee referred to factors proposed in previous studies [1,19,23,24,25,26,27,28,29]. To facilitate reaching a consensus in terms of criteria determinations and relative importance to the enterprise, the Delphi iterative procedures were employed in this stage. After three iterative procedures were ran, the GSCM drivers were identified, and the green capabilities were set and green providers for the assessment were selected, as shown in Table 2 (this table presents merely what the author assessed to be the most prevalent and meaningful factors for this project).
5.2.2. Determine the Preferred Measurement Scale
The ad hoc usage of linguistic terms and their corresponding membership functions is the characteristic of fuzzy logic. Widely used linguistic terms and their corresponding membership functions have been proposed for linguistic assessments. Instead of eliciting linguistic variables and associating fuzzy numbers from the experts, for the sake of convenience, they could be obtained directly from previous studies or basic models and modified it to incorporate individual situations and the requirements of different users. Since individuals only have a limited memory span, nine linguistic levels is the maximum number recommended [53].
The experts reviewed green supply chain features, goals, policies, strategies, structures, capabilities, phases of competition, and GSCM-related practice original data and information before the assessment proceeded. Initially, the members could not reach a consensus on linguistic terms and their fuzzy numbers. The linguistic terms and their corresponding fuzzy numbers in literature were adopted for minimizing argument, and they further modified it to incorporate the specific characteristics of EA Optronics. To validate these linguistic terms and their corresponding fuzzy numbers were appropriate and to ease communications within the committee, we asked them to describe the fuzzy numbers when we gave them a linguistic term. This continued until their answers reached consensus. After the ongoing discussion process, the committee selected the linguistic terms and its associated fuzzy numbers for measuring as listed in Table 1, based on their long-standing recognition of the meaning of linguistic values.
5.2.3. Apply the Relationship Matrix and Use the Linguistic Terms to Assess the GSCM Attributes and Relationship Levels
For defining the relationships among the variables, a series of brainstorming sessions were further held. The experts were queried regarding the mutual relationships among variables, such as how and how much a particular feature facilitates can enhance the others. Based on their experience, knowledge, and judgment and the conclusions of the review meetings and brainstorming sessions, the experts used the relationship matrix (Table 3) and the level scale W = {Extremely Low (EL), Very Low (VL), Low (L), Fair (F), High (H), Very High (VH), Extremely High (EH)} and its associated fuzzy number as shown in Table 1, in order to measure the level of importance of the GSCM drivers. The weighting scale RS = {Very Low (VL), Low (L), Fair (F), High (H), Very High (VH)} and its associated fuzzy number, as shown in Table 1, was used to evaluate the degree of relationships between the green capabilities and GSCM drivers, as well as the relationship levels between green providers and green capabilities. The rating scale R = {Worst (W), Very Poor (VP), Poor (P), Fair (F), Good (G), Very Good (VG), Excellent (E)} and its associated fuzzy number, as shown in Table 1, was also used to assess the performance of the green capabilities and green providers. Table 3 and Table 4 are a sample of the results of the assessment. Then, based on the associated relationships listed in Table 1, linguistic variables and their corresponding fuzzy numbers, the results of the assessment were translated into fuzzy numbers.
5.2.4. Analyze the Fuzzy Average Relation Weight in the Relationship Matrix
It is important to aggregate the different experts’ opinions in group decision-making. Many methods can be used to aggregate the experts’ opinions, such as median, mean, and mixed operators. Since the median operation is more robust in a small sample, this method was chosen to pool the experts’ assessments.
After the consideration of different expert assessments, based on the HOQ and the definition of fuzzy weighted average [8], the total fuzzy average relation weight between a particular column item and the entire list of row items was defined as
where FARWGCDj denotes the fuzzy average relation weight of the jth green capability for all GSCM drivers; FLIGDi denotes the fuzzy level in the importance of the ith GSCM drivers; and FRLGDCij denotes the fuzzy relationship level between GSCM driver i and capability j:
where FARWGPCk denotes the fuzzy average relation weight of the kth providers for all green capabilities; FARWGCDj denotes the fuzzy average relation weight of the jth green capability derived from Equation (8); and FRLGCPjk denotes the fuzzy relation level between green capability j and provider k.
The fuzzy average relation weights of green capabilities and green providers can be obtained, as listed in Table 5, by using Equations (2a), (2b), (8), and (9).
5.2.5. Aggregate the Fuzzy Ratings and Fuzzy Average Relation Weights of Green Capabilities into an FGICI
The FGICI represents the green performance of an enterprise that will influence or impact making appropriate responses to environmental impacts on the GSCM environment. A higher FGICI regarding a GSCM indicates higher eco-friendliness.
According to the definition of the fuzzy weighted average operation [8], the FGICI is defined as
where FMGCj denotes the fuzzy merit of the jth green capability, and FARWGCDj denotes the fuzzy average relation weight of the jth green capability derived from Equation (8).
By performing the fuzzy weighted average operation, the FGICI for EA Optronics was found to be
FGICI = (0.51, 0.66, 0.81).
5.2.6. Match the FGICI with an Appropriate Linguistic Level
Once the FGICI was obtained, to identify the eco-friendliness level (EFL), the committee approximated a linguistic label, the meaning of which was identical (or the closest to) that of the FGICI meaning from the natural-language EFL set.
Several methods have been proposed to translate the fuzzy number back to linguistics. There are three basically techniques: (a) the Euclidean distance, (b) successive approximation, and (c) piecewise decomposition. It is recommended that the Euclidean distance method be utilized because it is the simplest to implement and the most intuitive form of human perception of closeness of proximity [54].
The Euclidean method was used to calculate the distance from the given fuzzy number to other fuzzy numbers that can be a natural-language expressions set. Assume EFL (eco-friendliness level) is a natural-language set, and UFGICI is the fuzzy number of the FGICI and is fuzzy number of the natural-language EFL expression; then, the Euclidean distance between the FGICI fuzzy number and each fuzzy number EFLi ∈ EFL can be calculated as below:
where p = {x0, x1, …, xm} ⊂ [0, 1] so that 0 = x0 < x1 < …< xm = 1.0. The Euclidean distance from the FGICI to each member in the EFL can be obtained by simplifying let p = {0, 0.05, 0.1, 0.15, 0.2, 0.25, 0.3, 0.35, 0.4, 0.45, 0.5, 0.55, 0.6, 0.65, 0.7, 0.75, 0.8, 0.85, 0.9, 0.95, 1}. Afterward, the closest natural expression with the minimum distance can be identified.
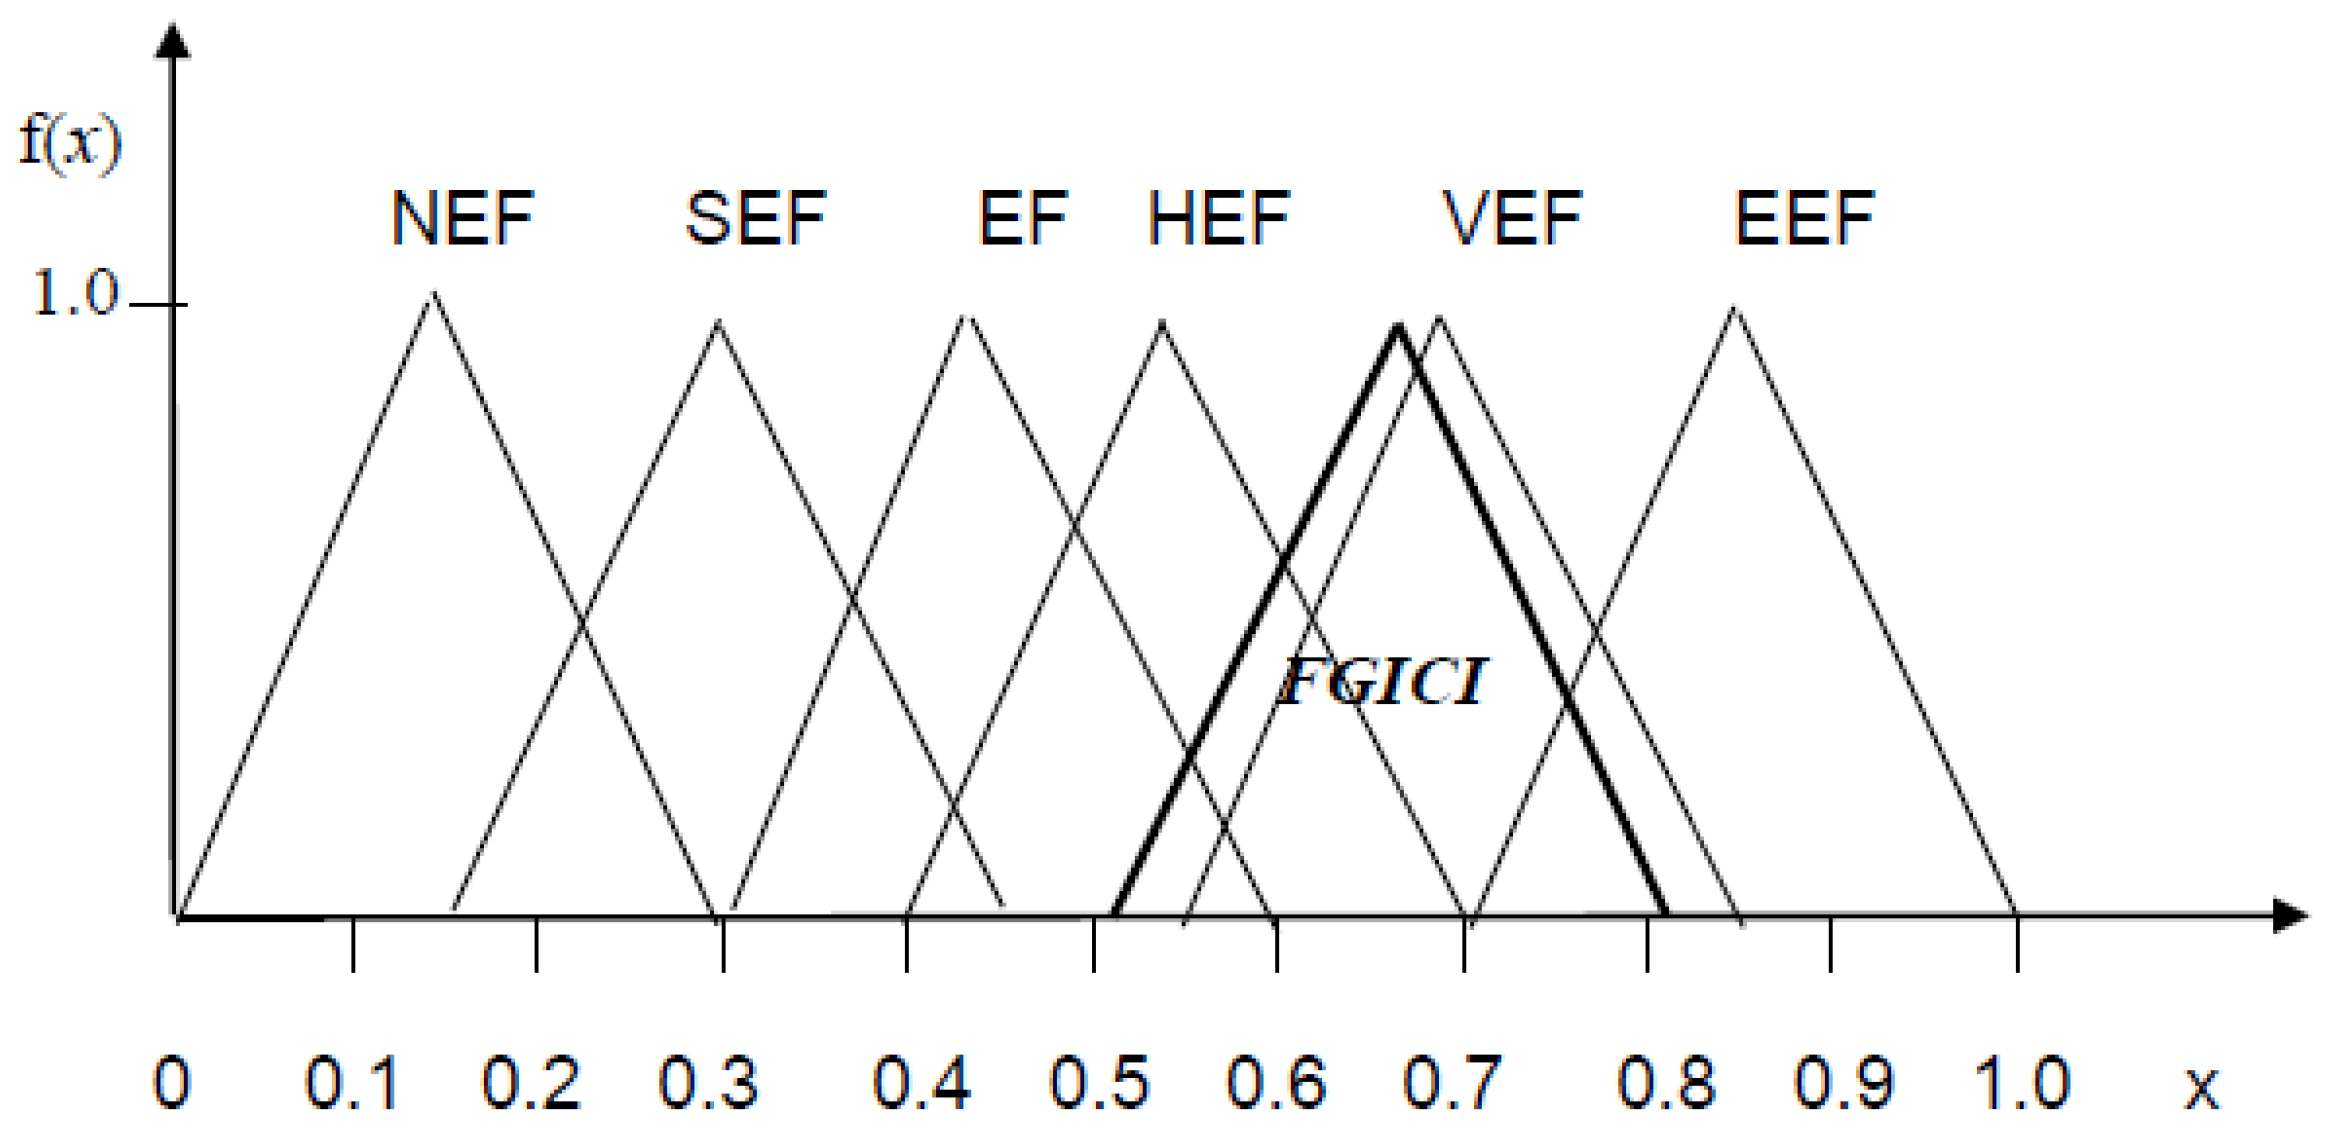
Each company should choose the labels and membership functions according to their goal and strategy for translating the FGICI back into linguistic terms. In this case, the set EFL = {Extremely Eco-friendly (EEF), Very Eco-friendly (VEF), Highly Eco-friendly (HEF), Eco-friendly (EF), Slightly Eco-friendly (SEF), Non-eco-friendly (NEF)} was used for labeling, and its linguistics and corresponding membership functions are shown in Figure 4.
Next, by applying the Euclidean distance D from the FGICI to each member in the set, the EFL was calculated as follows:
D(FGICI, EEF ) = 1.936, D(FGICI, VEF) = 0.653,
D(FGICI, HEF) = 1.465, D(FGICI, EF) = 1.982,
D(FGICI, SEF) = 2.027, D(FGICI, NEF) = 2.027.
Since the linguistic label “Very Eco-friendly” with the minimum D, the EFL of GSCM in EA Optronics could be labeled “Very Eco-friendly,” as shown in Figure 4.
5.2.7. Conduct Analysis and Provide Recommendations
An eco-friendliness assessment not only determines the EFL of an enterprise but also, and most importantly, helps managers assess distinctive competencies and identify the principal adverse factors for possible future implementation of an appropriate plan for enhancing the EFL.
The purpose of green providers is to determine and provide the entire eco-friendly behavior set of an enterprise. For the purpose of identifying principal obstacles and enhancing the EFL, an FIEI, which comprises low merit ratings and the high average relation weight of green providers, represents an effect that contributes to improving the eco-friendliness of a supply chain. A higher FIEI indicates a higher degree of contribution for a particular factor. Thus, the FIEI score of a factor is used for identifying principal adverse factors. Hence, for obtaining the factor with the lowest merit rating and the highest average relation weight for each eco-friendly provider k, the fuzzy index for FIEIk is defined as
where [(1, 1, 1) θ FMGPk]; FMGPk denotes the fuzzy merit of the kth green provider; and FARWGPCk denotes the fuzzy average relation weight of the kth green providers for all green capabilities.
Because the GSCM integrated capability index level of EA Optronics was “Very Eco-friendly”, it had an EFL merit of 0.51–0.81, which is far from the “Extremely Eco-friendly” objective, obstacles within the organization affect or hinder EA Optronics from achieving the “Extremely Eco-friendly” rating. For identifying obstacles, 10 FIEIs are obtained (Table 6) by solving Equation (12).
By applying the left-and-right fuzzy ranking method developed by Chen and Hwang [49], the 10 FIEIs were defuzzified (Table 6). These indices represent the effect of each provider contributing to the GSCM integrated capability index level of EA Optronics. To focus their attention on a few critical factors, based on the Pareto principle, the committee set the scale to 0.4 as the management threshold for identifying factors for improvement. As shown in Table 6, the performance of three providers did not meet the threshold: (a) internal environmental audits; (b) long-term contracts incorporated with environmental dimensions; and (c) the promotion of an environmentally conscious culture. These providers exhibit the greatest potential for enhancing supply chain eco-friendliness. In considering the features of the obstacles within the company, a corrective action plan was suggested by the committee to implement in order to overcome these obstacles and to stimulate and enhance EA Optronics EFL.
Through a series of improvement projects (three years and six cycles), EA Optronics incorporated long-term contracts with environmental dimensions, promoted total environmental consciousness, strictly implemented internal environmental audits, continued to develop low-carbon products by using innovative production methods, and led the supply chain in adopting a sustainable production model based on the concepts of energy conservation and low carbon emissions, thereby raising the supply chain EFL to nearly the “Extremely Eco-friendly” level. Furthermore, EA Optronics was awarded the Oekom Research AG “prime” status, making it the leader of ethical evaluation for companies, ahead of international enterprises such as Hitachi, Kyocera, Nikon, and Samsung. The tangible benefits were average sales increases by 1.0%, 8.8%, and 0.5% in the past three years and an ascent in the global rankings, especially in the market for liquid-crystal panel displays.
6. Discussion and Conclusions
The eco-friendliness is perceived as the dominant competitive vehicle in enterprise. To effectively achieve eco-friendliness, it is crucial for enterprises to deploy and align GSCM drivers in business environment, green capabilities and providers to ensure that green providers can consistently satisfy green capabilities and cope with GSCM drivers and transforming them into strategic competitive advantages. Although the critical concepts and steps for achieving eco-friendliness have been identified, a systematic tool remains ineffective for converting strategies into actions and addressing issues pertaining to the interface among these steps. Many approaches concerning eco-friendly development are constructed in nature. Conventional (crisp) evaluation approaches are ineffective for addressing such ambiguous relationships among GSCM drivers, green capabilities and green providers. To offset the shortcomings of complexities and vagueness concerning addressed relationships, this study proposed a fuzzy QFD-based framework to connect and address issues regarding the interface and coordination among green providers, capabilities, and drivers. The proposed method provides a novel systematic structure to convert GSCM drivers in the business environment into the green capabilities requirement, and green providers (items for actions). Furthermore, for measuring the EFL of an enterprise, an FGICI comprising green capability ratings and its total relation weights with GSCM drivers was developed in this report. An eco-friendliness development project in a Taiwanese electronics enterprise was described in this study to show how the proposed method can be applied. After the development and evaluation stages, the proposed framework and procedures were considered to be capable of enhancing the EFL of an enterprise as well as ensuring an enterprise’s competitive advantage.
The developed method used the FLQFDEFEM for assessment. According to the comments from this case study, compared to the method that was used to resolve certain problems in traditional strategic business planning (including eco-friendly enterprise development) methods, several advantages were found:
- The method provides an integrative and systemic procedure for eco-friendly operational strategic planning and is not merely a method for measuring the EFL. The eco-friendly operational strategic planning is a complex decision-making process, not merely as isolated technology islands within the company, requiring careful consideration of various performance criteria. The FLQFDEFEM procedure leading from market requirements to identify the GSCM drivers, according to the characteristic of drivers to select and deploy the capabilities needed, ultimately determines the appropriate providers. Thus, the method can ensure that value can be maximised and competitive threat minimized. The results of the study also indicated that to be truly eco-friendly, an enterprise must logically integrate and deploy a number of distinguishing providers with drivers and good capabilities, being finally transformed into strategic competitive edges.
- The method is able to provide more convincing, informative, and reliable results for researchers, compared to traditional multiple criteria decision-making methods. The FGICI is expressed in a range of values (as shown in Figure 4). Such values enable researchers to make unbiased decisions and to make the organization’s managers buy into such belief.
- The method provides a very useful source of information for practitioners that seek to implement GSCM systems. It yields a dynamic reference linking the business strategy to a firm’s environment and provides detailed information for implementation through continuous improvements.
There are some limitations to the fuzzy logic approach, and even the case study has demonstrated the usefulness of the model for defining, aligning, measuring, and improving eco-friendliness in the business strategic planning. The membership function of natural-language expression depends on the managerial perspective of the decision-maker. The decision-maker must be at a strategic level in the company in order to realize the importance and trends of all aspects, such as strategy, marketing, technology, and manufacturing. Furthermore, company features and industrial profiles vary by enterprises (e.g., Samsung (Seoul, Korea) and EA Optronics)—for example, electronics- and motor-related manufacturing firms. Hence, a company must establish unique membership functions that are specific to its own environment and considerations. Moreover, the list and distinction of GSCM drivers, capabilities, and providers are merely presented as they were assessed in this research as the most prevalent and meaningful factors in the case study. Hence, it is still a relatively novel concept that has not been widely discovered in the industry. The computation of a fuzzy weighted average can be complex and is not easily comprehended by managers. However, this calculation approach was computerized to increase its accuracy while reducing both computational time and errors. Furthermore, the strategic intent to become eco-friendly and increase in core competencies for the purpose of gaining a competitive advantage are essential for a company. Every company should understand its circumstances, the threats it receives from the business environment, and the opportunities that would enable the company to succeed.
Acknowledgments
The authors wish to express appreciation to the editor and two anonymous reviewers for their valuable suggestions, Marshall Kusumoto and Chia-Chien Hsu for their editorial assistance, the company managers for their cooperation and the Ministry of Science and Technology of Taiwan for its financial support (MOST 104-2221-E-212-006-MY2).
Author Contributions
Ching-Torng Lin contributed to designing this study, the framework of the FLQFDEFEM, and the fuzzy green integrated capability index model developed in addition to drafting the paper. Yu-Hsuan Chang carried out the literature review, performed data collection, processing and analyzing, and results discussion. Chuanmin Mi carried out the literature review and results discussion.
Conflicts of Interest
The authors declare there are no conflicts of interest.
References
- Wu, K.J.; Liao, C.J.; Tseng, M.L.; Chiu, A.S.F. Exploring decisive factors in green supply chain practices under uncertainty. Int. J. Prod. Econ. 2015, 159, 147–157. [Google Scholar] [CrossRef]
- Kuei, C.H.; Madu, C.N.; Wing, S.; Chow, W.S.; Chen, Y. Determinants and associated performance improvement of green supply chain management in China. J. Clean. Prod. 2015, 95, 163–173. [Google Scholar] [CrossRef]
- George, K.; Nikos, V. Stakeholder pressures and environmental performance. Acad. Manag. J. 2006, 49, 145–159. [Google Scholar]
- Sheu, J.S. Green supply chain collaboration for fashionable consumer electronics products under third-party power intervention—A resource dependence perspective. Sustainability 2014, 6, 2832–2875. [Google Scholar] [CrossRef]
- Schöggl, J.P.; Fritz, M.; Baumgartner, R.J. Sustainability Assessment in Automotive and Electronics Supply Chains—A Set of Indicators Defined in a Multi-Stakeholder Approach. Sustainability 2016, 8, 1185. [Google Scholar] [CrossRef]
- Ahi, P.; Searcy, C. An analysis of metrics used to measure performance in green and sustainable supply chains. J. Clean. Prod. 2015, 86, 360–377. [Google Scholar] [CrossRef]
- Tseng, M.L.; Chiu, A.S. Evaluating firm’s green supply chain management in linguistic preferences. J. Clean. Prod. 2013, 40, 22–31. [Google Scholar] [CrossRef]
- Liu, C.C.; Yu, Y.H.; Wernick, I.K.; Chang, C.Y. Using the electronic industry code of conduct to evaluate green supply chain management: An empirical study of Taiwan’s computer industry. Sustainability 2015, 7, 2787–2803. [Google Scholar] [CrossRef]
- Tippayawong, K.Y.; Niyomyat, N.; Sopadang, A.; Ramingwong, S. Factors Affecting Green Supply Chain Operational Performance of the Thai Auto Parts Industry. Sustainability 2016, 8, 1161. [Google Scholar] [CrossRef]
- Handfield, R.B.; Walton, S.V.; Goizueta, R.C.; Seegers, L.K.; Melnyk, S.A. Green supply chain: Best practices from the furniture industry. In Proceedings of the 27th Annual Conference Decision Sciences Institute, New York, NY, USA, 24–26 November 1996; pp. 1295–1297. [Google Scholar]
- Hagelaar, G.J.L.F.; Van der Vorst, J.G.A.J. Environmental supply chain management: Using life cycle assessment to structure supply chains. Int. Food Agribus. Manag. Rev. 2002, 4, 399–412. [Google Scholar] [CrossRef]
- Zhu, Q.; Sarkis, J.; Lai, K.H. Confirmation of a measurement model for green supply chain management practices implementations. Int. J. Prod. Econ. 2008, 111, 261–273. [Google Scholar] [CrossRef]
- Youn, S.; Yang, M.G.; Hong, P.; Park, K. Strategic supply chain partnership, environmental supply chain management practices, and performance outcomes: An empirical study of Korean firms. J. Clean. Prod. 2013, 56, 121–130. [Google Scholar] [CrossRef]
- Hervani, A.A.; Helms, M.M.; Sarkis, J. Performance measurement for green supply chain management. Benchmarking Int. J. 2005, 12, 330–353. [Google Scholar] [CrossRef]
- Li, S.; Ragu-Nathan, B.; Ragu-Nathan, T.S.; Rao, S.S. The impact of supply chain management practices on competitive advantage and organizational performance. Omega 2006, 34, 107–124. [Google Scholar] [CrossRef]
- Bhagwat, R.; Sharma, M.K. Performance measurement of supply chain management: A balanced scorecard approach. Comput. Ind. Eng. 2007, 53, 43–62. [Google Scholar] [CrossRef]
- Lin, R.J. Using fuzzy DEMATEL to evaluate the green supply chain management practices. J. Clean. Prod. 2013, 40, 32–39. [Google Scholar] [CrossRef]
- Wheelwright, S.C.; Hayes, R.H. Restoring our Competitive Edge: Competing Through Manufacturing; John Wiley & Sons: New York, NY, USA, 1984. [Google Scholar]
- Azevedo, S.G.; Carvalho, H.; Machado, V.C. The influence of green practices on supply chain performance: A case study approach. Transp. Res. Part E 2011, 47, 850–871. [Google Scholar] [CrossRef]
- Cao, O.; Schniederjans, M.J. Empirical study of the relationship between operations strategy and information systems strategic orientation in an e-commerce environment. Int. J. Prod. Res. 2004, 42, 2915–2939. [Google Scholar] [CrossRef]
- Lin, B.; Jones, C.A.; Hsieh, C. Environmental practices and assessment: A process perspective. Ind. Manag. Data Syst. 2001, 101, 71–80. [Google Scholar] [CrossRef]
- Bottani, E. A fuzzy QFD approach to achieve agility. J. Prod. Econ. 2009, 119, 380–391. [Google Scholar] [CrossRef]
- Walker, H.; Sisto, L.D.; McBain, D. Drivers and barriers to environmental supply chain management practices: Lessons from the public and private sectors. J. Purchas. Supply Manag. 2008, 14, 69–85. [Google Scholar] [CrossRef]
- Chen, Y.S. The driver of green innovation and green image—Green core competence. J. Bus. Ethics 2008, 81, 531–543. [Google Scholar] [CrossRef]
- Bai, C.; Sarkis, J. Green supplier development: Analytical evaluation using rough set theory. J. Clean. Prod. 2010, 18, 1200–1210. [Google Scholar] [CrossRef]
- Olugu, E.U.; Wong, K.Y.; Shaharoun, A.M. Development of key performance measures for the automobile green supply chain. Resour. Conserv. Recycl. 2011, 55, 567–579. [Google Scholar] [CrossRef]
- Chardine-Baumann, E.; Botta-Genoulaz, V. A framework for sustainable performance assessment of supply chain management practices. Comput. Ind. Eng. 2014, 76, 138–147. [Google Scholar] [CrossRef]
- Govindan, K.; Diabat, A.; Shankar, K.M. Analyzing the drivers of green manufacturing with fuzzy approach. J. Clean. Prod. 2015, 96, 182–193. [Google Scholar] [CrossRef]
- Govindan, K.; Khodaverdi, R.; Vafadarnikjoo, A. Intuitionistic fuzzy based DEMATEL method for developing green practices and performances in a green supply chain. Expert Syst. Appl. 2015, 42, 7207–7220. [Google Scholar] [CrossRef]
- Mirhedayatian, S.M.; Azadi, M.; Saen, R.F. A novel network data envelopment analysis model for evaluating green supply chain management. Int. J. Prod. Econ. 2014, 147, 544–554. [Google Scholar] [CrossRef]
- Mollenkopf, D.; Stolze, H.; Tate, W.L.; Ueltschy, M. Green, lean, and global supply chains. Int. J. Phys. Distrib. Logist. Manag. 2010, 40, 14–41. [Google Scholar] [CrossRef]
- Shang, K.C.; Lu, C.S.; Li, S. A taxonomy of green supply chain management capability among electronics-related manufacturing firms in Taiwan. J. Environ. Manag. 2010, 91, 1218–1226. [Google Scholar] [CrossRef] [PubMed]
- Tseng, M.L. Green supply chain management with linguistic preferences and incomplete information. Appl. Soft Comput. 2011, 11, 4894–4903. [Google Scholar] [CrossRef]
- Dubey, R.; Gunasekaran, A.; Papadopoulos, T.; Childe, S.J. Green supply chain management enablers: Mixed methods research. Sustain. Prod. Consum. 2015, 4, 72–88. [Google Scholar] [CrossRef]
- Sarkis, J. A strategic decision framework for green supply chain management. J. Clean. Prod. 2003, 11, 397–409. [Google Scholar] [CrossRef]
- Rao, P.; Holt, D. Do green supply chains lead to competitiveness and economic performance? Int. J. Oper. Prod. Manag. 2005, 25, 898–916. [Google Scholar] [CrossRef]
- Kowalska, M.; Pazdzior, M.; Krzton-Maziopa, A. Implementation of QFD method in quality analysis of confectionery products. J. Intell. Manuf. 2015. [Google Scholar] [CrossRef]
- Kim, S.H.; Jang, D.H.; Lee, D.H.; Cho, S.H. A methodology of constructing a decision path for IT investment. J. Strateg. Inf. Syst. 2000, 9, 17–38. [Google Scholar] [CrossRef]
- Chang, T.H.; Wang, T.C. Using the fuzzy multi-criteria decision making approach for measuring the possibility of successful knowledge management. Inf. Sci. 2009, 179, 355–370. [Google Scholar] [CrossRef]
- Tseng, Y.H.; Lin, C.T. Enhancing enterprise agility by deploying agile drivers, capabilities and providers. Inf. Sci. 2011, 181, 3693–3708. [Google Scholar] [CrossRef]
- Klir, G.J.; St Clair, U.; Yuan, B. Fuzzy Set Theory: Foundations and Applications; Prentice-Hall, Inc.: Upper Saddle River, NJ, USA, 1997. [Google Scholar]
- Pedrycz, W. Why triangular membership functions? Fuzzy Sets Syst. 1994, 64, 21–30. [Google Scholar] [CrossRef]
- Yen, J.; Langari, R. Fuzzy Logic: Intelligence, Control and Information; Prentice-Hall: Upper Saddle River, NJ, USA, 1999. [Google Scholar]
- Aqlan, F.; Lam, S.S. A fuzzy-based integrated framework for supply chain risk assessment. Int. J. Prod. Econ. 2015, 161, 54–63. [Google Scholar] [CrossRef]
- Lin, C.T.; Chen, C.T. A fuzzy-logic-based approach for new product Go/No-Go evaluation at the front end. IEEE Trans. Syst. Man Cybern. Part A Syst. Hum. 2004, 34, 132–142. [Google Scholar] [CrossRef]
- Wu, W.W. Segmenting critical factors for successful knowledge management implementation using the fuzzy DEMATEL method. Appl. Soft Comput. 2012, 12, 527–535. [Google Scholar] [CrossRef]
- Lee, D.H.; Park, D. An efficient algorithm for fuzzy weighted average. Fuzzy Sets Syst. 1997, 87, 39–45. [Google Scholar] [CrossRef]
- Kao, C.; Liu, S.T. Fractional programming approach to fuzzy weighted average. Fuzzy Sets Syst. 2001, 120, 435–444. [Google Scholar] [CrossRef]
- Chen, S.J.; Hwang, C.L. Fuzzy Multiple Attribute Decision Making Methods and Applications; Springer: Berlin/Heidelberg, Germany, 1992. [Google Scholar]
- Lee, K.H.; Lee, J.H. A method for ranking fuzzy numbers and its application to decision-making. IEEE Trans. Fuzzy Syst. 1999, 7, 677–685. [Google Scholar]
- Karwowski, W.; Mital, A. Applications of approximate reasoning in risk analysis. In Applications of Fuzzy Set Theory in Human Factors; Karwowski, W., Mital, A., Eds.; Elsevier: Amsterdam, The Netherlands, 1986. [Google Scholar]
- Dubois, D.; Prade, H. Possibility Theory—An Approach to Computerized Processing of Uncertainty; Plenum: New York, NY, USA, 1988. [Google Scholar]
- Miller, G.A. The magic number seven, plus or minus seven. Psychol. Rev. 1965, 63, 81–97. [Google Scholar] [CrossRef]
- Guesgen, H.W.; Albrecht, J. Imprecise reasoning in geographic information systems. Fuzzy Sets Syst. 2000, 113, 121–131. [Google Scholar] [CrossRef]
Figure 1.
A conceptual framework for an eco-friendly enterprise.

Figure 2.
Framework for deploying and aligning green supply chain drivers, capabilities, and providers.
Figure 2.
Framework for deploying and aligning green supply chain drivers, capabilities, and providers.

Figure 3.
Method for evaluating and achieving an eco-friendly enterprise

Figure 4.
Linguistic levels for matching the fuzzy eco-friendly index {Non-eco-friendly (NEF) (0, 0.15, 0.3); Slightly Eco-friendly (SEF) (0.15, 0.3, 0.45); Eco-friendly (EF) (0.3, 0.45, 0.6); Highly Eco-friendly (HEF) (0.4, 0.55, 0.7); Very Eco-friendly (VEF) (0.55, 0.7, 0.85); Extremely Eco-friendly (EEF) (0.7, 0.85, 1.0)}.


Table 1.
Linguistic variables and their associating fuzzy numbers.
| Important Levels | Merit Ratings | Relationship Levels | |||
|---|---|---|---|---|---|
| Linguistic Variable | Fuzzy Number | Linguistic Variable | Fuzzy Number | Linguistic Variable | Fuzzy Number |
| Extremely Low (EL) | (0, 0.05, 0.15) | Worst (W) | (0, 0.05, 0.15) | Very Low (VL) | (0, 0.1, 0.2) |
| Very Low (VL) | (0.1, 0.2, 0.3) | Very Poor (VP) | (0.1, 0.2, 0.3) | Low (L) | (0.1, 0.25, 0.4) |
| Low (L) | (0.2, 0.35, 0.5) | Poor (P) | (0.2, 0.35, 0.5) | Fair (F) | (0.3, 0.5, 0.7) |
| Fair (F) | (0.3, 0.5, 0.7) | Fair (F) | (0.3, 0.5, 0.7) | High (H) | (0.6, 0.75, 0.9) |
| High (H) | (0.5, 0.65, 0.8) | Good (G) | (0.5, 0.65, 0.8) | Very High (VH) | (0.8, 0.9, 1.0) |
| Very High (VH) | (0.7, 0.8, 0.9) | Very Good (VG) | (0.7, 0.8, 0.9) | ||
| Extremely High (EH) | (0.85, 0.95, 1.0) | Excellent (E) | (0.85, 0.95, 1.0) | ||
Table 2.
Green drivers, capabilities, and providers for deployment and measurement.
| Green Drivers | Green Capabilities | Green Providers |
|---|---|---|
| Organization values (GD1) | Green manufacturing and packaging (GC1) | Adapt to develop environmentally friendly production operations (GP1) |
| Environmental risk minimization (GD2) | Ecodesign (GC2) | Engage in environmental collaboration with suppliers/customers (GP2) |
| Regulatory compliance (GD3) | Environmentally friendly purchasing (GC3). | Promote an environmentally conscious culture (GP3) |
| Pressure from nongovernmental organizations (GD4) | Environmental participation (GC4) | Environmental monitoring of suppliers (GP4) |
| Pressure/encouragement from customers (GD5) | Green marketing (GC5) | Information sharing on environmental topics (GP5) |
| Pressure from competitors’ green strategies (GD6) | Internal environmental audits (GP6) | |
| Environmental partnership with suppliers (GD7) | Integrating environmental management into planning and operation (GP7) | |
| Engaging in cross-functional and supplier cooperation for mitigating environmental impacts (GP8) | ||
| Focusing on an environmentally conscious design and life cycle assessment (GP9) | ||
| Long-term contracts incorporated with environmental dimensions (GP10) |
Table 3.
Green capabilities against with drivers: eco-friendly strategies deployment matrix.
| Green Capabilities | ||||||||
|---|---|---|---|---|---|---|---|---|
| GC1 | GC2 | GC3 | GC4 | GC5 | ||||
| Merits of Green Capabilities | VG | G | VG | G | F | |||
| Important-Level | ||||||||
| GSCM drivers | GD1 | H | H | VH | H | H | VH | |
| GD2 | VH | VH | VH | VH | H | F | ||
| GD3 | EH | VH | VH | H | H | VH | ||
| GD4 | VH | F | H | F | VH | VH | ||
| GD5 | EH | VH | H | H | VH | H | ||
| GD6 | VH | H | H | F | F | VH | ||
| GD7 | H | H | VH | VH | H | H | ||
Table 4.
Green providers connected with green capabilities: eco-friendly ingredient deployment matrix.
Table 4.
Green providers connected with green capabilities: eco-friendly ingredient deployment matrix.
| Merits of Green Providers | Green Providers | ||||||||||
|---|---|---|---|---|---|---|---|---|---|---|---|
| GP1 | GP2 | GP3 | GP4 | GP5 | GP6 | GP7 | GP8 | GP9 | GP10 | ||
| VG | G | F | E | VG | F | G | G | VG | F | ||
| Green capabilities | GC1 | VH | F | H | VH | H | VH | H | L | H | H |
| GC2 | H | H | VH | H | H | VH | VH | VH | VH | VH | |
| GC3 | VH | VH | F | VH | H | VH | F | VH | H | F | |
| GC4 | F | H | VH | F | VH | L | VH | L | F | H | |
| GC5 | H | VH | H | H | VH | H | H | H | H | VH | |
Table 5.
Fuzzy average relation weights of green capabilities and green providers
| Green Capabilities | Fuzzy Average Relation Weights | Green Providers | Fuzzy Average Relation Weights |
|---|---|---|---|
| GC1 | (0.64, 0.78, 0.93) | GP1 | (0.59, 0.76, 0.92) |
| GC2 | (0.69, 0.83, 0.96) | GP2 | (0.59, 0.75, 0.91) |
| GC3 | (0.54, 0.71, 0.88) | GP3 | (0.60, 0.76, 0.91) |
| GC4 | (0.60, 0.75, 0.90) | GP4 | (0.59, 0.76, 0.92) |
| GC5 | (0.66, 0.80, 0.94) | GP5 | (0.67, 0.81, 0.94) |
| GP6 | (0.58, 0.75, 0.91) | ||
| GP7 | (0.60, 0.76, 0.91) | ||
| GP8 | (0.42, 0.57, 0.72) | ||
| GP9 | (0.56, 0.70, 0.83) | ||
| GP10 | (0.60, 0.76, 0.92) |
Table 6.
Fuzzy enhance-importance indices of green providers.
| Green Providers | (1.0, 1.0, 1.0) θ FMGP | FARWGPCk | FIEIk | Ranking Scores |
|---|---|---|---|---|
| GP1 | (0.1, 0.2, 0.3) | (0.59, 0.76, 0.92) | (0.06, 0.15, 0.28) | 0.1948 |
| GP2 | (0.2, 0.35, 0.5) | (0.59, 0.75, 0.91) | (0.12, 0.26, 0.46) | 0.3101 |
| GP3 | (0.3, 0.5, 0.7) | (0.60, 0.76, 0.91) | (0.18, 0.38, 0.63) | 0.4145 |
| GP4 | (0.0, 0.05, 0.15) | (0.59, 0.76, 0.92) | (0.00, 0.04, 0.14) | 0.0855 |
| GP5 | (0.1, 0.2, 0.3) | (0.67, 0.81, 0.94) | (0.07, 0.16, 0.28) | 0.1999 |
| GP6 | (0.3, 0.5, 0.7) | (0.58, 0.75, 0.91) | (0.17, 0.38, 0.64) | 0.4391 |
| GP7 | (0.2, 0.35, 0.5) | (0.60, 0.76, 0.91) | (0.12, 0.27, 0.46) | 0.3134 |
| GP8 | (0.2, 0.35, 0.5) | (0.42, 0.57, 0.72) | (0.08, 0.20, 0.36) | 0.2469 |
| GP9 | (0.1, 0.2, 0.3) | (0.56, 0.70, 0.83) | (0.06, 0.14, 0.25) | 0.1788 |
| GP10 | (0.3, 0.5, 0.7) | (0.60, 0.76, 0.92) | (0.18, 0.38, 0.64) | 0.4174 |
© 2017 by the authors. Licensee MDPI, Basel, Switzerland. This article is an open access article distributed under the terms and conditions of the Creative Commons Attribution (CC BY) license (http://creativecommons.org/licenses/by/4.0/).
Share and Cite
MDPI and ACS Style
Lin, C.-T.; Chang, Y.-H.; Mi, C. Develop Eco-Friendly Enterprise: Aligning Enablers with Strategy. Sustainability 2017, 9, 570. https://doi.org/10.3390/su9040570
AMA Style
Lin C-T, Chang Y-H, Mi C. Develop Eco-Friendly Enterprise: Aligning Enablers with Strategy. Sustainability. 2017; 9(4):570. https://doi.org/10.3390/su9040570
Chicago/Turabian StyleLin, Ching-Torng, Yu-Hsuan Chang, and Chuanmin Mi. 2017. "Develop Eco-Friendly Enterprise: Aligning Enablers with Strategy" Sustainability 9, no. 4: 570. https://doi.org/10.3390/su9040570
Note that from the first issue of 2016, this journal uses article numbers instead of page numbers. See further details here.