
Spatial Open Data for Monitoring Risks and Preserving Archaeological Areas and Landscape: Case Studies at Kom el Shoqafa, Egypt and Shush, Iran


 , ,
, ,
Abstract
:1. Introduction
2. Study Areas
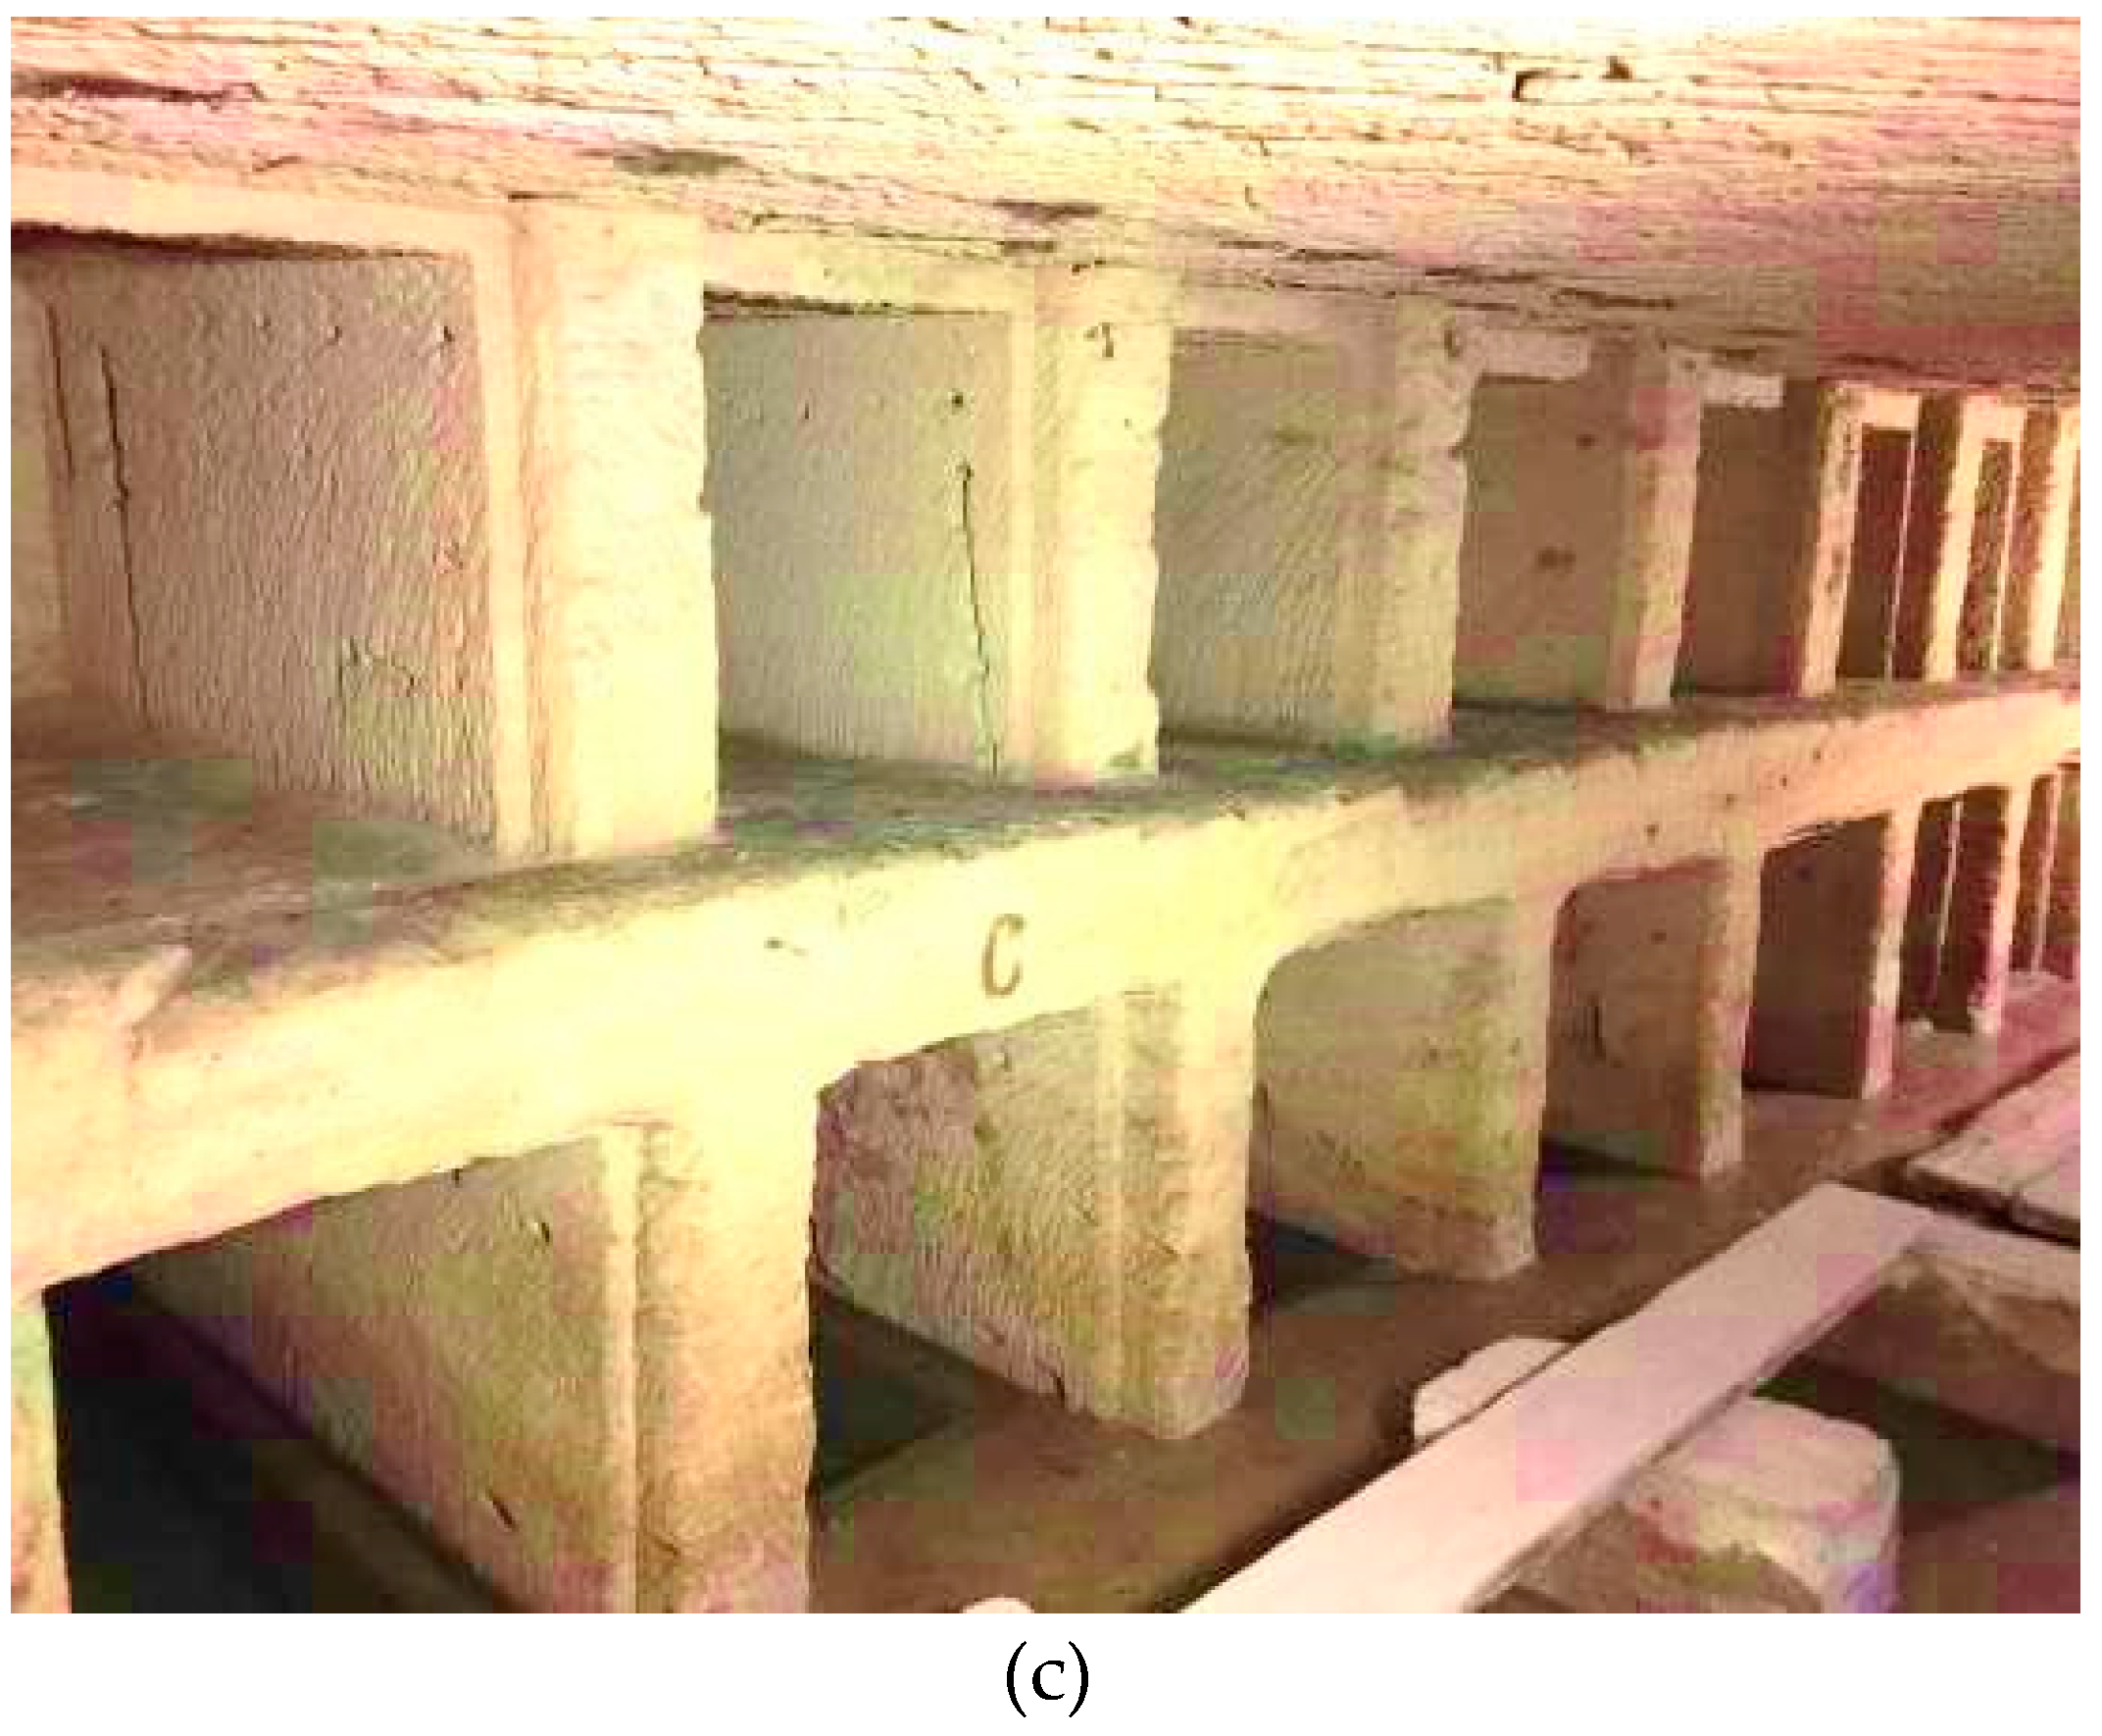
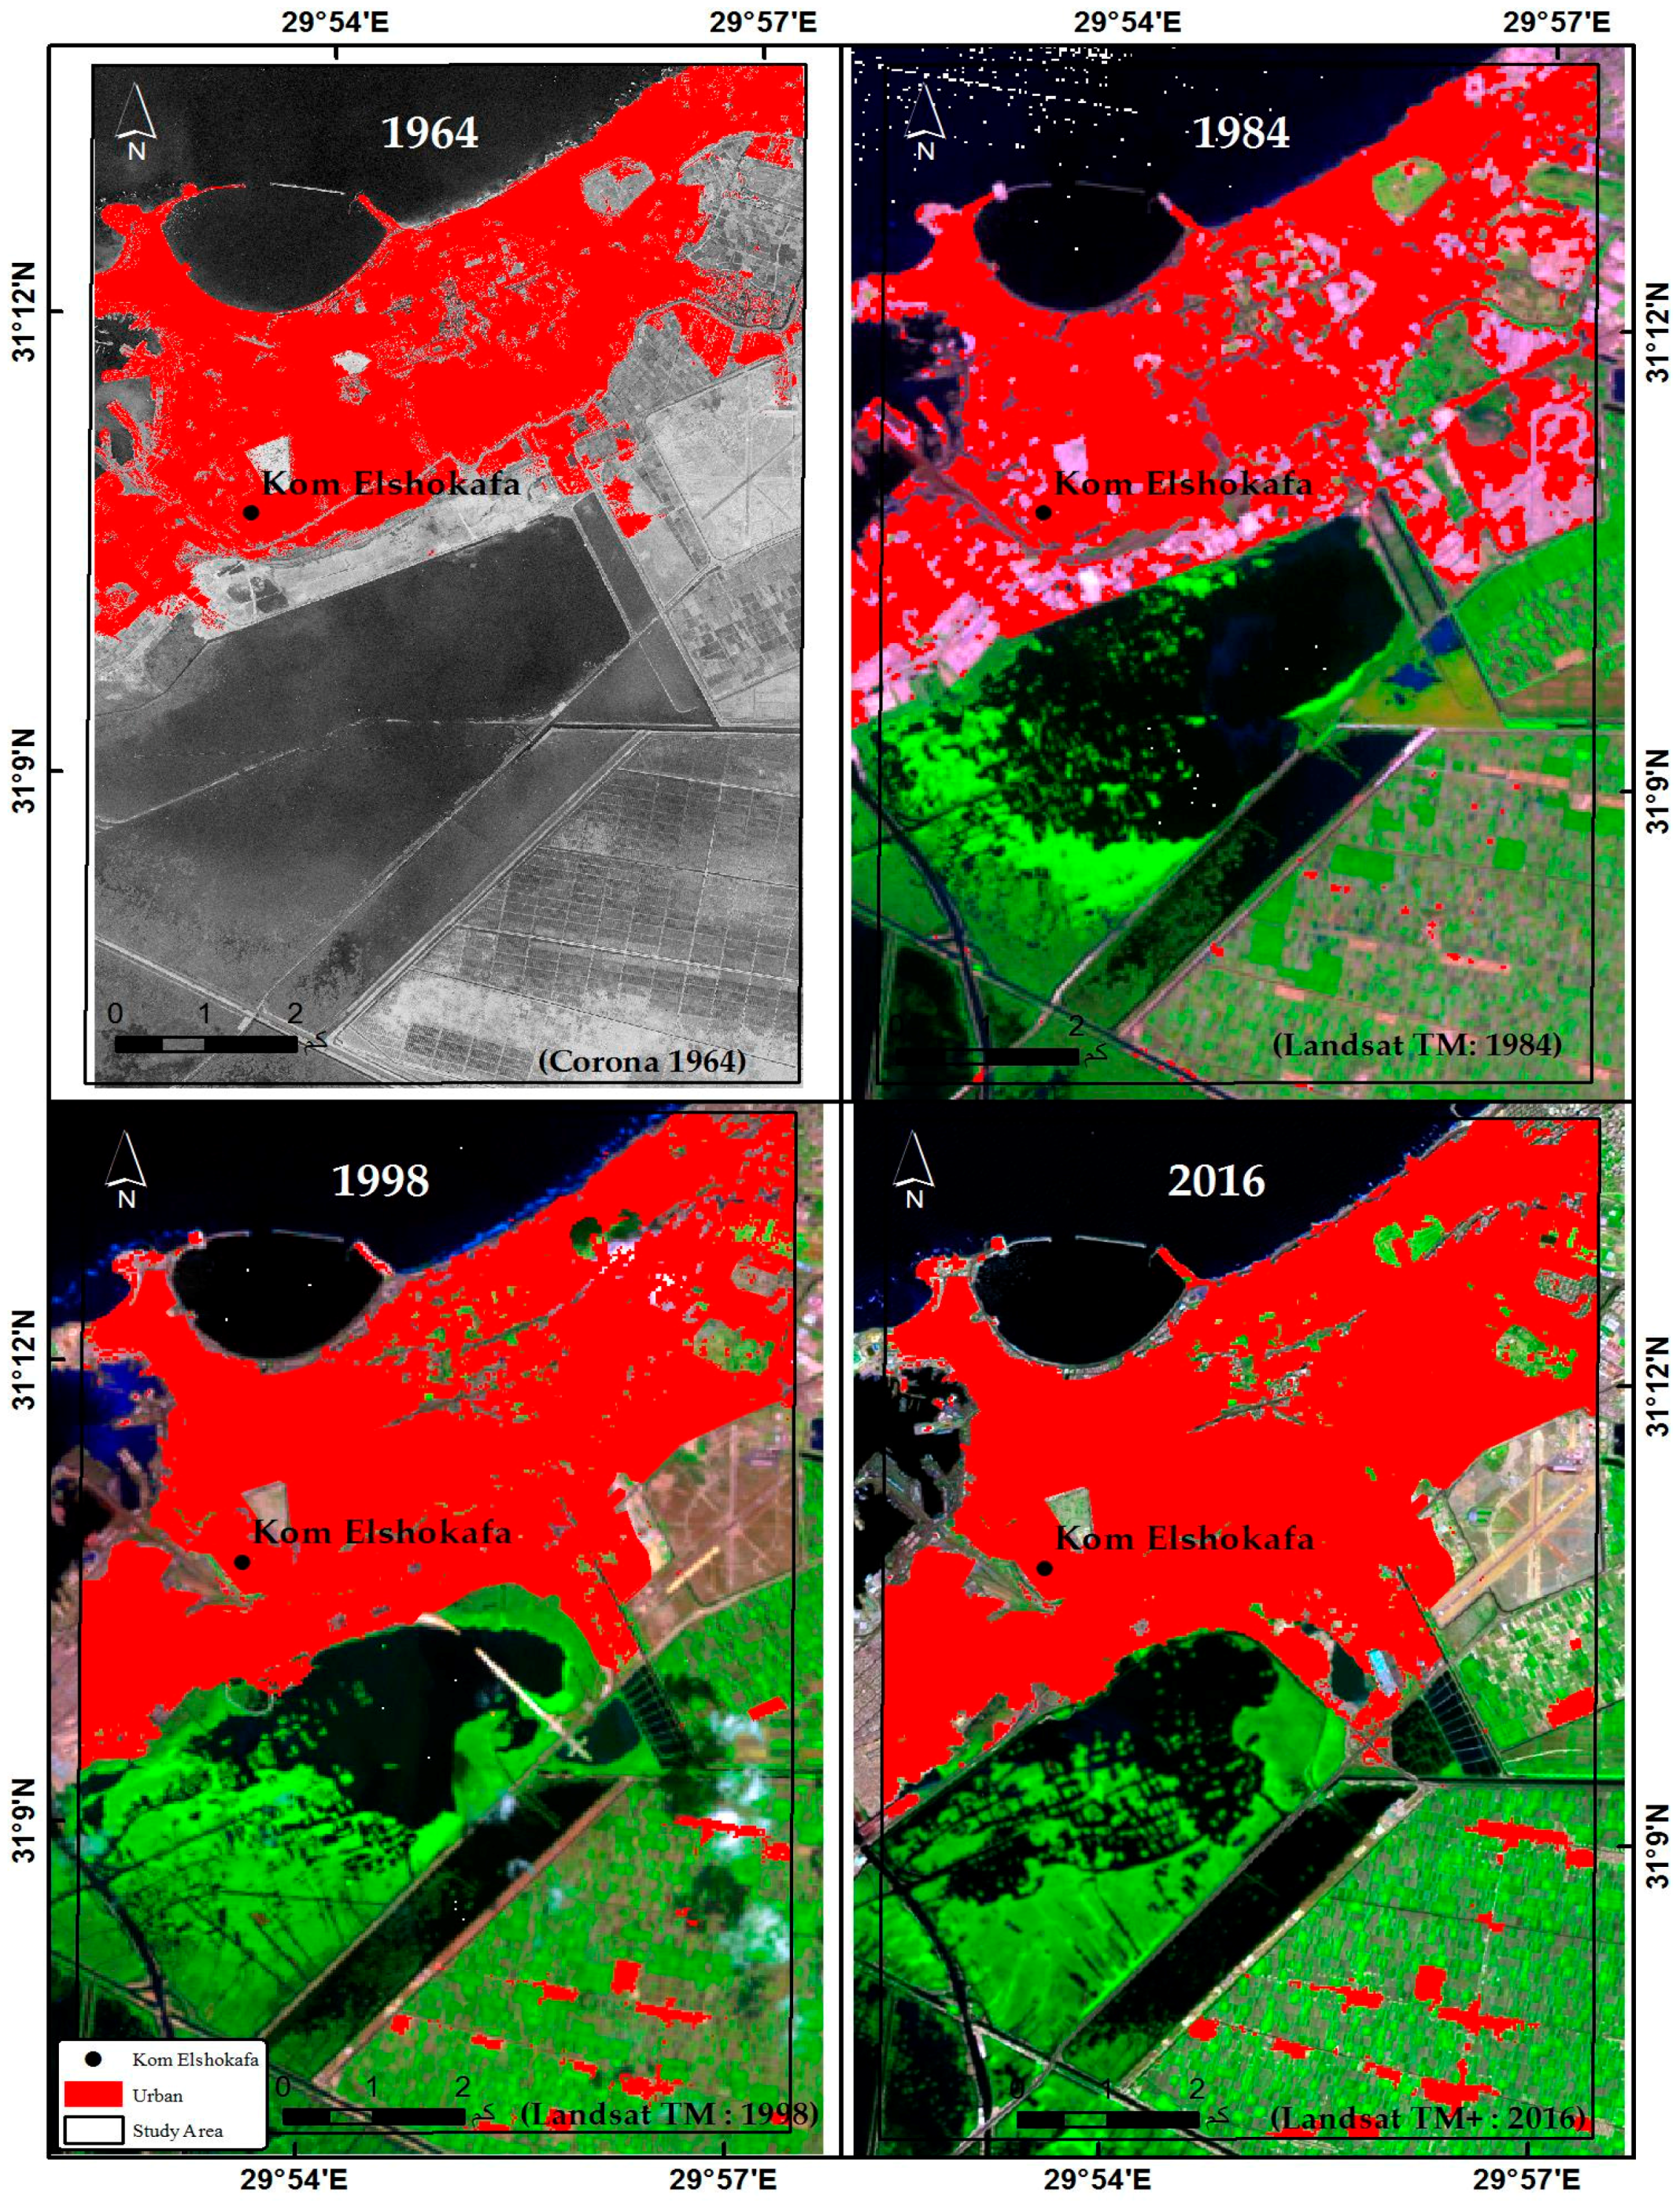
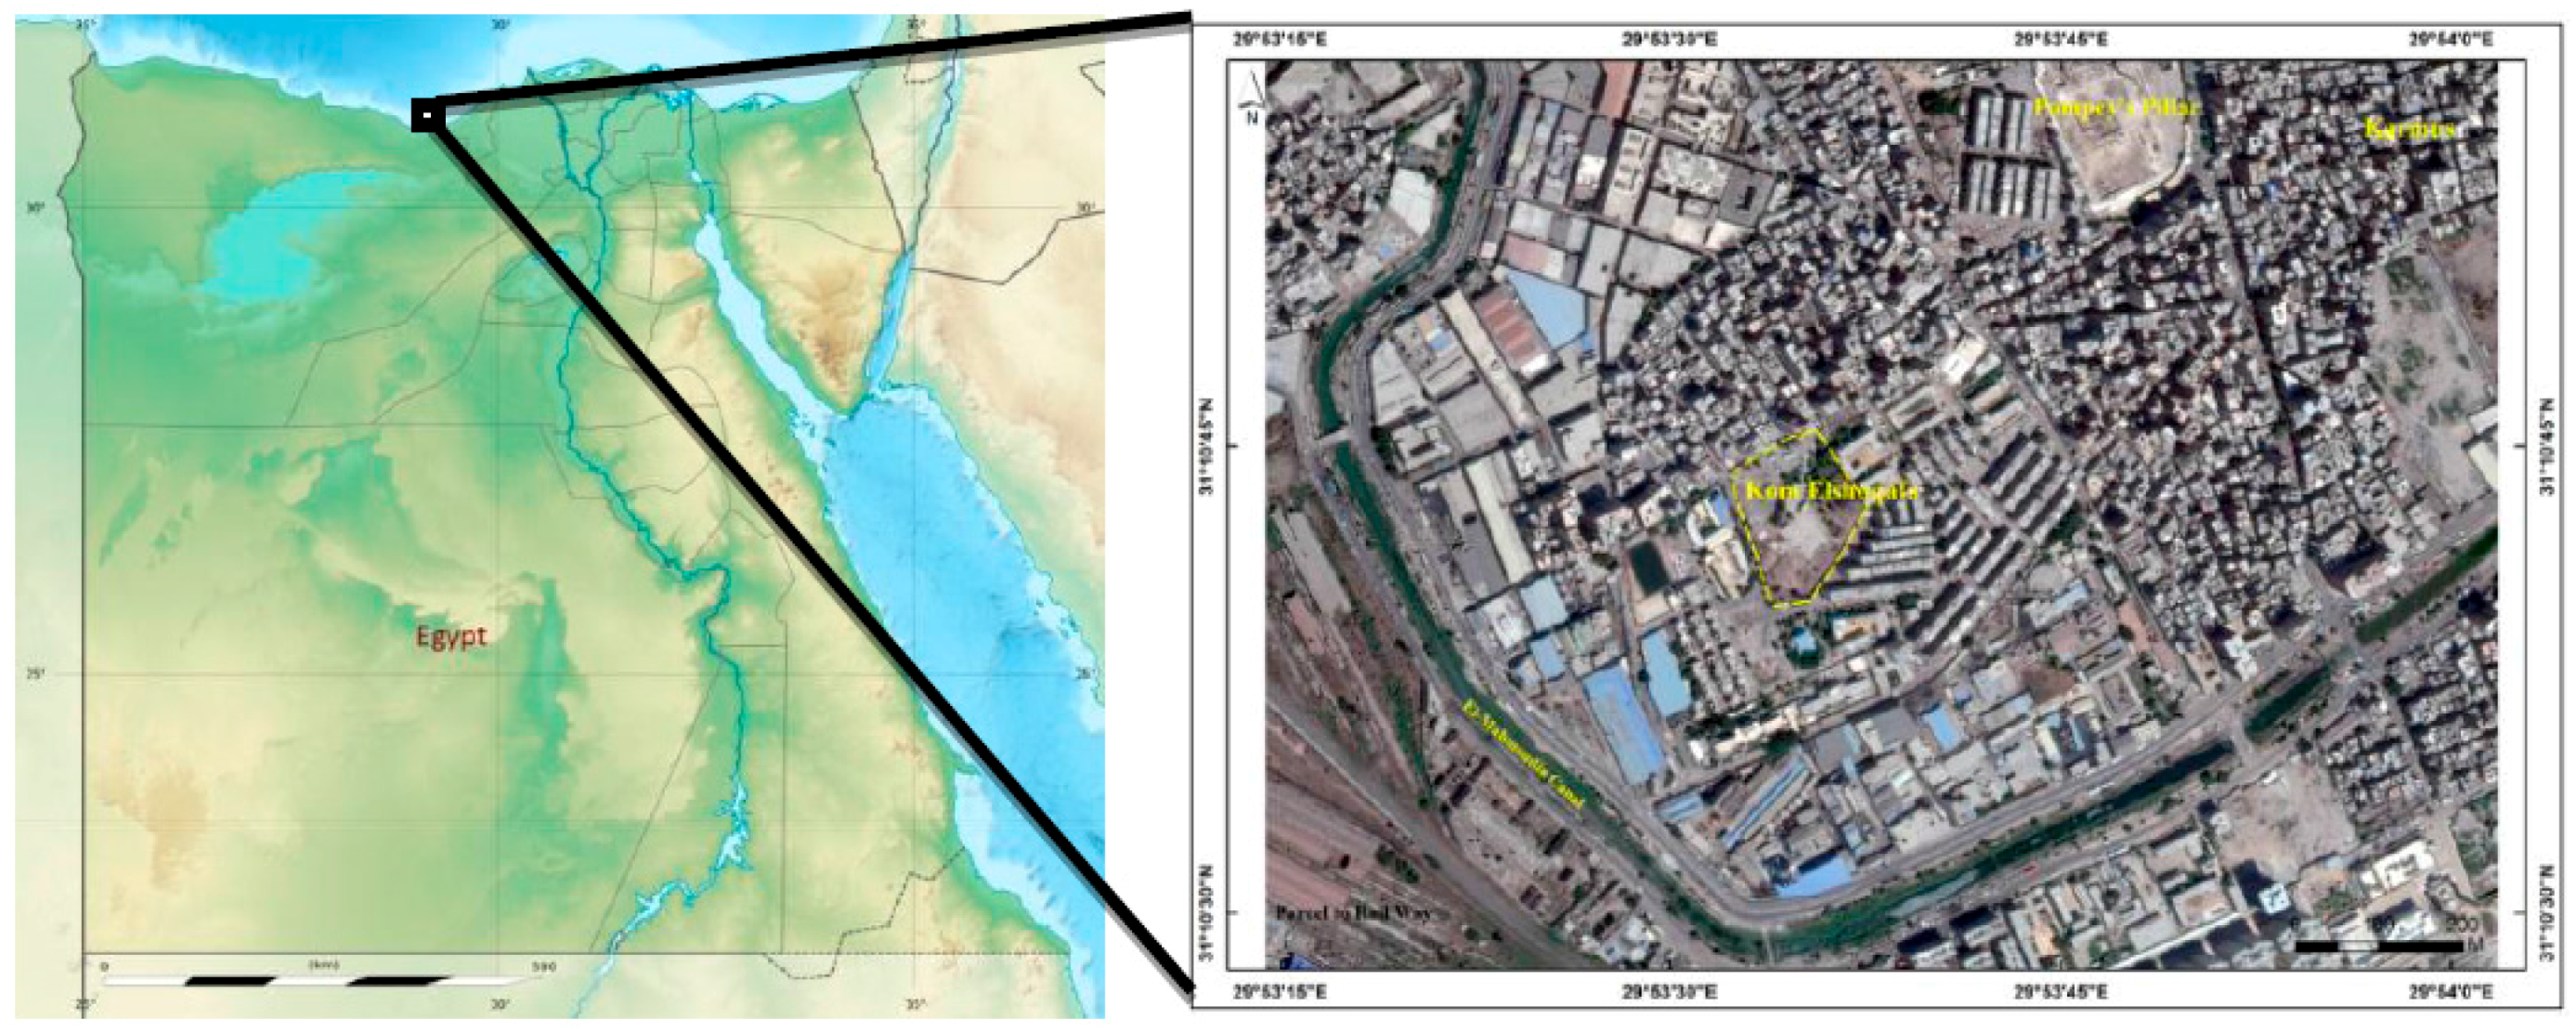
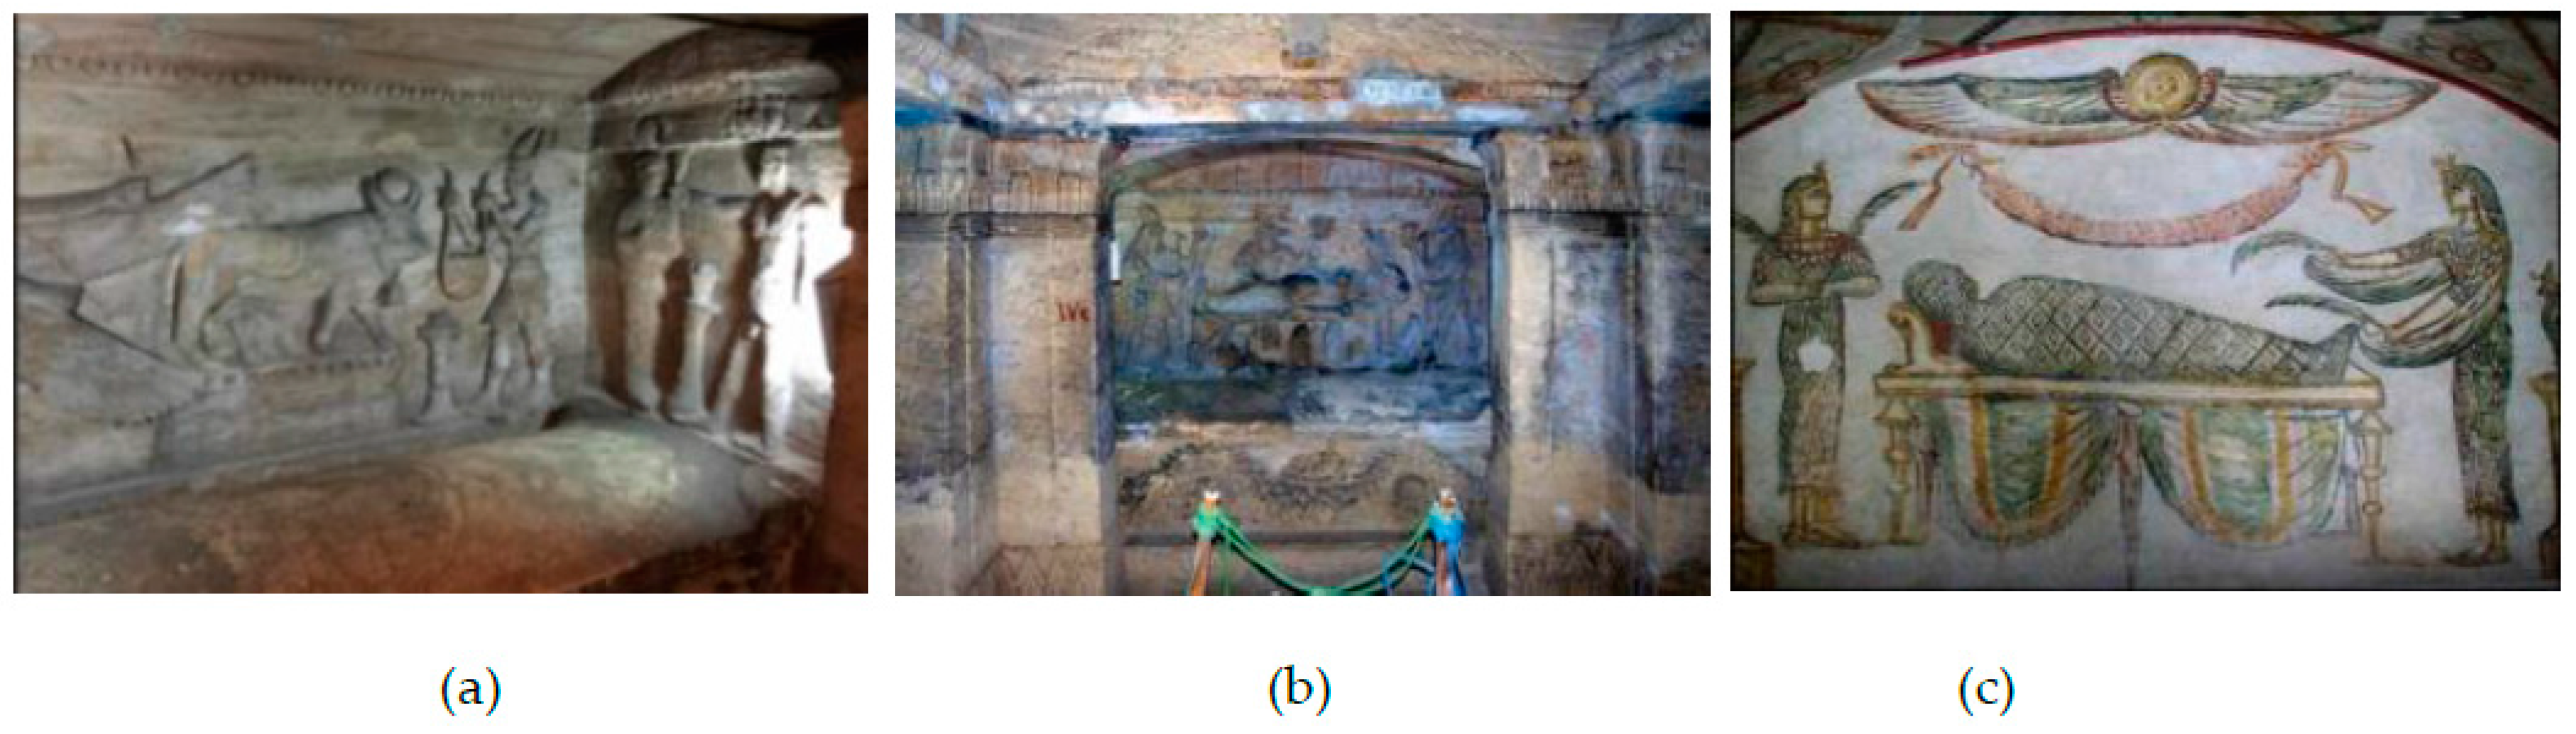
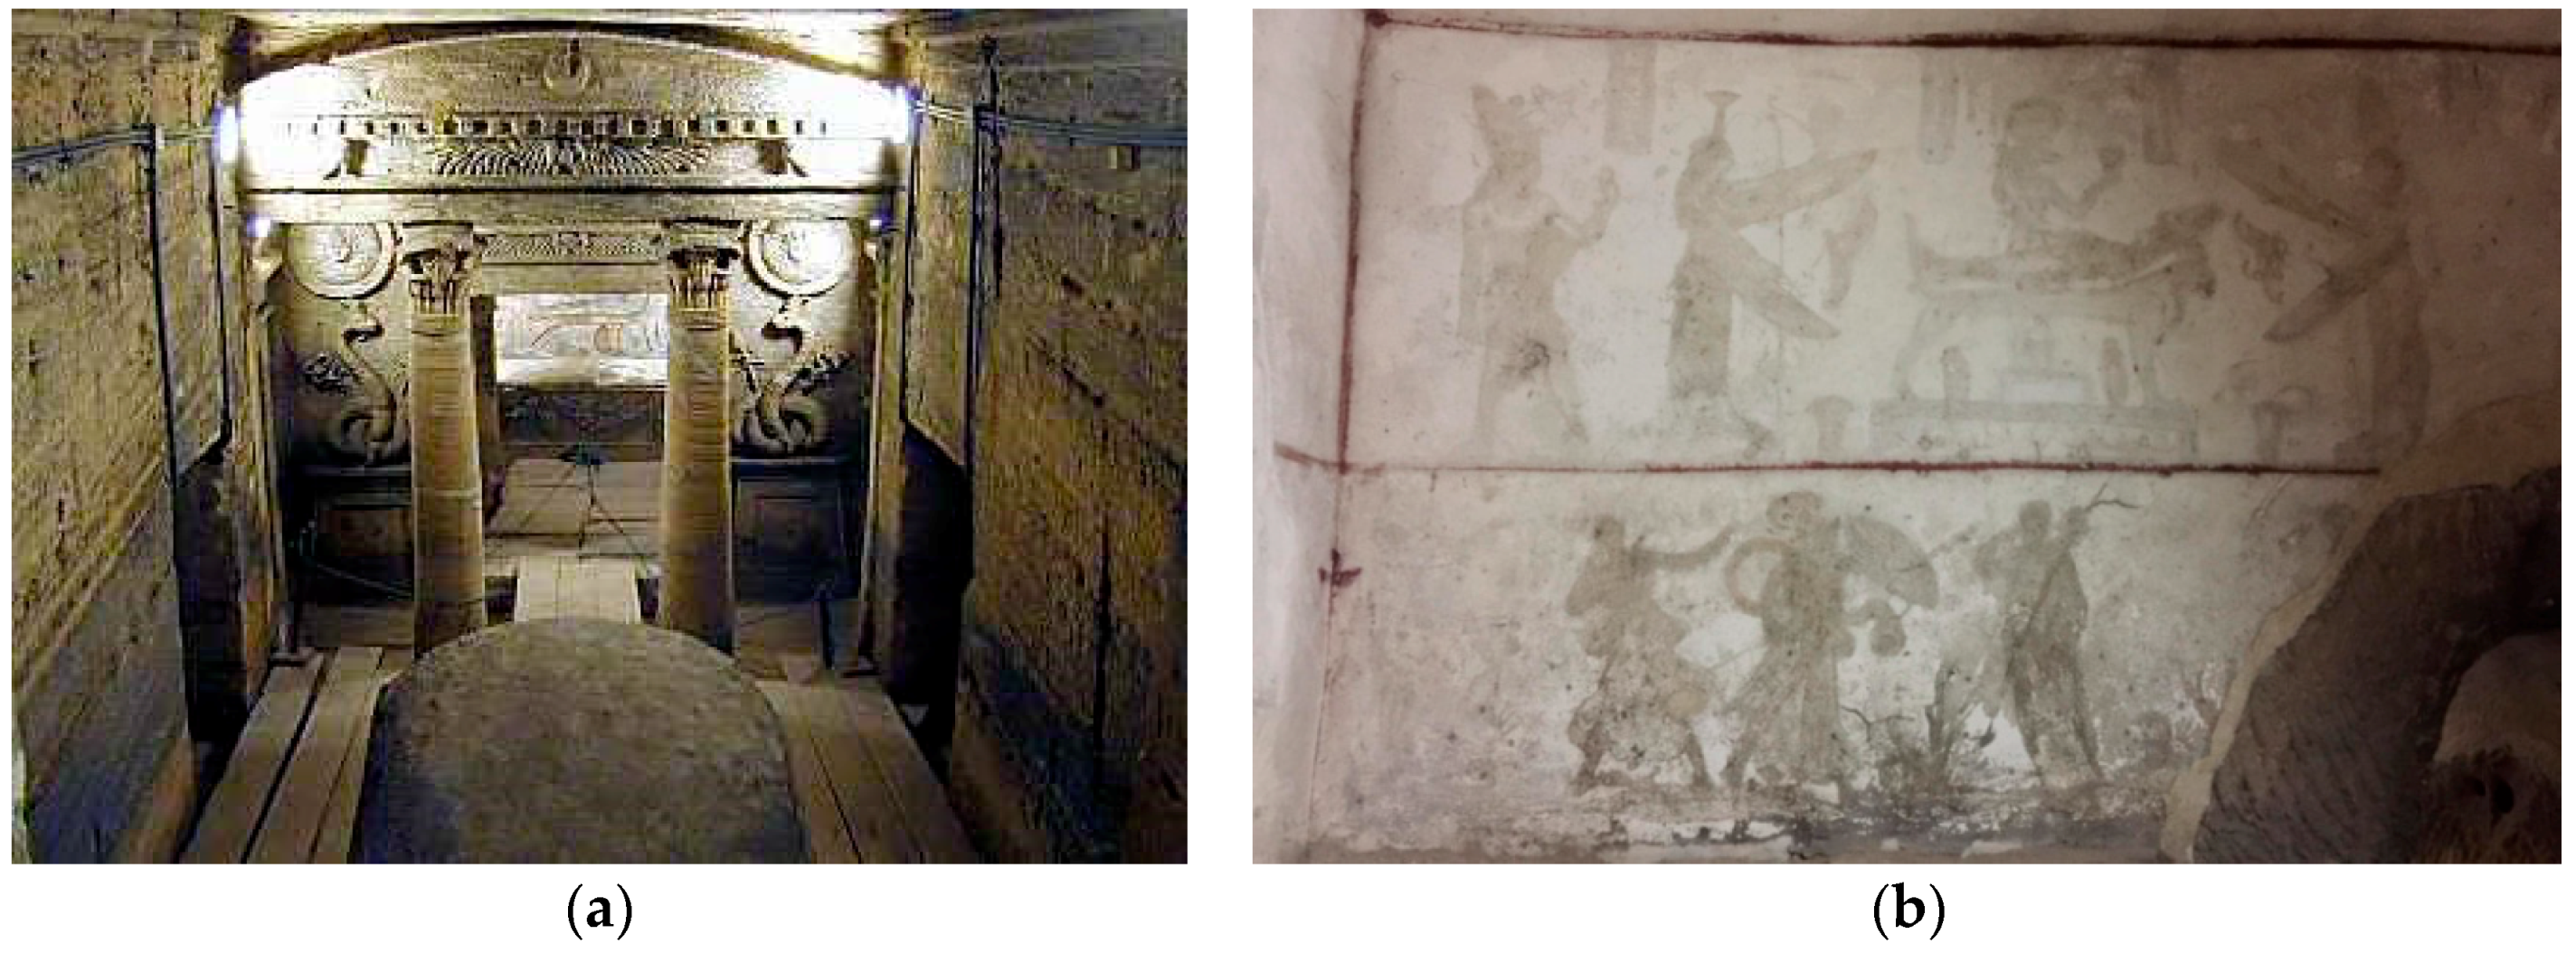
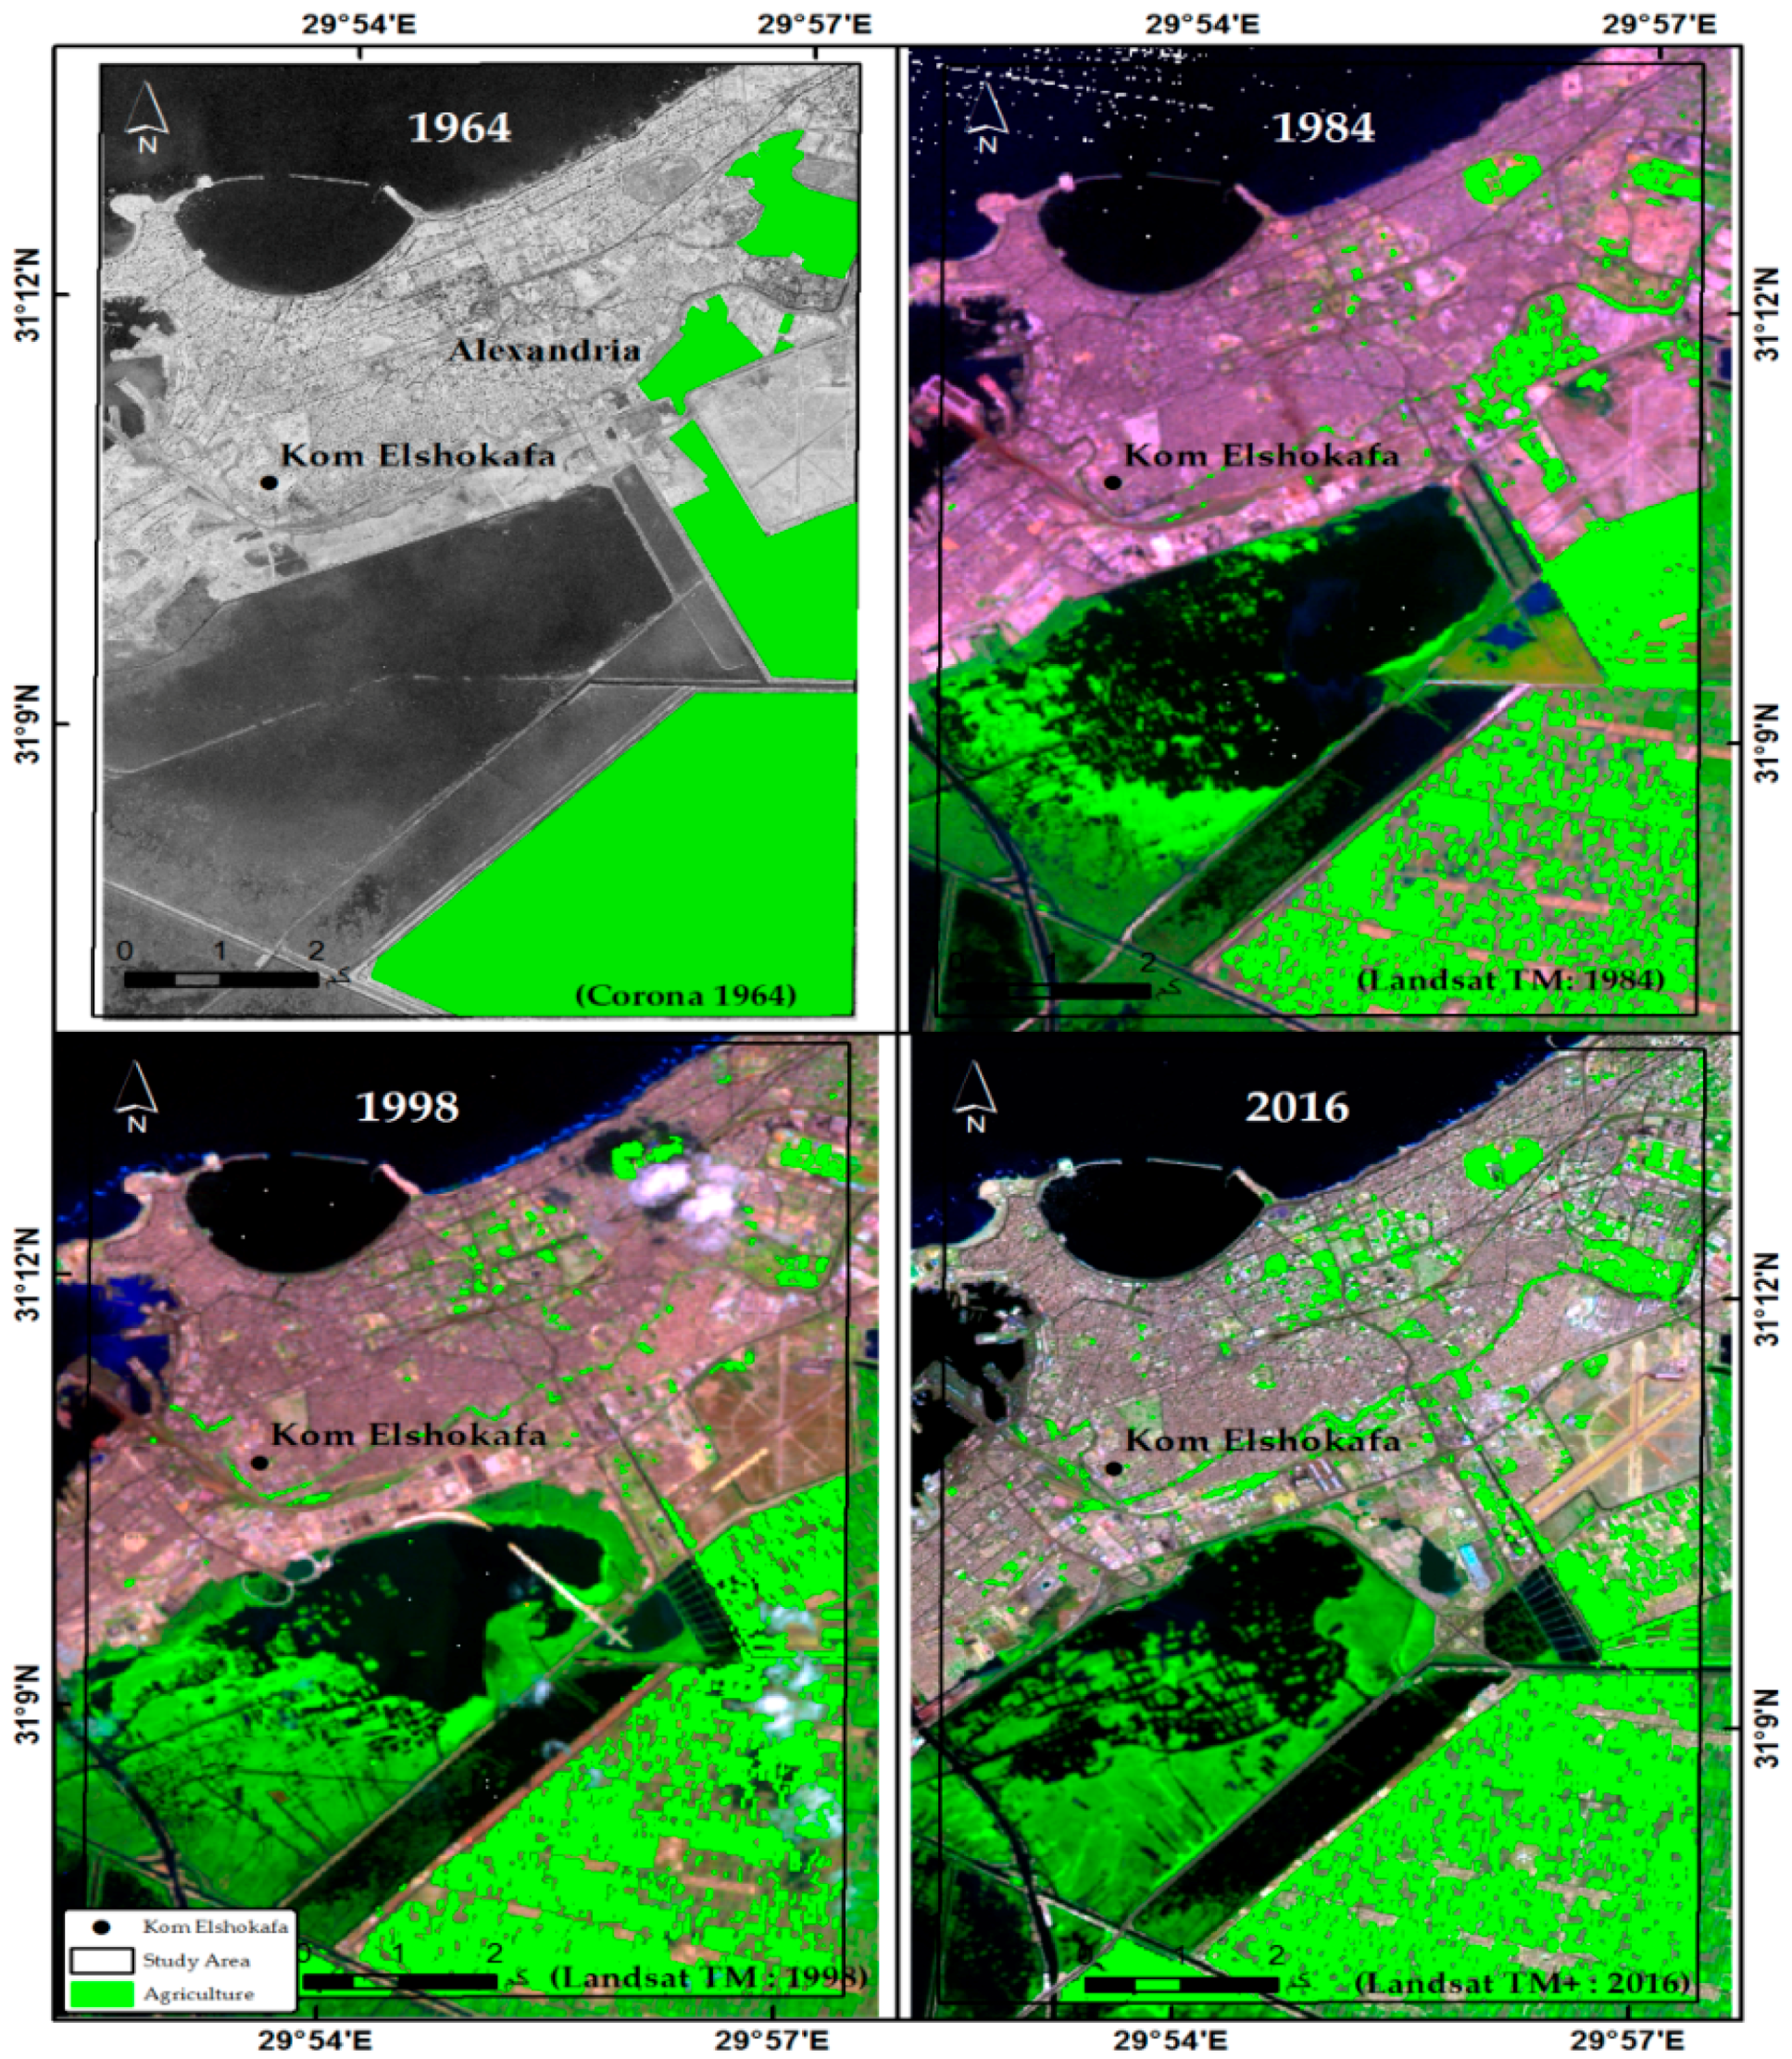
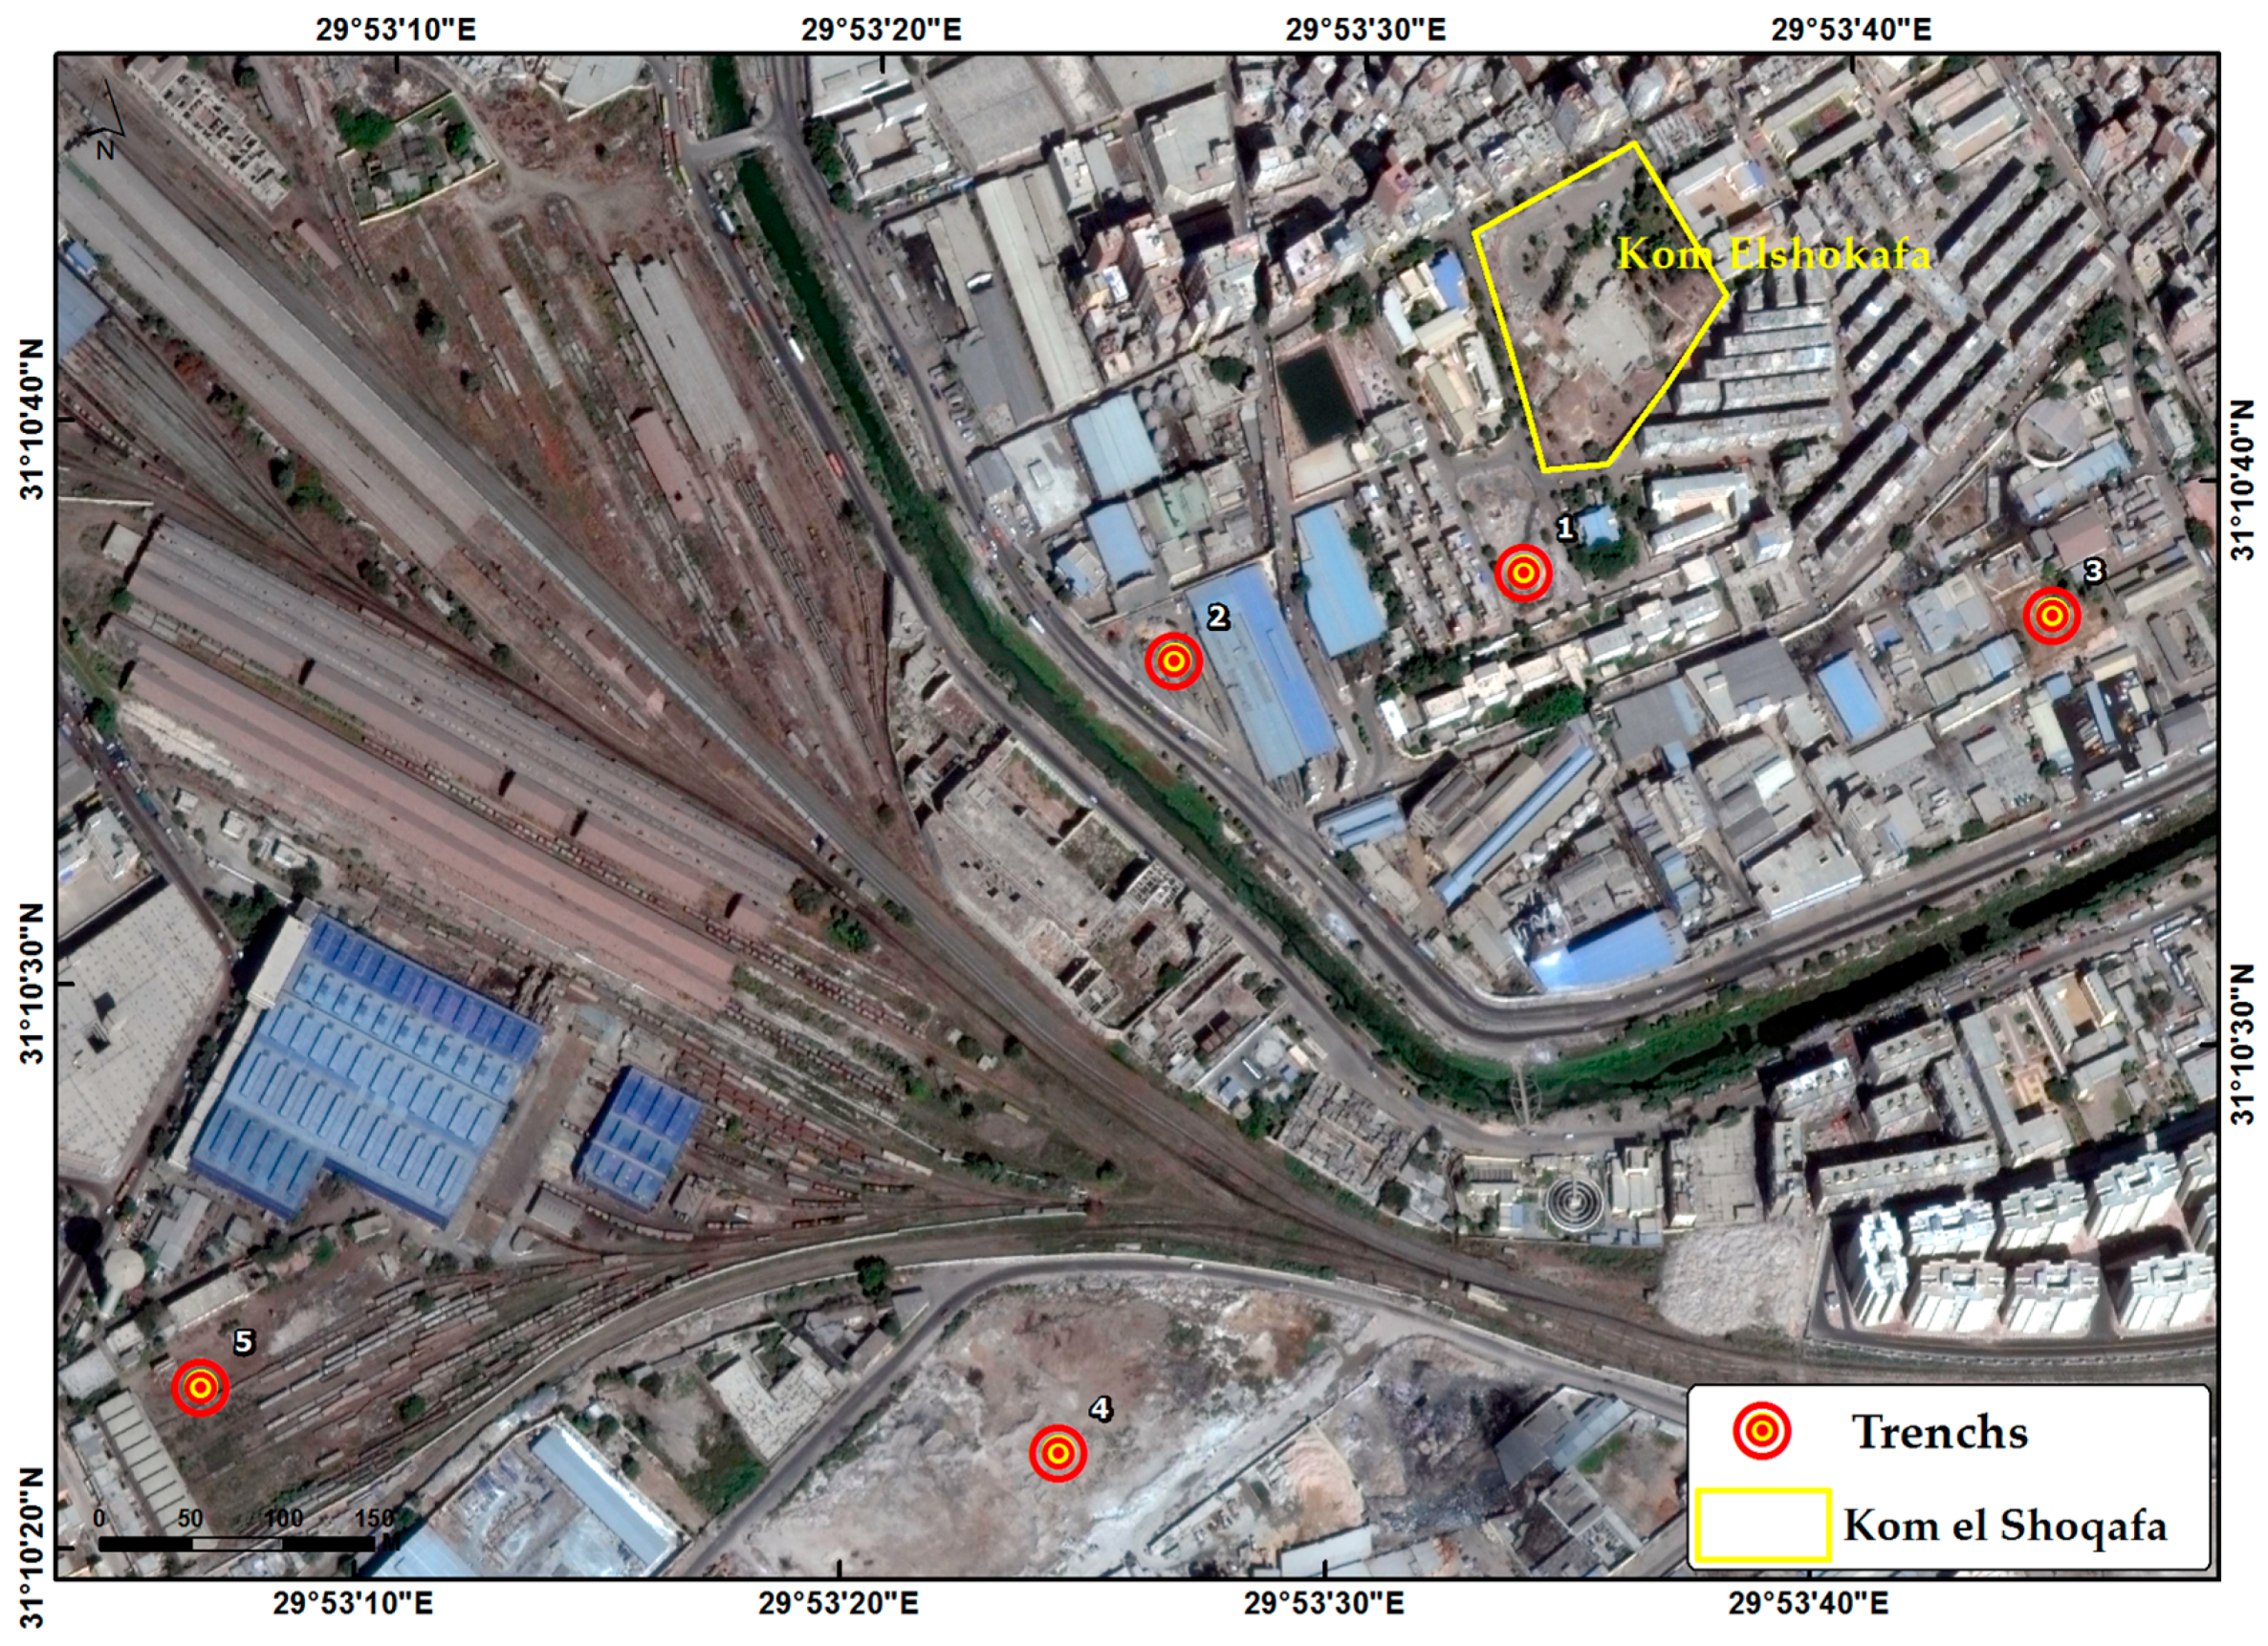
2.1. Kom el Shoqafa, Egypt
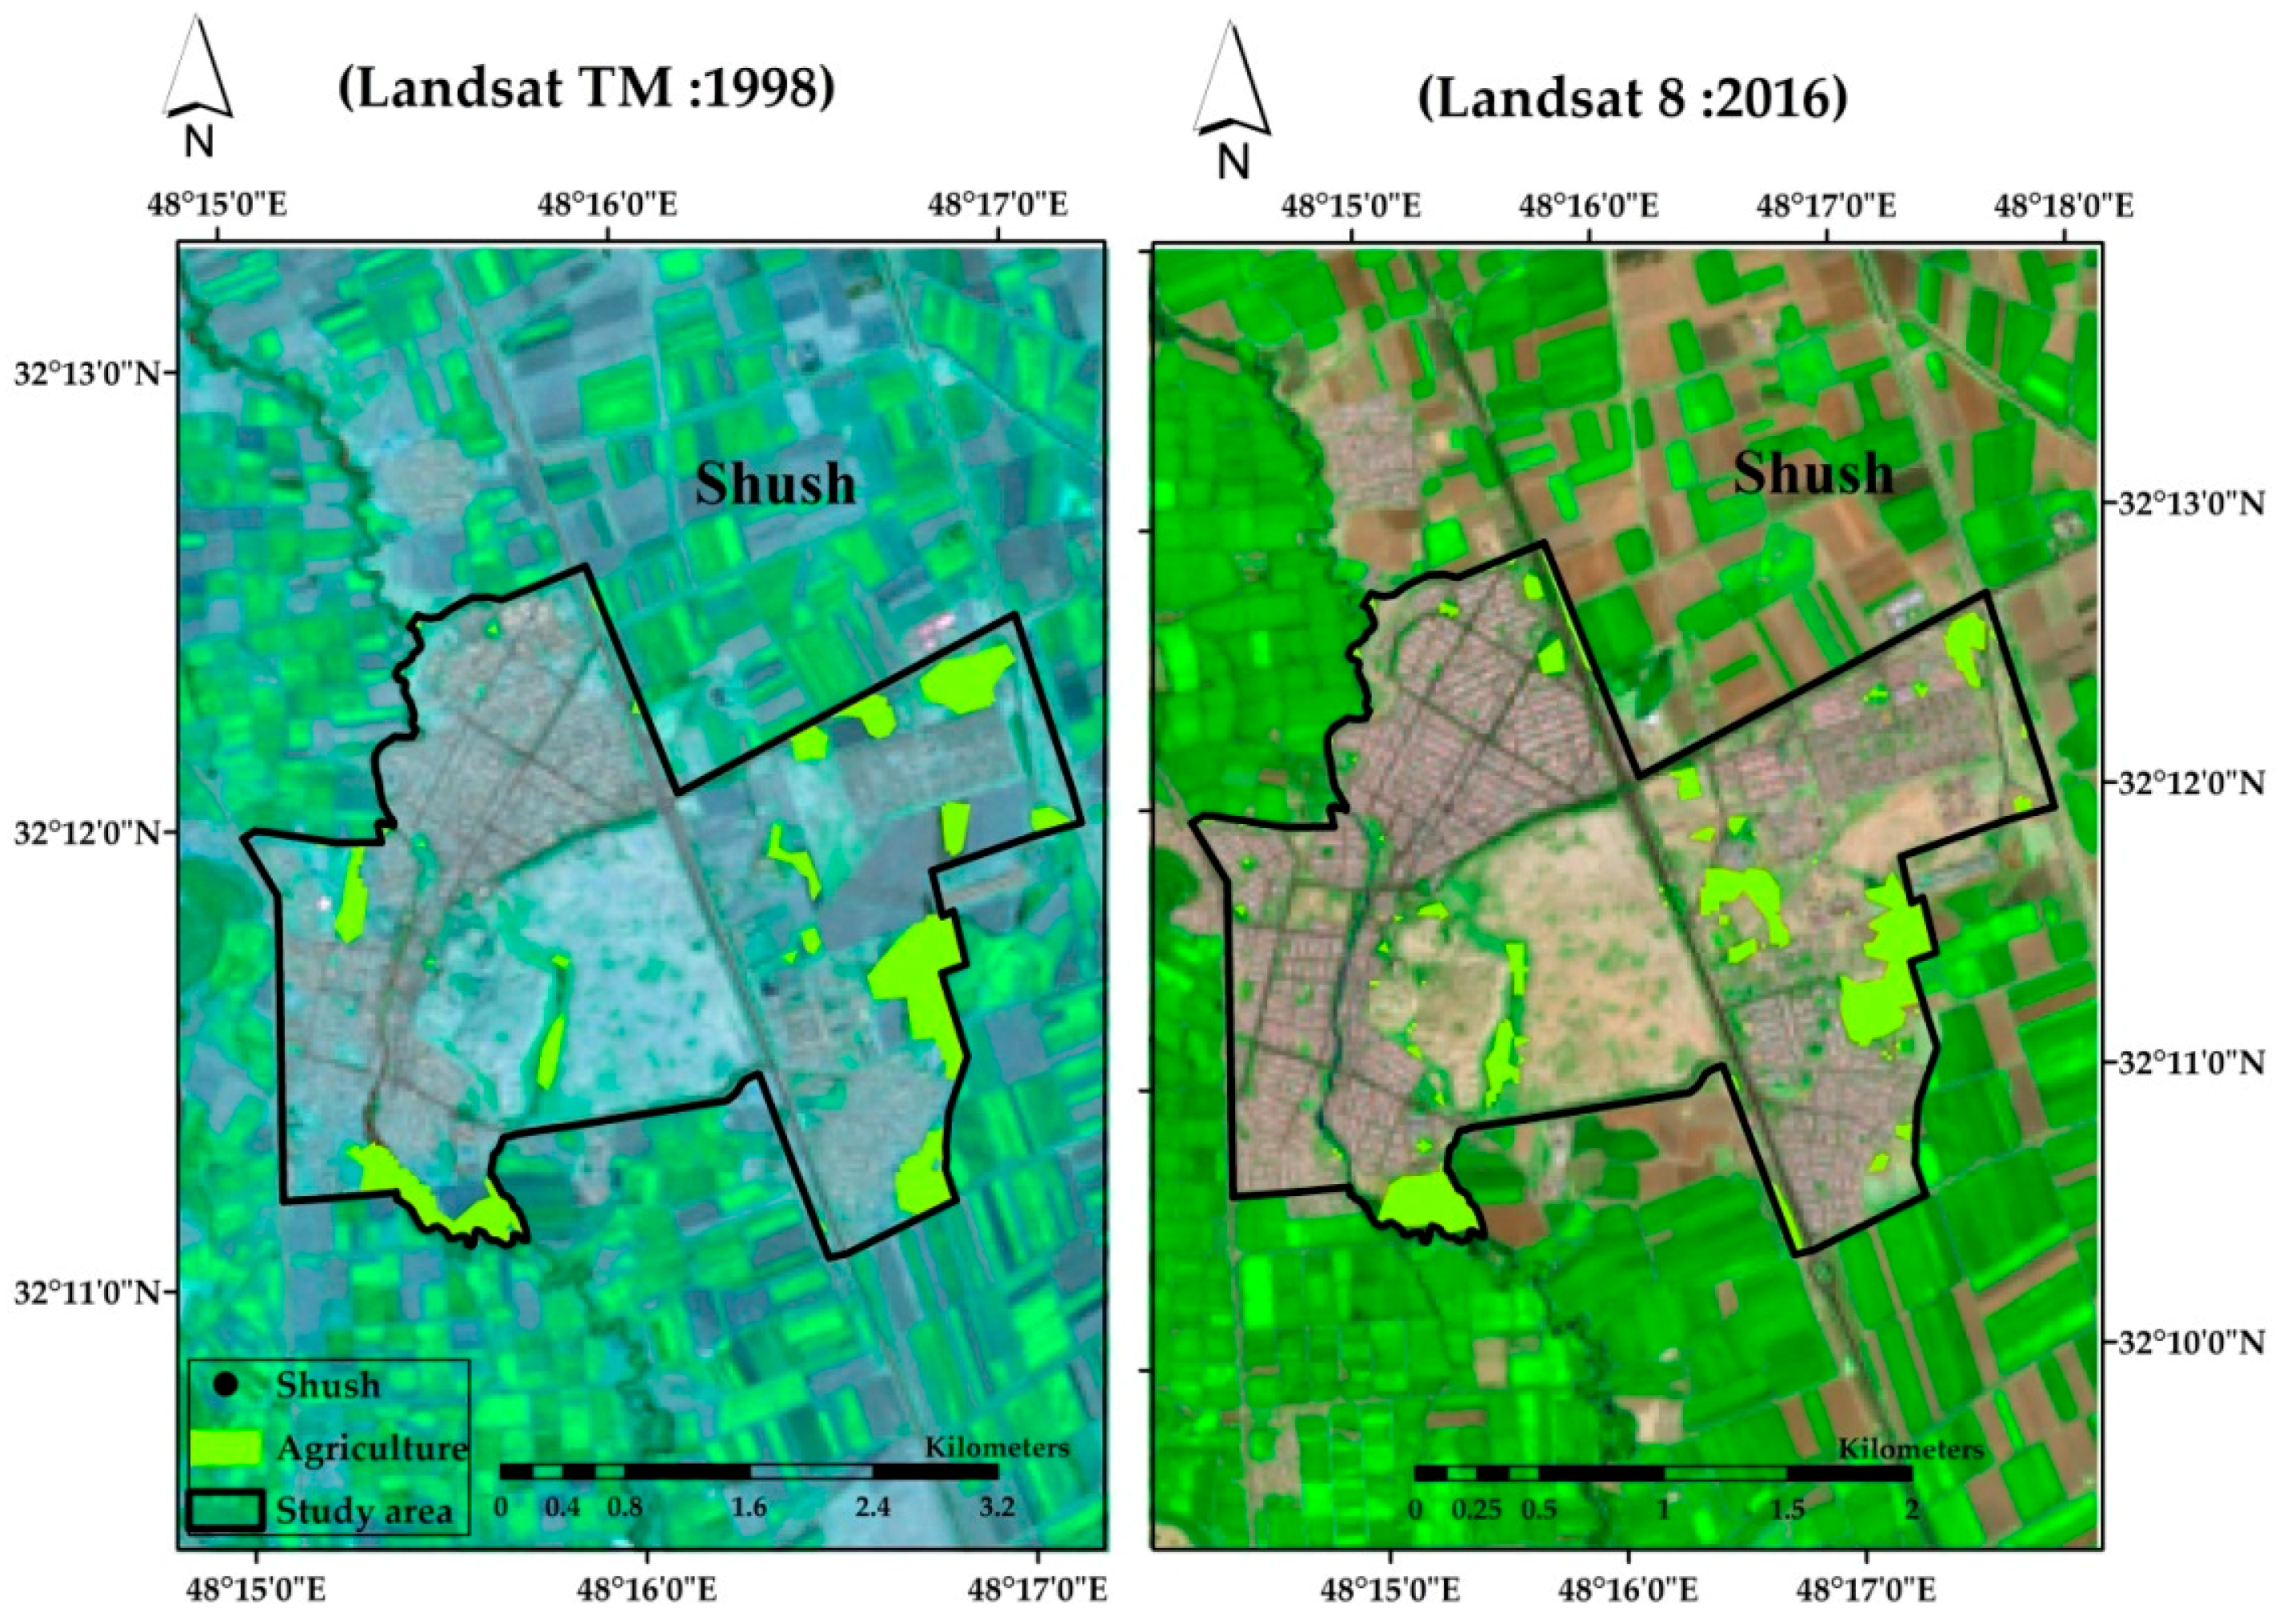
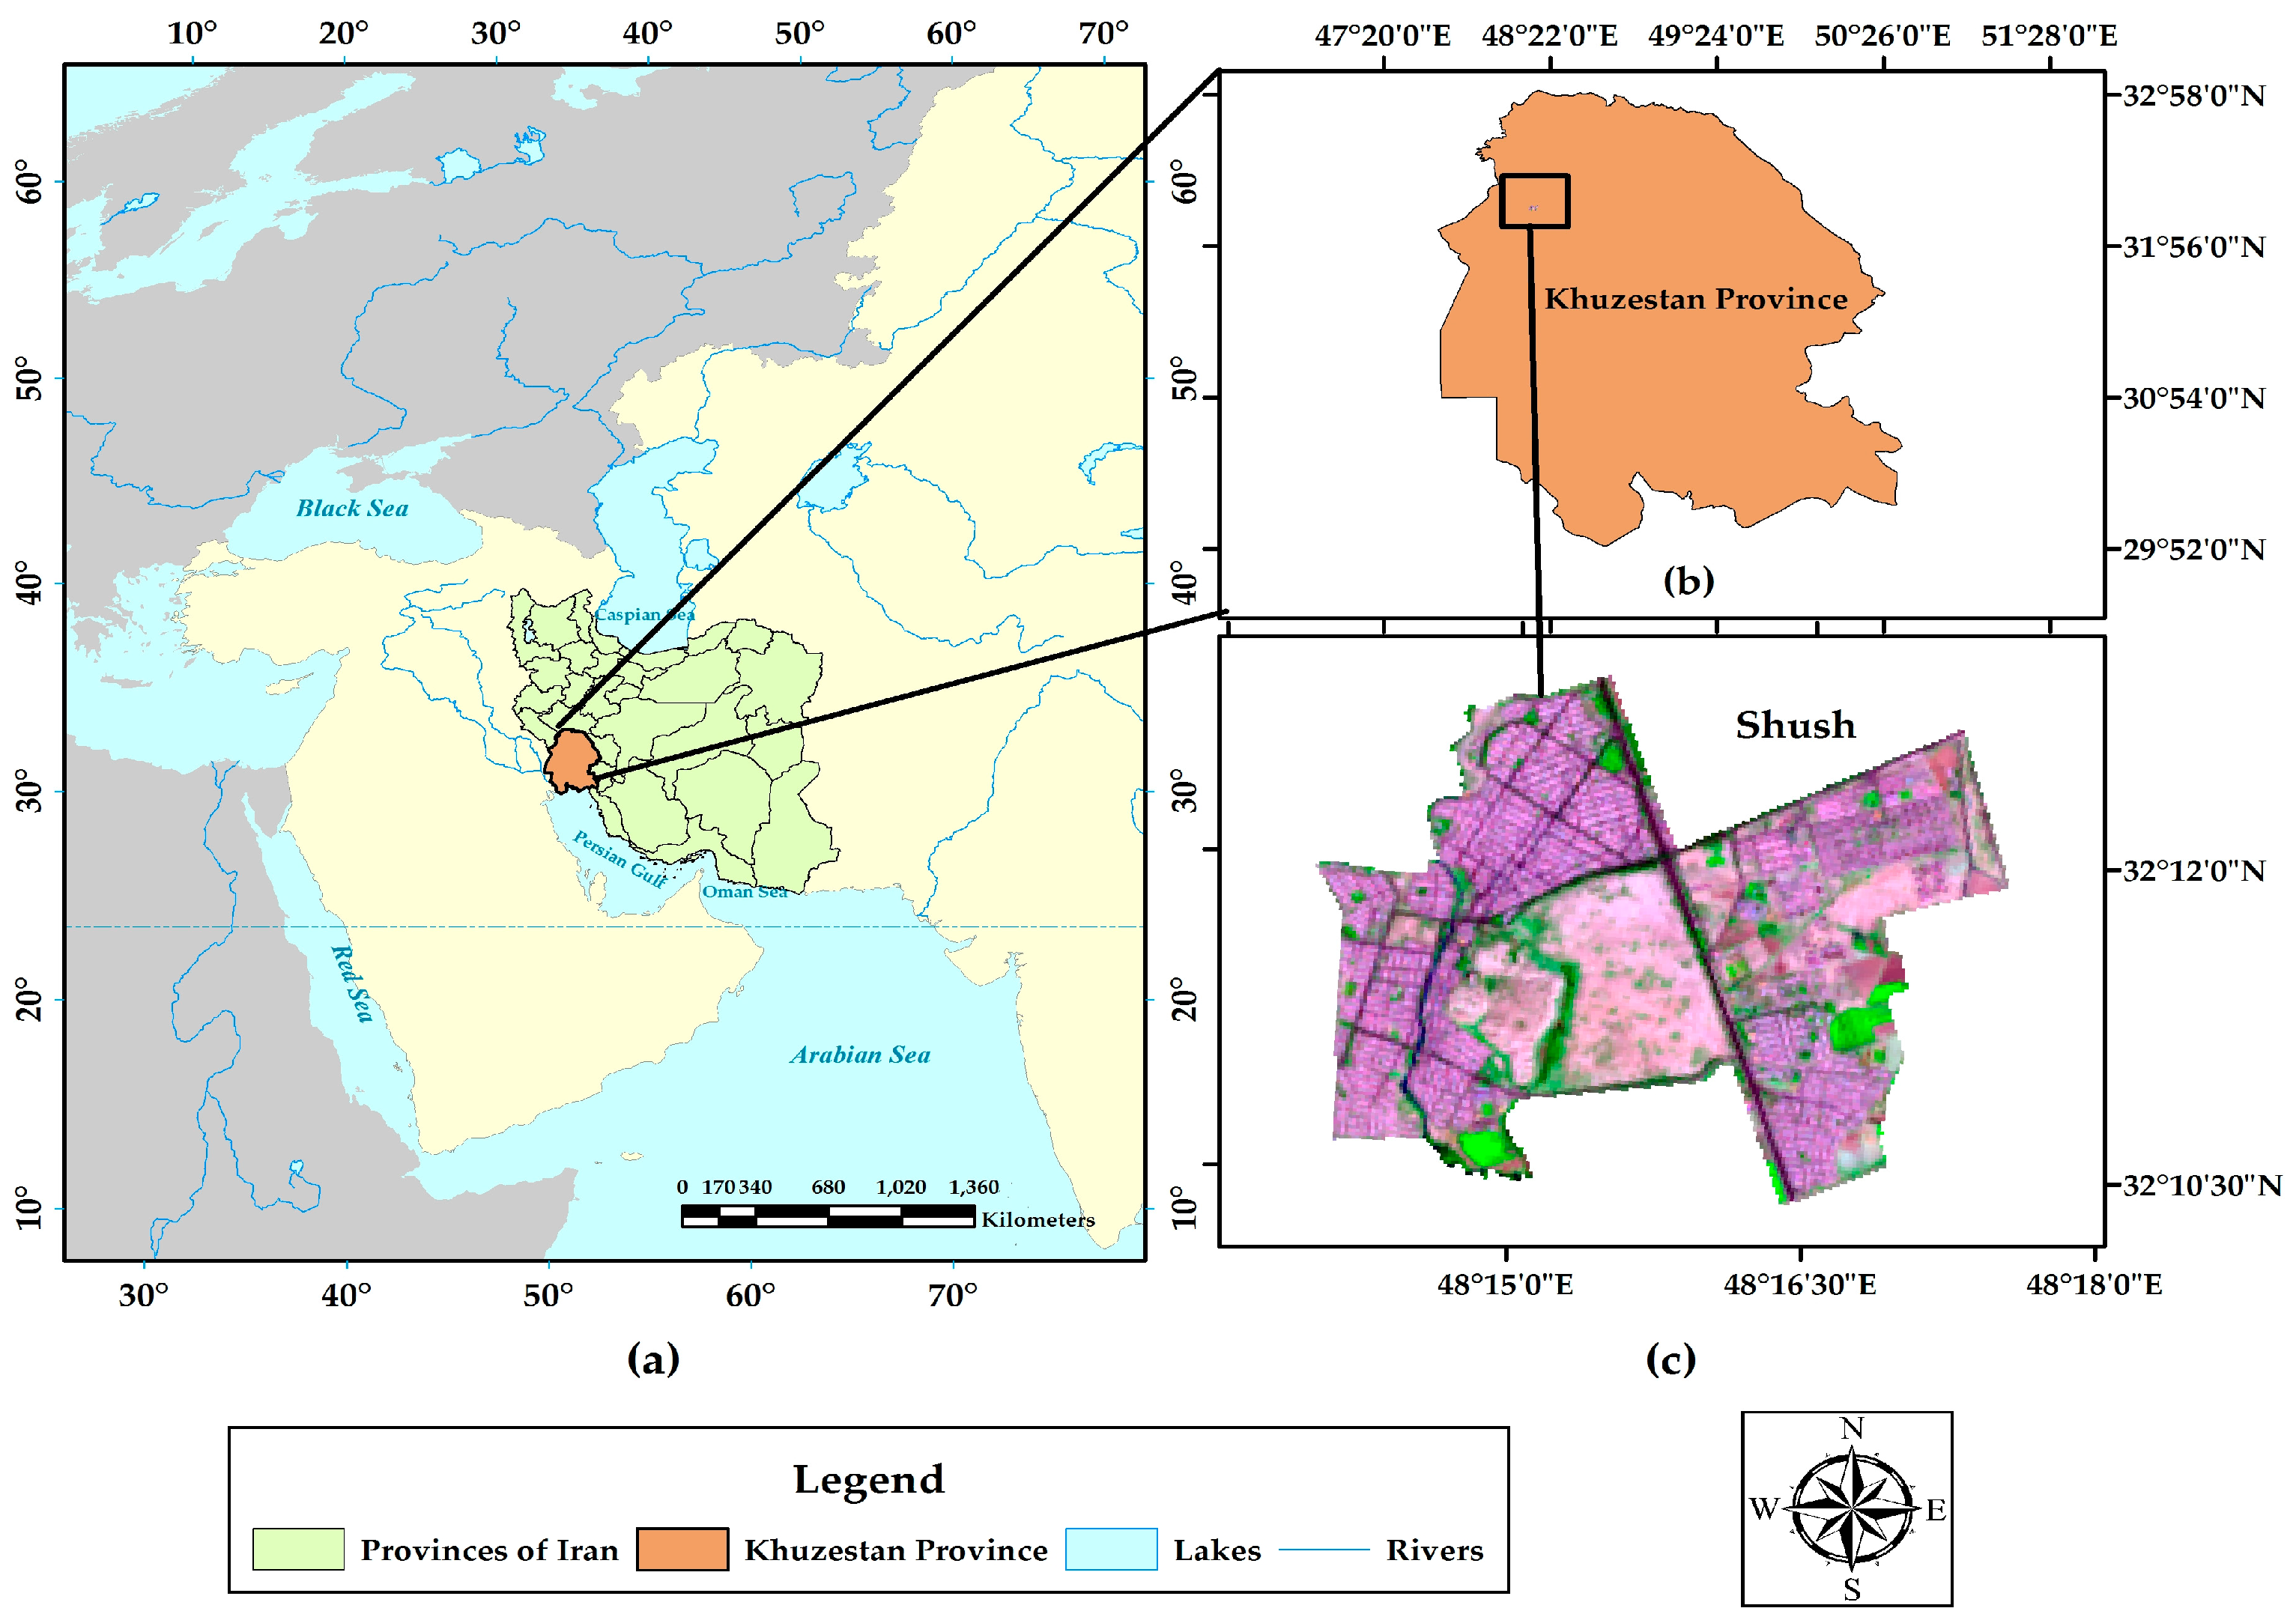
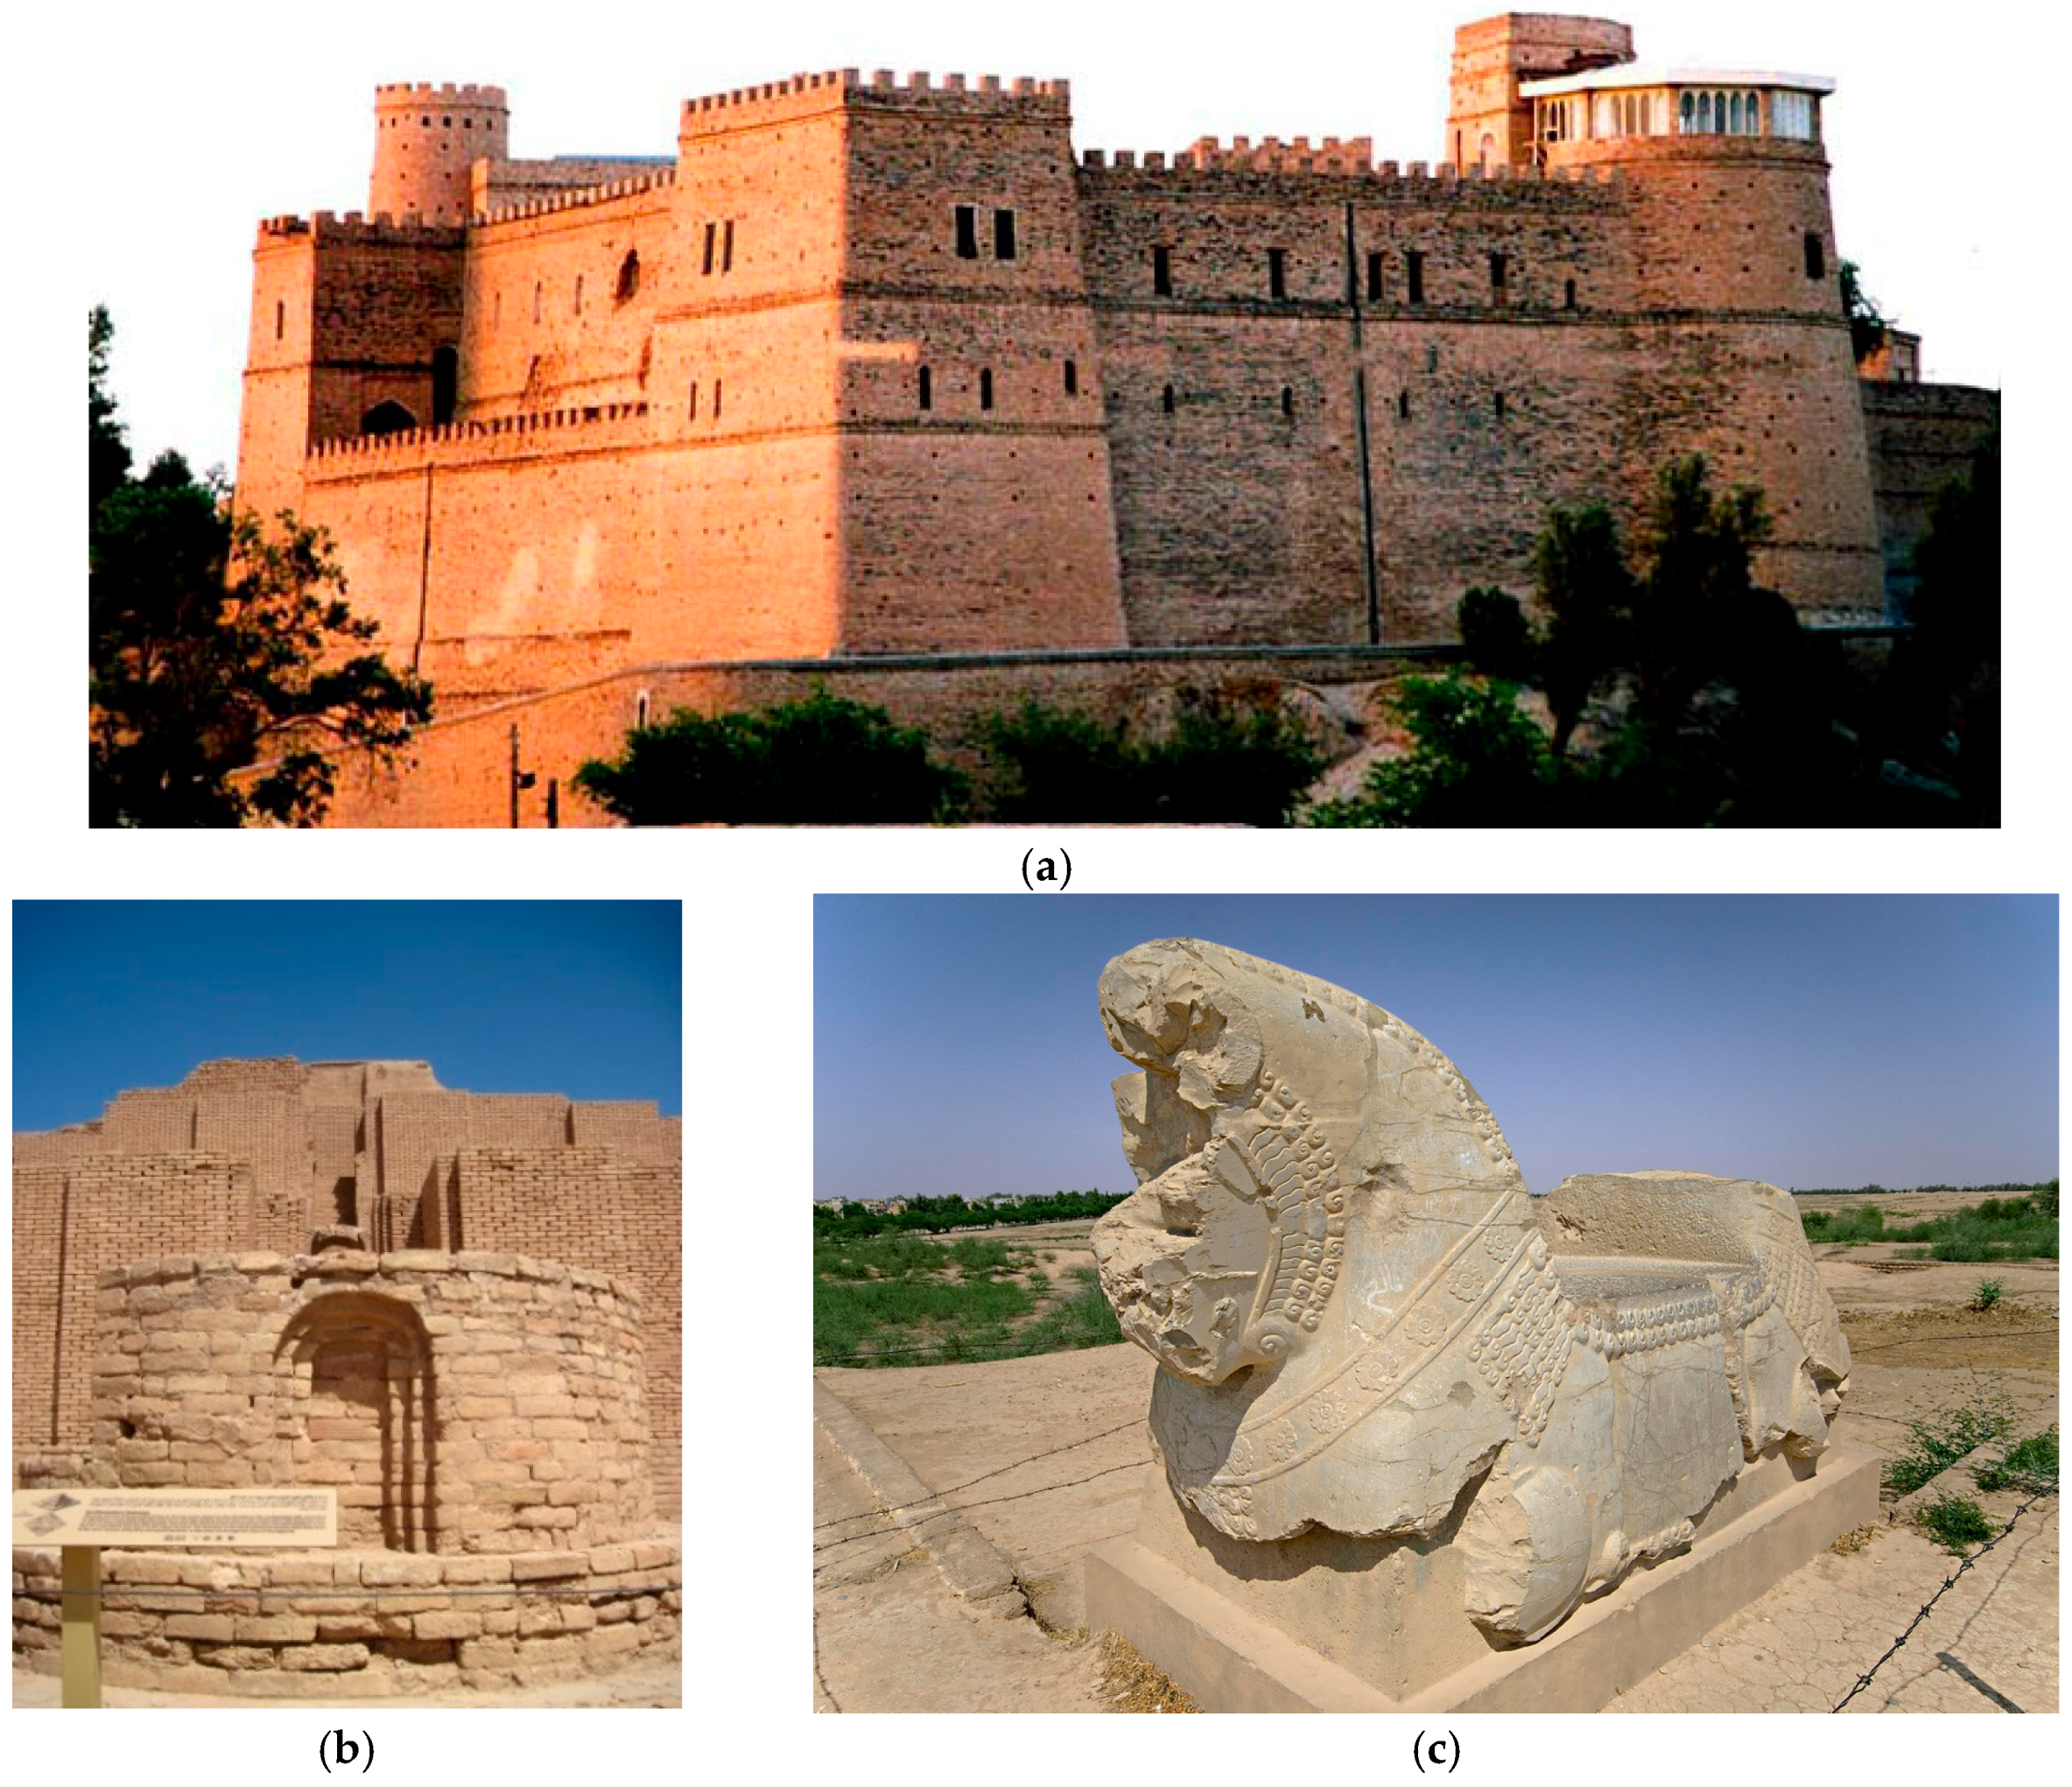
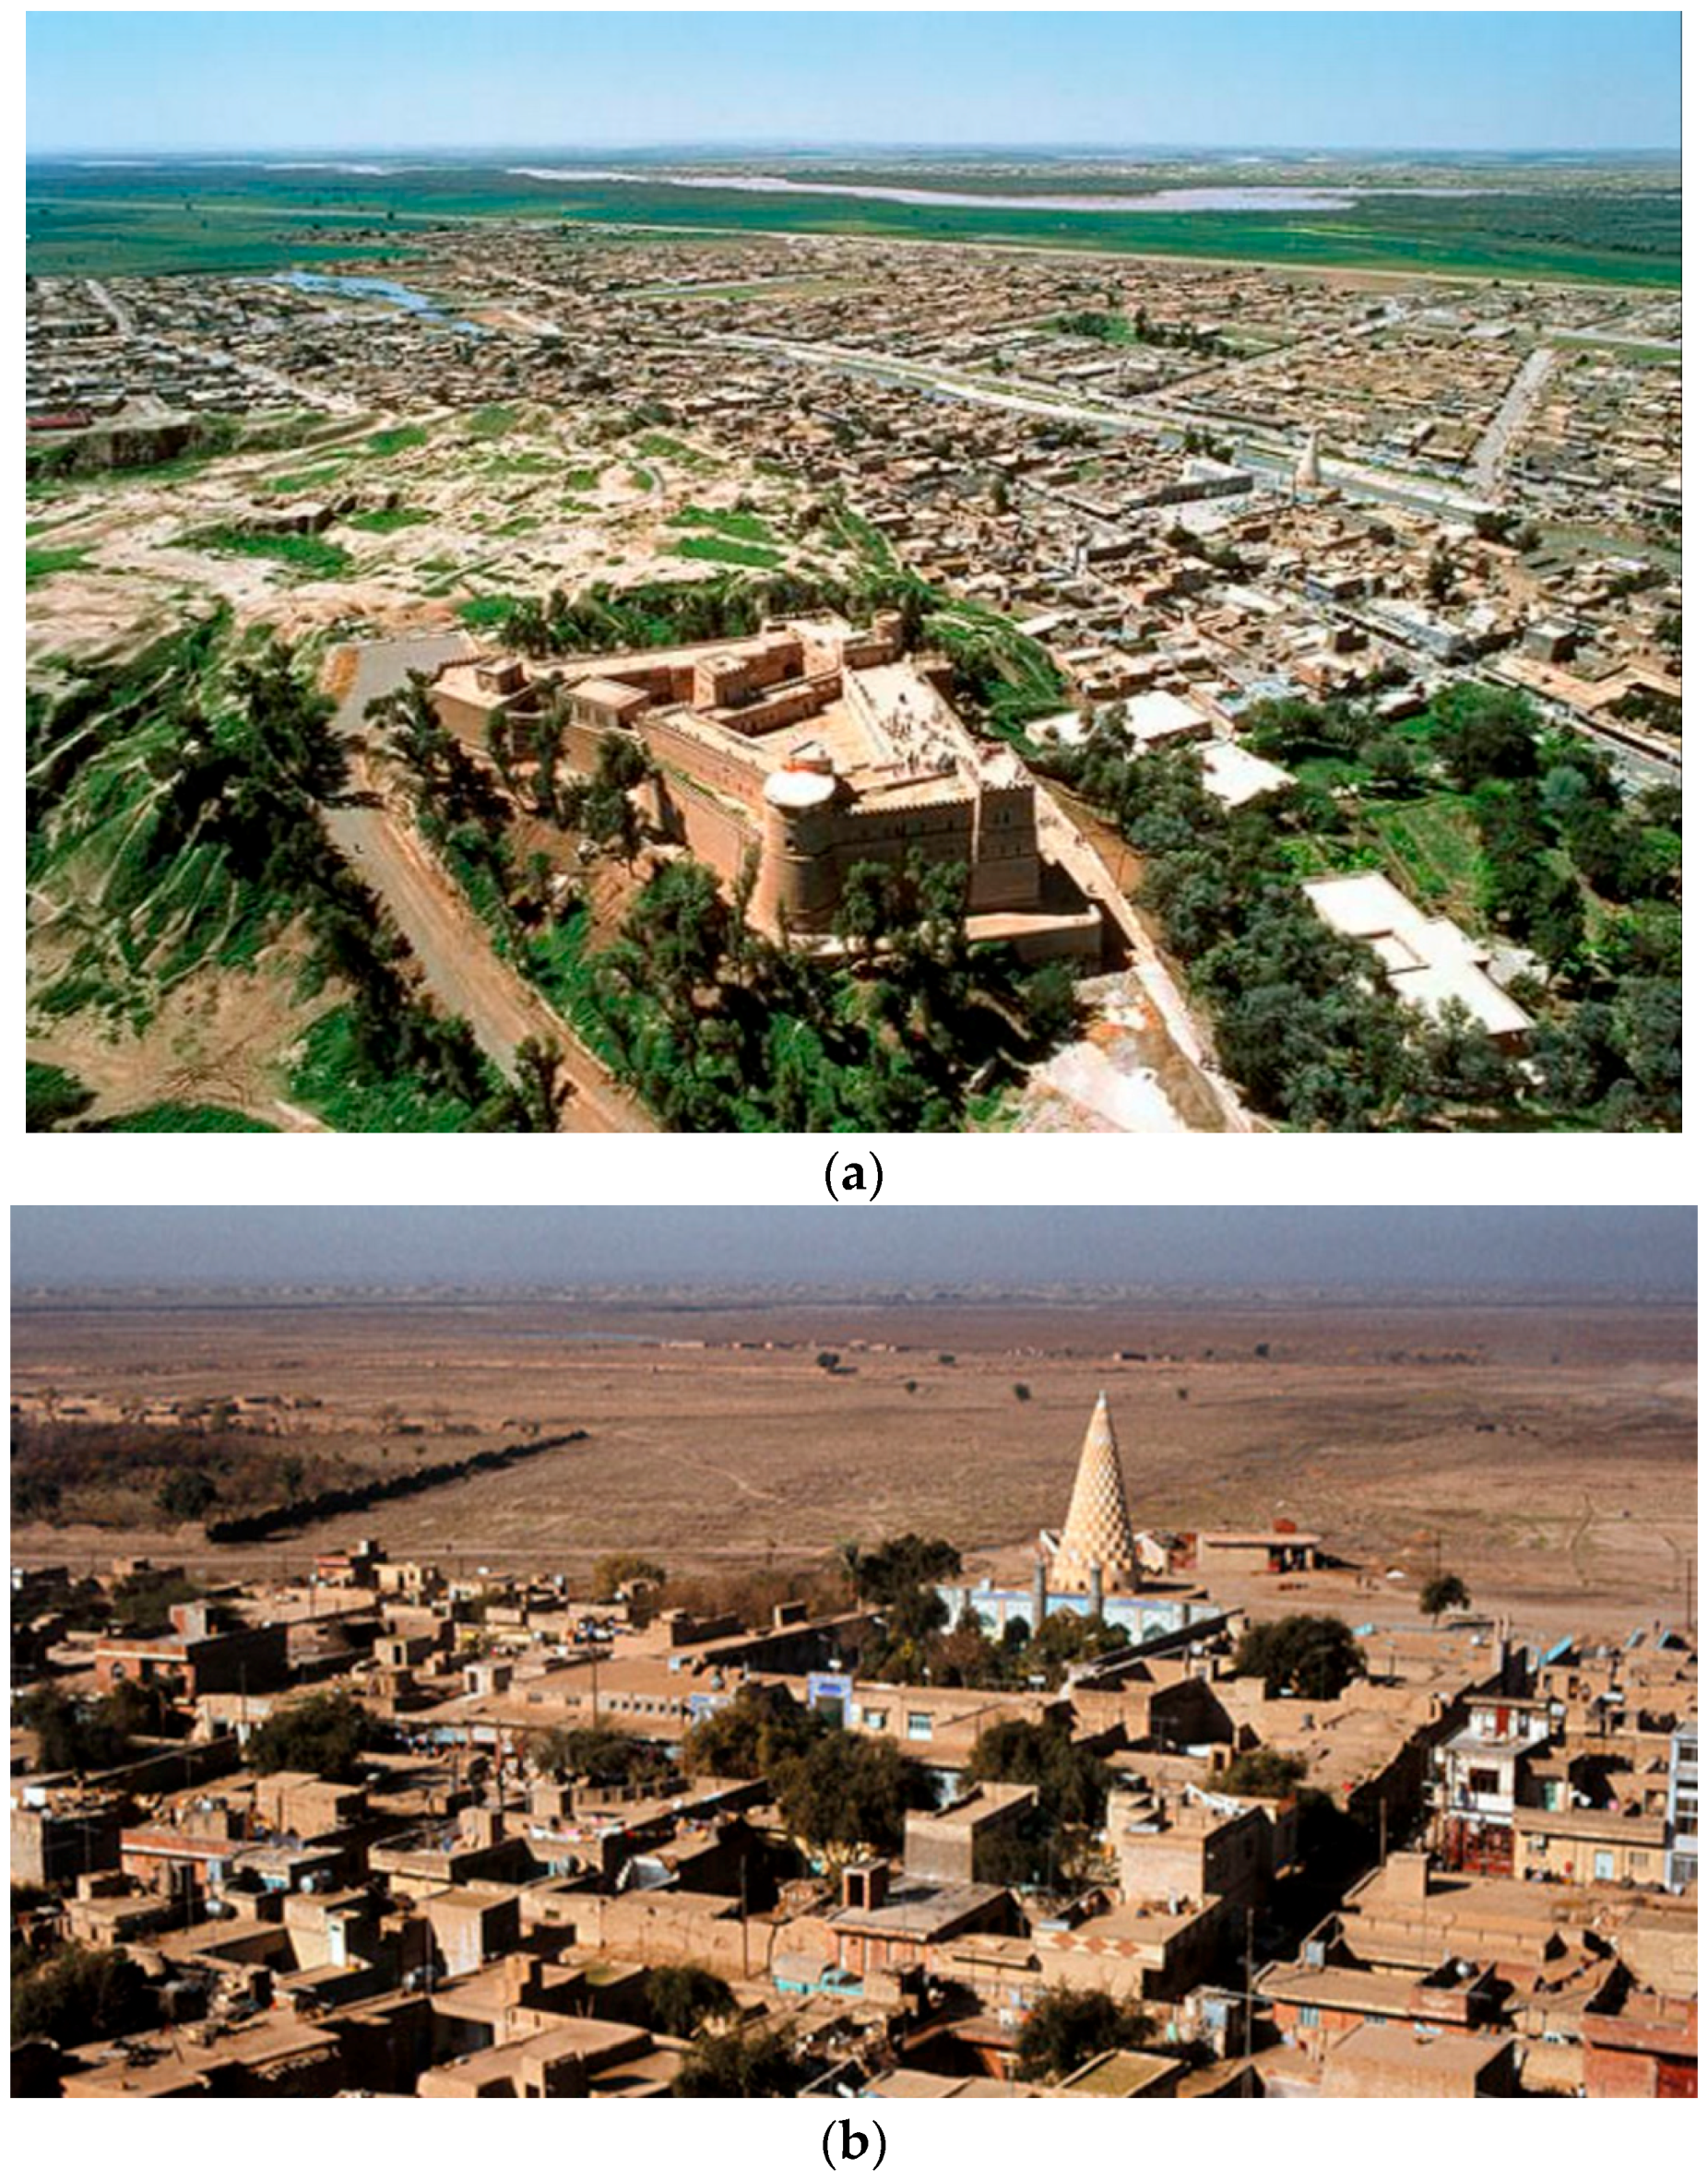
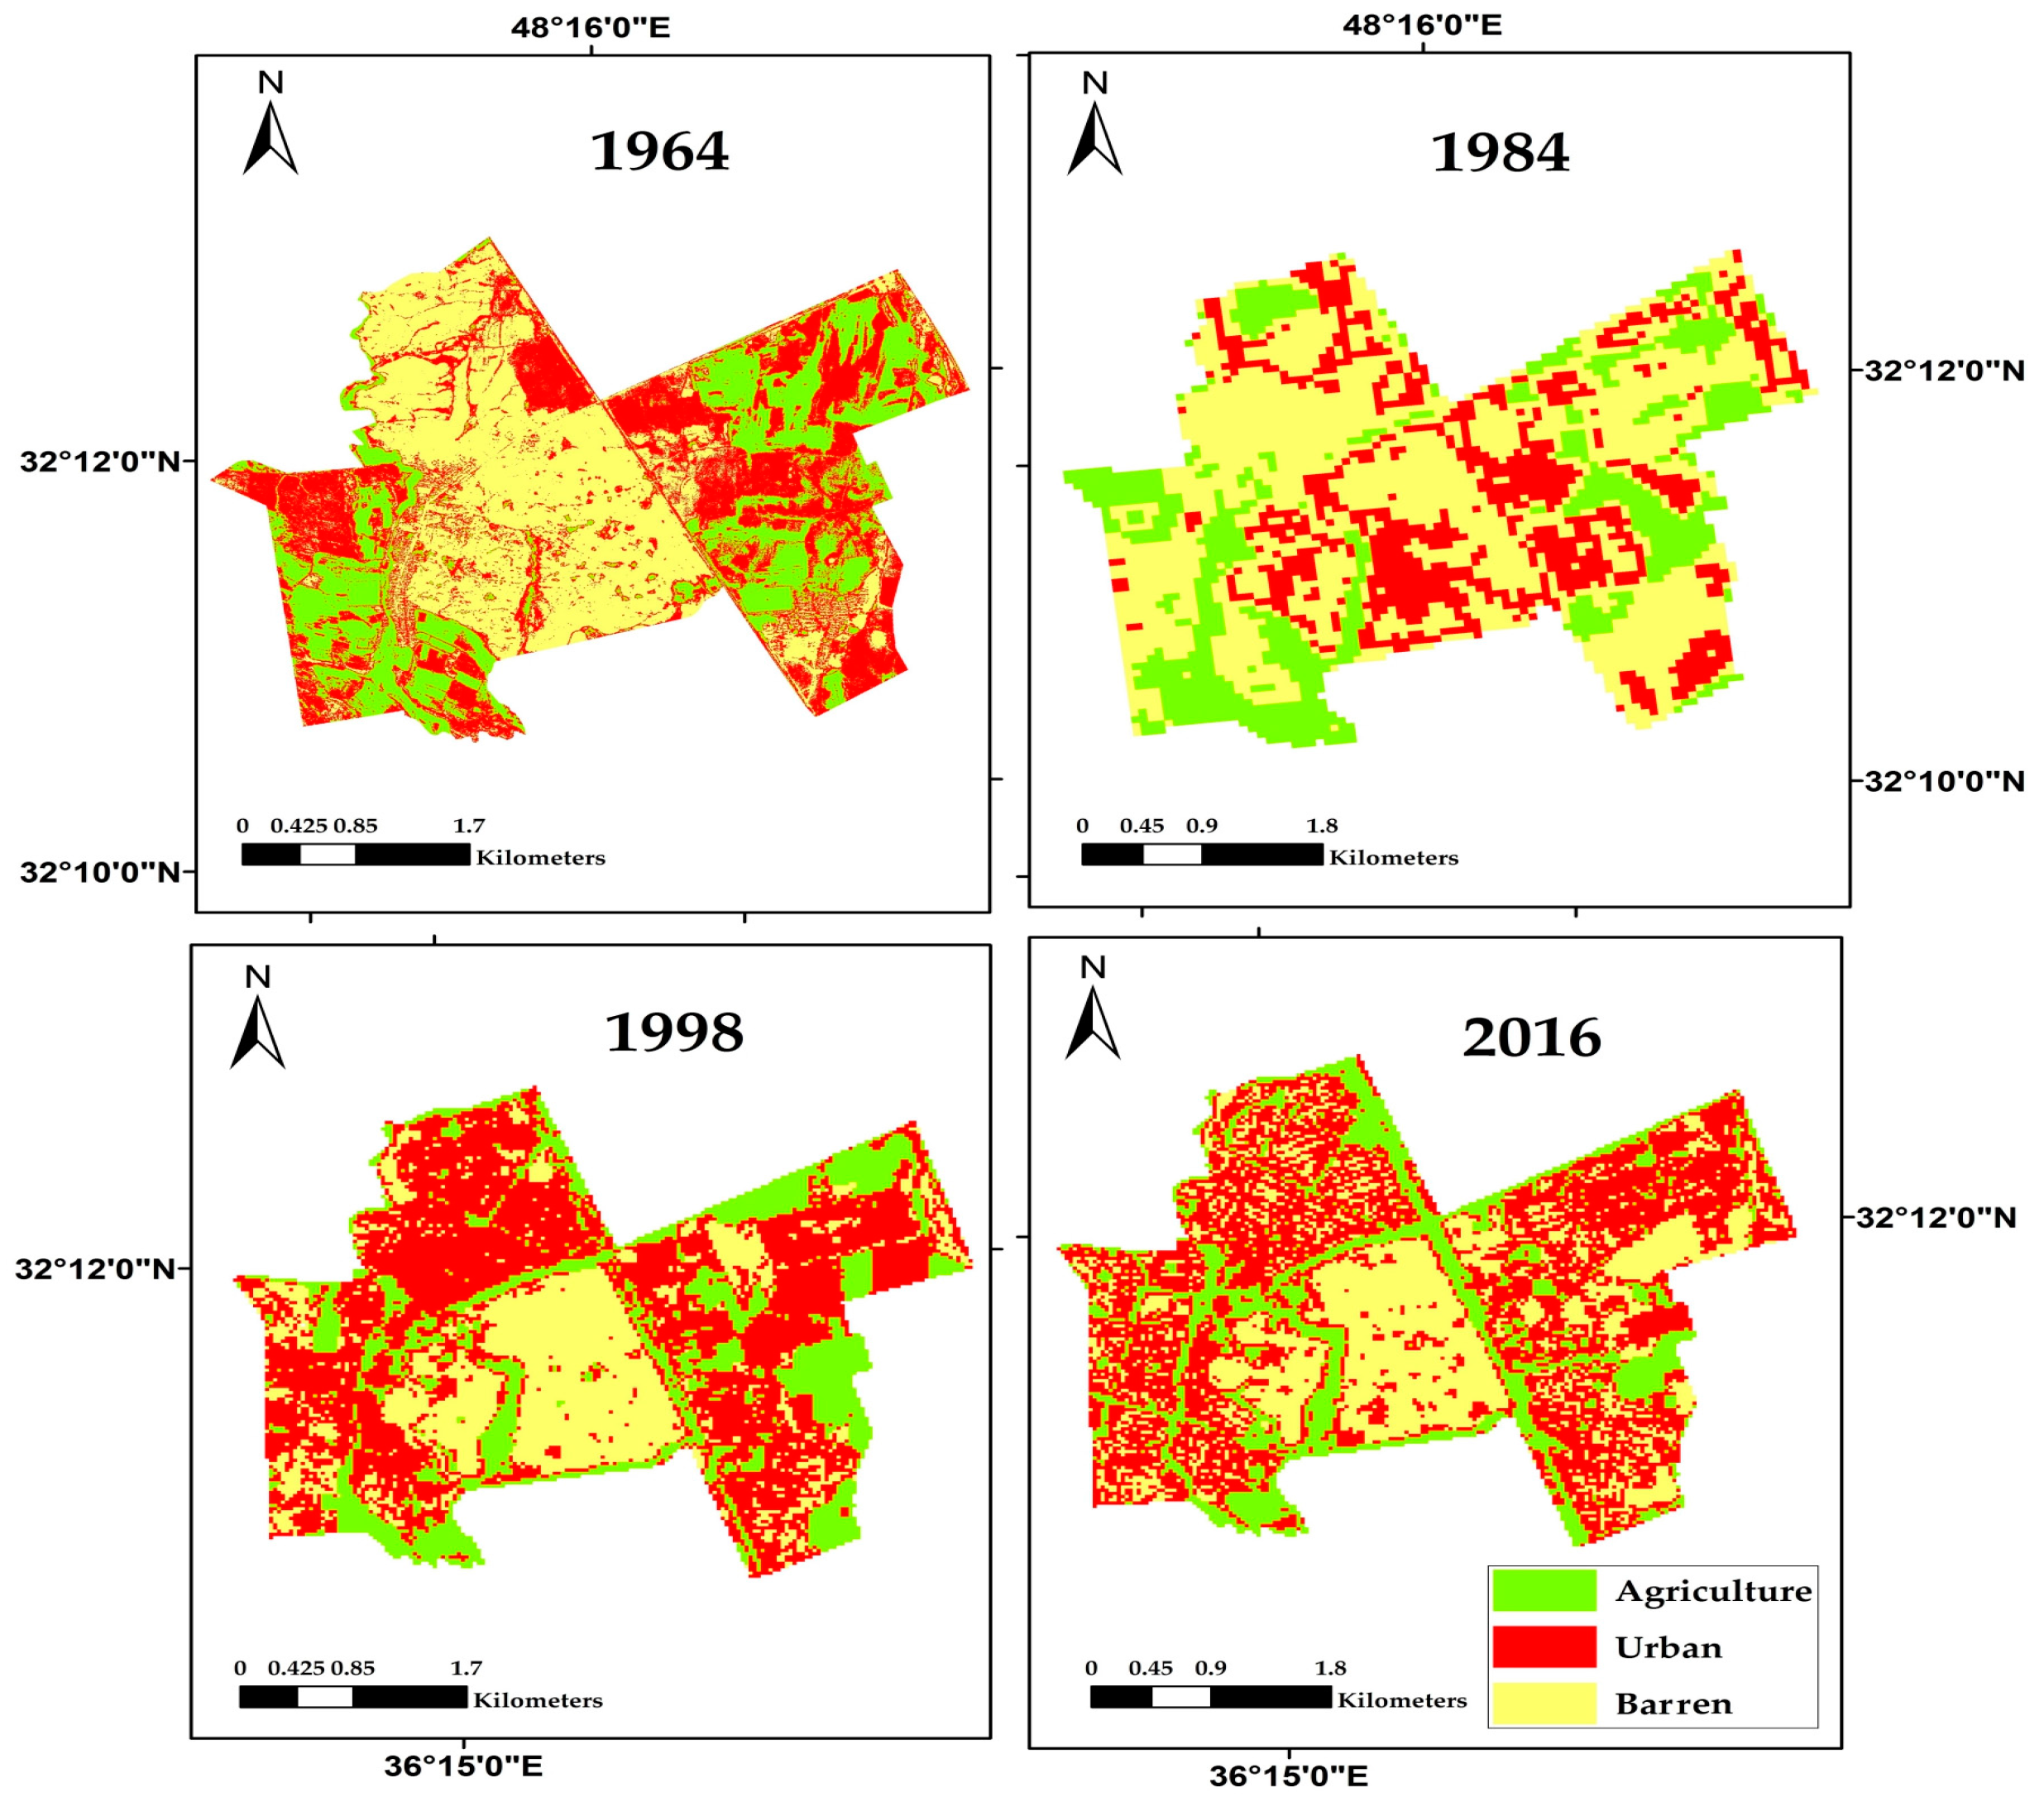
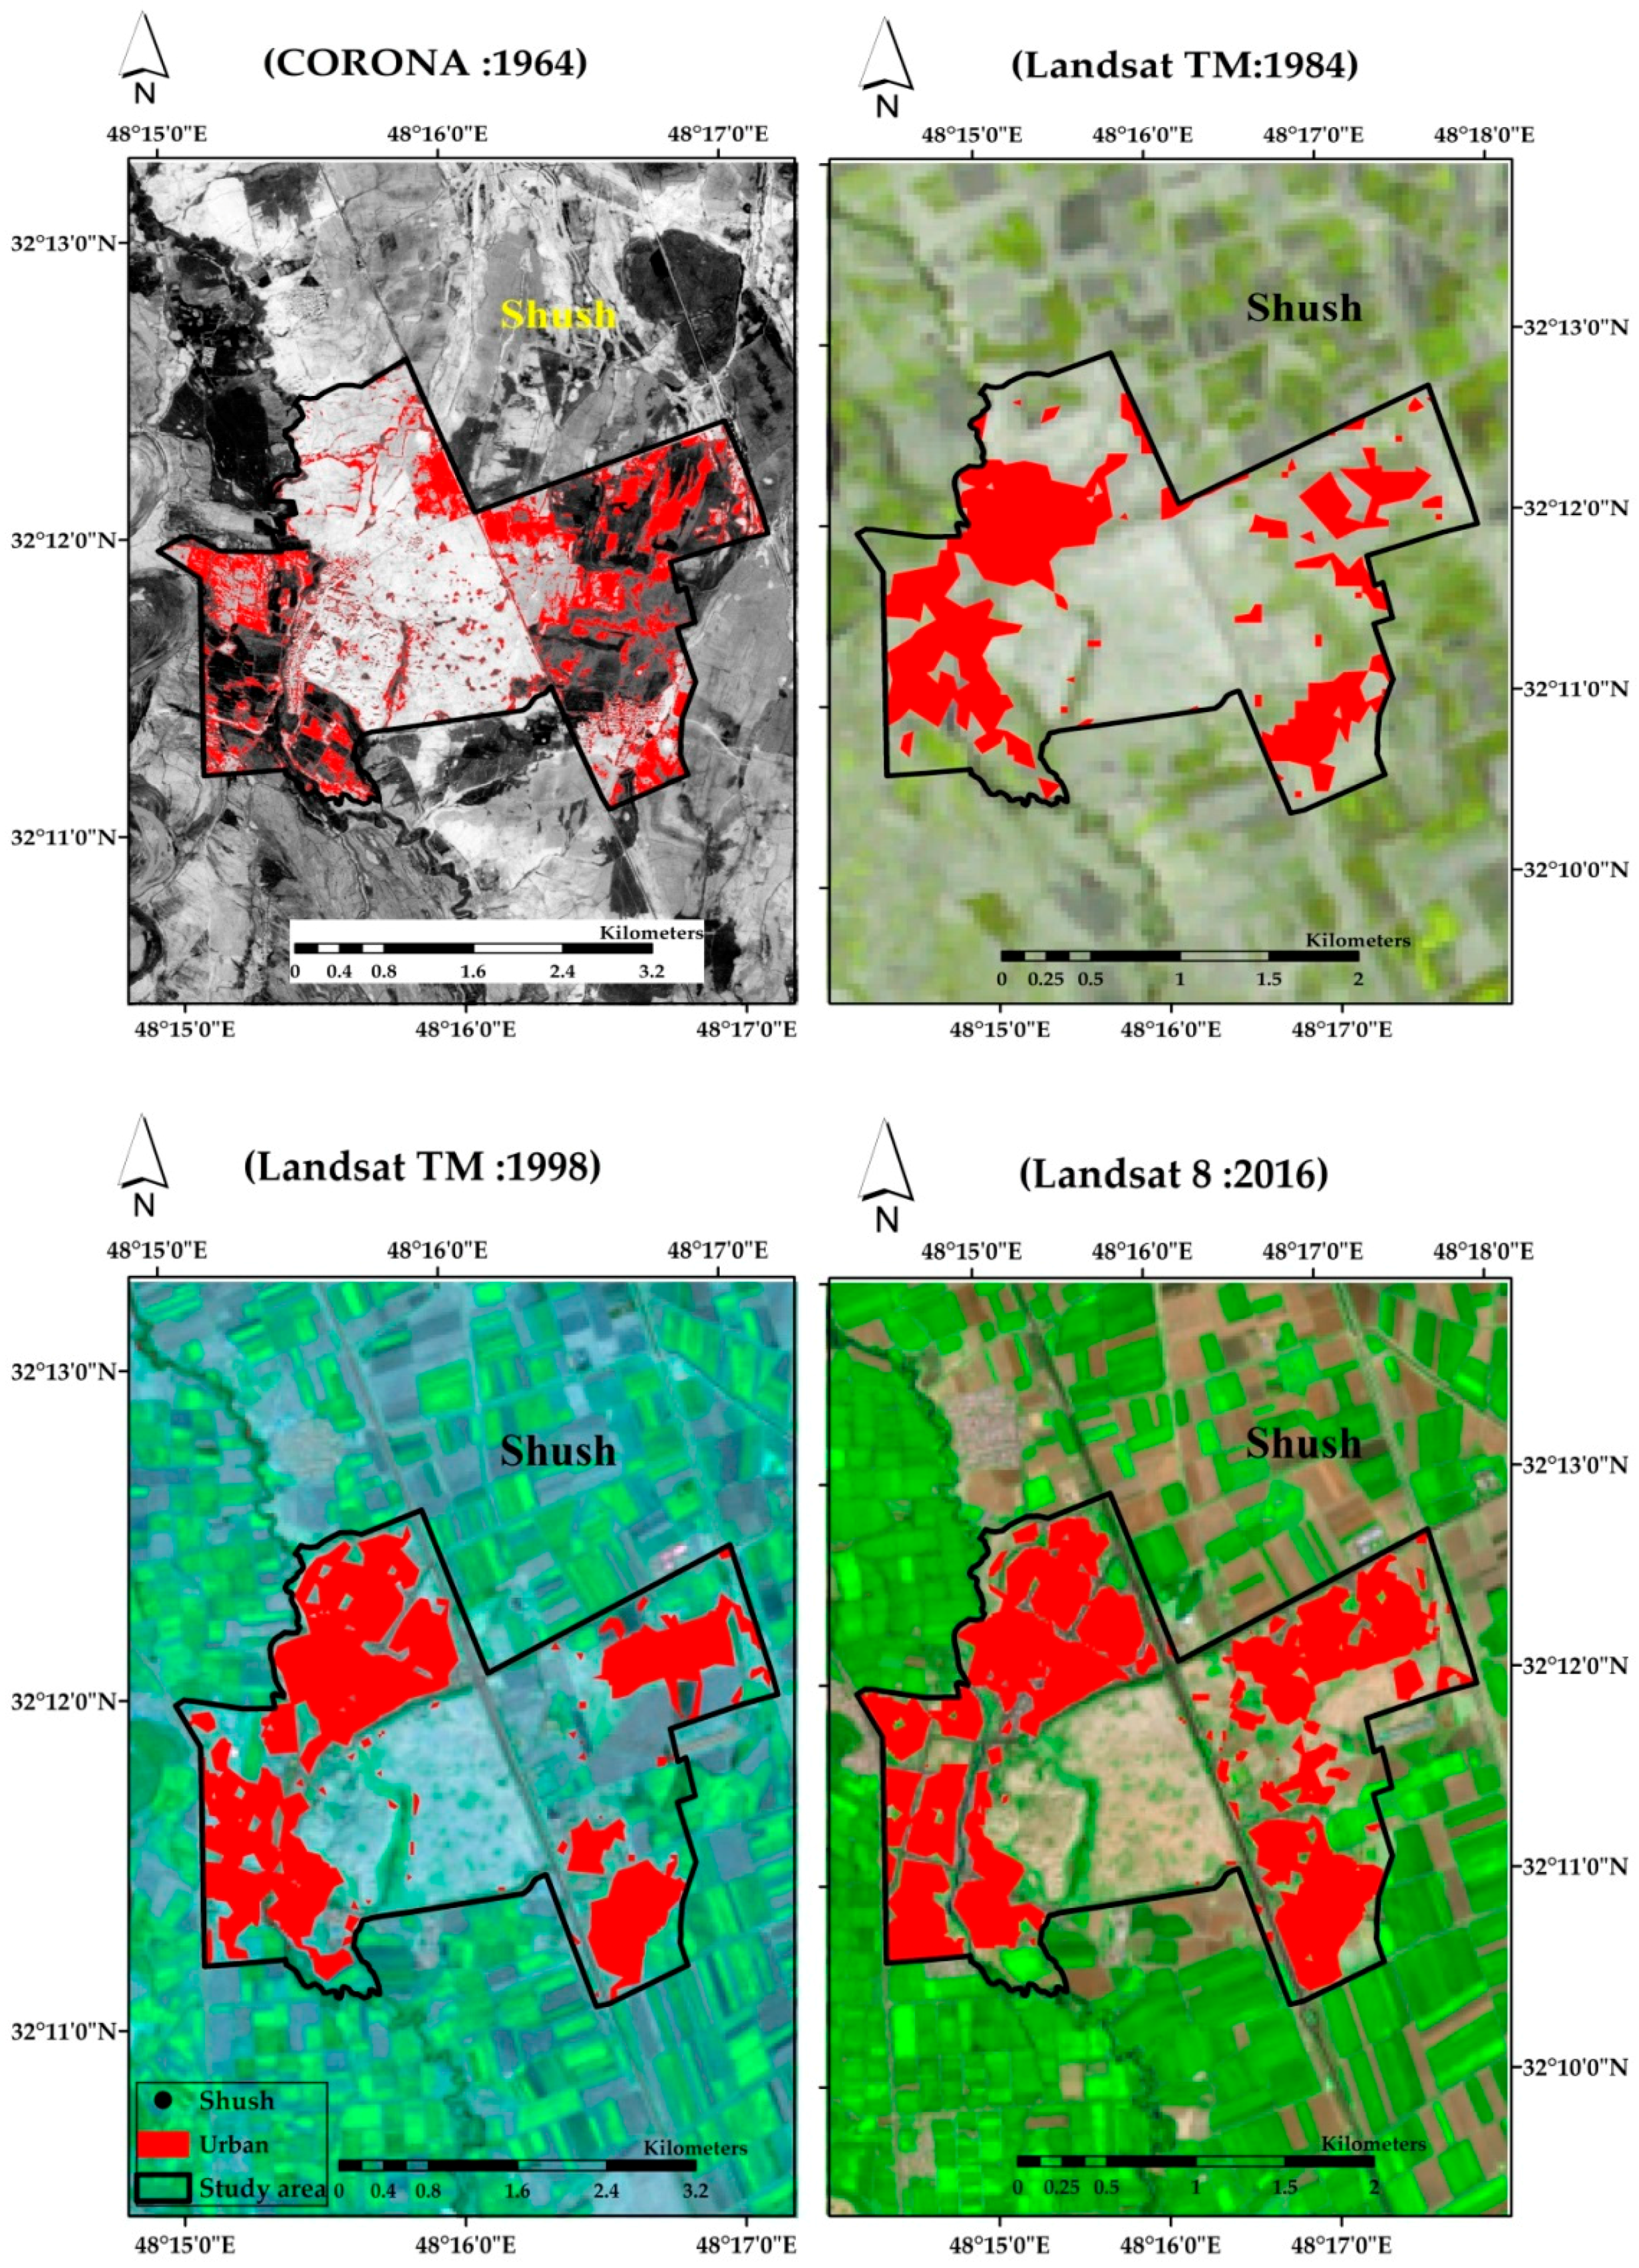
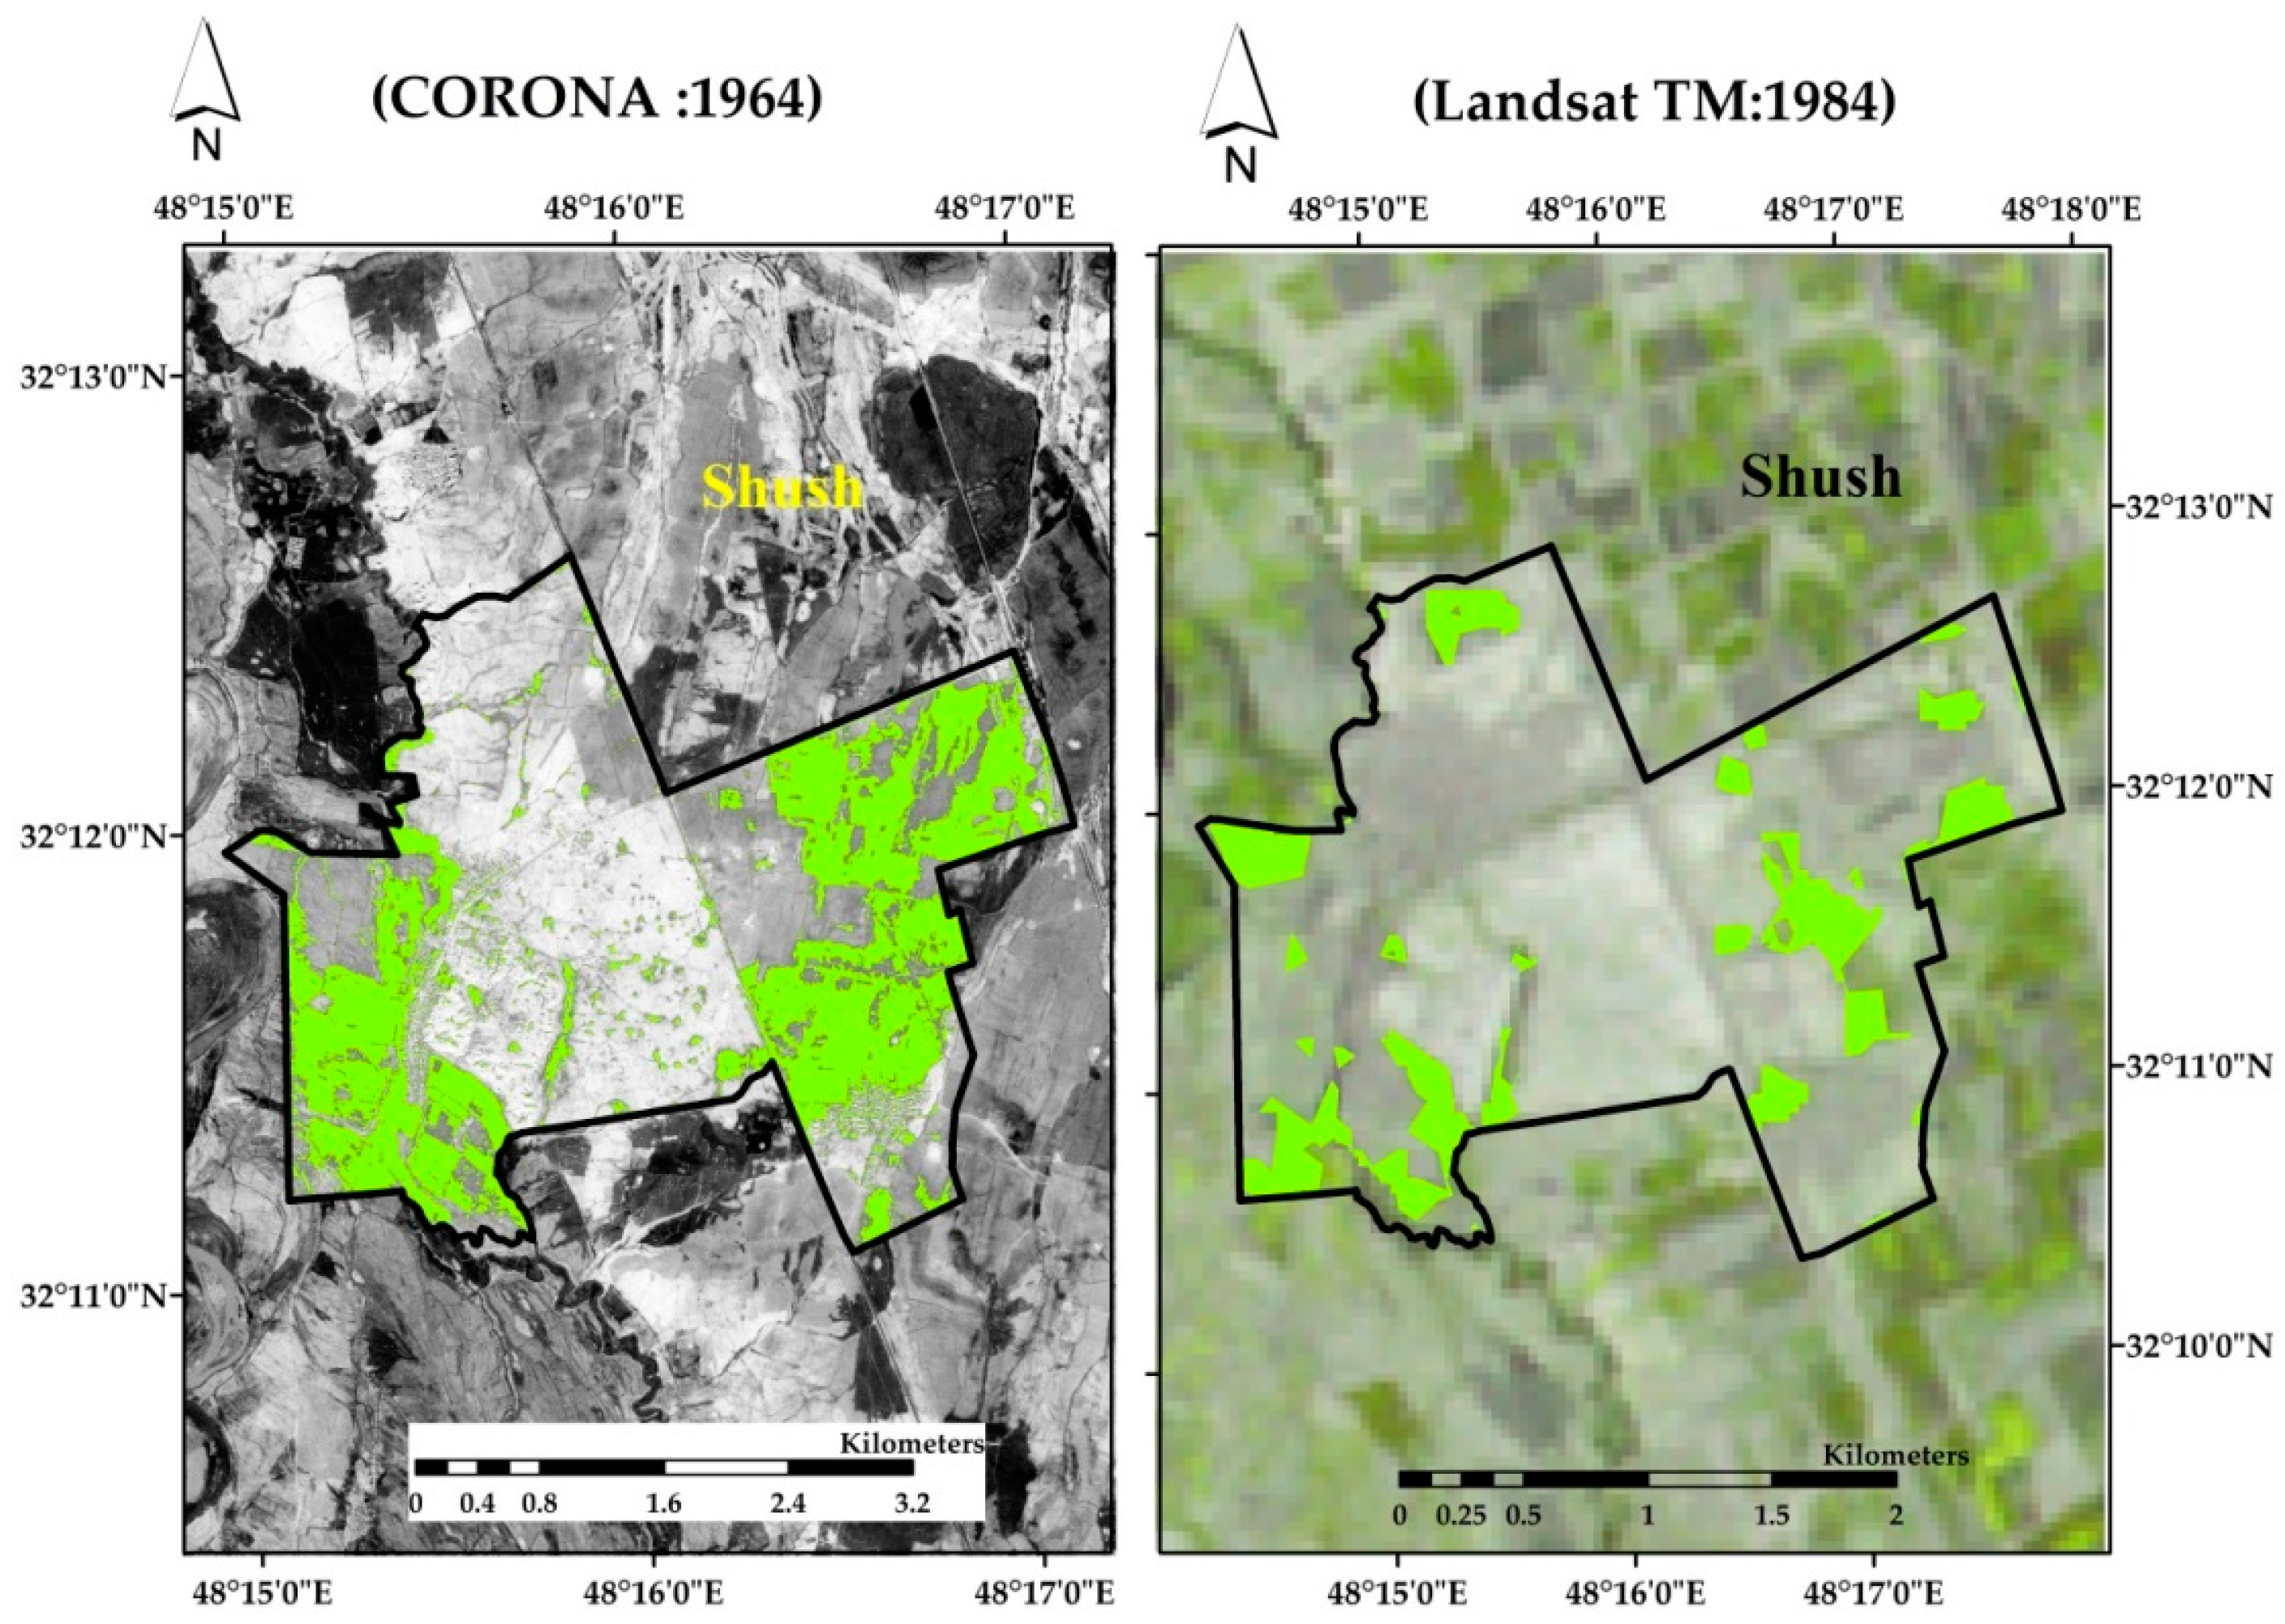
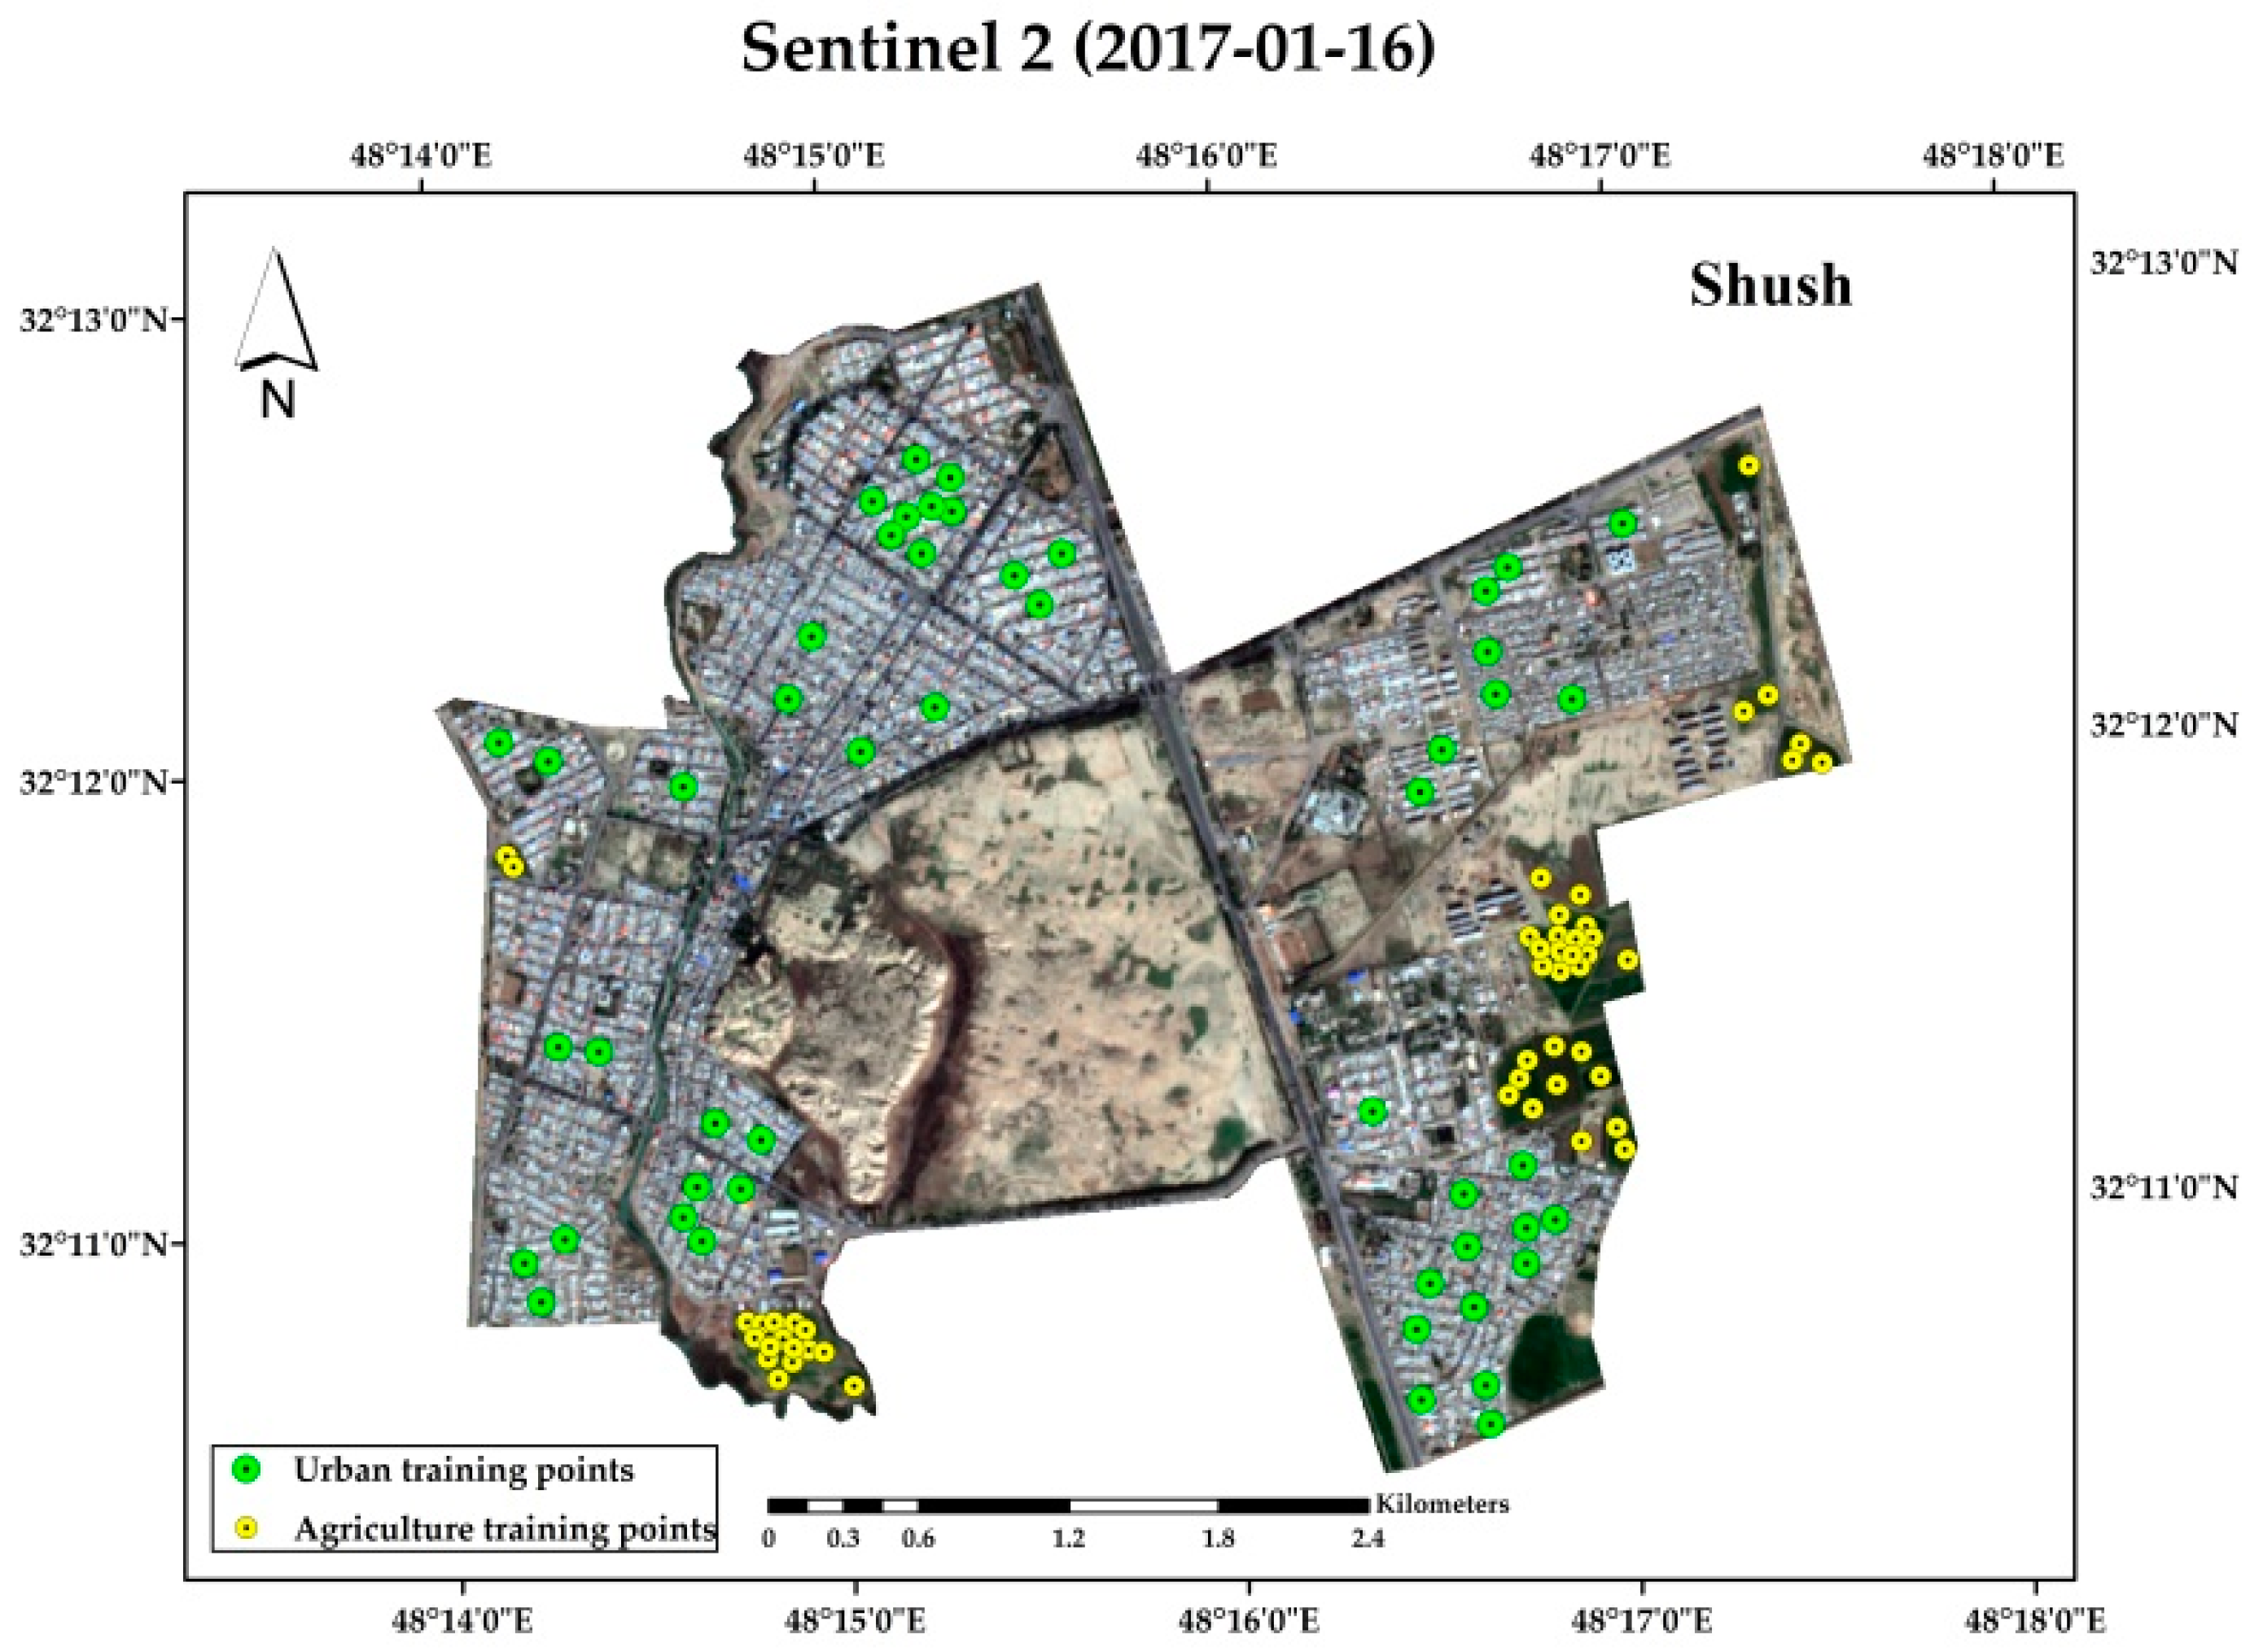
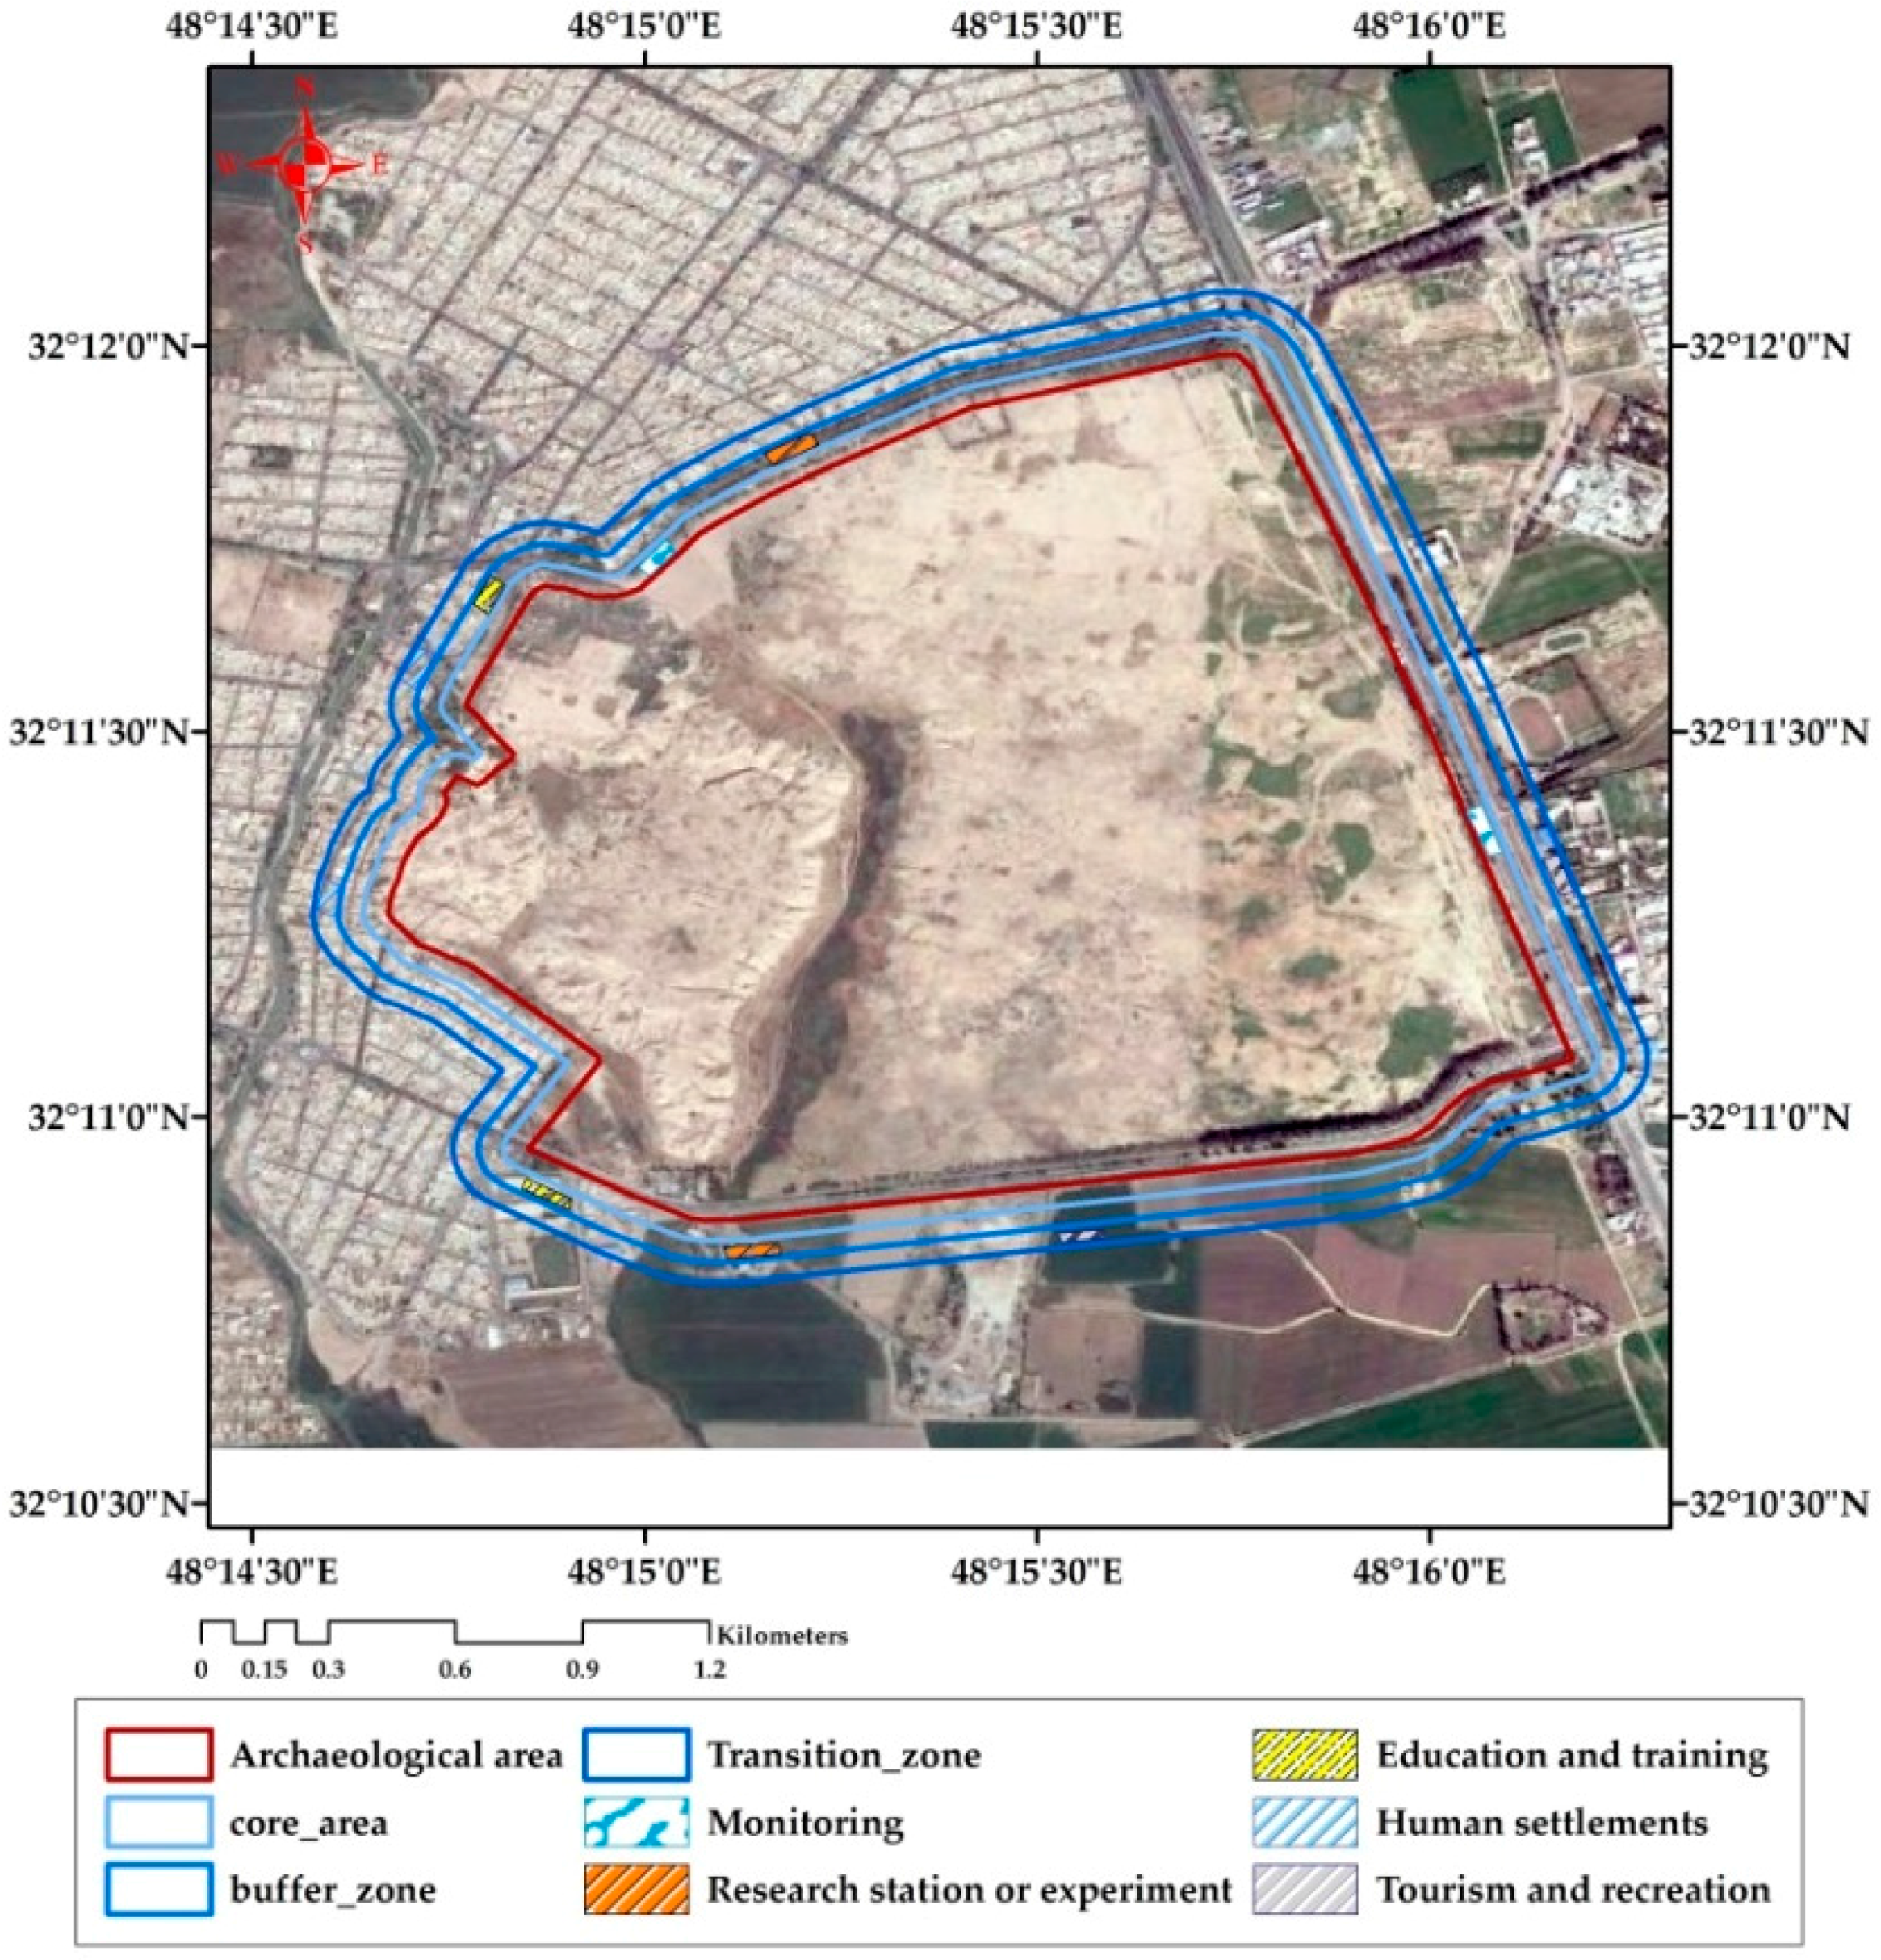
2.2. Shush, Iran
3. Materials and Methods
3.1. Materials
3.2. Methodology
3.2.1. Image Processing Rationale
3.2.2. Image Processing
Supervised and Unsupervised Classification of Images
Post Classification
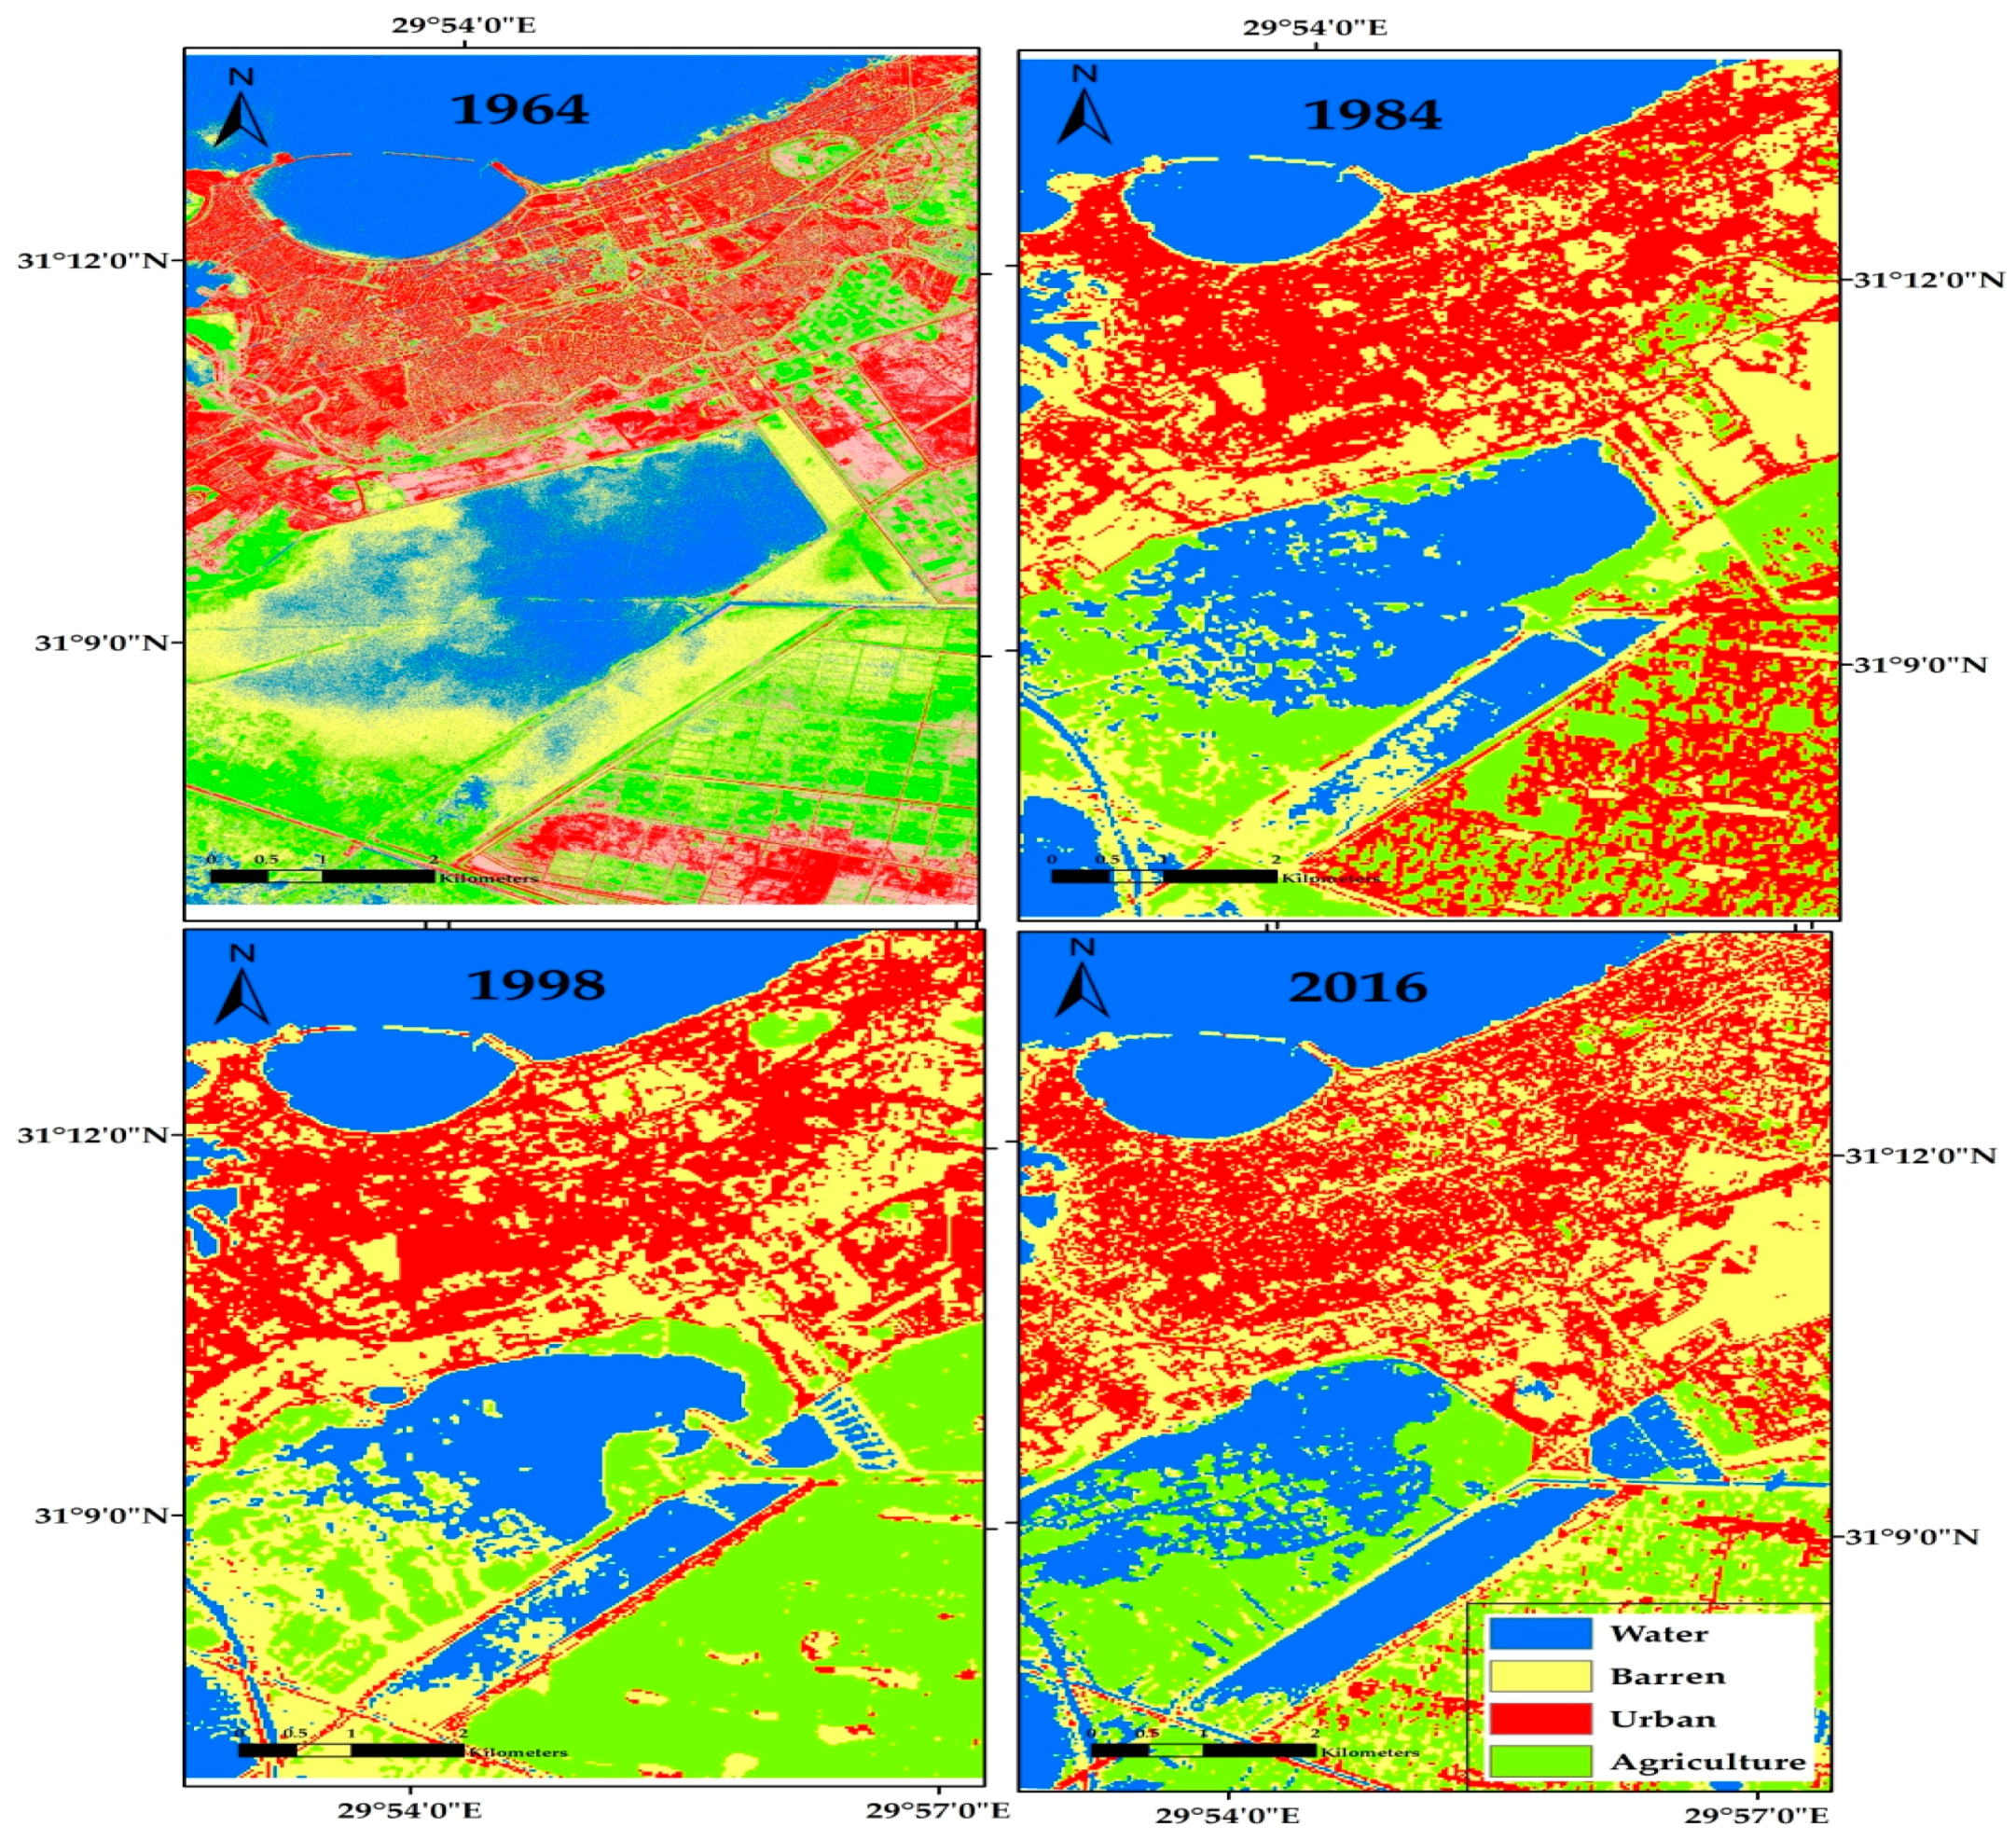
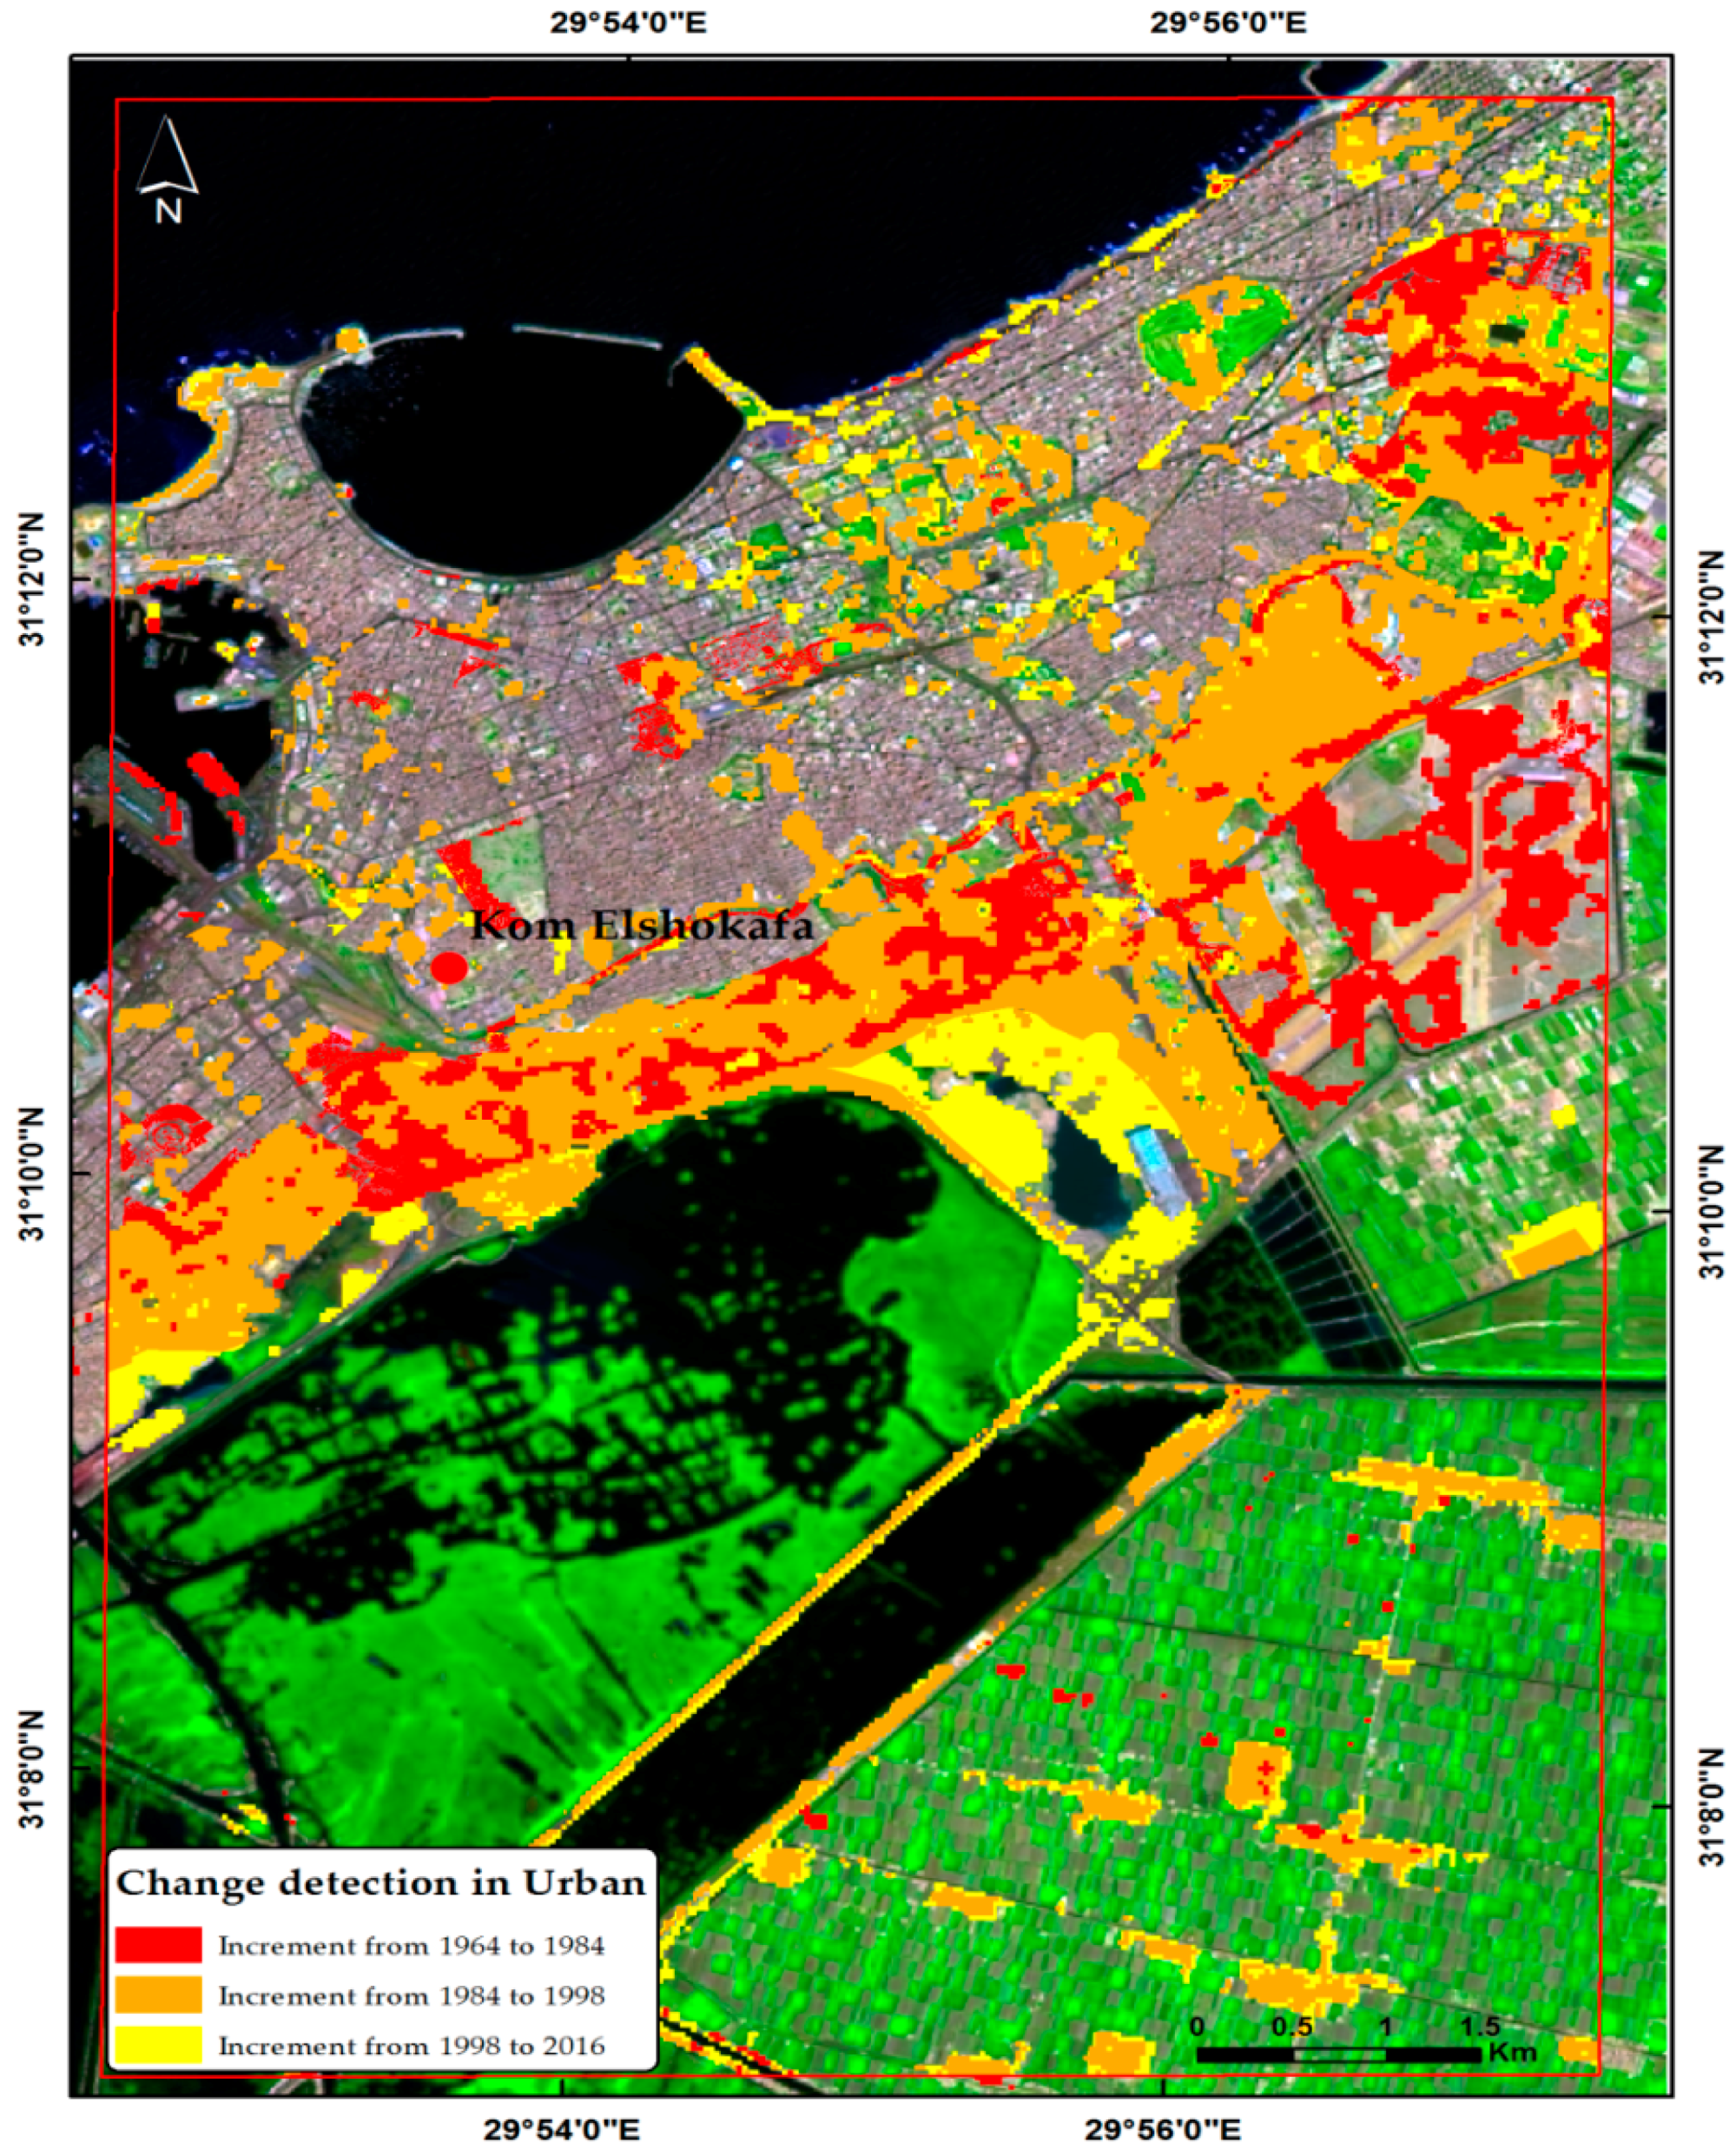
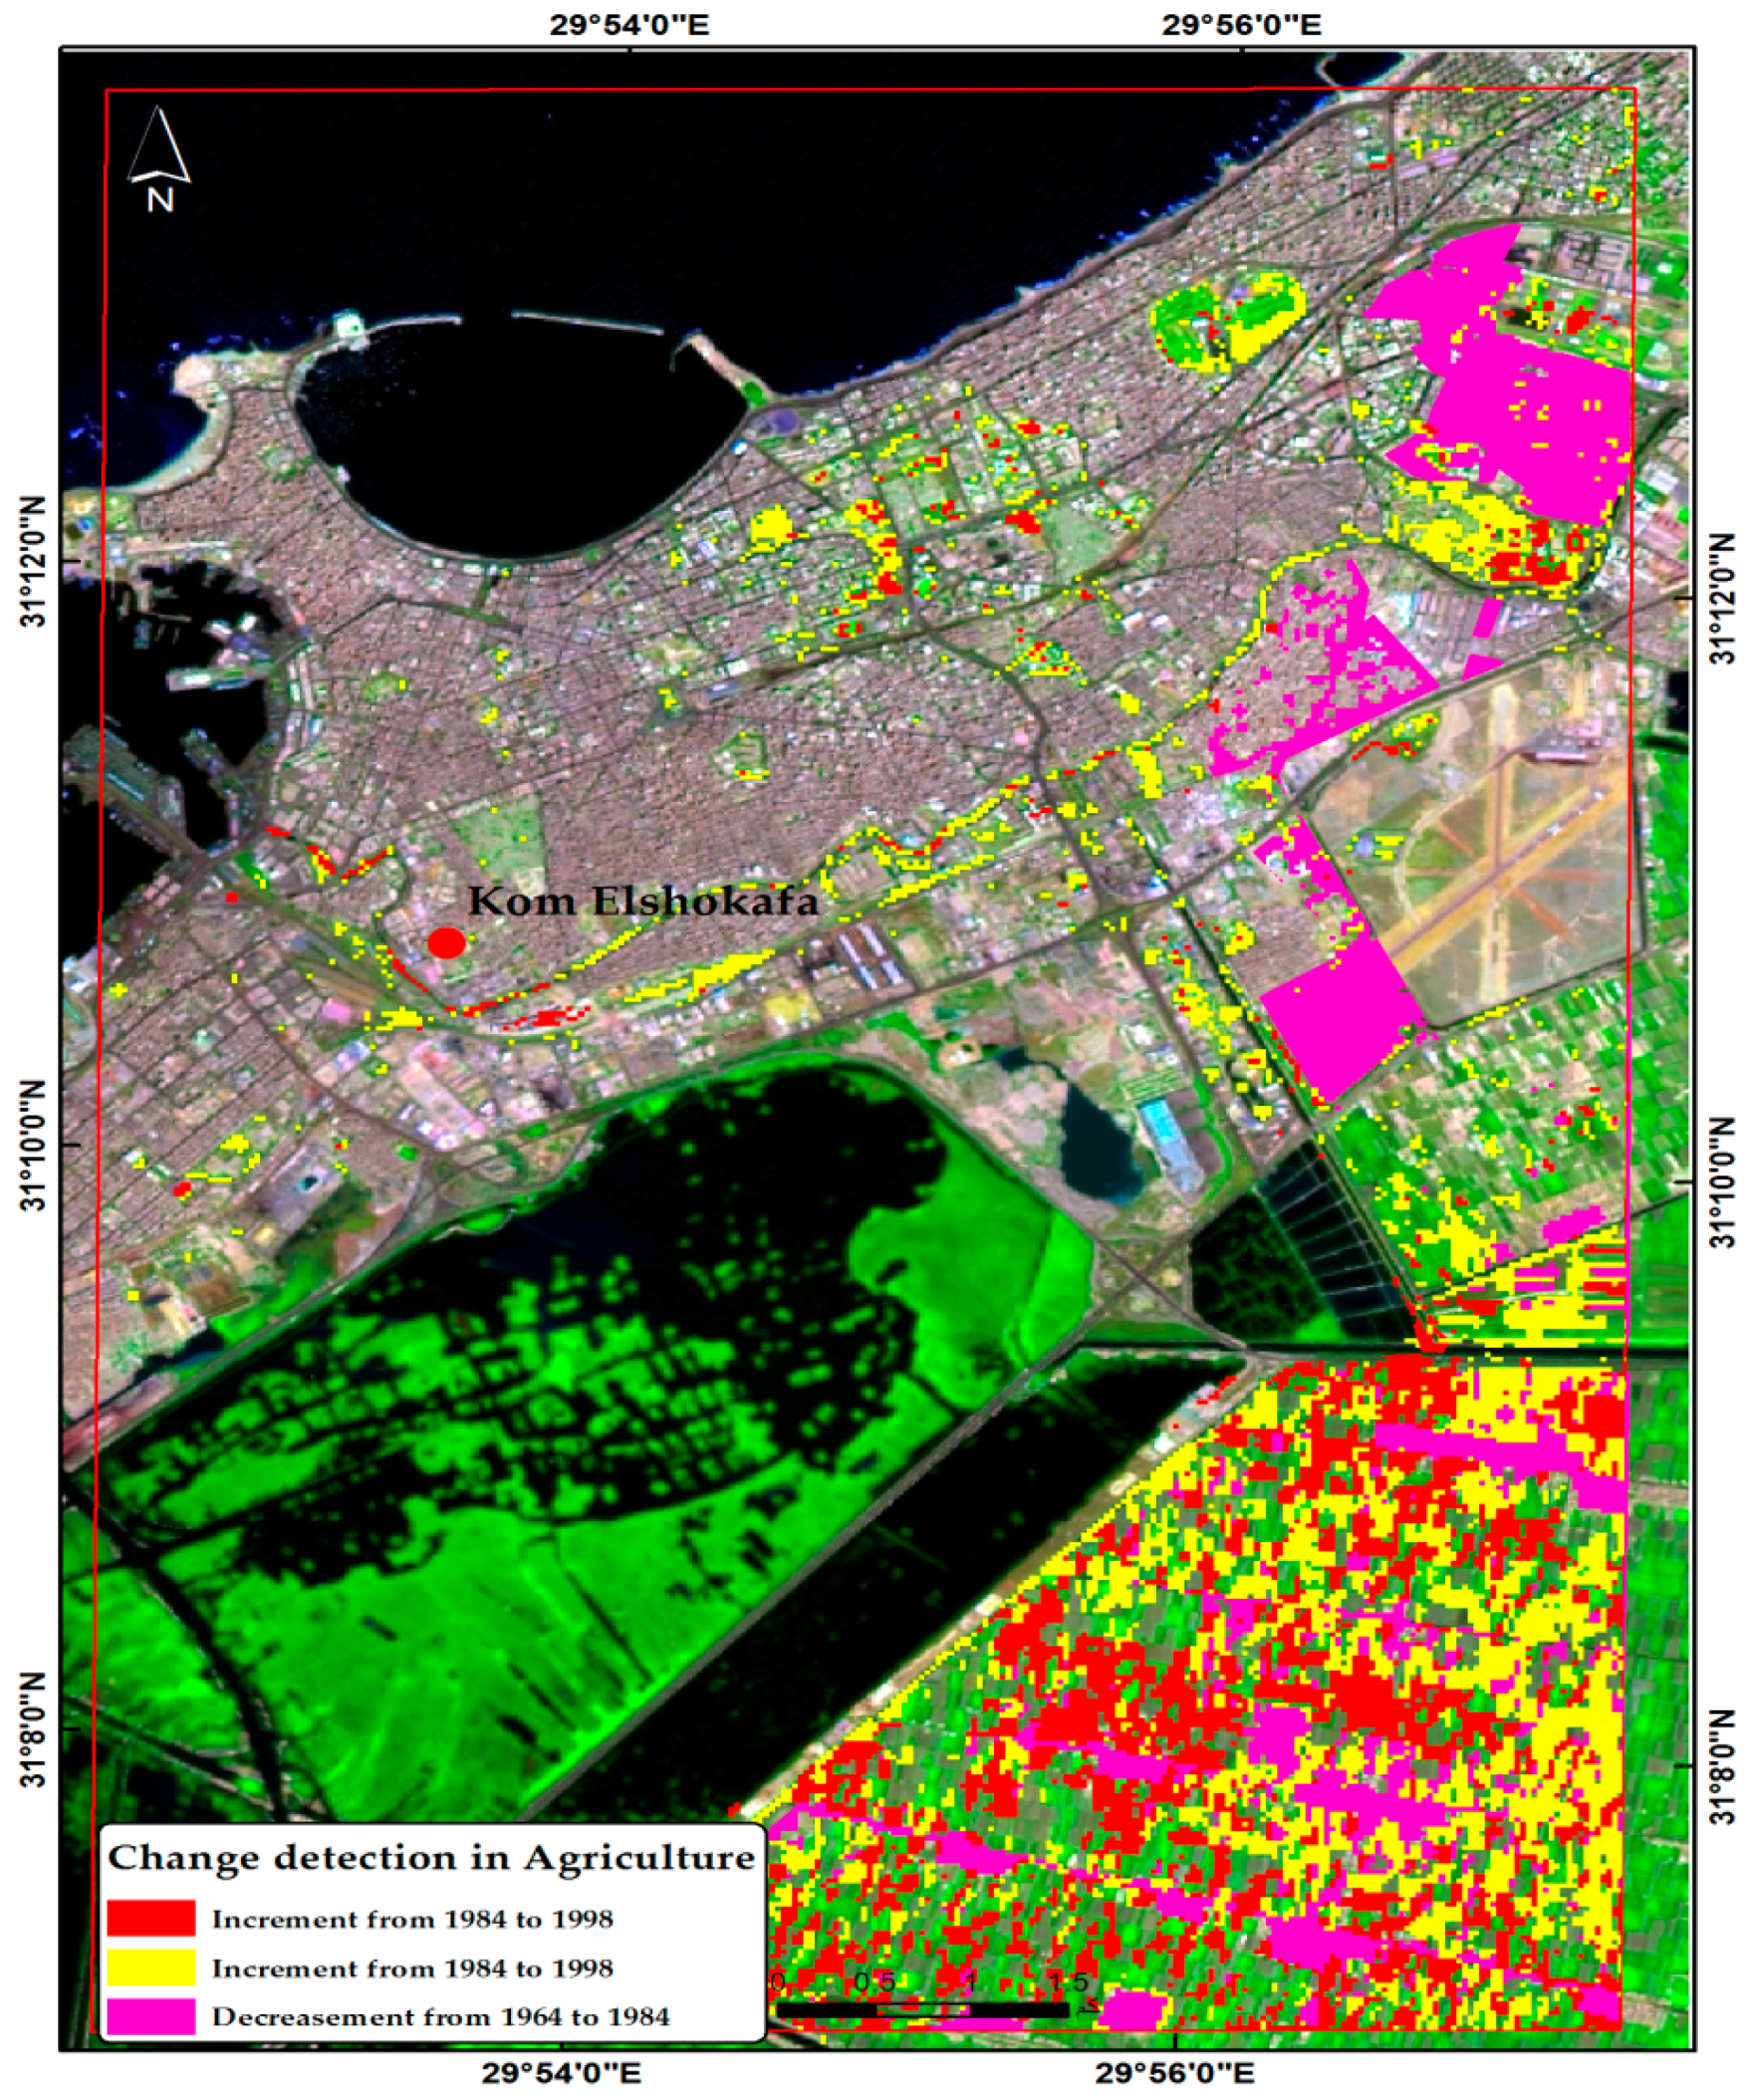
4. Results
5. Recommendation
6. Discussion
7. Conclusions
Acknowledgments
Author Contributions
Conflicts of Interest
References
- United Nations, Department of Economic and Social Affairs, Population Division. World Urbanization Prospects: The 2014 Revision, Highlights (ST/ESA/SER.A/352). Available online: http://esa.un.org/unpd/wup/Highlights/WUP2014-Highlights.pdf (accessed on 25 February 2015).
- The global partnership for environment and development: A guide to Agenda 21, post-Rio edition. 1993. Available online: https://catalog.hathitrust.org/Record/007191254 (accessed on 8 April 2017).
- The Istanbul Declaration on Human Settlements. Available online: http://www.jstor.org/stable/2137742 (accessed on 8 April 2017).
- Costanza, R. (Ed.) Ecological Economics: The Science and the Management of Sustainability; Columbia University Press: New York, NY, USA, 1991. [Google Scholar]
- Daly, H.E.; Cobb, J.J. For the Common Good; Beacon Press: Boston, MA, USA, 1990. [Google Scholar]
- Nijkamp, P. (Ed.) Sustainability of Urban Systems; Avebury: Aldershot, UK, 1990. [Google Scholar]
- Archibugi, F.; Nijkamp, P. (Eds.) Economy and Ecology: Towards Sustainable Development; Kluwer: Dordrecht, The Netherlands, 1989. [Google Scholar]
- Pearce, D.W. Blueprint 2: Sustaining the World Economy; Earthscan: London, UK, 1991. [Google Scholar]
- Amato, F.; Martellozzo, F.; Nolè, G.; Murgante, B. Preserving cultural heritage by supporting landscape planning with quantitative predictions of soil consumption. J. Cult. Herit. 2017, 23, 44–54. [Google Scholar] [CrossRef]
- United Nations Educational, Scientific and Cultural Organization, World Heritage Centre. Available online: http://whc.unesco.org/ (accessed on 18 December 2016).
- Nole, G.; Lanorte, A.; Murgante, B.; Lasaponara, R. Space Monitoring of urban sprawl. In EGU General Assembly Conference Abstracts; EGU: Vienna, Austria, 2012; Volume 14, p. 14067. [Google Scholar]
- Coluzzi, R.; Didonna, I. Multiscale/Multitemporal Urban pattern morphology monitoring in southern Italy by using Landsat TM time series. In EGU General Assembly Conference Abstracts; EGU: Vienna, Austria, 2009; Volume 11, p. 10555. [Google Scholar]
- Lasaponara, R.; Lanorte, A. Satellite time-series analysis. Int. J. Remote Sens. 2012, 33, 4649–4652. [Google Scholar] [CrossRef]
- Di Palma, F.; Amato, F.; Nolè, G.; Martellozzo, F.; Murgante, B. A SMAP Supervised Classification of Landsat Images for Urban Sprawl Evaluation. ISPRS Int. J. Geo-Inf. 2016, 5, 109. [Google Scholar] [CrossRef]
- Lasaponara, R.; Leucci, G.; Masini, N.; Persico, R.; Scardozzi, G. Towards an operative use of remote sensing for exploring the past using satellite data: The case study of Hierapolis (Turkey). Remote Sens. Environ. 2016, 174, 148–164. [Google Scholar] [CrossRef]
- Rizzo, E.; Orefici, G. New discoveries in the Piramide Naranjada in Cahuachi (Peru) using satellite, Ground Probing Radar and magnetic investigations. J. Archaeol. Sci. 2011, 38, 2031–2039. [Google Scholar]
- Masini, N.; Lasaponara, R.; Orefici, G. Addressing the challenge of detecting archaeological adobe structures in Southern Peru using QuickBird imagery. J. Cult. Herit. 2009, 10, e3–e9. [Google Scholar] [CrossRef]
- Amato, F.; Pontrandolfi, P.; Murgante, B. Supporting planning activities with the assessment and the prediction of urban sprawl using spatio-temporal analysis. Ecol. Inform. 2015, 30, 365–378. [Google Scholar]
- Nolè, G.; Lasaponara, R.; Murgante, B. Analyzing urban sprawl applying spatial autocorrelation techniques to multi-temporal satellite data. Urban Reg. Data Manag. UDMS Annu. 2013, 3, 161–170. [Google Scholar]
- Nolè, G.; Lasaponara, R.; Lanorte, A.; Murgante, B. Quantifying Urban Sprawl with Spatial Autocorrelation Techniques using Multi-Temporal Satellite Data. Int. J. Agric. Environ. Inf. Syst. 2014, 5, 19–37. [Google Scholar] [CrossRef]
- Nolè, G.; Murgante, B.; Calamita, G.; Lanorte, A.; Lasaponara, R. Evaluation of urban sprawl from space using open source technologies. Ecol. Inform. 2015, 26, 151–161. [Google Scholar] [CrossRef]
- Cigna, F.; Lasaponara, R.; Masini, N.; Milillo, P.; Tapete, D. Persistent Scatterer Interferometry Processing of COSMO-SkyMed StripMap HIMAGE Time Series to Depict Deformation of the Historic Centre of Rome, Italy. Remote Sens. 2014, 6, 12593–12618. [Google Scholar] [CrossRef]
- Lasaponara, R. Editorial of special issue on Identification of traces of past human activities fossilized in the modern landscape. J. Cult. Herit. 2017, 23, 2–4. [Google Scholar] [CrossRef]
- Winograd, I.J. Archaeology and Public Perception of a Trans-Scientific Problem; Disposal of Toxic Wastes in the Unsaturated Zone; U.S. Geological Survey: Reston, VA, USA, 1986.
- Masini, N.; Lasaponara, R. Satellite-based recognition of landscape archaeological features related to ancient human transformation. J. Geophys. Eng. 2006, 3, 230–235. [Google Scholar] [CrossRef]
- Environment Agency and English Heritage. Piling in layered ground: risks to groundwater and archaeology. 2006. Available online: https://www.gov.uk/government/publications/piling-in-layered-ground-risks-to-groundwater-and-archaeology (accessed on 1 October 2006).
- Lasaponara, R.; Masini, N. Satellite remote sensing in archaeology: Past, present and future perspectives. J. Archaeol. Sci. 2011, 9, 1995–2002. [Google Scholar] [CrossRef]
- Hegazy, I.R.; Kaloop, M.R. Monitoring urban growth and land use change detection with GIS and remote sensing techniques in Daqahlia governorate Egypt. Int. J. Sustain. Built Environ. 2015, 4, 117–124. [Google Scholar] [CrossRef]
- Le, T.; Chang, C.-P.; Nguyen, X.; Yhokha, A. TerraSAR-X Data for High-Precision Land Subsidence Monitoring: A Case Study in the Historical Centre of Hanoi, Vietnam. Remote Sens. 2016, 8, 338. [Google Scholar] [CrossRef]
- Lasaponara, R.; Masini, N. Satellite Synthetic Aperture Radar in Archaeology and Cultural Landscape: An Overview. Archaeol. Prospect. 2013, 20, 71–78. [Google Scholar] [CrossRef]
- Stewart, C.; Lasaponara, R.; Schiavon, G. Multi-frequency, polarimetric SAR analysis for archaeological prospection. Int. J. Appl. Earth Observ. Geoinf. 2014, 28, 211–219. [Google Scholar] [CrossRef]
- Tapete, D.; Cigna, F.; Masini, N.; Lasaponara, R. Prospection and monitoring of the archaeological heritage of Nasca, Peru, with ENVISAT ASAR. Archaeol. Prospect. 2013, 20, 133–147. [Google Scholar] [CrossRef]
- Moya, K.M. Alexandria and the Hellenistic World. Available online: http://www.moyak.com/papers/ancient-alexandria.html (accessed on 8 September 2016).
- Sayed, H. Seismic Response Analysis and Protection of Underground Monumental Structures—The Catacombs of Kom EL-Shoqafa, Alexandria, Egypt; INTECH Open Access: Rijeka, Croatia, 2012. [Google Scholar]
- Empereur, J.Y.; Compoint, S. Alexandria Rediscovered. Available online: https://books.google.it/books/about/Alexandria_rediscovered.html?id=3tEVAQAAIAAJ&redir_esc=y (accessed on 15 December 2016).
- Empereur, J.Y.; Clement, C.; Gout, J.F. A Short Guide to the Catacombs of Kom El Shoqafa Alexandria; Serapis Publishing: Alexandria, KY, USA; 1995. [Google Scholar]
- Ali, M.A.M.; Kotb, A.A.; Elsherif, A.; Hisham, R.; Osama, M. Environmental’s Design Role in the Reviving and Preserving of Architectural Heritage Case Study (Catacombs of Kom El Shoqafa). Procedia Soc. Behav. Sci. 2016, 225, 132–144. [Google Scholar] [CrossRef]
- McKenzie, J. The Architecture of Alexandria and Egypt; C. 300 B.C. to A.D. 700; Yale University Press: New Haven, CT, USA, 2007. [Google Scholar]
- Savvopoulos, K. Archeology of Alexandrea in Aegypto. The Role of the Egyptian Tradition in the Hellenistic and Roman Periods: Ideology, Culture, Identity, and Public Life. Ph.D. Thesis, Leiden University, Leiden, The Netherlands, 2011. [Google Scholar]
- Frakes, J.F.D. Monumental Tombs of Ancient Alexandria: The Theater of the Dead. J. Soc. Archit. Histor. 2003. [Google Scholar] [CrossRef]
- Physical location map of Egypt, National Imagery and Mapping Agency data, USA. Available online: https://commons.wikimedia.org/wiki/File:Egypt_relief_location_map_2008_to_2011.jpg (accessed on 6 October 2011).
- Bader, N.A.; Hassan, R.A.E. Examination and Conservation of Helal El-Beah Mosque, Dakahlia, Egypt. J. Build. Constr. Plan. Res. 2016, 4, 103–118. [Google Scholar] [CrossRef]
- Shush—UNESCO World Heritage Centre. Available online: http://whc.unesco.org/en/tentativelists/894 (accessed on 15 December 2016).
- Nouri, J.; Mahvi, A.H.; Babaei, A.; Ahmadpour, E. Regional pattern distribution of groundwater fluoride in the Shush aquifer of Khuzestan County. Iran. Fluoride 2006, 39, 321–325. [Google Scholar]
- Jahanshahi, S.; Siavash Rashidi, S. Designing an Institute of History of Ancient Iran Based on an Approach to Reinvention of Architectural and Local Values in Kenar Sandal Area. J. Sci. Res. Dev. Niger. 2015, 2, 78–86. [Google Scholar]
- Shahmirzadi, S. A Study on Evulution of Archaeological Studies in Iran. Tehran, 1990. Available online: https://www.google.it/_/chrome/newtab?espv=2&ie=UTF-8 (accessed on 15 December 2016).
- Hodjat, M. Cultural Heritage in Iran: Policies for an Islamic Country. 1995. Available online: http://etheses.whiterose.ac.uk/2460/1/DX193597.pdf (accessed on 8 August 2013).
- Mirza-Mohammad-Ali-Khan, Farid-ol-Molk-Hamadani. Memoirs of Farid from 1874–1917; Zawar: Tehran, Iran, 1975. [Google Scholar]
- Afshar, I. Roznameh Khaterat-E Etemad Al-Saltaneh; Amir-Kabir Press: Tehran, Iran, 1966. [Google Scholar]
- United Nations Educational, Scientific and Cultural Organization, World Heritage Centre. Available online: http://whc.unesco.org/en/list/1455/ (accessed on 25 February 2017).
- Arb, O. Determining Rate Development of Counties of Khuzestan Province Based on Various Indices of Development. Indian J. Fundam. Appl. Life Sci. 2015, 5, 977–985. [Google Scholar]
- Gomez, D.; Montero, J. Determining the accuracy in image supervised classification problems. In Proceedings of the 7th Conference of the European Society for Fuzzy Logic and Technology (EUSFLAT-2011), Paris, France, 18–22 July 2011. [Google Scholar]
- Tayyebi, A.; Pijanowski, B.C.; Linderman, M.; Gratton, C. Comparing three global parametric and local non-parametric models to simulate land use change in diverse areas of the world. Environ. Model. Softw. 2014, 59, 202–221. [Google Scholar] [CrossRef]
- Tayyebi, A.; Pijanowski, B.C. Modeling multiple land use changes using ANN, CART and MARS: Comparing tradeoffs in goodness of fit and explanatory power of data mining tools. Int. J. Appl. Earth Obs. Geoinf. 2014, 28, 102–116. [Google Scholar] [CrossRef]
- Lasaponara, R.; Elfadaly, A.; Attia, W. Low Cost Space Technologies for Operational Change Detection Monitoring Around the Archaeological Area of Esna-Egypt. Comput. Sci. Appl. 2016, 9787, 611–621. [Google Scholar]
- Lasaponara, R.; Masini, N. Advances on Remote Sensing for Archaeology and Cultural Heritage Management. In Proceedings of the 1st International EARSeL Workshop, Rome, Italy, 30 September–4 October 2008; pp. 3–6. [Google Scholar]
- Cowley, D.C. Remote Sensing for Archaeological Heritage Management. In Proceedings of the 11th EAC Heritage Management Symposium, Reykjavík, Iceland, 25–27 March 2010. [Google Scholar]
- Akasheh, T.S. Ancient and modern watershed management in Petra. Near East. Archaeol. 2002, 65, 220–224. [Google Scholar] [CrossRef]
- Parcak, S. Satellite Remote Sensing for Archaeology; Routledge Publication: London, UK, 2009; p. 286. [Google Scholar]
- Cassar, M.; Brimblecombe, P.; Nixon, T.; Price, C.; Sabbioni, C.; Jimenez, S.; Van Balen, K. Technological Requirements for Solutions in the Conservation and Protection of Historic Monuments and Archaeological Remains; In Assessment (p. 52); European Parliament, Directorate-General for Research Directorate A STOA Programme: Luxembourg, 2001; p. 52. [Google Scholar]
- El-Hattab, M.M. Applying post classification change detection technique to monitor an Egyptian coastal zone (Abu Qir Bay), Egypt. J. Remote Sens. Space Sci. 2016, 19, 23–36. [Google Scholar]
- Morris, B.L.; Lawrence, A.R.; Chilton, P.J.; Adams, B.; Calow, R.C.; Klinck, B.A. Groundwater and Its Susceptibility to Degradation: A Global Assessment of the Problem and Options for Management; United Nations Environment Programme: Nairobi, Kenya, 2003. [Google Scholar]
- Groundwater Technical Workgroup. Evaluation of Models and Tools for Assessing Groundwater Availability and Sustainability; Minnesota Department of Natural Resources: Minnesota, MI, USA, 2010.
- Geremia, F.; Bentivenga, M.; Palladino, G. Environmental Geology Applied to geoconservation in the interaction between geosites and linear infrastructures in South-Eastern Italy. Geoheritage 2015, 7, 33–46. [Google Scholar]


| Number | Satellite | Sensor | Resolution (M) | Acquisition Date | Source |
|---|---|---|---|---|---|
| 1 | Corona | KH-4B | 1.8 m | August 1964 | USGS |
| 2 | Landsat | TM | 30 m | September 1984 | GLCF |
| 3 | Landsat | ETM+ | 30 m | October 1998 | GLCF |
| 4 | Landsat | OLI | 30 m | September 2016 | USGS |
| Year | Kom el Shoqafa | Shush | ||
|---|---|---|---|---|
| Kappa Coefficient | Overall Accuracy | Kappa Coefficient | Overall Accuracy | |
| 1984 | 0.89 | 92.79% | 0.67 | 80.00% |
| 1998 | 0.95 | 97.14% | 0.95 | 96.83% |
| 2016 | 0.92 | 95.00% | 0.92 | 98.86% |
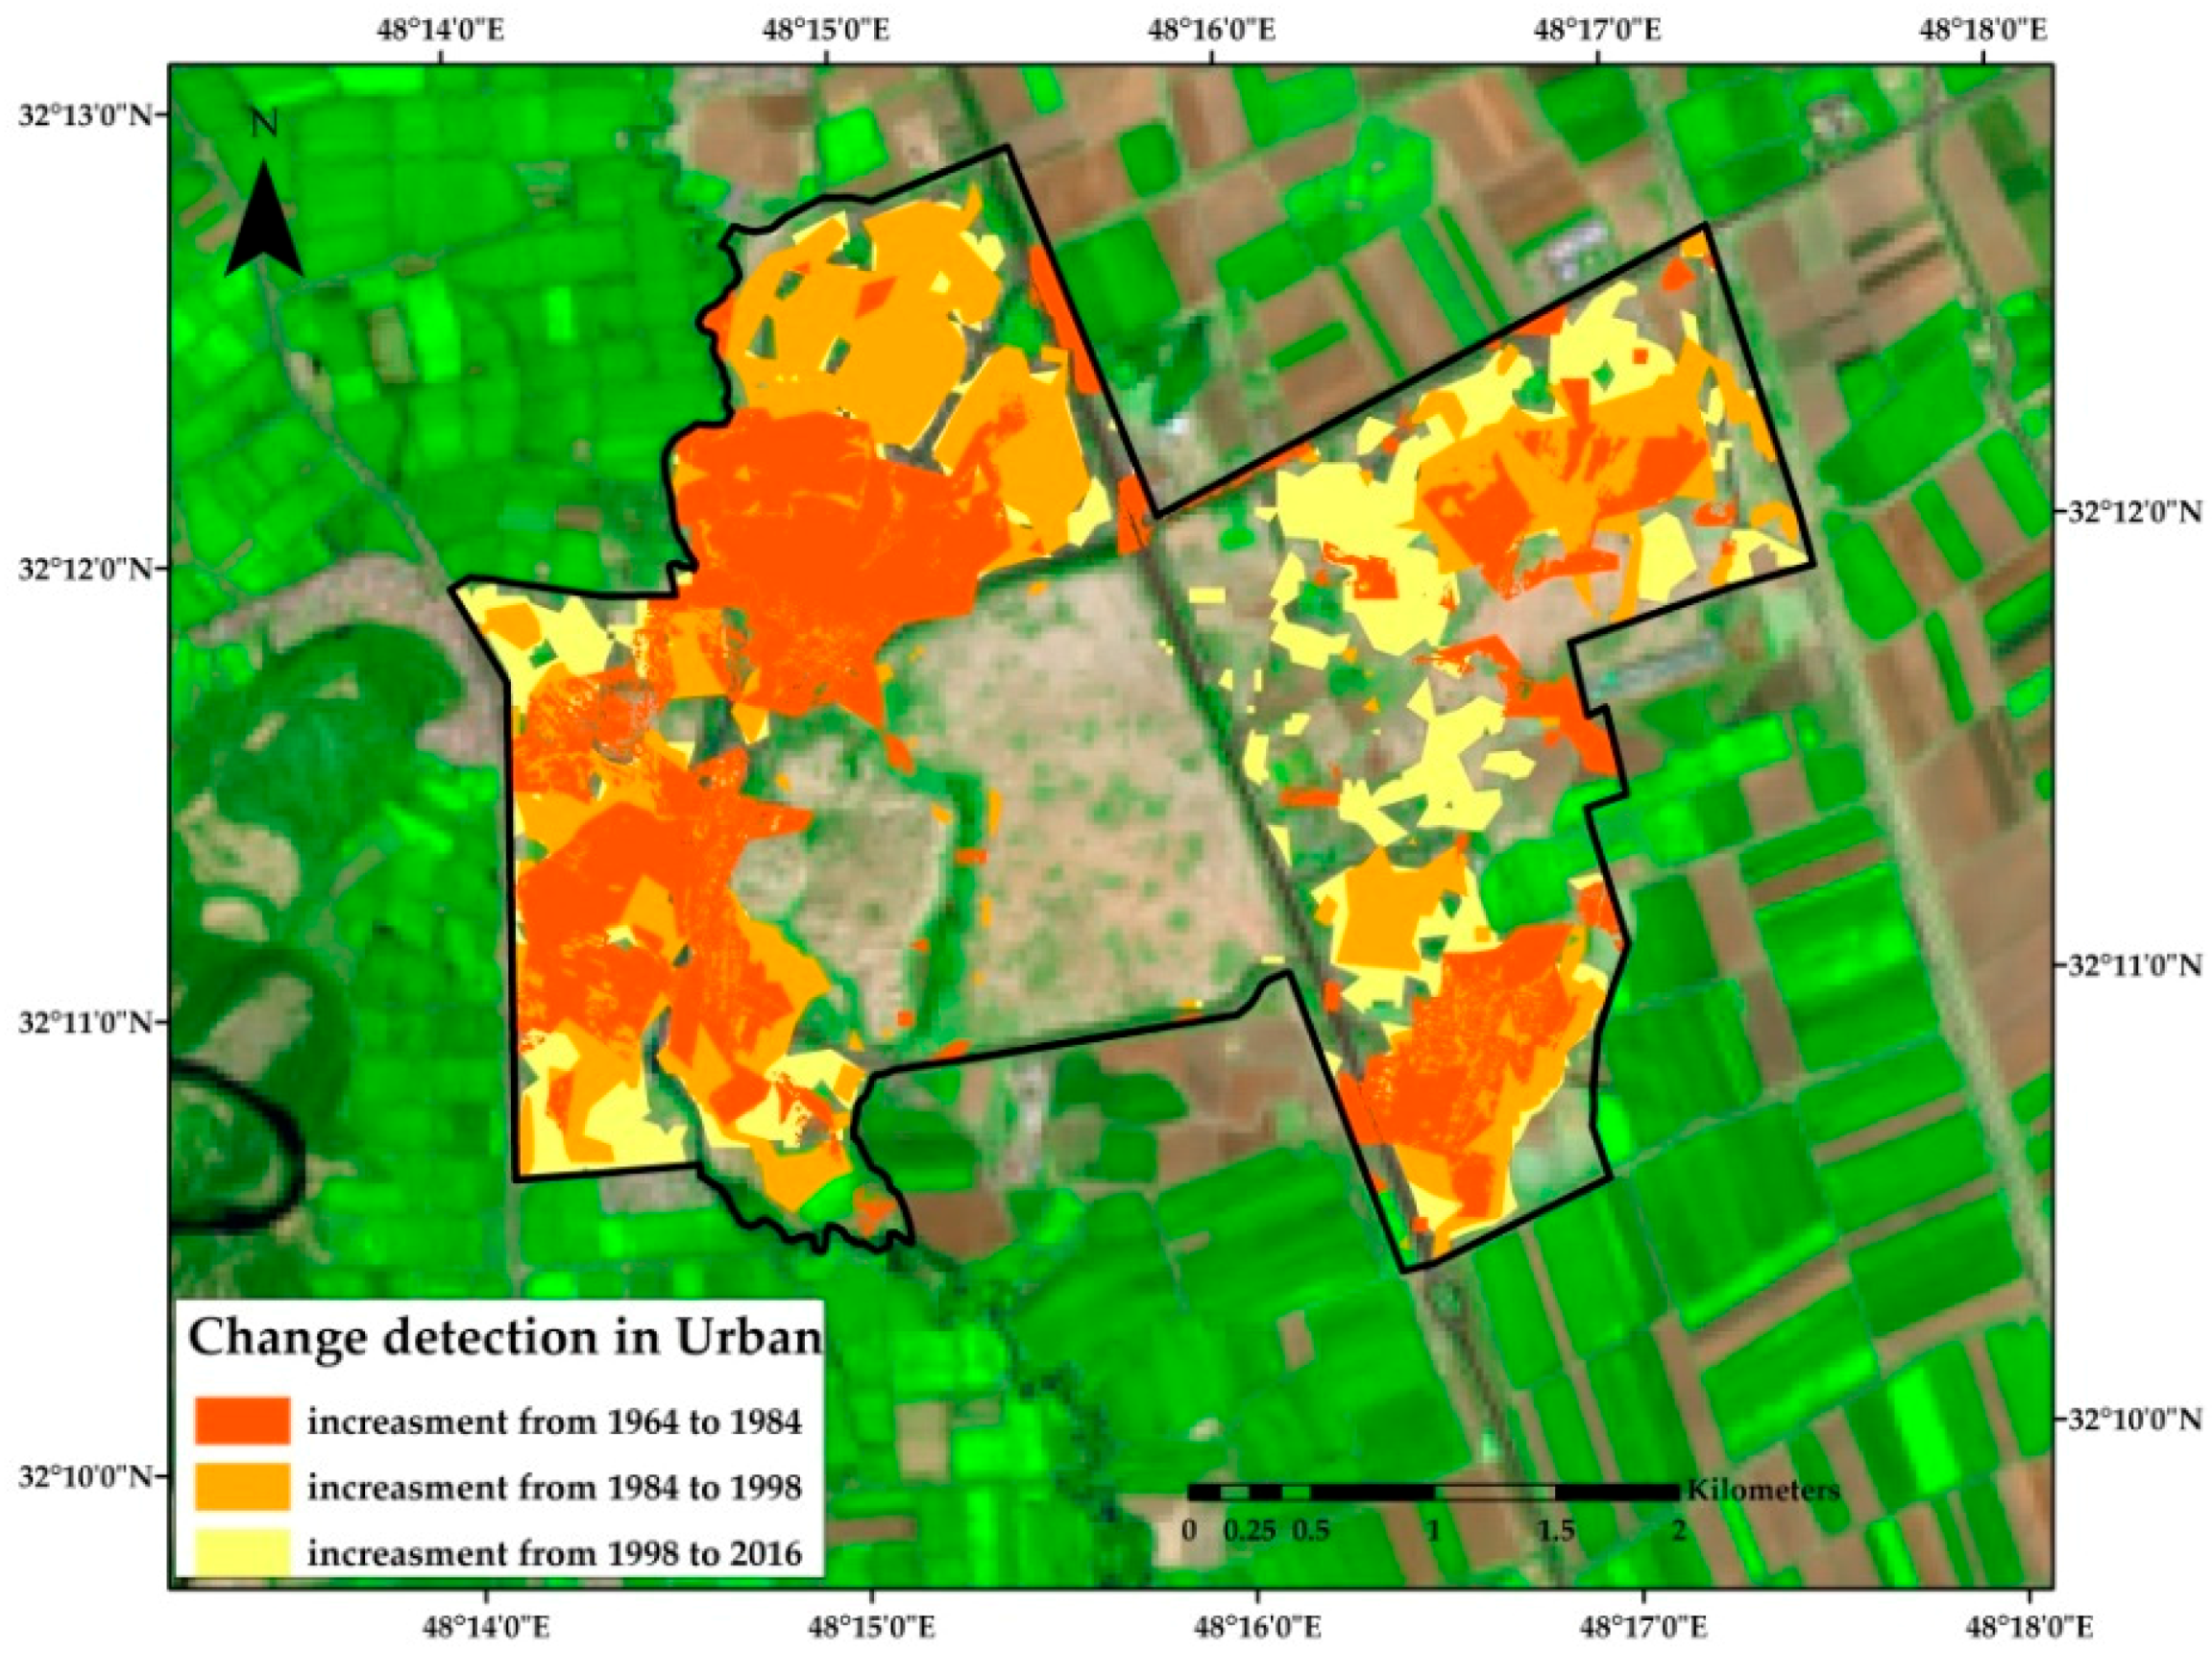
| Class | Study Area | Area 1964 (km2) | Change Detection ±km2 | Area 1984 (km2) | Change Detection ±km2 | Area 1998 (km2) | Change Detection ±km2 | Area 2016 (km2) |
|---|---|---|---|---|---|---|---|---|
| Urban | (Kom el Shoqafa) | 21,065 | 2315 | 23,380 | 6777 | 30,158 | 3634 | 33,792 |
| (Shush) | 2744 | 1433 | 4177 | 945 | 5122 | 1012 | 6134 | |
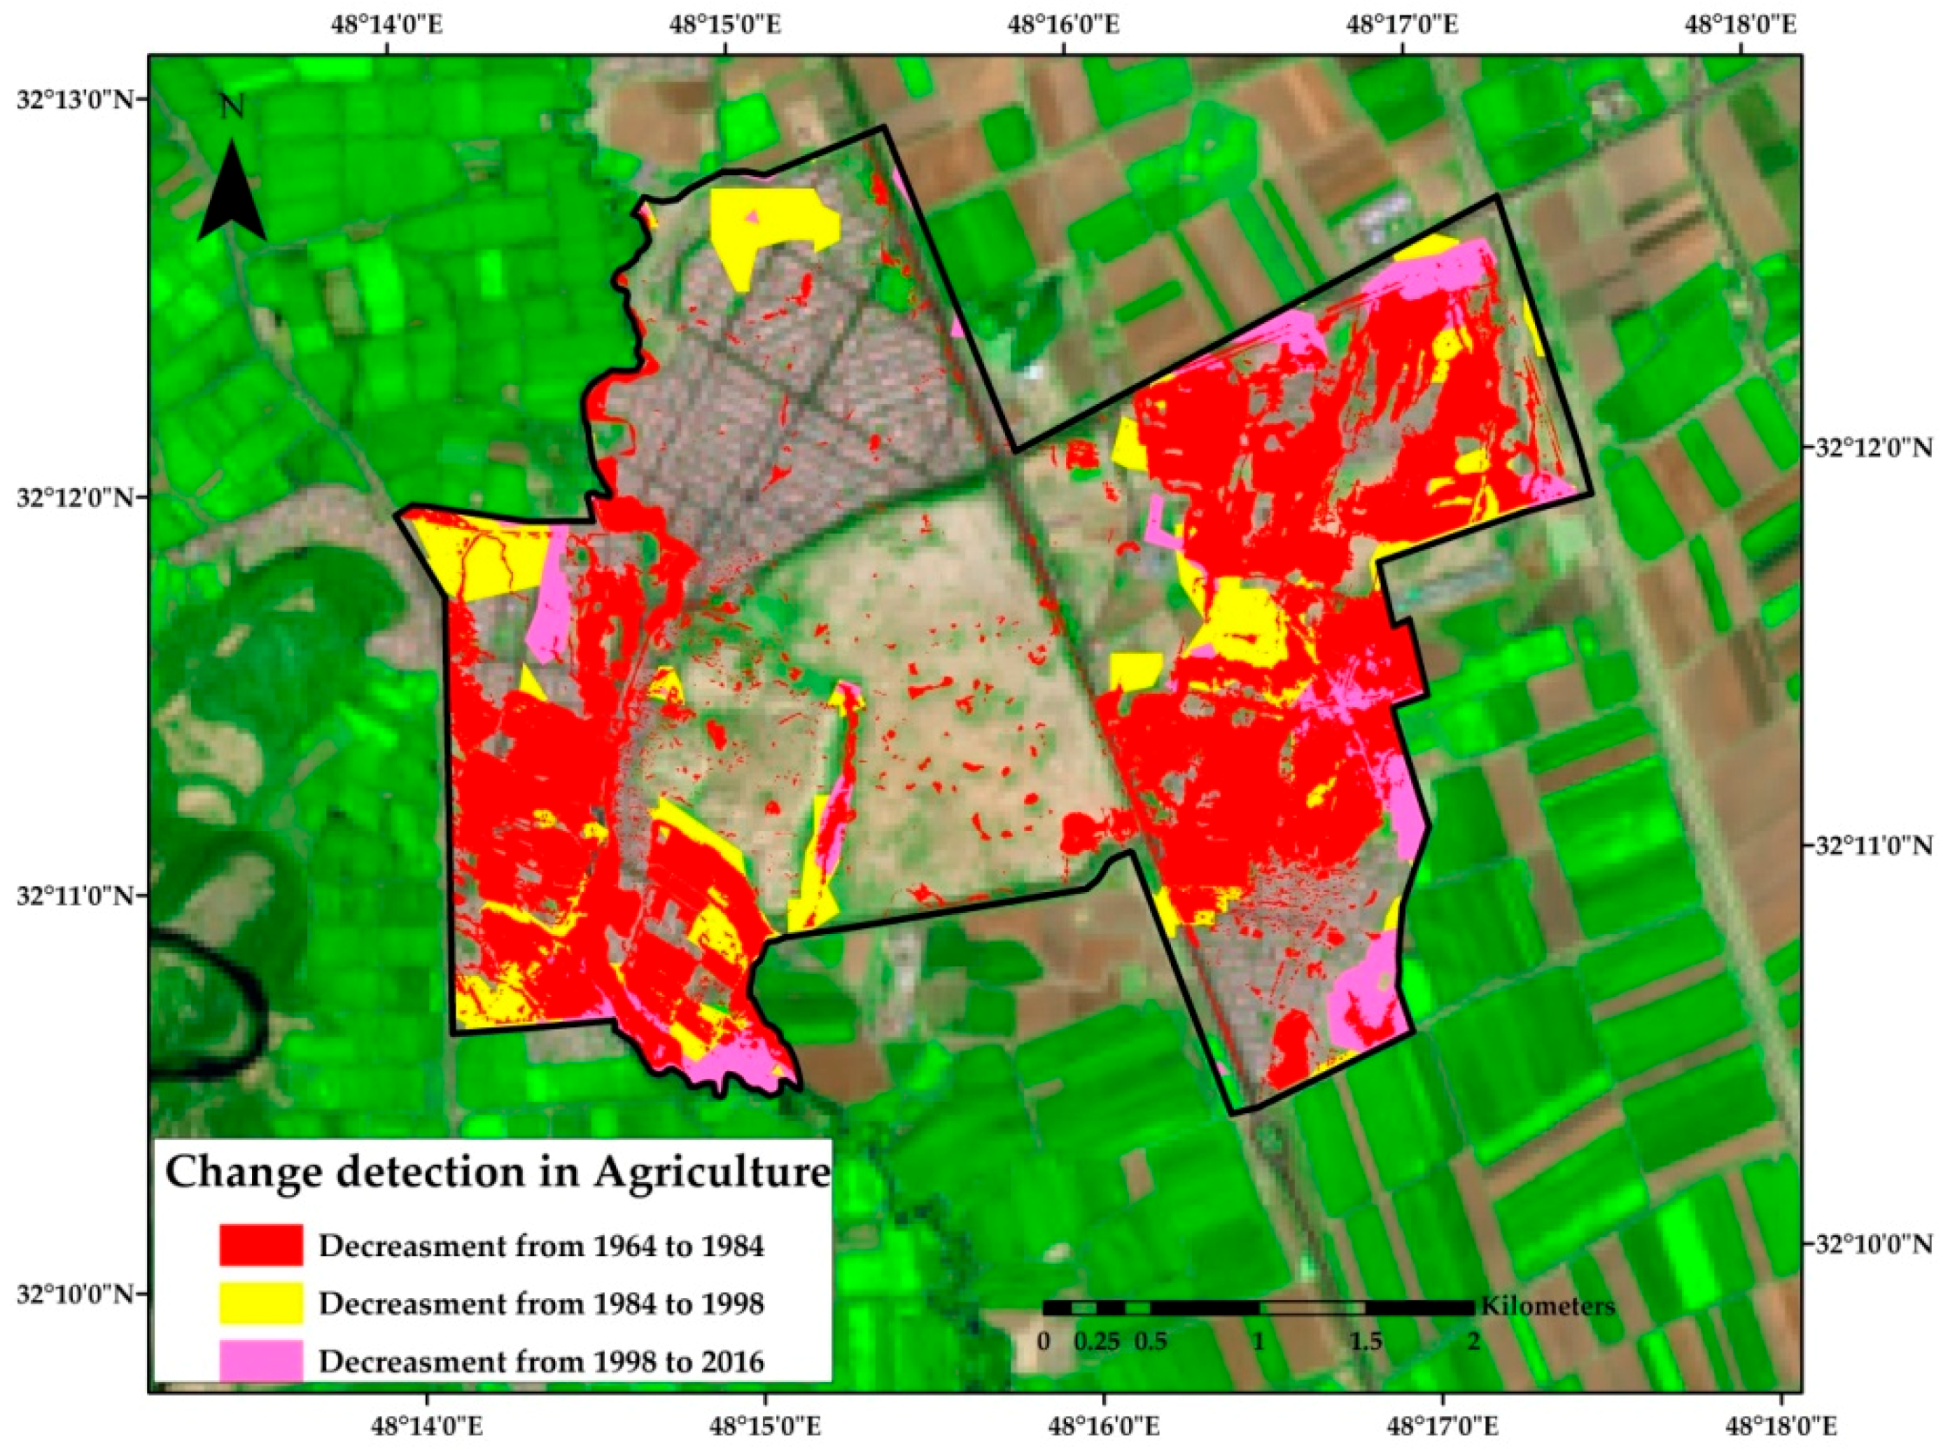
| Agriculture | (Kom el Shoqafa) | 20,445 | −6178 | 14,267 | −108 | 14,159 | 2128 | 16,287 |
| (Shush) | 4809 | −4528 | 281 | −141 | 140 | −23 | 117 |
© 2017 by the authors. Licensee MDPI, Basel, Switzerland. This article is an open access article distributed under the terms and conditions of the Creative Commons Attribution (CC BY) license (http://creativecommons.org/licenses/by/4.0/).
Share and Cite
Lasaponara, R.; Murgante, B.; Elfadaly, A.; Qelichi, M.M.; Shahraki, S.Z.; Wafa, O.; Attia, W. Spatial Open Data for Monitoring Risks and Preserving Archaeological Areas and Landscape: Case Studies at Kom el Shoqafa, Egypt and Shush, Iran. Sustainability 2017, 9, 572. https://doi.org/10.3390/su9040572
Lasaponara R, Murgante B, Elfadaly A, Qelichi MM, Shahraki SZ, Wafa O, Attia W. Spatial Open Data for Monitoring Risks and Preserving Archaeological Areas and Landscape: Case Studies at Kom el Shoqafa, Egypt and Shush, Iran. Sustainability. 2017; 9(4):572. https://doi.org/10.3390/su9040572
Chicago/Turabian StyleLasaponara, Rosa, Beniamino Murgante, Abdelaziz Elfadaly, Mohamad Molaei Qelichi, Saeed Zanganeh Shahraki, Osama Wafa, and Wael Attia. 2017. "Spatial Open Data for Monitoring Risks and Preserving Archaeological Areas and Landscape: Case Studies at Kom el Shoqafa, Egypt and Shush, Iran" Sustainability 9, no. 4: 572. https://doi.org/10.3390/su9040572