
The Impacts of Environmental Regulation on Industrial Activities: Evidence from a Quasi-Natural Experiment in Chinese Prefectures


1
School of Economics, Renmin University of China, Beijing 100872, China
2
Department of Economics, Hong Kong Baptist University, Kowloon Tong, Hong Kong 999077, China
*
Author to whom correspondence should be addressed.
Sustainability 2017, 9(4), 571; https://doi.org/10.3390/su9040571
Submission received: 23 February 2017
/
Revised: 2 April 2017
/
Accepted: 6 April 2017
/
Published: 9 April 2017
(This article belongs to the Section Economic and Business Aspects of Sustainability)
Abstract
:We assess the effectiveness of China’s Two Control Zones (TCZ) policy, an environmental policy that tightens the control of acid rain and the emission of sulfur dioxide (SO2) in targeted areas. To identify the effect of the policy on industrial activities, we use the difference-in-differences (DID) method to study industry-level activities in China’s prefectures based on a unique firm-level data set covering the period from 1999–2009. We find that stricter environmental regulation led to a lower level of polluting industrial activities in TCZ prefectures, which was associated with more closures of polluting firms in targeted prefectures and more new polluting firms in non-targeted locations. In addition, our findings suggest that the TCZ policy had more pronounced effects in the coastal areas and became more effective after China changed its assessment criteria for the performance of local officials in the late 2000s.
1. Introduction
During the last three decades, China has witnessed impressive economic growth, along with rapid industrialization and urbanization. However, due to its resource-intensive development strategy, China’s high-growth has been accompanied by severe environmental problems. Deteriorating air quality has led to pollution-related diseases, such as lung cancer, chronic obstructive pulmonary disease (COPD), ischemic heart disease (IHD), and stroke [1,2]. Many industrial accidents have disastrous impacts on the environment (e.g., the Songhua River incident in the Jilin Province, see [3]). Serious concerns have thus been raised over the long-term sustainability and hidden costs of growth [4].
China represents an important case of environmental degradation due to growing human activities. Urbanization is one of the most important anthropogenic causes of the loss of arable land, habitat destruction, and deforestation [5,6,7]. With a high density of population and industrial activities, cities have generated enormous amounts of wastes of various kinds [8]. As China and other developing countries have entered a stage of rapid urbanization and industrialization, there are growing risks of causing irreversible damage to the global environment by human activities [9,10]. According to the forecast of the Organization of Economic Cooperation and Development (OECD), greenhouse gas emissions from BRIC nations (i.e., Brazil, Russia, India, and China) will grow by 46 percent from 2005 to 2030, and in total will roughly equal the emissions from the thirty OECD countries combined by 2030 [11].
In the international context, environmental issues have been transformed from local into regional and global issues, similar to the growing regionalization and globalization of trade and investment [12]. In a globalized world, the consequences of pollution in a country may go beyond the national boundary. While high-income countries can reduce pollution by moving industrial plants to low-income countries, pollution in the latter can be brought back to the former by atmospheric transportation. According to a recent estimate, for instance, PM2.5 pollution in China in 2007 is associated with 64,800 premature deaths outside China, while 108,600 premature deaths in China are attributable to consumption in Western Europe and the USA [2].
China has joined the international community in combating global climate change. The government pledged to reduce carbon dioxide emissions intensity to 40–45% of the 2005 levels by 2020 in the 2009 Copenhagen Summit, and further committed to reduce it to 60–65% of the 2005 levels by 2030 in the 2015 Paris Summit. Whether China can achieve these targets has direct bearing on future climate change. Against this backdrop, it is important to have a better understanding of China’s progress and the challenges in achieving its environmental goals.
Starting from the late 1990s, the Chinese government formulated a series of environmental regulatory laws and policies. By 2014, the National People’s Congress (NPC) had approved 10 environmental and 30 resource protection laws. Local people’s congresses and governments have developed more than 700 local environmental rules and regulations [13].
Surprisingly, there is little consensus on the effectiveness of the policies and the causal relationship between environmental regulations and their outcomes. Some studies argue that China’s energy efficiency has improved drastically and that pollution has reduced as a result of the environmental regulation and technological improvements [4,14]. Others hold the opposite view. Some have argued that China has been forced to play the “race to the bottom” game with other developing countries in the fear of capital outflow. The reasoning is in line with the “pollution heaven hypothesis” which postulates that polluting industries are welcome by low-income countries with low environmental standards, even though they cannot survive in developed countries where environment regulations are strict [15]. In this view, globalization undermines the Chinese governments’ ability to protect the environment through the regulation of corporate behavior [16]. In addition, some studies have questioned the accuracy of official pollution statistics, as any policy that motivates local governments to reduce pollution may also motivate them to report better outcomes on paper [17]. This is especially true under China’s regionally decentralized authoritarian (RDA) regime, where an independent judiciary, transparent information, and official accountability are all absent [18]. Local officials are appointed by upper-level officials who heavily emphasize tangible economic outcomes such as GDP growth and revenue collection [19,20,21]. Thus, pollution data collected by official organizations will more likely suffer from measurement and misreporting problems. Some have gone so far as to argue that many environmental policies exist only on paper [22].
To contribute to this debate, we assess the effectiveness of China’s Two Control Zones (TCZ) policy that tightens the control of acid rain and the emission of sulfur dioxide (SO2) in targeted areas. The TCZ policy provides a quasi-natural experiment to compare changes in industrial activities between polluting and non-polluting industries and between prefectures within and outside the TCZ. We aggregate firm-level information collected by China’s National Statistics Bureau to two-digit industrial data at the prefecture level for the period from 1999–2009. The difference-in-differences (DID) method is used to study the effectiveness of the TCZ policy in reallocating activities away from polluting sectors over space and time.
We find that stricter environmental regulation led to a lower level of polluting activities in TCZ prefectures. Moreover, rather than a contraction of production in existing firms, the relative reduction of polluting industrial activities in TCZ prefectures was associated with a bigger number of firm closures in the targeted TCZ prefectures and the setting up of a bigger number of polluting firms in the non-targeted locations. Furthermore, the impact of the TCZ policy was more pronounced in the coastal areas as compared with inland areas. Our findings also suggest that the TCZ policy became more effective after China changed its assessment criteria for the performance of local officials in the late 2000s.
Our paper extends the previous literature in three dimensions. First, unlike existing papers that focus on pollution outcomes or air quality measured at monitoring stations [23,24], we use measures that are less susceptible to misreporting, including industry-level activities in China’s prefectures (industrial sales value, the number of firms in air-polluting industries, and the number of new firms in air-polluting industries). Moreover, the industrial database used in this paper covers almost all industrial firms in China, except for very tiny ones.
Second, a problem faced by existing studies is their use of aggregate data at the national, provincial, or city levels, which do not allow investigators to distinguish among changes caused by the opening of new plants, expansion or contraction of the production of existing plants, and the closures of plants [25,26,27]. As firm-level information is used in this paper, we can aggregate the information in a way that allows us to understand the importance of various channels.
Third, the environmental problems of industrialization and urbanization in developing countries have received very little attention [28]. Our study offers an attempt to analyze the effect of environmental regulations on industrial activities in developing countries. Given the pressing task of improving environmental protection, policymakers urgently need a better understanding of the complex linkages between environmental regulation and industrial activities.
Our paper is relevant to the broader issues of environmental degradation. Developing countries often put overwhelming efforts on achieving economic growth without sufficient attention to its impacts on the environment. If sustainable development is to be achieved, a proper approach should be the one that takes into account the environmental costs of economic growth [29]. Ultimately, development should aim at improving people’s well-being, which should include not only the amount of economic goods that one consumes, but also environmental quality. Recent empirical studies suggest that concerns over ozone pollution negatively affect the well-being of an individual [30]. China’s TCZ policy represents an attempt to tilt the balance from economic growth to environmental quality, although our results indicate that more efforts are needed.
Our assessment of China’s TCZ policy suggests that China needs not only environmental laws and regulation, but also institutional innovations. Environmental degradation is the result of market failure. A decentralized market system is expected to result in under-investment in pollution abatement and thus a suboptimal growth path [31]. Better outcomes may be achieved by regulatory policies (e.g., taxes for polluting industries and subsidies for clean energy), the development of property rights (e.g., the right to fish), and the design of institutions (e.g., climate exchanges) which can be conceptualized as involving sustainable entrepreneurship [32]. In the specific context of China, the RDA system has not been successful in incentivizing local officials to follow a sustainable development path, not to mention nurturing sustainable entrepreneurship.
The rest of the paper is organized as follows. Section 2 introduces China’s TCZ policy, against the background of rising air pollution. Section 3 describes our data set while Section 4 explains the DID method and reports the empirical results. Robustness checks of the regression results are conducted in Section 5, and Section 6 concludes the paper.
2. Air Pollution and Regulations in China
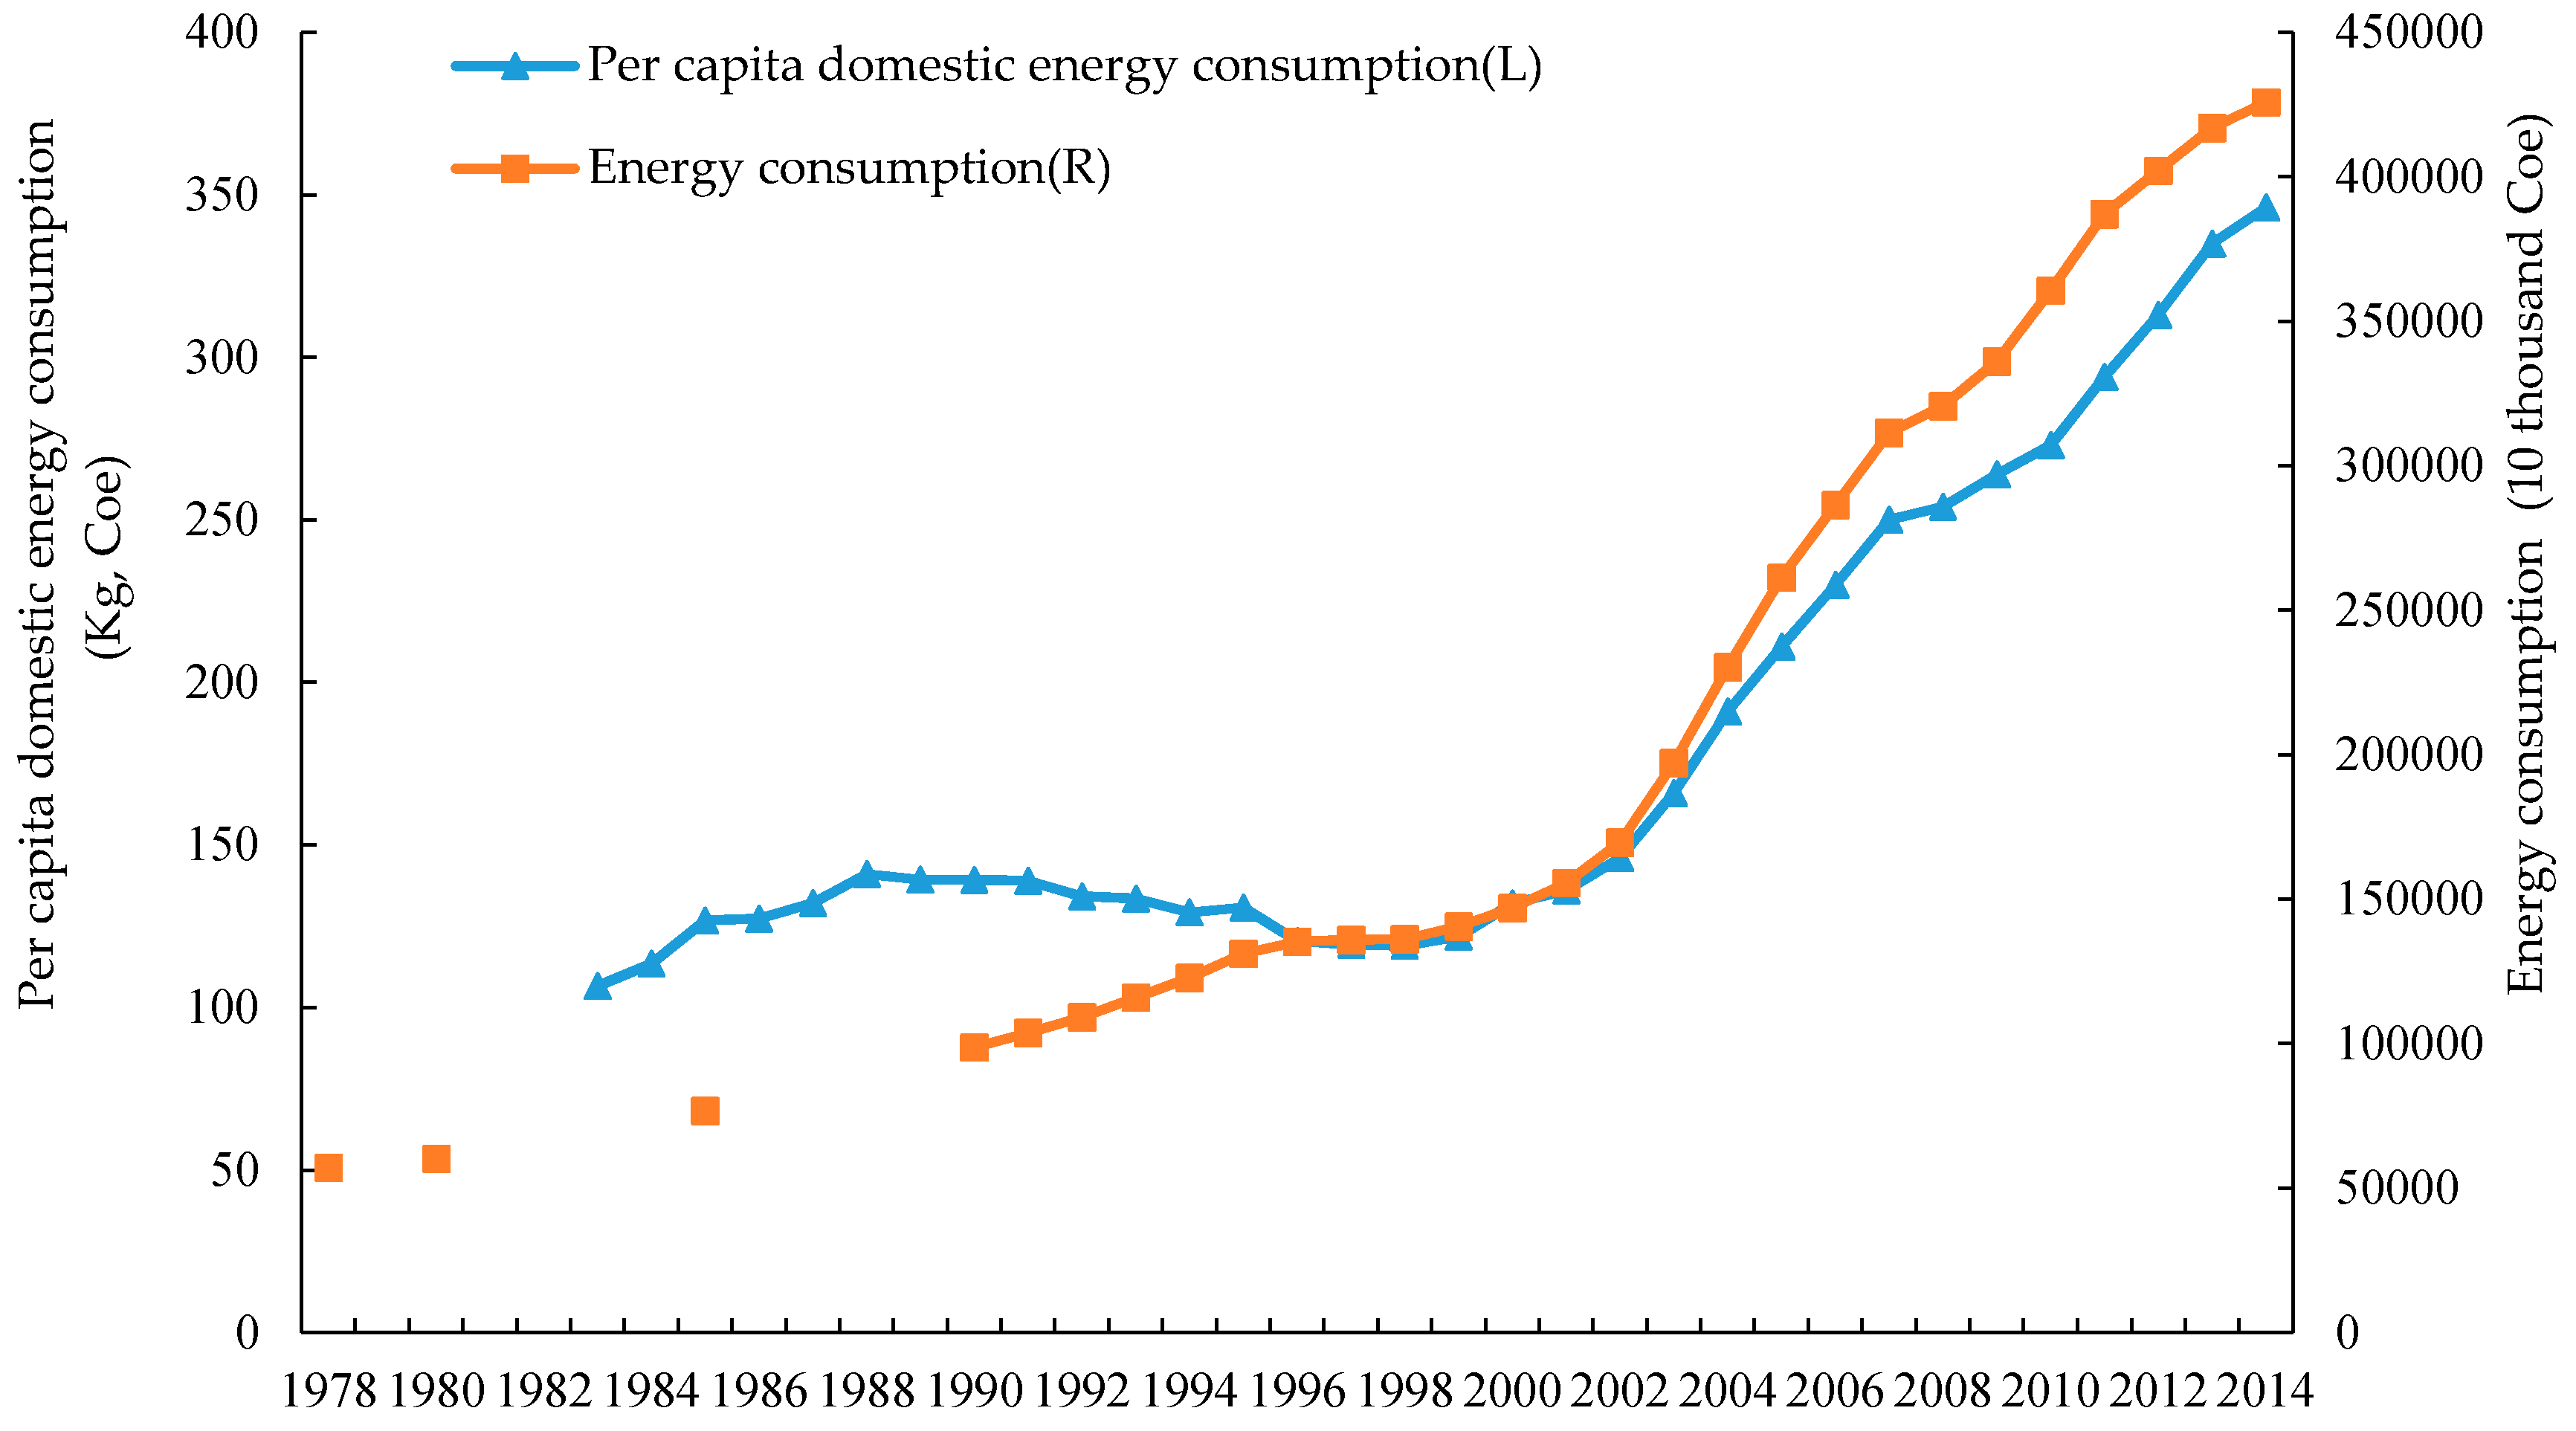
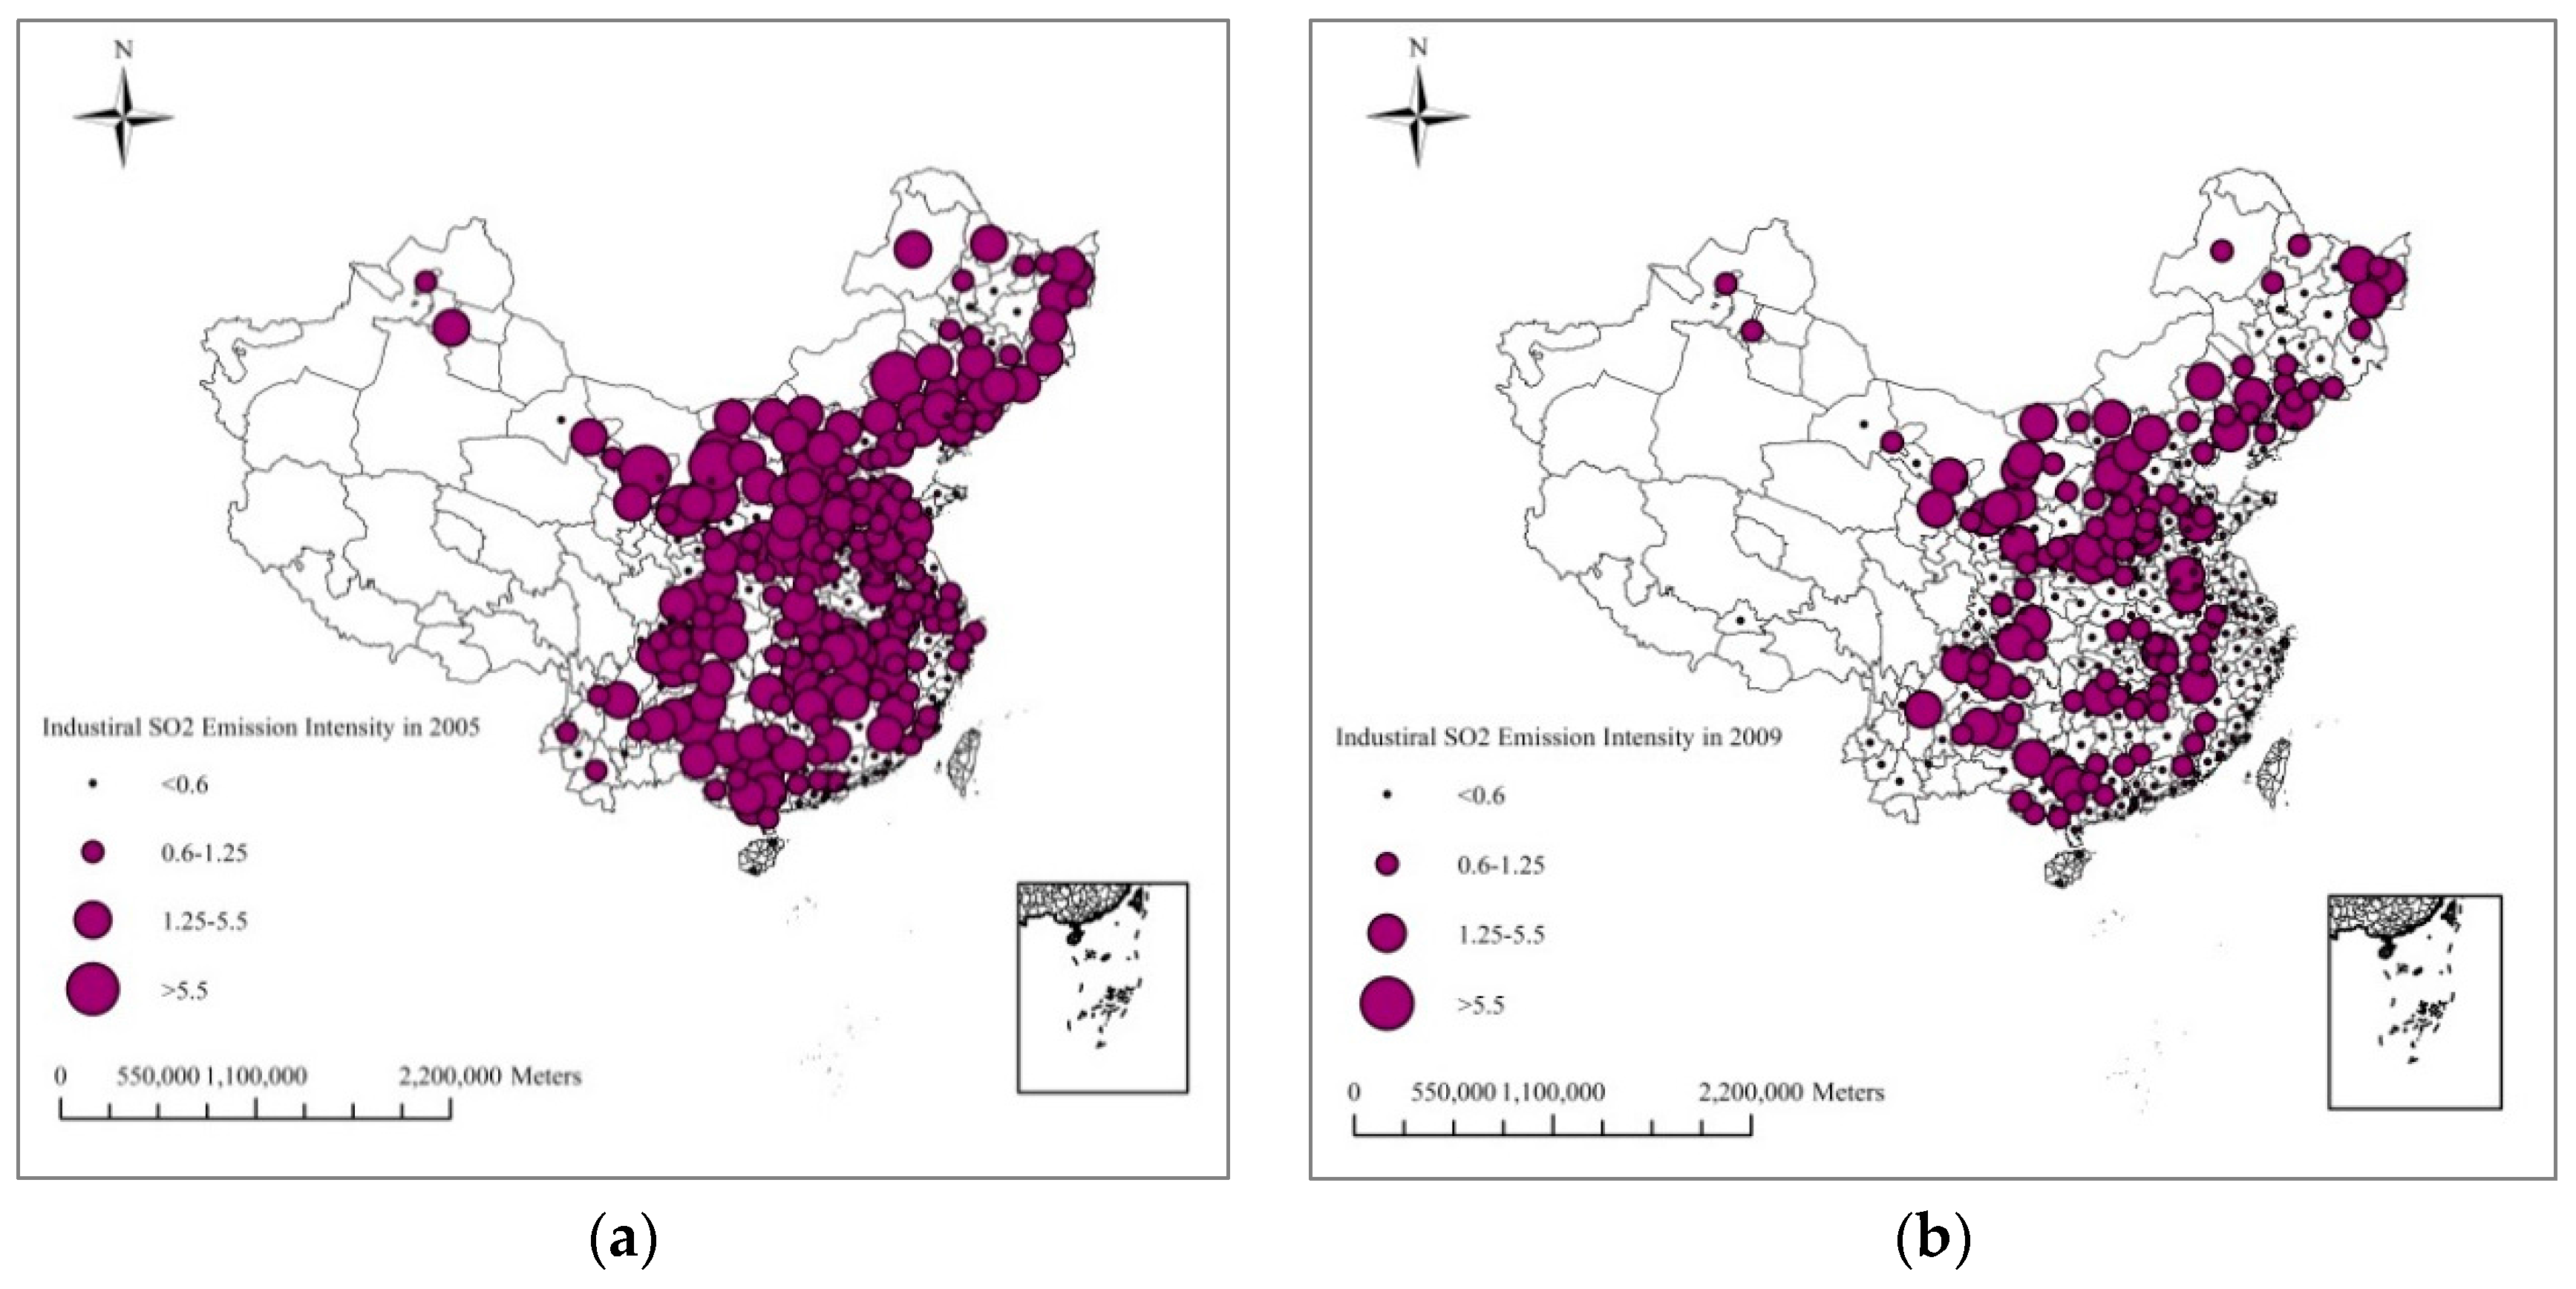
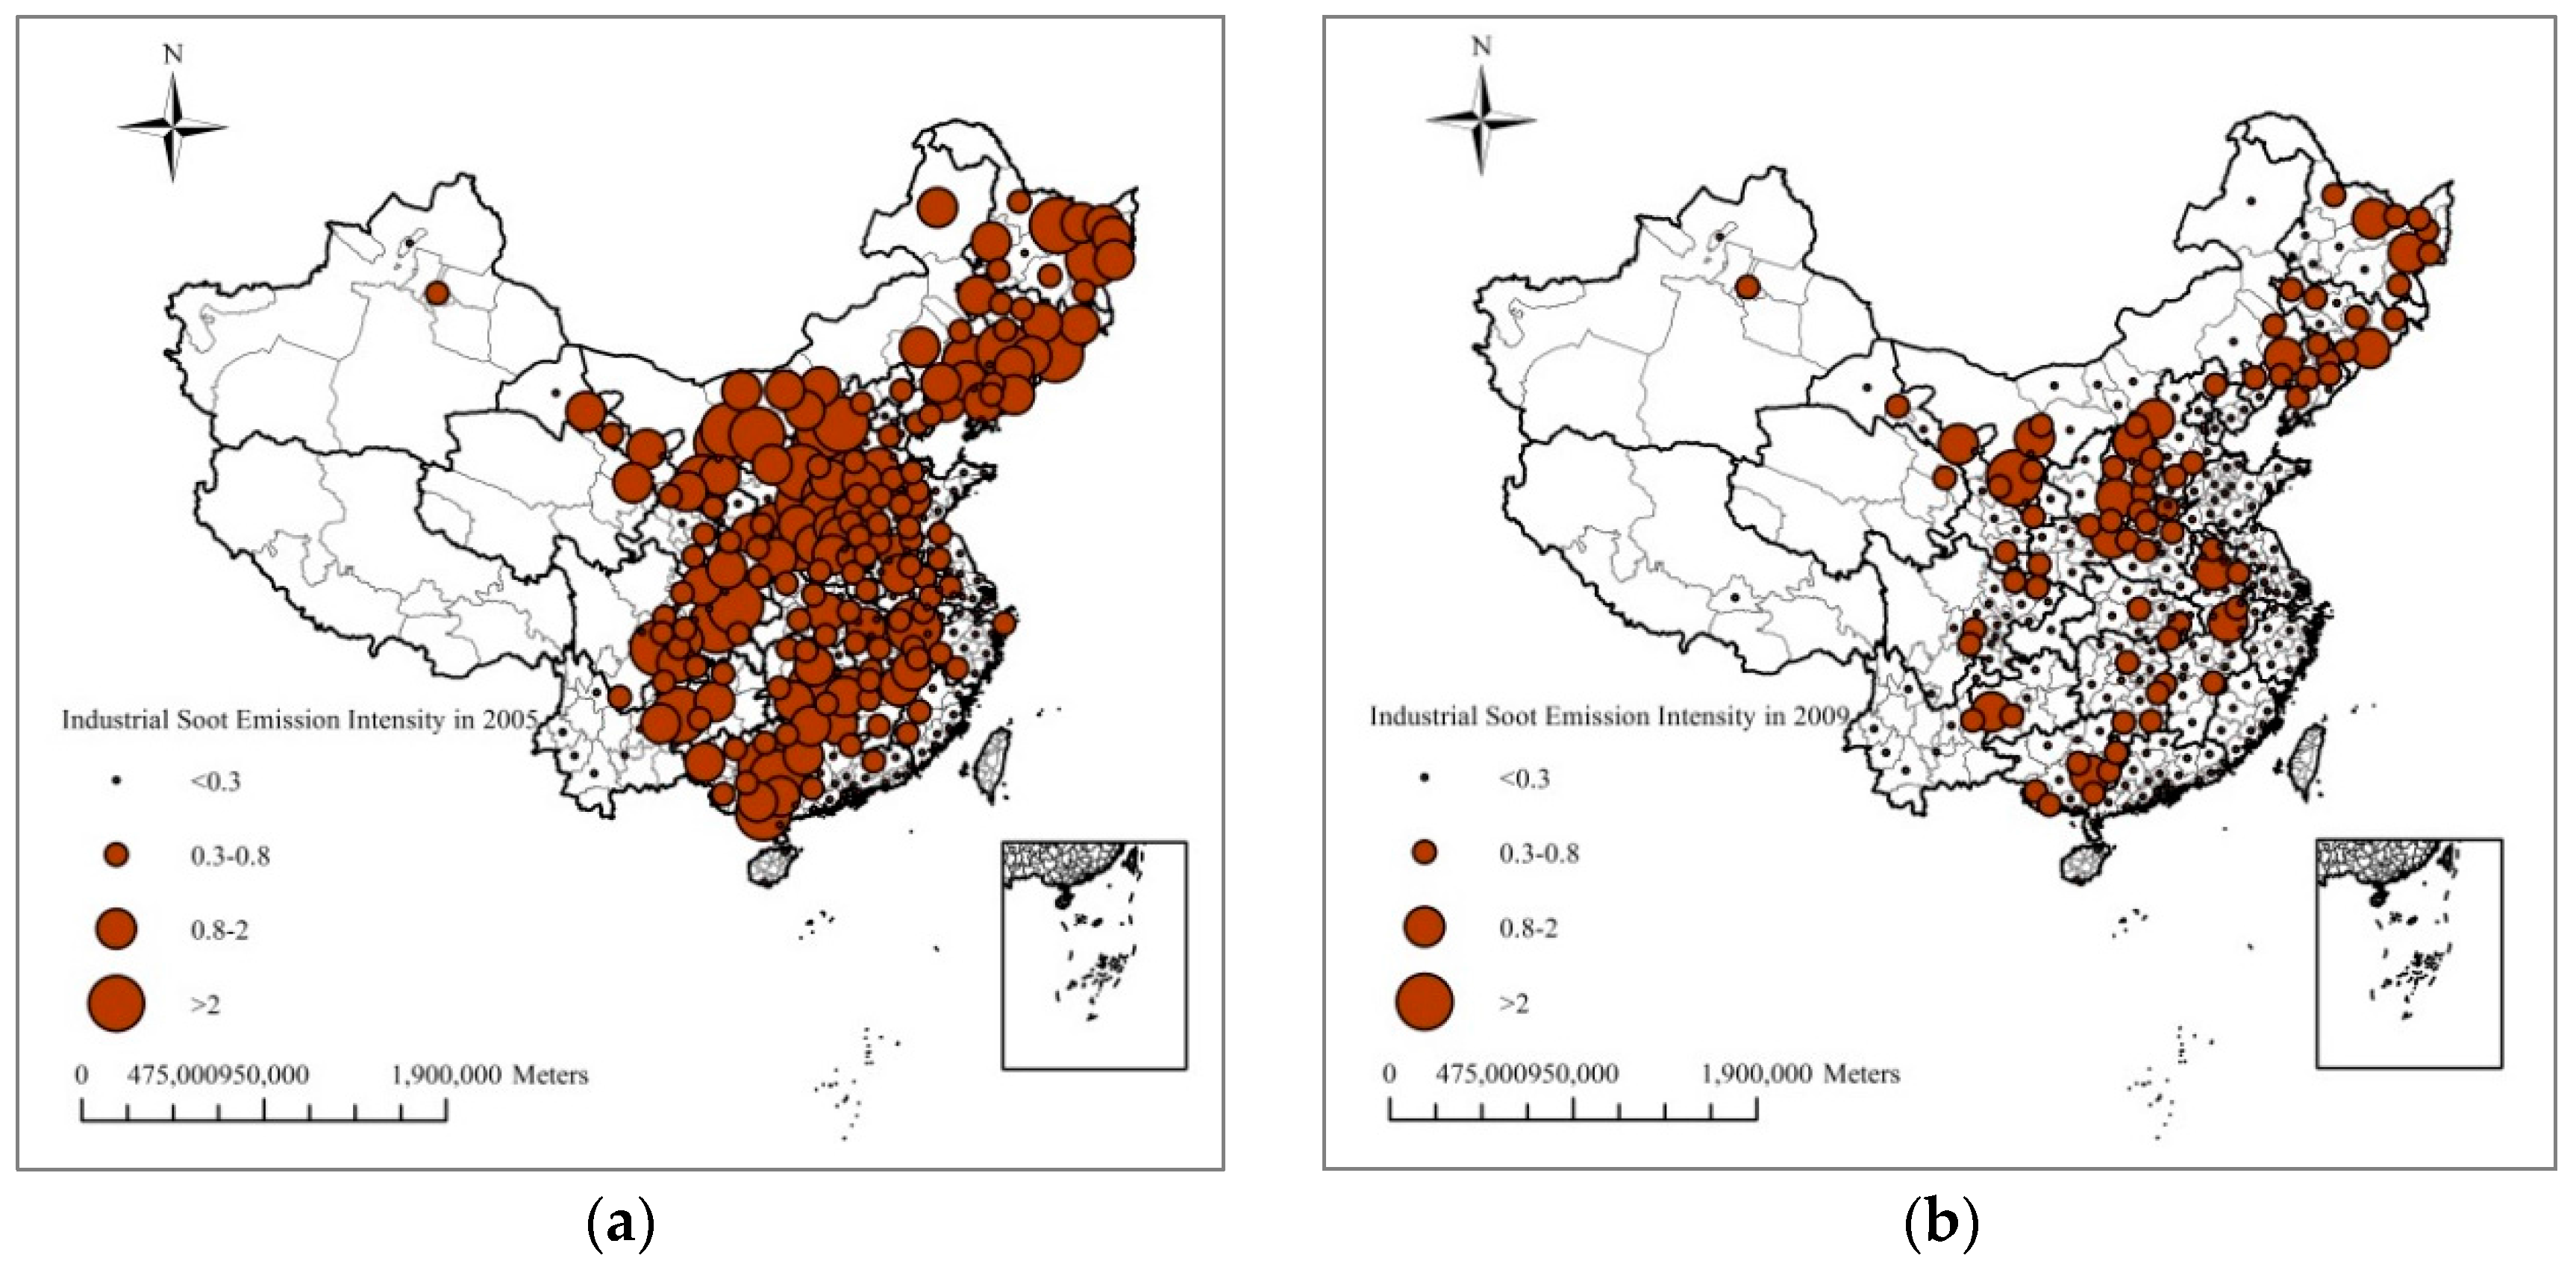
Following China’s rapid industrialization and urbanization, energy consumption increased nearly 130 percent between 2000 and 2012 (see Figure 1). Although China’s energy efficiency and resource utilization have improved drastically due to the application of cleaner and more energy-efficient technologies, coal consumption continues to account for 70% of China’s energy production. Consequently, China has become the largest source of SO2 emissions in the world [4]. Figure 2 shows that the emission of industrial waste gases increased along with GDP growth. Nevertheless, industrial SO2 emission intensity and industrial soot emission intensity decreased substantially, as a result of expansion of the GDP. As can be seen in Figure 3 and Figure 4, the industrial SO2 emission intensity and the industrial soot emission intensity dropped in many prefectures. It is notable that the improvement was regionally unbalanced: While the emission intensities in the east and south coastal regions reduced drastically, those in Shanxi, Henan, Hunan, Guizhou, Guangxi, Gansu, and Liaoning stayed at high levels.
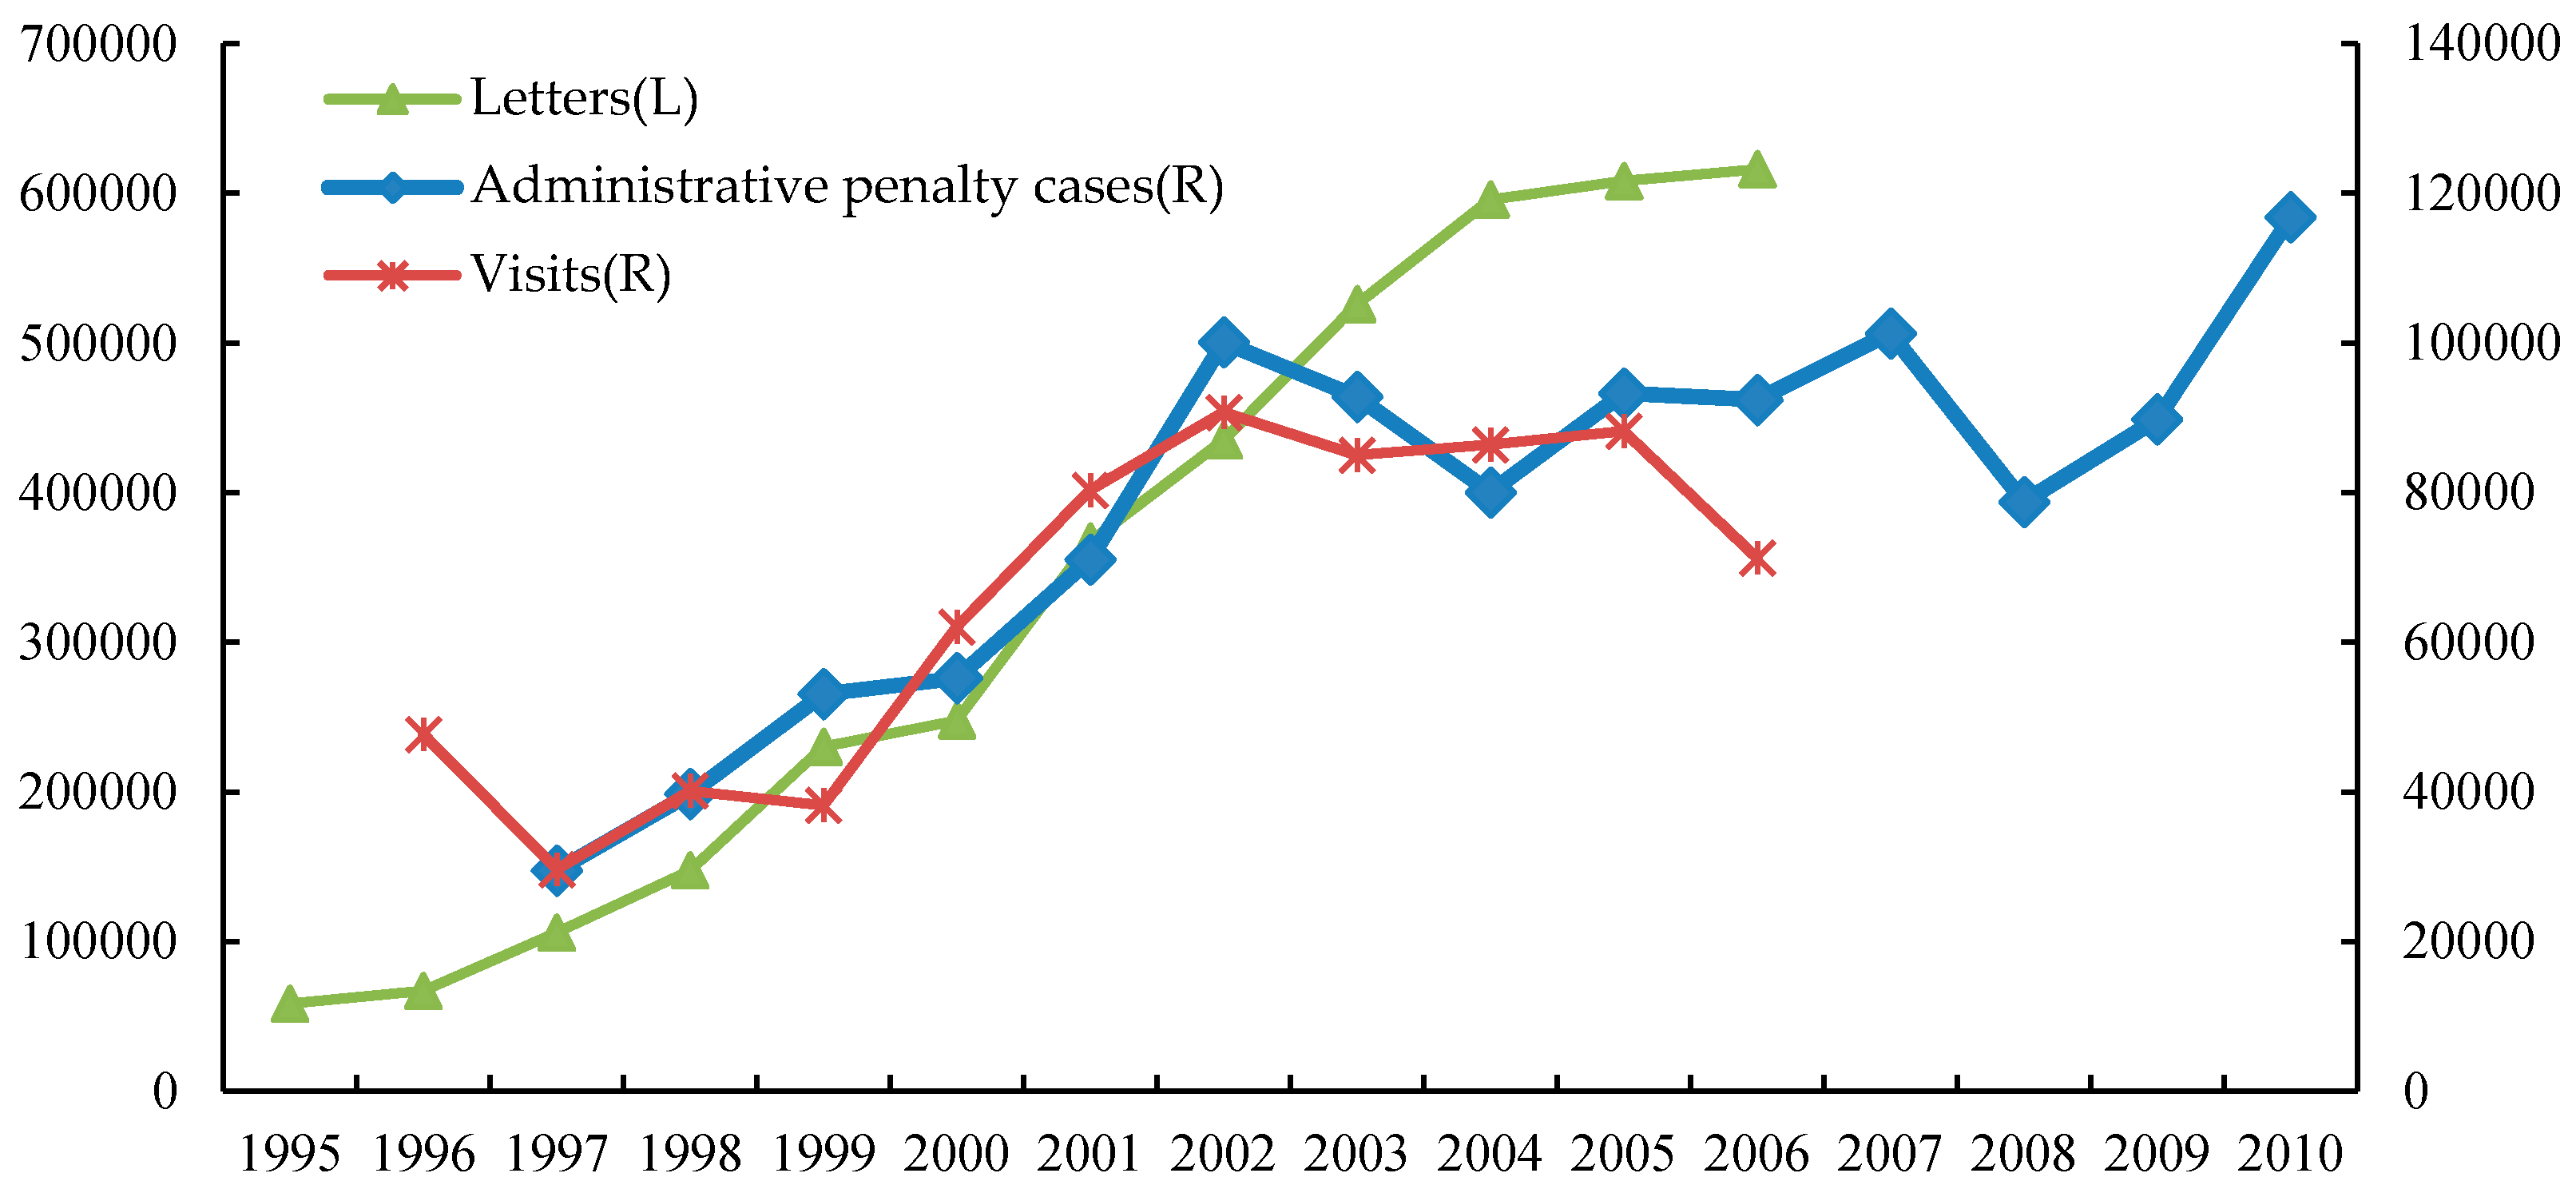
Diseases caused by outdoor air pollution grew by 33% during 1990–2010, and 20% of lung cancers in 2010 could be attributed to PM2.5 pollution [33]. The costs of health losses due to ambient air pollution using willingness-to-pay measures was estimated to be 3.8 percent of the Gross Domestic Product (GDP) [4]. As shown in Figure 5, petitions and complaints on environmental issues increased by an average of 29% annually during 1996–2010 [13].
The Chinese government has been formulating a series of environmental regulatory laws and policies. Among those related to the regulation of air pollution, the most notable one was the Two Control Zones (TCZ) policy implemented in 1998 [37]. The two control zones refer to the sulfur dioxide control zone and acid rain control zone (see Figure 6). Prefectures are included into the zones if the recorded emissions exceeded the national standards in the preceding years. The acid rain control area and the sulfur dioxide pollution control area are mainly located in the southern and northern areas of the Yangtze River, respectively, totaling 175 prefectures across 27 provinces. The acid rain control area is about 800,000 km2, whereas the sulfur dioxide pollution control area is about 290,000 square kilometers, accounting for 8.4% and 3% of China’s total land area, respectively. Notably, the TCZ covers China’s fast-growing, densely populated, and industrialized areas, including the four centrally-administered municipalities, 21 provincial capital cities, 11 out of 16 coastal open cities, and four special economic zones.
The Chinese government has set several ambitious targets: (1) limiting sulfur dioxide emissions in the TCZ to the level of the year 2000; (2) achieving the national environmental quality standards for ambient air concentrations of sulfur dioxide in all the urban areas of the TCZs; (3) significantly reducing the rainfall with pH ≤ 4.5 in the Acid Rain Control Zone area.
Specific pollution control targets for TCZs were written in the Tenth Five-Year Plan (2001–2005), becoming national strategic goals for the first time [38]. More stringent regulations have been enforced in the TCZs, for example,
- prohibition of extraction in coal seams with a sulfur content over 3%;
- gradually reducing the extraction in existing coal mines with a sulfur content over 3%;
- mandatory installation of coal washing facilities at the appropriate scale to newly built or reconstructed mines with a sulfur content over 1.5%;
- prohibition of new coal-fired power plants in large and medium-sized cities;
- mandatory installation of desulphurization facilities in newly built or reconstructed coal-fired power plants with a sulfur content higher than 1%;
- reducing the emissions of polluting enterprises in the chemical, metallurgy, building materials, and non-ferrous metals industries by various methods, etc.
3. Data Source and Descriptive Statistics
3.1. Data Source
To conduct the empirical analysis, we used firm-level data from the Annual Surveys of Industrial Production (ASIP) collected by the National Bureau of Statistics of China. We aggregated the firm-level data into observations for two-digit industries in each prefecture for each year, covering the period from 1999–2009. By doing so, we obtained information of production activities, nature of the industry (air-polluting or not), whether the prefecture is located in a TCZ, and other prefecture characteristics, with more than 90,000 observations in total.
We used the sales value of industrial products, number of firms, and number of new firms in an industry in a prefecture as a proxy for its production activities. Sales value was used as a proxy for a firm’s production activities because there is not a complete set of data for other production indicators such as industrial value-added and gross industrial output value in the ASIP sample. To check whether these are reasonable proxies, we computed the Pearson Correlation Coefficients between the prefecture-level sales value constructed from the ASIP sample and the major prefecture production indicators published in the China Regional Yearbook. As reported in Panel A of Table 1, the Pearson Correlation Coefficients between them were higher than 90%, indicating that they are highly correlated. Likewise, we collected data for the sales value of industry, gross industrial output value, and the number of firms at the 2-digit industrial level from the China Industrial Economy Statistical Yearbook. Then we calculated the Pearson Correlation Coefficients between them and industrial-level indicators were constructed from the ASIP sample. As shown in Panels B and C, the coefficients are very high, suggesting that our proxies for industrial activities are all reasonable.
We identified ten major air-polluting industries according to the “Report on the First National Census of Polluting Sources” [39]. We have excluded mining industries, because the location of mining firms largely depends on the distribution of natural resources, rather than firm choices. Table 2 is the industries identified as air-polluting in our empirical analysis.
Locations included in the TCZs are listed in the document “Official Reply to the State Council Concerning Acid Rain Control Area and Sulfur Dioxide Pollution Control Area”, published by the State Council in 1998.
3.2. Data Description
Table 3 provides the summary statistics for the variables used in our analysis. There are on average 30.18 firms and 3.04 new firms in an industry in each prefecture. A prefecture in our sample, on average, has a population of 4.52 million, an annual GDP of 72.39 billion yuan, and a land area of about 15,462.88 km2. The average agricultural share of the GDP is about 17.07%. Notably, the prefectures in our sample exhibit great variations in almost every dimension.
An explanation of the strategy of identifying the number of new firms in the data set is in order, as it will be one of the three dependent variables for the regression analysis. An oft-used strategy is that if firm i is found in the dataset in year t but not in year t − 1, the firm is regarded as a new firm in year t [40]. This may lead to the misidentification of new firms because there are many reasons for a firm not being found in the dataset in a year. It may be due to having a sales value smaller than 5 million RMB (a criteria for inclusion in the dataset), bankruptcy, change of firm name, or just missing data. To overcome this problem, we have chosen to use a firm’s setup year to identify whether it is a new firm or not. A firm is considered to be new in time t only if the setup year is t.
4. Methodology and Empirical Results
4.1. Basic Specification
We identify the effect of stricter environmental regulation from the differential effect of the TCZ policy across sectors. We estimated the following equation by using our aggregate data for 287 prefectures over 1999–2009.
where i, j, t, p are the index industry, prefecture, year, and province, respectively. is the dependent variable, which is a measure of activity (the sales value, the number of firms, and the number of new firms) of an industry i in j prefectures in year t. is a dummy for the prefecture having been targeted by the policy: it equals 1 if prefecture j has been targeted by the policy and 0 otherwise. is an industry dummy: it equals 1 if industry i is an air polluting industry, and 0 otherwise. The focus of our DID analysis is on the double interaction term , which measures the combined TCZ-specific and industry-specific effects on . Thus, is the parameter of primary interest to us, which is referred to as the “regulation effect”. It captures the average effect of being in the TCZ prefectures on air-polluting activities, net of other confounding factors.
is a set of control variables that represent the prefecture j’s socioeconomic and demographical characteristics in year t, including GDP, population, land area, and agricultural share of GDP, which are available in the China Regional Yearbook. To further mitigate selection bias based on unobservables, we include and , the full set of the two-digit industry and provincial group effects, both allowed to vary with time, where is the effect of being in province P and year t, with P being an index of the province group. Lastly, is the error term. We allow for correlation across the two-digit industries within a prefecture and cross section by clustering the standard errors.
4.2. The Effects of the TCZ Policy on Industrial Activities
The DID results are reported in Table 4. Column (1) shows that, as compared with the non-TCZ prefectures, TCZ prefectures have a higher share of industrial activities. This is reasonable because the TCZ prefectures are mostly economically advanced areas. The coefficient of the pollution dummy is negative and significant, indicating a smaller share of polluting industries than non-polluting industries in the economy, which likely reflects China’s ongoing transition to a green economy. Interestingly, the coefficient for the interaction term between TCZ and pollution is also negative and significant. This finding provides a preliminary suggestion that stricter environmental regulation indeed induced a reduction of polluting industrial activities in TCZ prefectures.
However, relatively lower industrial activities in TCZ prefectures may result from different factors. It may either come from a relative fall in the importance of sales value of industrial products, or due to a change in the number of firms in different locations [27]. Thus, in Columns (2) and (3) in Table 4, we respectively re-run the regression with the number of firms and the number of new firms as the dependent variable. In both cases, the coefficient for the interaction term is negative and significant. The estimations indicate that when compared with non-TCZ prefectures, the number of air-polluting firms and the number of new air-polluting firms in TCZ prefectures respectively were 10.6% and 14.2% less than their counterparts in non-air-polluting industries. This suggests that the relatively less polluting industrial activities in TCZs were accompanied by less polluting firms in TCZs, along with less new firms in polluting industries. Seen from the perspective of the non-TCZ prefectures, they had a higher level of polluting industrial activities as compared to TCZ prefectures mainly because they had a larger number of polluting firms and more importantly, a larger number of new firms in polluting industries. While it is difficult to discern whether the new firms in polluting industries were those relocated from TCZ prefectures (aka the “pollution heaven hypothesis”), the evidence suggests that the non-TCZ prefectures did provide more room for the polluting industries to grow.
4.3. Are There Differences in the Regulation Effects Across Regions in China?
This subsection explores whether the regulation effects vary by region. This is informative for at least two reasons. First, it serves as an internal validity check on the results above. Second, it provides an opportunity to measure the effects of these regulations across regions [41]. We classify China’s 30 provincial units into seven regions based on geographic location, as shown in Table 5.
The region-specific regression results are reported in Table 6, Table 7 and Table 8. As can be seen in Table 6, in more economically developed coastal areas, such as the east coastal and south coastal regions, the coefficient of the interaction term is negative and statistically significant. However, in the less developed central and northwestern regions, the coefficient of the interaction term is statistically insignificant. Thus, there were regional differences in the implementation of the TCZ policy: it was implemented effectively in the coastal areas, but had a far from satisfactory implementation in the central and northwestern regions.
The phenomenon may result from the following two reasons. Firstly, as mentioned above, China’s institution is characterized by the “regionally decentralized authoritarianism” (RDA), under which economic powers are devolved to the local government while the cadres are under the hierarchical management of the central government. Economic growth is still the most important performance indicator in the evaluation mechanism for local officials [18]. This merit-based promotion system is considered to have induced a competition between subnational governments [42], leading to regional protection and “race to the bottom” problems. Local governments lower their environmental standards to compete for investment and economic growth, allowing businesses to minimize costs by polluting with impunity [43,44]. Therefore, in the less developed regions, local governments have an incentive to weaken the enforcement of environmental regulations, to reduce the strength of local enterprises’ compliance costs. Secondly, compared with non-TCZ prefectures, most of the TCZ prefectures in the central and northwest provinces are economic centers that are densely populated and highly industrialized. Most central and northwestern provinces rely heavily on the agglomeration of economic activities in TCZ prefectures for their economic development. Thus, even though they are classified as TCZs, the local government officials have less incentive to get rid of the high polluting and energy-intensive development model.
The regression results for the number of firms and the number of new firms in Table 7 and Table 8 show very similar patterns. The coefficients of interaction terms in the east coastal and south coastal regions are significantly negative, while the coefficients of interaction terms in the central, southwestern, and northwestern are positive but insignificant.
4.4. Did the Impact of Environmental Regulation Vary Over Time?
This subsection explores the changing impact of the TCZ policy over time. Originating from the central planning era, the Five-Year Plans are still the most important policy instruments and the highlights of major policy changes in China [45]. In 2005, the State Council issued an important document: “Decision of the State Council on Implementing Scientific Outlook on Development and Strengthening Environmental Protection”, and stipulated that environmental protection should be a major component in the performance review for local officials. Thus, improvements in environmental protection would be considered as an important criterion for their promotion and appointment as well as their rewards and punishments. This is an important signal of transforming the GDP-based assessment system to one that takes into account both GDP and environmental protection. Since 2006, cadre evaluation schemes for local leaders have become more welfare-oriented and environmental protection has been newly upgraded to a “must-meet” target [46]. In 2007, the MEP and the National Statistics Bureau began to compile the “Green GDP”, a measure of sustainable development that includes items such as local pollution costs and other environmental indicators [47].
We expect that the central government’s act of incorporating environmental assessment into the local official’s performance evaluation system will pressure local officials to pay more attention to environmental protection in the course of economic development. This change may result in a different allocation of industrial activities. Thus, the 11th Five-Year Plan can be thought of as having a different regime from that of the 10th Five-Year Plan. We proceed to split the sample into two sub-periods, 2001–2005 and 2006–2009, which falls into the “10th Five-Year Plan” period, and the “11th Five-Year Plan” period, respectively.
As can be seen in Table 9, we obtain a significantly negative estimate of the two interaction terms. Specifically, we find that the coefficient of the interaction term Pollution *TCZ in column (1) and column (4) are of similar magnitude, and are both significantly negative, which is consistent with the results for the whole period reported above. Interestingly, the interaction term’s coefficient for the number of firms in the “11th Five-Year Plan” period is far bigger than the corresponding coefficient in the “10th Five-Year Plan” period. Results for the number of new firms in column (3) and column (6) are similar. This finding suggests that the regulation in the “11th Five-Year Plan” period was more effective than in the “10th Five-Year Plan” period. This may reflect the fact that the new promotion assessment system had pressured local governments to balance economic development and environmental protection, demonstrating the effectiveness of the central government’s policy in reducing air pollution.
5. Robustness Checks
5.1. PSM-DID
One of the most important underlying assumptions of the DID model is sample homogeneity, meaning that the treatment group and control group should have the same characteristics. In such a case, the only difference between them is that the former gets an experimental treatment. However, TCZ prefectures and non-TCZ prefectures are very different in terms of the level of economic development, population, and other social characteristics. Thus, bias may arise because the apparent difference in outcomes between the TCZ prefectures and non-TCZ prefectures may depend on characteristics that affected whether or not a prefecture is designated as part of the TCZ rather than being due to the treatment. To relieve this concern, we used the difference-in-differences propensity score matching (PSM-DID) estimator to check the robustness of our results. The PSM method attempts to mimic randomization by creating a sample of units that were subject to the TCZ regulation and are comparable on all observed covariates to a sample of units that were not subject to the TCZ regulation.
We select the discharged volume of industrial SO2 emission, discharged volume of industrial soot emission, log of GDP in the previous year, GDP, population density, area, the rate of agriculture in GDP in the prefectures, the reduction in the volume of industrial SO2 emission, and the reduction in the volume of industrial soot emission as covariates that are related to the TCZ prefectures assignment and industrial outcomes. The logistic regression with the nearest-neighbor matching within the caliper used for estimation of the propensity score is applied and a balanced matched sample is constructed. The DID estimation results based on the balanced matched sample are reported in Table 10. Again, two of the three DID estimators (column 2 and column 3) yielded negative and statistically significant estimates for the concerned interaction term, although the DID estimate for the share of industrial activities in the economy (column 1) is negative but not significant. Thus, there is little evidence that undermines our basic conclusions.
5.2. Placebo Test
For an ideal experiment, the treatment group and the control group should be selected randomly so that uncontrolled factors that may affect the experiment can be excluded. This condition can hardly be met in empirical studies in social sciences, especially in economics. We use the Placebo test to relieve this concern. The test is an important methodological tool in medical research and is popular in policy analysis in economics. We conduct a Placebo test by randomly assigning TCZ status to prefectures and re-run the regressions (for similar practices, see, e.g., [48]). Recall that there are 156 TCZ prefectures in our sample of 287 prefectures. We first randomly select 156 prefectures from the 287 prefectures and assign them as false TCZ prefectures, with the remaining being non-TCZ prefectures; then we construct a false treatment variable, i.e., . The random selection ensures that this newly constructed false interaction term should have no effect on industrial activities. In other words, any significant findings would indicate model misspecification. We conduct this random selection 100 times and regress 100 times with this false DID model to avoid contamination by any rare events.
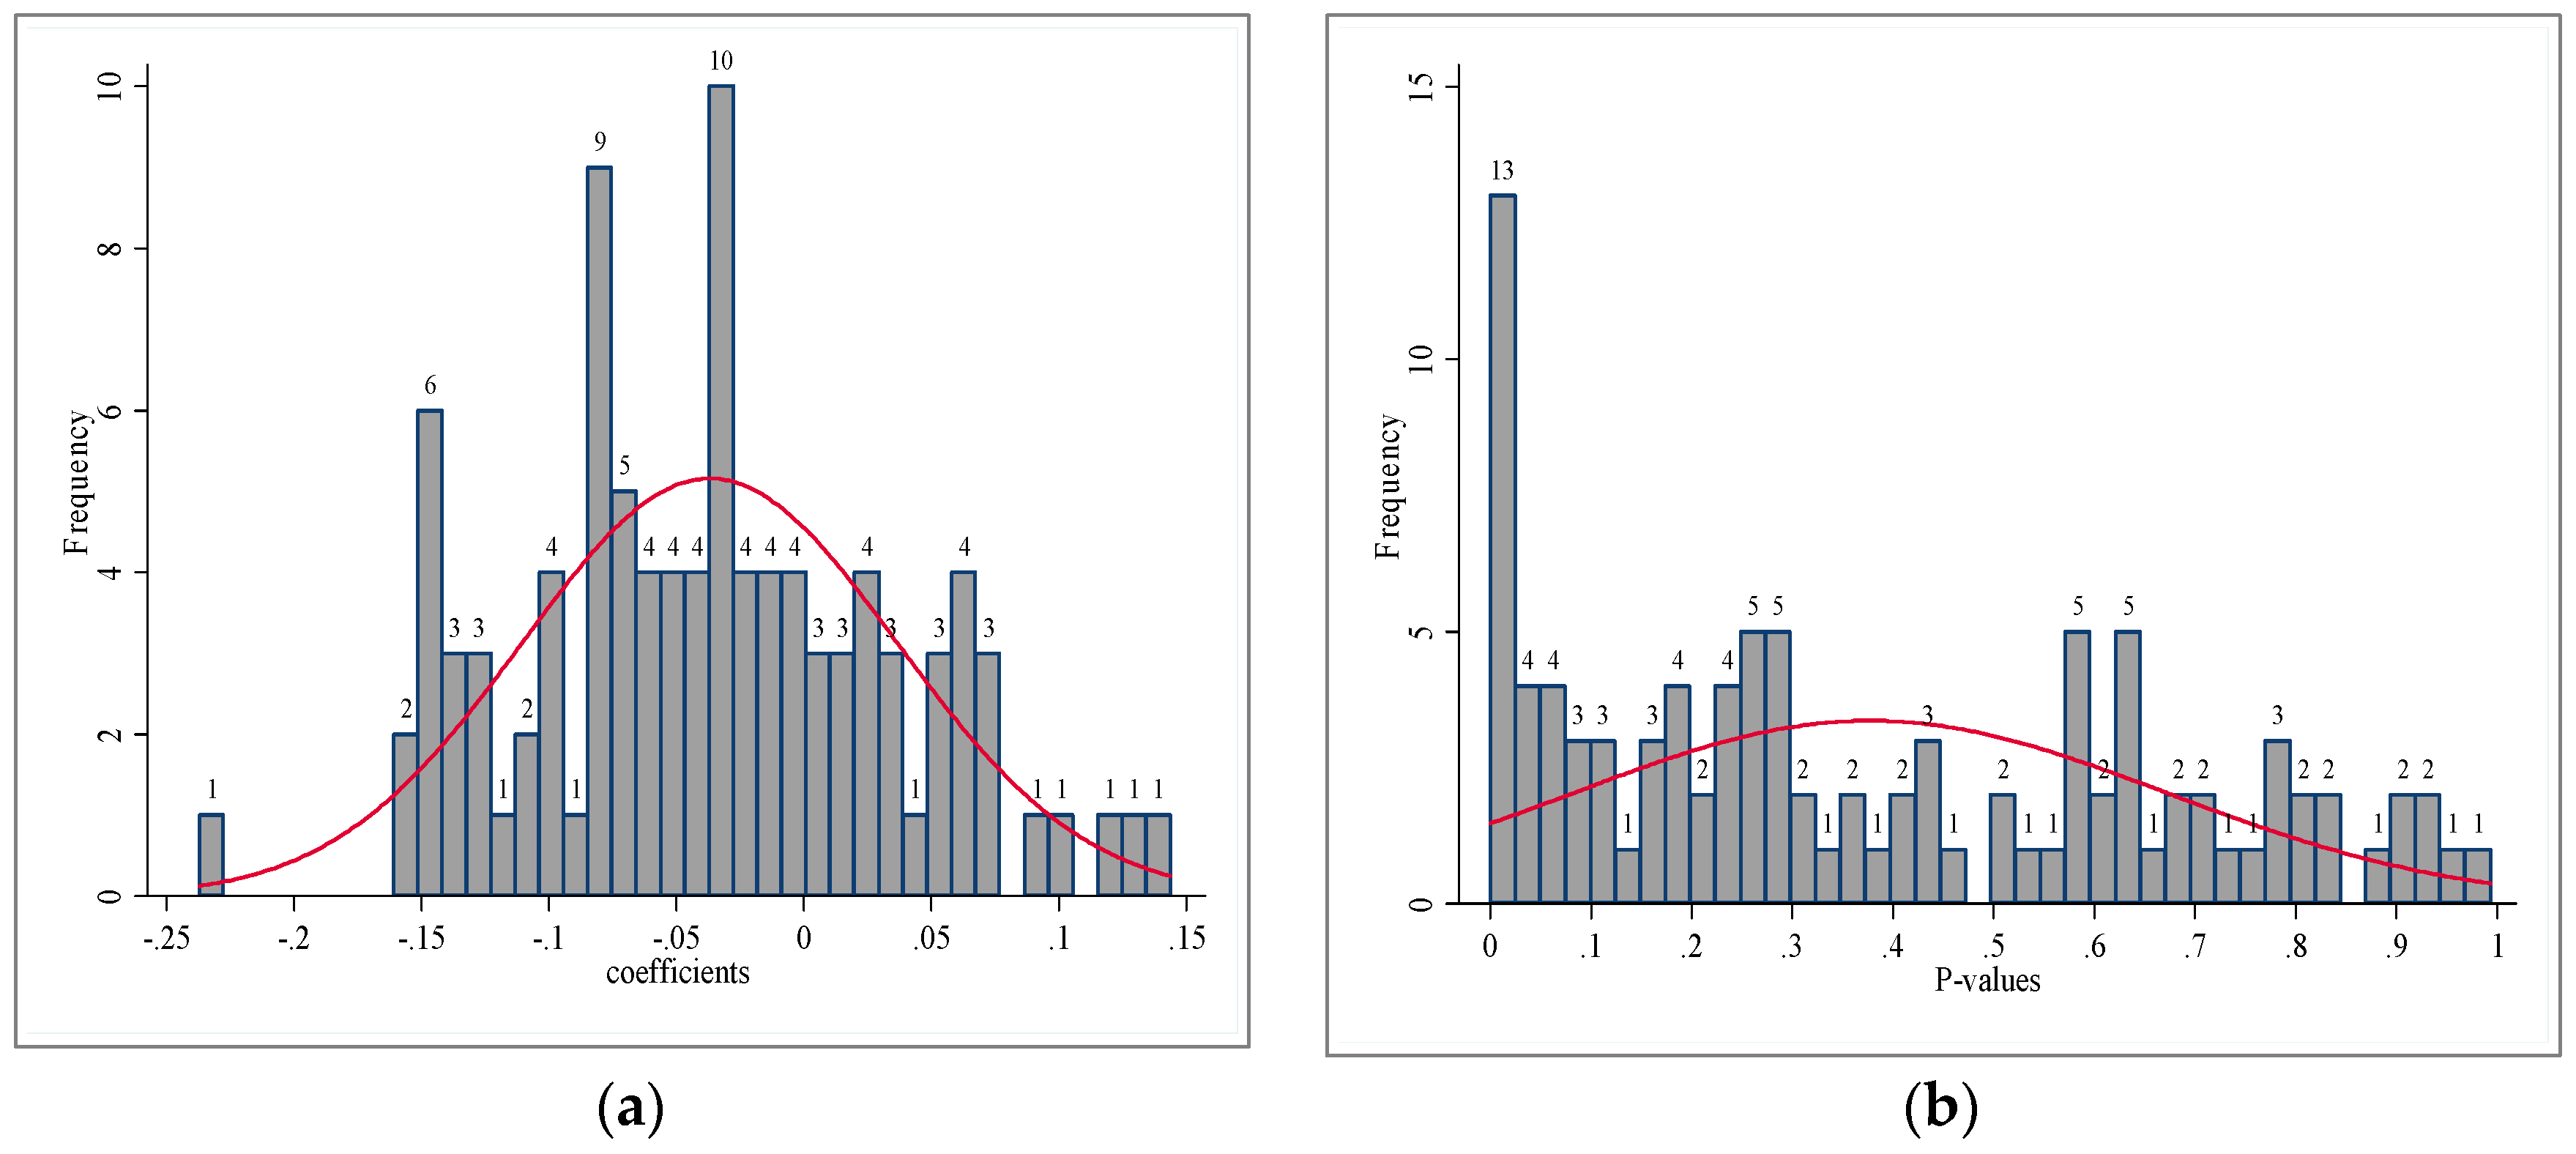
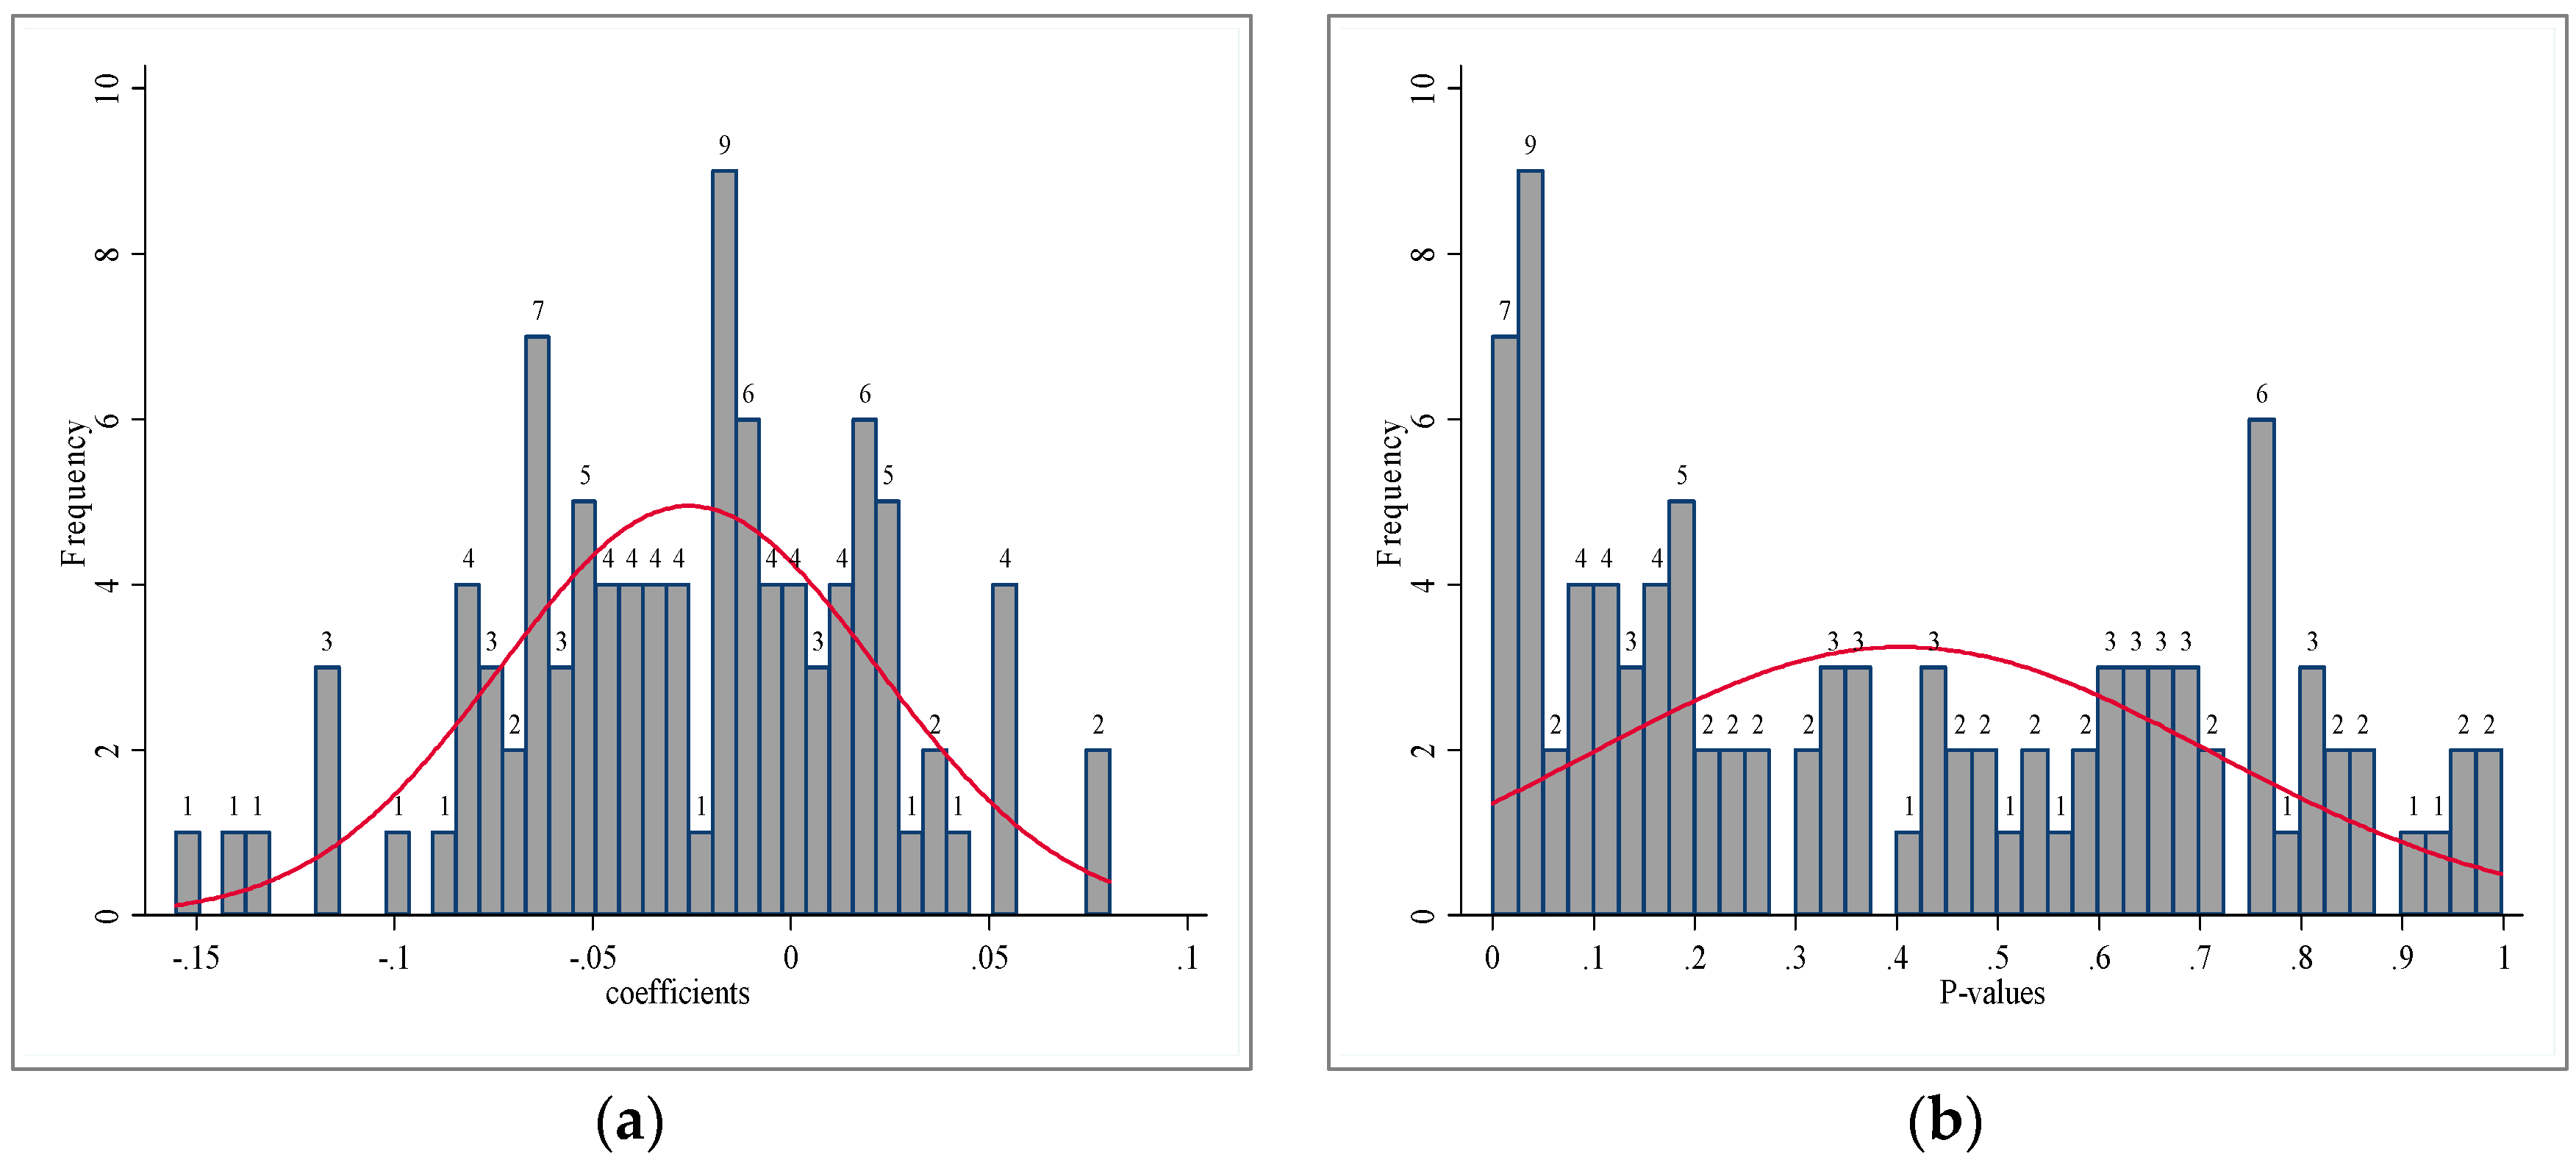
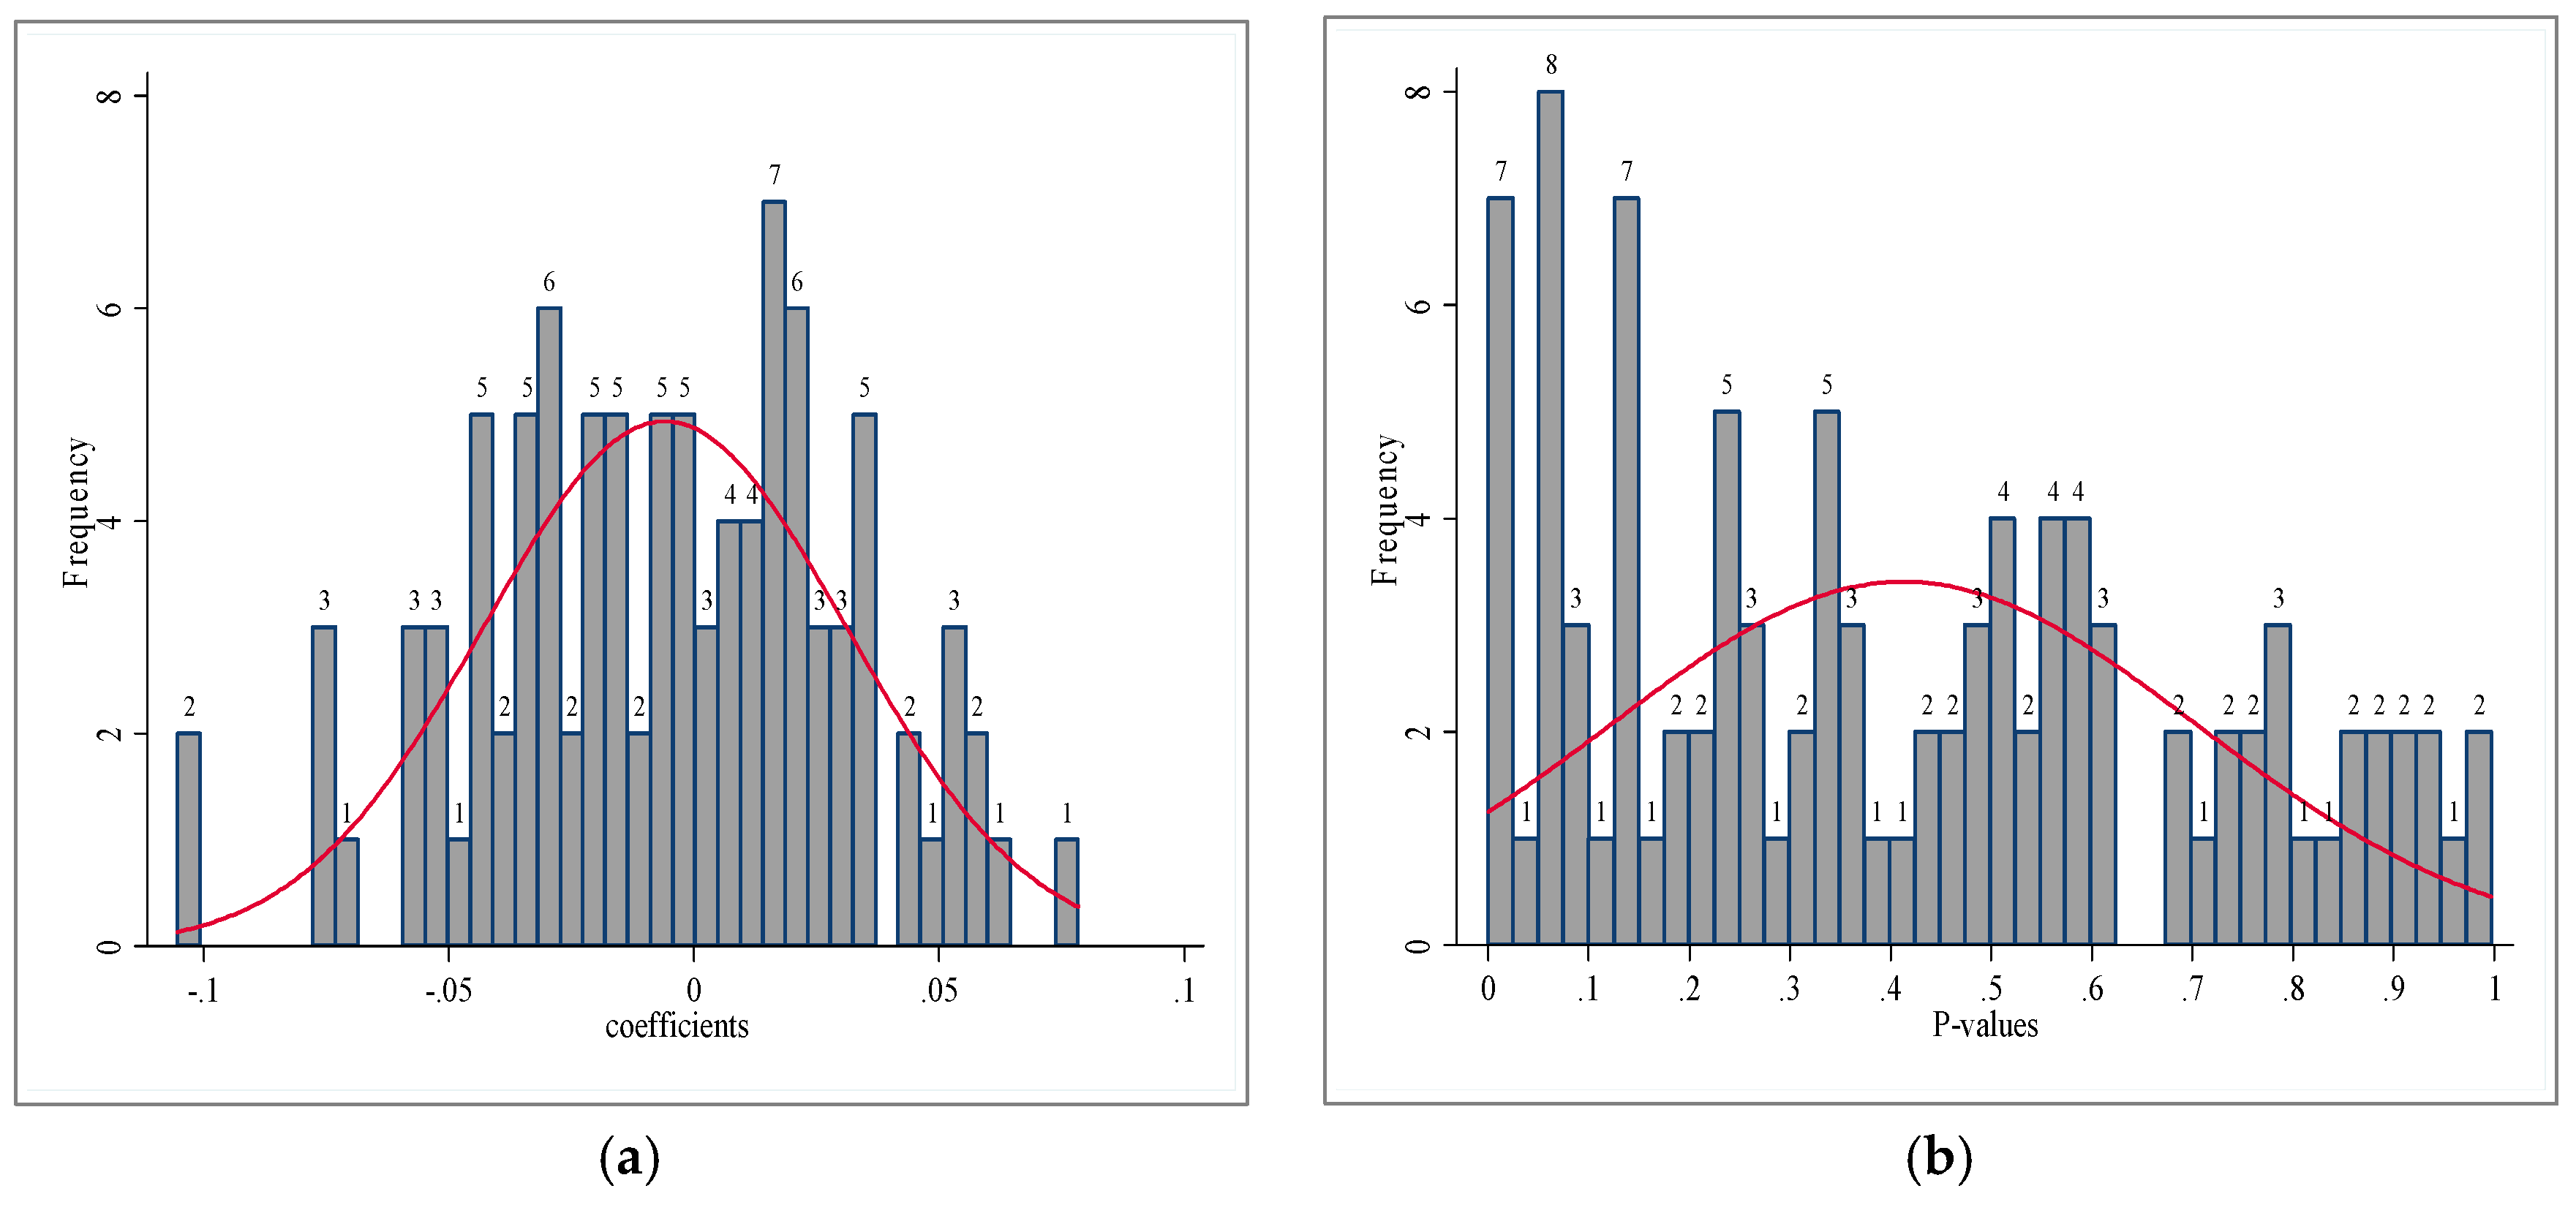
Table 11 reports the mean values of the estimated coefficient and the associated p-value and standard error of the false interaction term for the 100 runs of the regression. We find that the mean values of the coefficients are almost zero (i.e., −0.0369, −0.0258, and −0.0060, respectively), and the mean p-values are far larger than 0.1 (i.e., 0.3775, 0.4050, and 0.4132, respectively). We further plot the distribution of the 100 estimated coefficients and their associated p-values in Figure 7, Figure 8 and Figure 9, respectively. The distribution centers of the estimated coefficients are around zero. Overall, these results suggest that our estimates are not severely biased due to any uncontrolled factors.
5.3. Other Explanation
The last concern is about the possible bias due to the impact of the policy treatment on the control group. The DID method assumes the existence of a control group which is unaffected by the policy treatment. However, if firms move from TCZ prefectures to non-TCZ prefectures because of the relatively lower environmental standards in non-TCZ prefectures, our estimates would be biased. To illustrate this, the DID method can be implemented according to Table 12, where D1, D2, D3, and D4 represent the observable Yijt (either sales value, number of firms, or number of new firms) under different situations:
D1 = (Y | TCZ = 0, Pollution = 0),
D2 = (Y | TCZ = 0, Pollution = 1),
D3 = (Y | TCZ = 1, Pollution = 0),
D4 = (Y | TCZ = 1, Pollution = 1),
With reference to Equation (1),
β3 = [(Y | TCZ = 1, Pollution = 1) − (Y | TCZ = 1, Pollution = 0)] − [(Y | TCZ = 0, Pollution = 1) − (Y | TCZ = 0, Pollution = 0)] = (D4 − D3) − (D2 − D1)
Thus, β3 is the DID estimator measured as the “regulation effect”. Now if polluting firms moved from TCZ prefectures to non-TCZ prefectures in response to the TCZ policy, the observed D2 would increase, leading to an underestimation of β3. In other words, the regulation effect in reality should be larger than what we have estimated.
6. Conclusions
China is a major contributor to the world’s global warming emissions. Whether China can reduce its emissions at a reasonable pace has direct bearing on the world’s battle against environmental degradation. The effectiveness of China’s environmental regulation, however, has to be understood in the context of its special institutional environment. Particularly important is the RDA regime that shapes the incentives of local officials in choosing strategies to achieve growth and environmental targets. Its long-existing heavy emphasis on growth in the assessment scheme in the past and the recent shift to higher weighting for environmental outcomes have motived local cadres to act correspondingly, taking into consideration the specific characteristics of the location under their jurisdiction. Environmental regulation such as the TCZ policy may lead to not only an overall reduction of polluting activities, but also a relocation of polluting activities across regions.
To analyze the impacts of the TCZ policy, we have applied the DID method to a unique firm-level data set covering the period from 1999–2009. We find that stricter environmental regulation led to a lower level of polluting industrial activities in TCZ prefectures, which was associated with more closures of polluting firms in targeted prefectures and more new polluting firms in non-targeted locations. In addition, our findings suggest that the TCZ policy had more pronounced effects in the coastal areas and became more effective after China changed its assessment criteria for the performance of local officials in the late 2000s.
The results are based on regressions that have controlled for a range of prefecture socioeconomic, demographic, and other characteristics, as well as a rich set of potentially time-variant two-digit industry effects and time-variant province effects to mitigate omitted variable bias. In addition, we used the PSM-DID and placebo tests to relieve concerns with the DID models, wherein the selection bias and random assignment are the fundamental challenges. We found little evidence that undermines our basic conclusions.
China ratified the Paris Agreement in 2016 and will be a key player in the world’s deep de-carbonization actions to combat the adverse impacts of climate change. Local officials are primarily responsible for implementing environmental policies under the RDA regime in China. Thus, environmental improvement in the long run may rely on refinements of the incentive system in such a way that local officials and polluting firms would be induced to embrace environmental protection.
Acknowledgments
A substantial part of this study was conducted during Bin Chen’s visit to Hong Kong Baptist University in 2016. The financial support for the visit from the David C. Lam Institute for East-West Studies (LEWI) is gratefully acknowledged.
Author Contributions
Bin Chen analyzed the data; Bin Chen and Yuk-shing Cheng wrote the paper.
Conflicts of Interest
The authors declare no conflict of interest.
References
- Kan, H.; Chen, R.; Tong, S. Ambient air pollution, climate change, and population health in China. Environ. Int. 2012, 42, 10–19. [Google Scholar] [CrossRef] [PubMed]
- Zhang, Q.; Jiang, X.; Tong, D.; Davis, S.; Zhao, H.; Geng, G.; Feng, T.; Zheng, B.; Lu, Z.; Streets, D.G.; et al. Transboundary health impacts of transported global air pollution and international trade. Nature 2017, 543, 705–718. [Google Scholar] [CrossRef] [PubMed]
- Zhang, J.; Mauzerall, D.L.; Zhu, T.; Liang, S.; Ezzati, M.; Remais, J. Environmental health in China: Challenges to achieving clean air and safe water. Lancet 2010, 375, 1110–1119. [Google Scholar] [CrossRef]
- World Bank. Cost of Pollution in China: Economic Estimates of Physical Damages; World Bank: Washington, DC, USA, 2007. [Google Scholar]
- Dewan, A.M.; Yamaguchi, Y. Land use and land cover change in Greater Dhaka, Bangladesh: Using remote sensing to promote sustainable urbanization. Appl. Geogr. 2009, 29, 390–401. [Google Scholar] [CrossRef]
- Cropper, M.; Griffiths, C. The interaction of population growth and environmental quality. Am. Econ. Rev. 1994, 84, 250–254. [Google Scholar]
- Smil, V. The Bad Earth: Environmental Degradation in China; Sharpe: Armonk, NY, USA, 1984. [Google Scholar]
- El Araby, M. Urban growth and environmental degradation: The case of Cairo, Egypt. Cities 2002, 19, 389–400. [Google Scholar] [CrossRef]
- Dewan, A.M.; Kabir, M.H.; Nahar, K.; Rahman, M.Z. Urbanisation and environmental degradation in Dhaka Metropolitan Area of Bangladesh. Int. J. Environ. Sustain. Dev. 2012, 11, 118–147. [Google Scholar] [CrossRef]
- Zheng, S.; Kahn, M.E. Understanding China’s urban pollution dynamics. J. Econ. Lit. 2013, 51, 731–772. [Google Scholar]
- OECD. OECD Environmental Outlook to 2030; ISBN Working Paper No.978-92-64-04048-9; Organization of Economic Cooperation and Development: Paris, France, 2008; Available online: http://www.oecd.org/environment/indicators-modelling-outlooks/oecdenvironmentaloutlookto2030.htm (accessed on 8 April 2017).
- Knight, C.F. Effects of National Environmental Regulation and International Trade and Investment-Selected Issues. Pac. Basin Law J. 1991, 10, 212–223. [Google Scholar]
- Research Group of China Environmental Protection and Social Development. China Environmental Protection and Social Development: Theory Reform Practice; China Yanshi Press: Beijing, China, 2014. [Google Scholar]
- Wu, L.; Kaneko, S.; Matsuoka, S. Driving forces behind the stagnancy of China’s energy-related CO2 emissions from 1996 to 1999: The relative importance of structural change, intensity change and scale change. Energy Policy 2005, 33, 319–335. [Google Scholar] [CrossRef]
- Dean, J.M.; Lovely, M.E.; Wang, H. Are foreign investors attracted to weak environmental regulations? Evaluating the evidence from China. J. Dev. Econ. 2009, 90, 1–13. [Google Scholar] [CrossRef]
- Christmann, P.; Taylor, G. Globalization and the environment: Determinants of firm self-regulation in China. J. Int. Bus. Stud. 2001, 32, 439–458. [Google Scholar] [CrossRef]
- Chen, Y.; Jin, G.Z.; Kumar, N.; Shi, G. Gaming in Air Pollution Data? Lessons from China. B E J. Econ. Anal. Policy. 2012, 12, 1–43. [Google Scholar] [CrossRef]
- Xu, C. The Fundamental Institutions of China’s Reforms and Development. J. Econ. Lit. 2011, 49, 1076–1151. [Google Scholar] [CrossRef]
- Maskin, E.; Qian, Y.; Xu, C. Incentives, scale economies, and organization forms. Rev. Econ. Stud. 2000, 67, 359–378. [Google Scholar] [CrossRef]
- Blanchard, O.; Shleifer, A. Federalism with and without political centralization: China vs. Russia in transitional economics: How much progress? IMF Staff Pap. 2001, 48, 171–179. [Google Scholar]
- Shih, V.; Adolph, C.; Liu, M. Getting ahead in the communist party: Explaining the advancement of central committee members in China. Am. Political Sci. Rev. 2012, 106, 166–187. [Google Scholar] [CrossRef]
- OECD. Environmental Compliance and Enforcement in China: An assessment of Current Practices and Ways Forward; OECD: Paris, France, 2006. [Google Scholar]
- Auffhammer, M.; Carson, R.T. Forecasting the path of China’s CO2 emissions using province-level information. J. Environ. Econ. Manag. 2008, 55, 229–247. [Google Scholar] [CrossRef]
- Viard, V.B.; Fu, S. The effect of Beijing’s driving restrictions on pollution and economic activity. J. Public Econ. 2015, 125, 98–115. [Google Scholar] [CrossRef]
- Levinson, A. Environmental regulations and manufacturers’ location choices: Evidence from the Census of Manufactures. J. Public Econ. 1996, 62, 5–29. [Google Scholar] [CrossRef]
- Sun, C.; Zhang, D. Forest Resources, Government Policy, and Investment Location Decisions of the Forest Products Industry in the Southern United States. For. Sci. 2001, 47, 169–177. [Google Scholar]
- Hering, L.; Poncet, S. Environmental policy and exports: Evidence from Chinese cities. J. Environ. Econ. Manag. 2014, 68, 296–318. [Google Scholar] [CrossRef]
- Parker, R.S. Vulnerability and resiliency: Environmental degradation in major metropolitan areas of developing countries. In Environmental Degradation and Urban Vulnerability; World Bank: Washington, DC, USA, 1992; pp. 107–152. [Google Scholar]
- Bolt, K.; Ruta, G.; Sarraf, M. Estimating the Cost of Environmental Degradation. A Training Manual in English, French and Arabic; The World Bank Environment Department: Washington, DC, USA, 2005; pp. 51–56. [Google Scholar]
- Ferrer-I-Carbonell, A.; Gowdy, J.M. Environmental degradation and happiness. Ecol. Econ. 2007, 60, 509–516. [Google Scholar] [CrossRef]
- Byrne, M.M. Is growth a dirty word? Pollution, abatement and endogenous growth. J. Dev. Econ. 1997, 54, 261–284. [Google Scholar] [CrossRef]
- Dean, T.J.; McMullen, J.S. Toward a theory of sustainable entrepreneurship: Reducing environmental degradation through entrepreneurial action. J. Bus. Ventur. 2007, 22, 50–76. [Google Scholar] [CrossRef]
- WHO. Global Burden of Disease; WHO: Geneva, Switzerland, 2010; Available online: http://www.healthdata.org/gbd (accessed on 20 March 2016).
- National Bureau of Statistics of China. China Statistical Yearbook 2016; China Statistics Press: Beijing, China, 2016. [Google Scholar]
- National Bureau of Statistics of China. China Regional Yearbook 2006–2010; China Statistics Press: Beijing, China, 2006–2010. [Google Scholar]
- Ministry of Environmental Protection of China. China Environmental Statistical Bulletin 1995–2011; Ministry of Environmental Protection of China: Beijing, China, 2016. Available online: http://zls.mep.gov.cn/hjtj/qghjtjgb/ (accessed on 8 April 2017).
- State Council. Official Reply to the State Council Concerning Acid Rain Control Area and Sulfur Dioxide Pollution Control Areas; State Council: Beijing, China, 1998.
- State Council. The Tenth Five-Year Plan for National Economic and Social Development of the People’s Republic of China. In Proceedings of the National People’s Congress of the People’s Republic of China, Beijing, China, January 2001–December 2001. [Google Scholar]
- Ministry of Environmental Protection. Report on the First National Census of Polluting Sources; Ministry of Environmental Protection: Beijing, China, 2010.
- Zhou, Y.; Zhu, S.; He, C. How do environmental regulations affect industrial dynamics? Evidence from China’s pollution-intensive industries. Habitat Int. 2017, 60, 10–18. [Google Scholar] [CrossRef]
- Greenstone, M. The Impacts of Environmental Regulations on Industrial Activity: Evidence from the 1970 and 1977 Clean Air Act Amendments and the Census of Manufactures. J. Political Econ. 2002, 110, 1175–1219. [Google Scholar] [CrossRef]
- Wu, J.; Deng, Y.; Huang, J.; Morck, R.; Yeung, B. Incentives and Outcomes: China’s Environmental Policy; NBER Working Paper No.18754; National Bureau of Economic Research: Massachusetts, UK, 2013; Available online: http://citeseerx.ist.psu.edu/viewdoc/download?doi=10.1.1.692.1320&rep=rep1&type=pdf (accessed on 8 April 2017).
- Economy, E.C. The Great Leap Backward? The costs of Chinese environmental crisis. Foreign Aff. 2007, 86, 38–59. [Google Scholar]
- Wheeler, D. Racing to the Bottom? Foreign Investment and Air Pollution in Developing Countries. J. Environ. Dev. 2001, 10, 225–245. [Google Scholar] [CrossRef]
- Cai, H.; Chen, Y.; Gong, Q. Polluting thy neighbor: Unintended consequences of China’s pollution reduction mandates. J. Environ. Econ. Manag. 2016, 76, 86–104. [Google Scholar] [CrossRef]
- Zuo, C. Promoting City Leaders: The Structure of Political Incentives in China. China Quart. 2015, 224, 955–984. [Google Scholar] [CrossRef]
- Marquis, C.; Zhang, J.; Zhou, Y. Regulatory uncertainty and corporate responses to environmental protection in China. Calif. Manag. Rev. 2011, 54, 39–63. [Google Scholar] [CrossRef]
- Cai, X.; Lu, Y.; Wu, M.; Yu, L. Does Environmental Regulation Drive away Inbound Foreign Direct Investment? Evidence from a Quasi-Natural Experiment in China. J. Dev. Econ. 2016, 123, 73–85. [Google Scholar] [CrossRef]
Figure 1.
Energy consumption in China during 1978–2014 [34].
Figure 1.
Energy consumption in China during 1978–2014 [34].

Figure 2.
Gross Domestic Product (GDP) and Waste Gas Emission during 2000–2014 [34].
Figure 2.
Gross Domestic Product (GDP) and Waste Gas Emission during 2000–2014 [34].
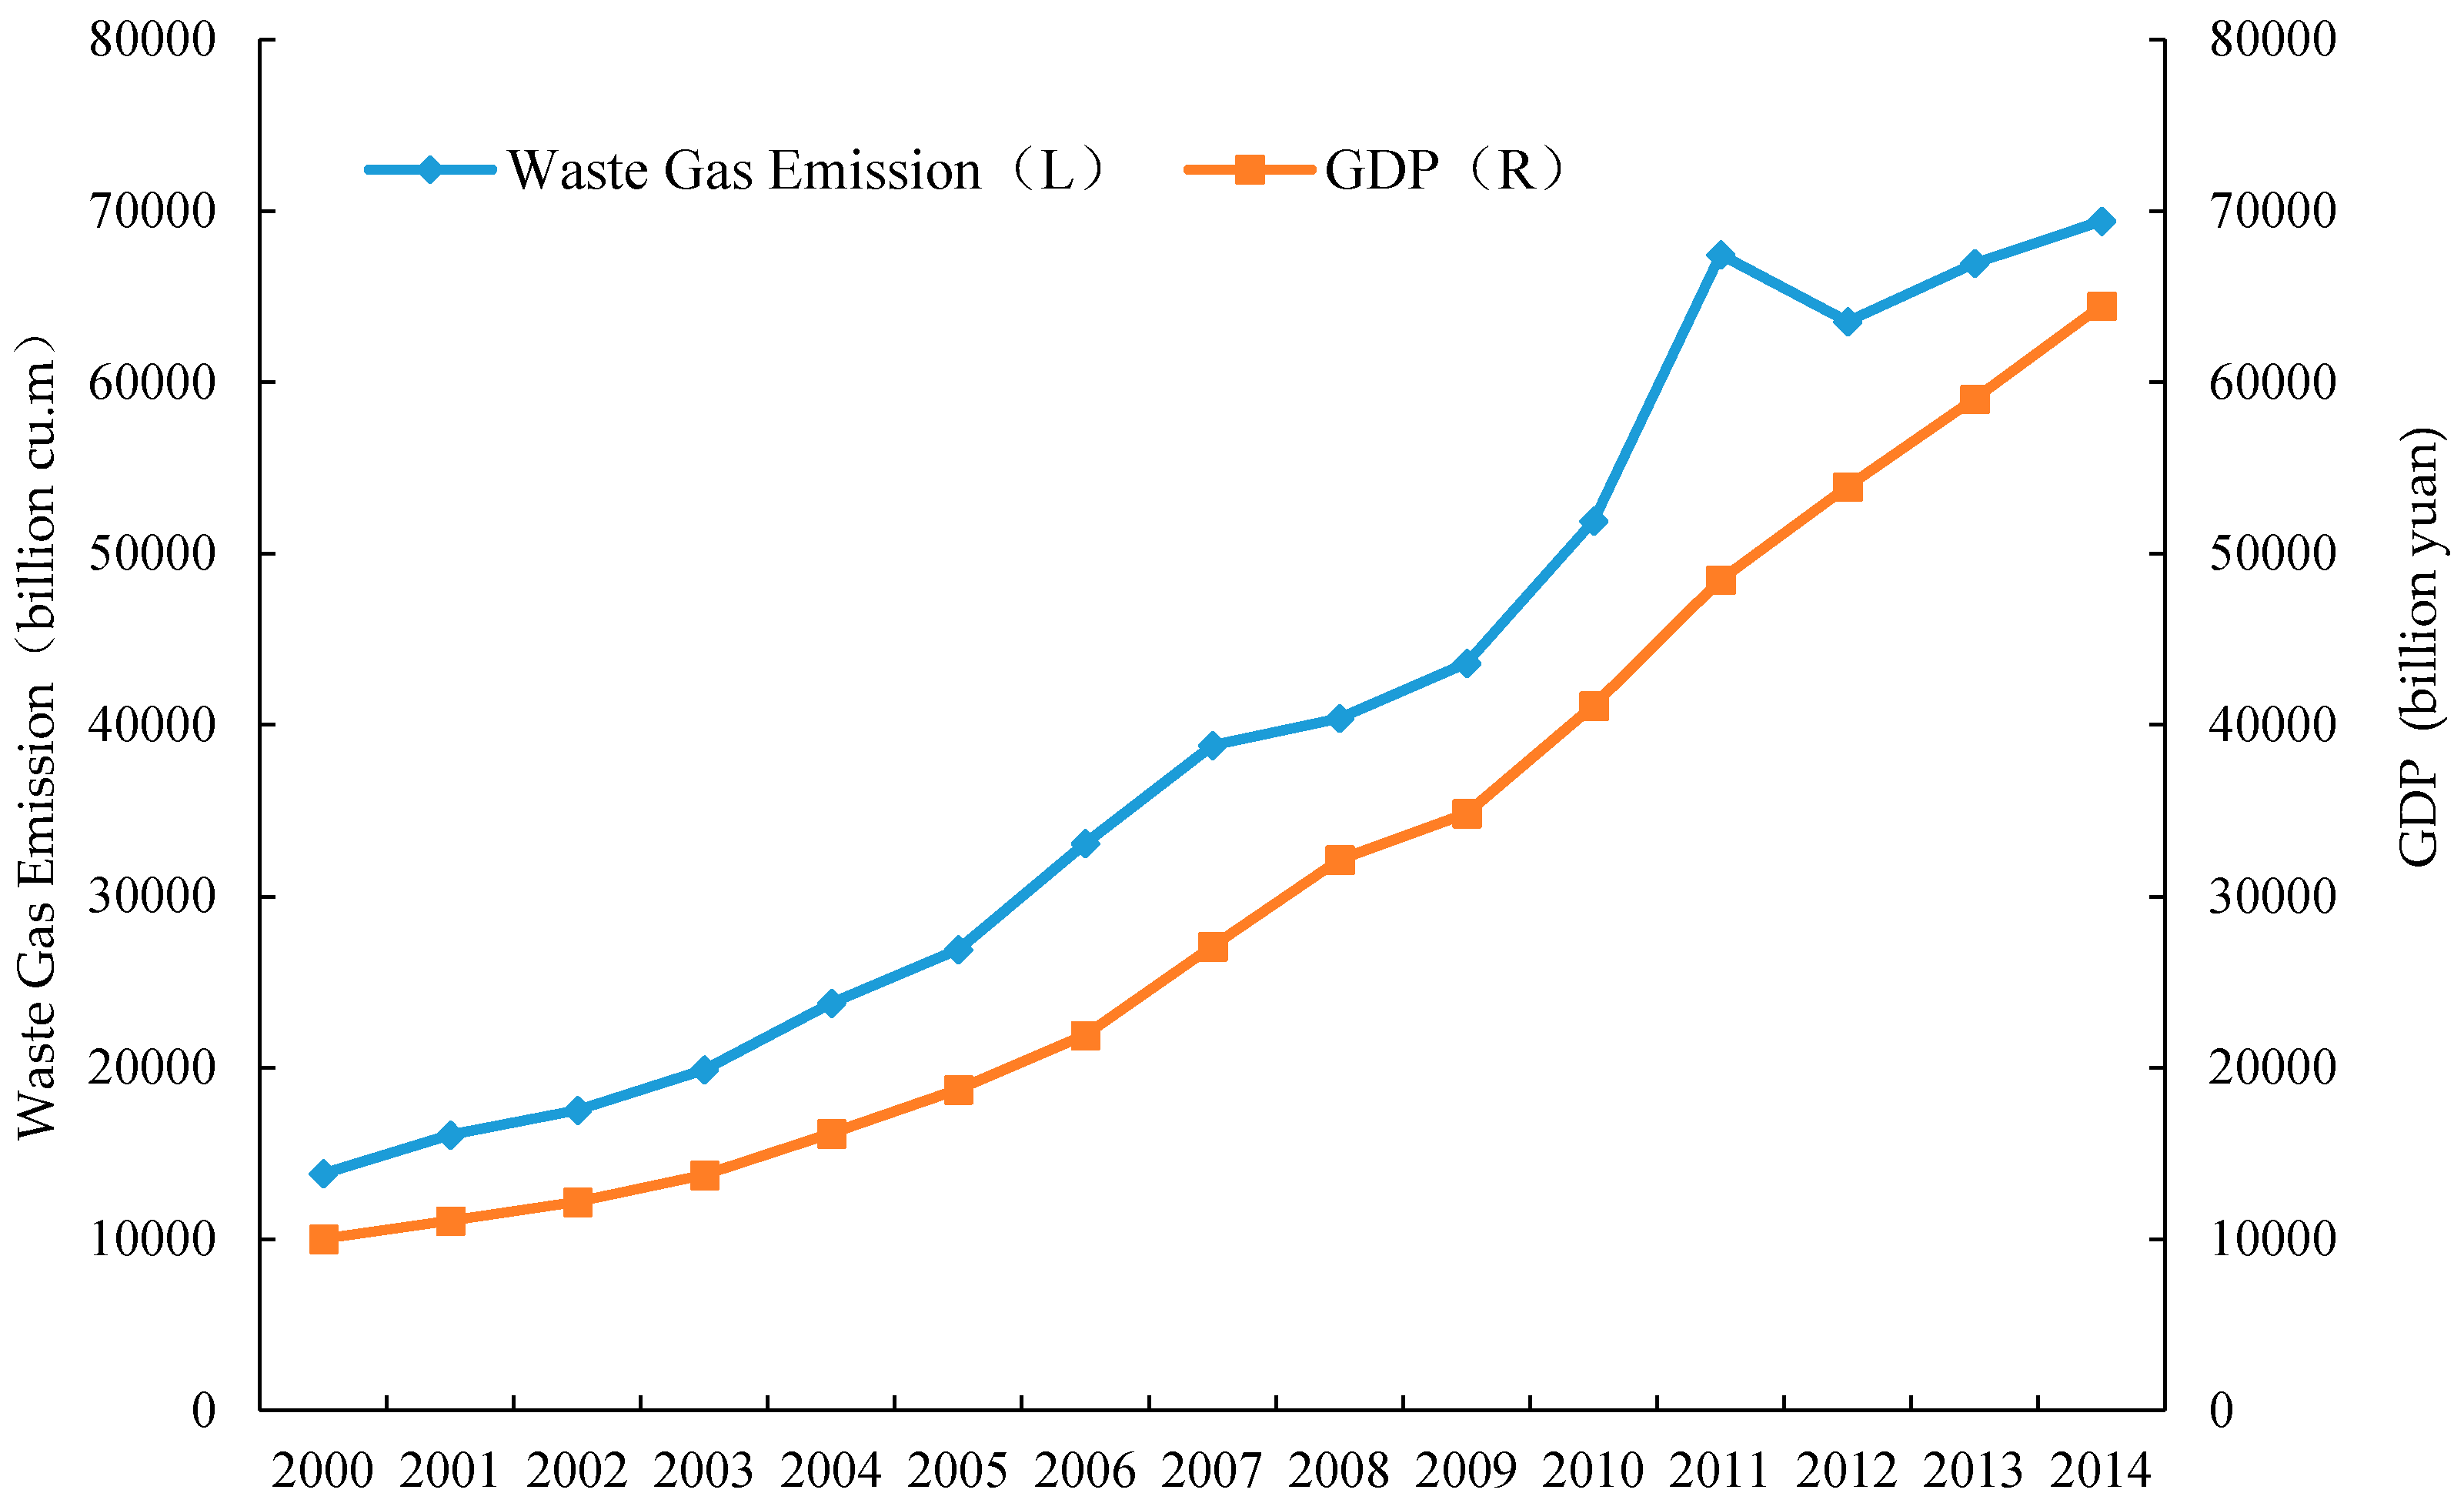
Figure 3.
Industrial SO2 emission intensity in Chinese prefectures in (a) 2005 and (b) 2009.

Figure 4.
Industrial Soot emission intensity in Chinese prefectures in (a) 2005 and (b) 2009 [35].
Figure 4.
Industrial Soot emission intensity in Chinese prefectures in (a) 2005 and (b) 2009 [35].

Figure 5.
Number of petitions and administrative penalty cases on environmental issues in China during 1995–2010 [36].
Figure 5.
Number of petitions and administrative penalty cases on environmental issues in China during 1995–2010 [36].

Figure 6.
Locations of Two Control Zones (TCZ).
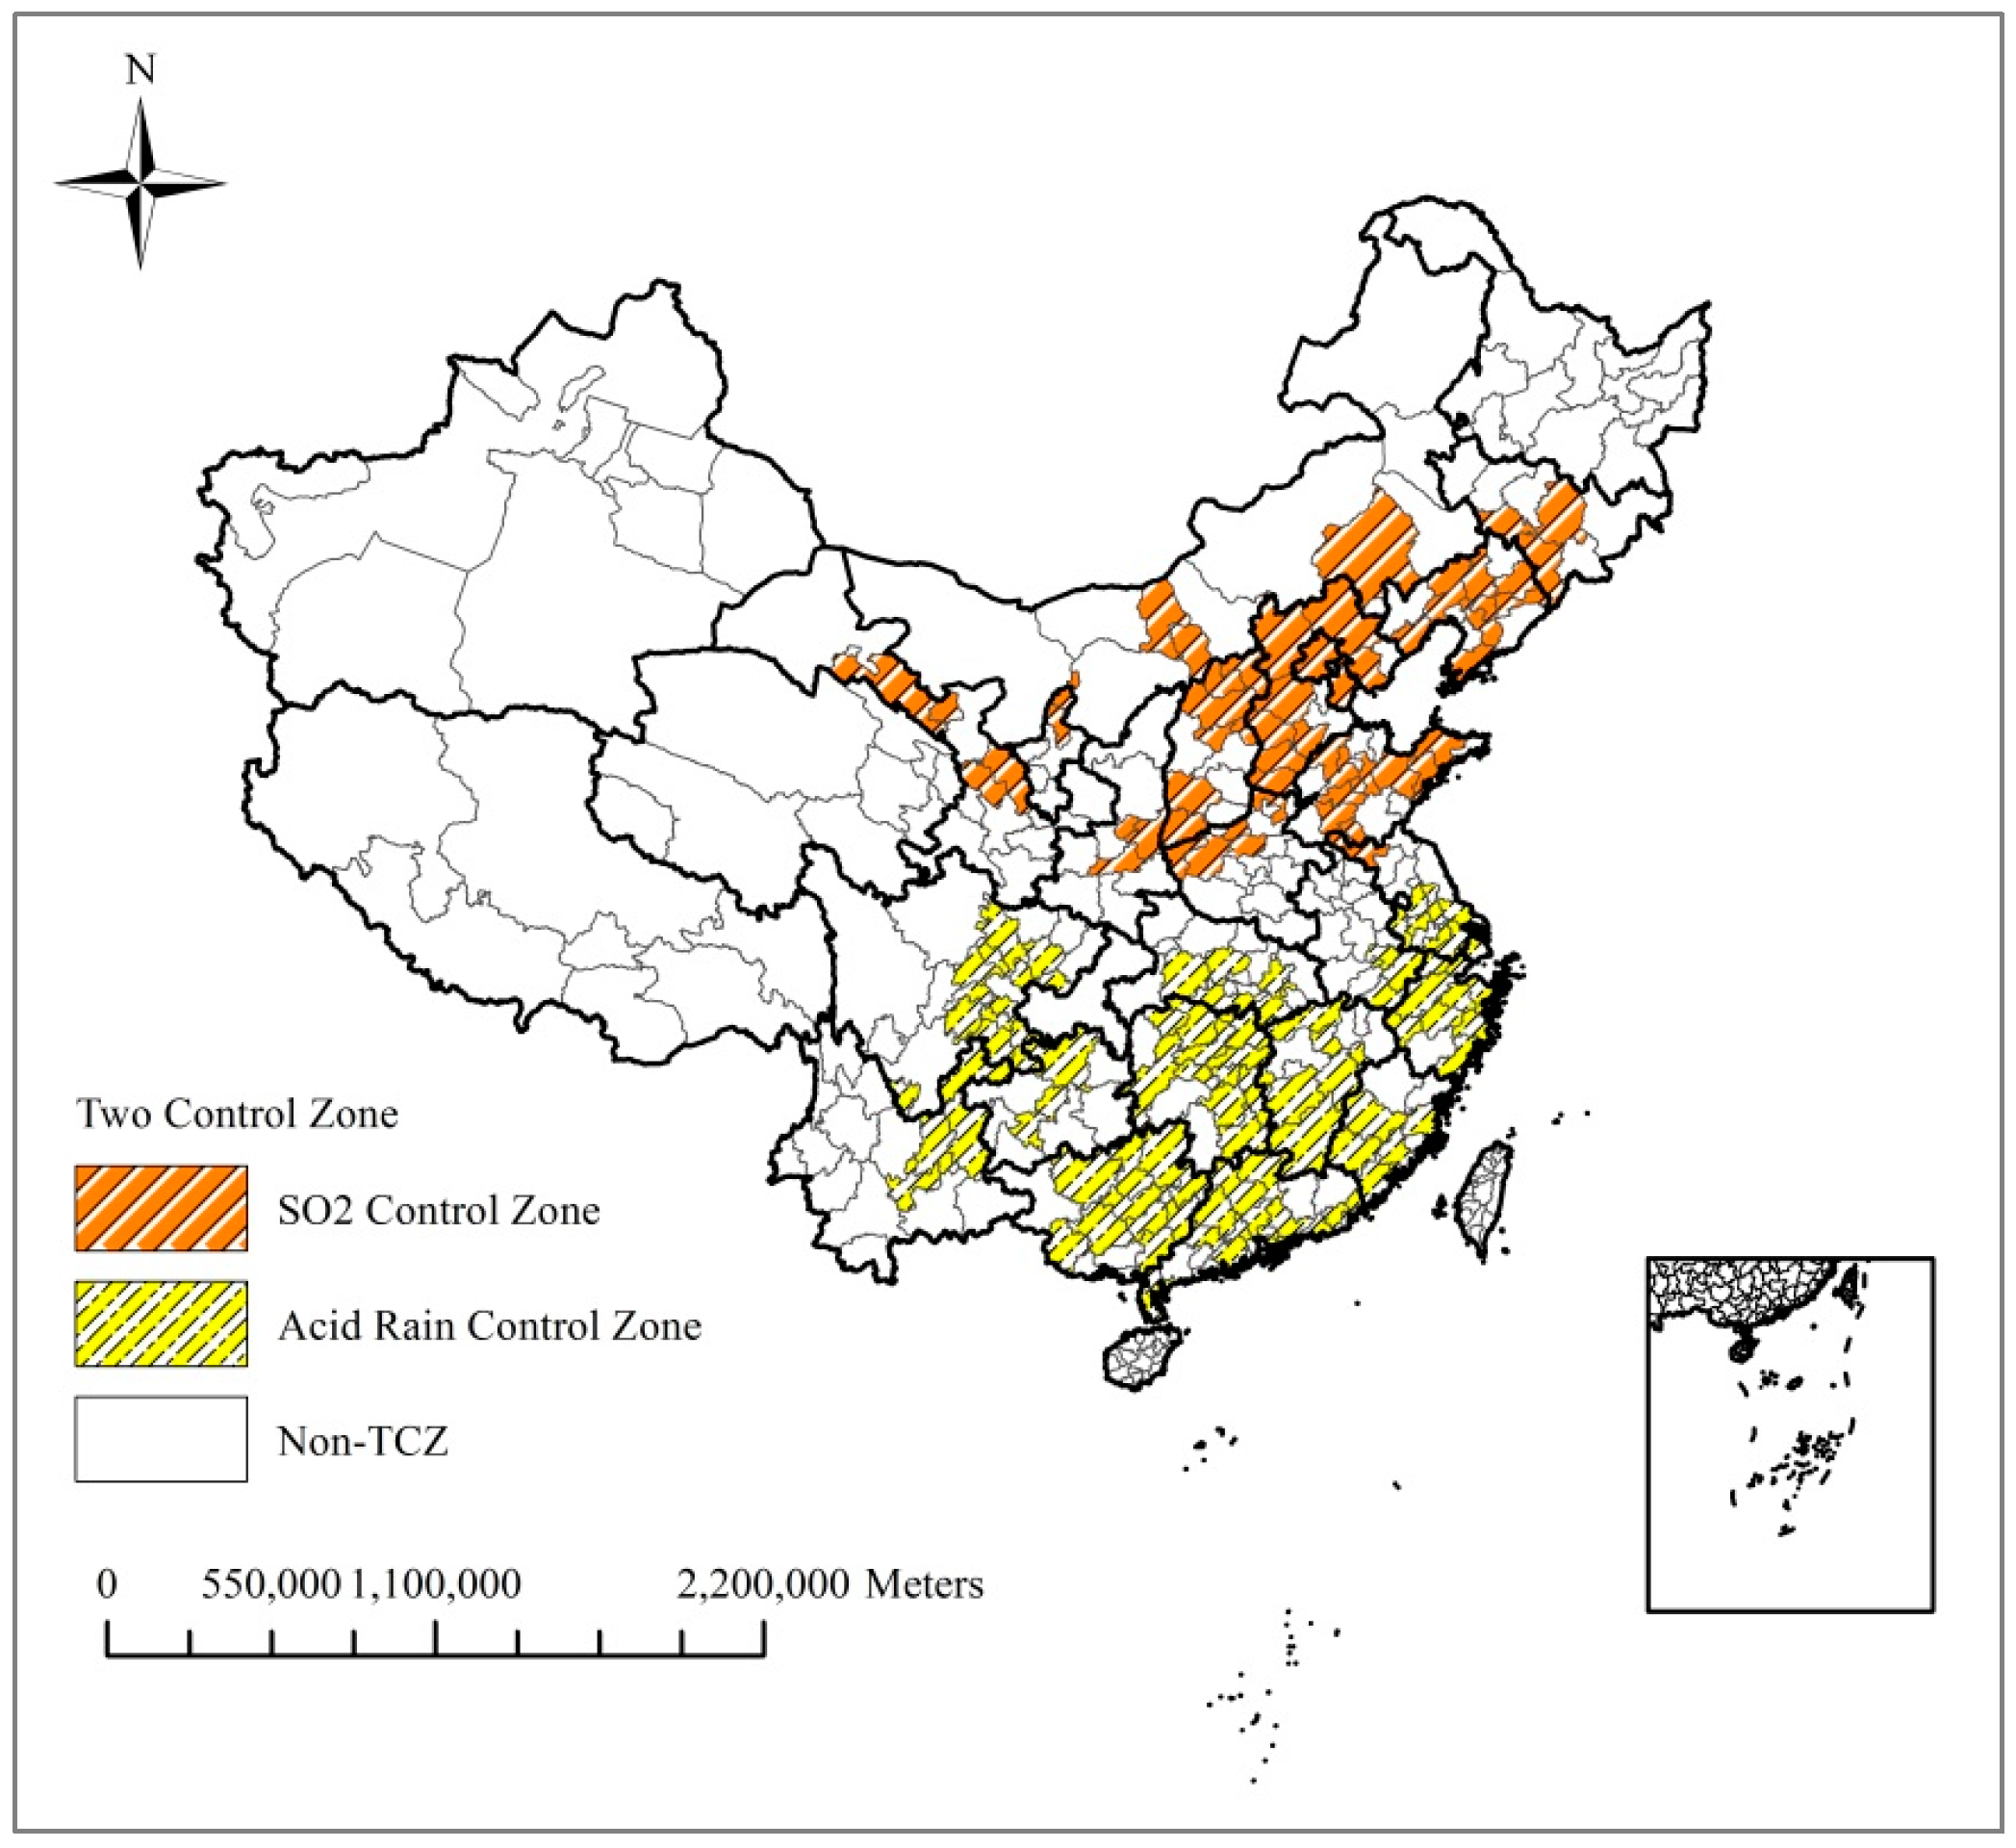
Figure 7.
Distribution of (a) the 100 estimated coefficients and (b) their p-values -Log(sales value/GDP) regression.
Figure 7.
Distribution of (a) the 100 estimated coefficients and (b) their p-values -Log(sales value/GDP) regression.

Figure 8.
Distribution of (a) the 100 estimated coefficients and (b) their p-values - Log(number of firms) regression.
Figure 8.
Distribution of (a) the 100 estimated coefficients and (b) their p-values - Log(number of firms) regression.

Figure 9.
Distribution of (a) the 100 estimated coefficients and (b) their p-values - Log(number of new firms) regression.
Figure 9.
Distribution of (a) the 100 estimated coefficients and (b) their p-values - Log(number of new firms) regression.


Table 1.
Pearson Correlation Coefficients between the prefectural and industrial aggregate variables.
Table 1.
Pearson Correlation Coefficients between the prefectural and industrial aggregate variables.
| A. Pearson Correlation Coefficients between the prefectural aggregate variables | ||||
| Gross industrial output value (yearbook data) | GDP (yearbook data) | Sales value (ASIP sample) | ||
| Gross industrial output value | 1.0000 | |||
| GDP | 0.9632 * | 1.0000 | ||
| Sales value | 0.9422 * | 0.9216 * | 1.0000 | |
| B. Pearson Correlation Coefficients between 2-digit industrial aggregate variables | ||||
| Sales value of industry (yearbook data) | Gross industrial output value (yearbook data) | Sales value (ASIP sample) | ||
| Sales value of industry | 1.0000 | |||
| Gross industrial output value | 0.9999 * | 1.0000 | ||
| Sales value | 0.9032 * | 0.9108 * | 1.0000 | |
| C. Pearson Correlation Coefficients between 2-digit industrial aggregate variables | ||||
| Number of industry firms (yearbook data) | Number of firms (ASIP sample) | |||
| Number of industry firms | 1.0000 | |||
| Number of firms | 0.9798 * | 1.0000 | ||
Note: * significant at 1 percent (Bonferroni-adjusted).
Table 2.
List of two-digit sectors.
| No. | Air-Polluting Industries |
|---|---|
| A | Manufacture of food |
| B | Manufacture of food processing |
| C | Manufacture of wood; products of wood and cork |
| D | Manufacture of paper and paper products |
| E | Manufacture of coke, refined petroleum, and nuclear fuel |
| F | Manufacture of chemicals and chemical products |
| G | Manufacture of other non-metal mineral products |
| H | Manufacture of ferrous metal smelting and rolling processing |
| J | Manufacture of Non-ferrous metal smelting and rolling processing |
| K | Manufacture of power steam hot water production and supply |
Table 3.
Variable definitions and Summary statistics.
| Variable | Definition | Obs. | Mean | Std. dev. | Min | Max |
|---|---|---|---|---|---|---|
| Dependent Variable | ||||||
| Industrial activity | Sales value per industry per prefecture/GDP | 92,687 | 0.28 | 0.77 | 0 | 30.49 |
| Industrial activity | Log(sales value per industry per prefecture/GDP) | 83,747 | −2.61 | 1.90 | −14.60 | 3.42 |
| Total firms | number of firms per industry per prefecture | 92,687 | 30.18 | 83.12 | 1 | 2866 |
| Total firms | Log(number of firms per industry per prefecture) | 92,687 | 2.21 | 1.46 | 0 | 7.96 |
| New firms | number of new firms per industry per prefecture, identified by setup year | 28,066 | 3.04 | 4.72 | 1 | 115 |
| New firms | Log(number of new firms per industry per prefecture, identified by setup year) | 28,066 | 0.66 | 0.81 | 0 | 4.74 |
| Variable of interest | ||||||
| TCZ | Whether it is TCZ prefecture: 1 = yes, 0 = no | 92,692 | - | - | 0 | 1 |
| Polluting industries | Whether it is Air-polluting industries: 1 = yes, 0 = no | 92,692 | - | - | 0 | 1 |
| TCZ *Polluting industries | Whether it is Air-polluting industries in TCZ prefecture: 1 = yes, 0 = no | 92,692 | - | - | 0 | 1 |
| Control Variable | ||||||
| GDP_1 | previous-year GDP (10,000 yuan) | 84,013 | 7,239,463 | 1.13 × 10⁷ | 1689 | 1.37 × 10⁸ |
| Log(GDP_1) | Log(previous-year GDP) | 84,013 | 15.24 | 0.98 | 12.04 | 18.74 |
| Population | Population (10,000 persons) | 92,692 | 451.73 | 334.76 | 14.55 | 3275.61 |
| Log(Population) | Log(Population) | 92,692 | 5.90 | 0.67 | 2.68 | 8.09 |
| Area | Area (square kilometers) | 92,661 | 15,462.88 | 19,430.57 | 236 | 253,356 |
| Log(Area) | Log(Area) | 92,661 | 9.30 | 0.81 | 5.46 | 12.44 |
| Agriculture | Agricultural share of GDP (%) | 92,692 | 17.07 | 10.03 | 0.08 | 53.20 |
Table 4.
Difference in differences (DID)estimation results.
| (1) | (2) | (3) | |
|---|---|---|---|
| VARIABLES | Log(Sales Value/GDP) | Log(Number of Firms) | Log(Number of New Firms) |
| TCZ | 0.142 *** | 0.100 *** | 0.0529 ** |
| (0.0394) | (0.0255) | (0.0230) | |
| Pollution | −1.116 *** | −0.328 ** | −0.174 |
| (0.198) | (0.153) | (0.119) | |
| Pollution *TCZ | −0.120 ** | −0.106 *** | −0.142 *** |
| (0.0604) | (0.0388) | (0.0329) | |
| Log(GDP_1) | 0.0894 ** | 0.674 *** | 0.205 *** |
| (0.0427) | (0.0295) | (0.0252) | |
| Log(population) | 0.0711 | 0.125 *** | 0.0586 * |
| (0.0544) | (0.0361) | (0.0317) | |
| Log(area) | −0.117 *** | −0.00645 | 0.0210 |
| (0.0304) | (0.0195) | (0.0176) | |
| Agriculture/GDP | −0.00994 *** | −0.00693 *** | 0.00310 * |
| (0.00284) | (0.00181) | (0.00179) | |
| Observations | 75,129 | 83,978 | 20,204 |
| R-squared | 0.354 | 0.572 | 0.307 |
Notes: An observation is an industry-prefecture-year combination. The regressions include a constant term, two-digit industry dummies, and interaction terms between province dummies and year dummies. They are not reported for the conservation of space. Standard errors clustered at the industry-year level are reported in parentheses. *** significant at 1 percent; ** significant at 5 percent; * significant at 10 percent.
Table 5.
List of the seven regions.
| Regions | Provinces |
|---|---|
| Northeastern | Liaoning, Jilin, Heilongjiang |
| North coastal | Beijing, Tianjin, Hebei, Shandong |
| East coastal | Shanghai, Jiangsu, Zhejiang |
| South coastal | Fujian, Guangdong, Hainan |
| Central | Shanxi, Henan, Anhui, Jiangxi, Hubei, Hunan |
| Southwestern | Guangxi, Sichuan, Guizhou, Yunnan, Chongqing |
| Northwestern | Gansu, Qinghai, Ningxia, Xinjiang, Inner Mongolia, Shanxi |
Table 6.
DID estimation results for regions (sales value/GDP).
| Log(Sales Value/GDP) | (1) | (2) | (3) | (4) | (5) | (6) | (7) |
|---|---|---|---|---|---|---|---|
| North Coastal | North Eastern | East Coastal | South Coastal | Central | South Western | North Western | |
| TCZ | 0.0348 | −0.129 | 0.196 | 0.342 *** | 0.0816 | 0.157 | 0.00371 |
| (0.0924) | (0.107) | (0.122) | (0.123) | (0.0674) | (0.130) | (0.135) | |
| Pollution | 0.983 | 0.234 | 2.434 *** | 1.766 ** | −1.480 *** | −1.521 *** | −3.456 *** |
| (0.662) | (0.632) | (0.787) | (0.784) | (0.343) | (0.587) | (0.579) | |
| Pollution *TCZ | −0.161 | 0.104 | −0.366 ** | −0.445 ** | 0.159 | −0.0432 | 0.253 |
| (0.166) | (0.181) | (0.180) | (0.194) | (0.106) | (0.159) | (0.199) | |
| Log(GDP_1) | 0.369 *** | −0.436 *** | 0.266 ** | −0.0473 | 0.206 ** | 0.161 | 0.237 * |
| (0.131) | (0.131) | (0.116) | (0.0681) | (0.101) | (0.148) | (0.130) | |
| Log(population) | 0.0323 | 0.742 *** | −0.344* | −0.266 *** | −0.0629 | 0.0593 | 0.197 |
| (0.170) | (0.193) | (0.203) | (0.0891) | (0.130) | (0.180) | (0.128) | |
| Log(area) | −0.183 | −0.200 * | 0.260 ** | 0.180 *** | −0.103 * | −0.154 * | −0.272 *** |
| (0.114) | (0.115) | (0.127) | (0.0628) | (0.0613) | (0.0817) | (0.0729) | |
| Agriculture/GDP | 0.00846 | −0.0191 *** | −0.0206 ** | −0.0464 *** | 9.43 × 10⁻⁵ | −0.0127 | 0.0100 |
| (0.0109) | (0.0072) | (0.0097) | (0.0062) | (0.0054) | (0.0088) | (0.0089) | |
| Observations | 9277 | 9035 | 7676 | 9196 | 22,188 | 10,263 | 7494 |
| R-squared | 0.489 | 0.425 | 0.544 | 0.379 | 0.397 | 0.425 | 0.399 |
Notes: An observation is an industry-prefecture-year combination. The constant term is included but not reported. A full set of two-digit industry effects and province effects interacted with years effects are also included. Standard errors clustered at the industry-year level are reported in parentheses. *** significant at 1 percent; ** significant at 5 percent; * significant at 10 percent.
Table 7.
DID estimation results for regions (number of firms).
| Log(Number of Firms) | North Coastal | North Eastern | East Coastal | South Coastal | Central | South western | North Western |
|---|---|---|---|---|---|---|---|
| TCZ | 0.0473 | −0.0485 | −0.0429 | 0.285 *** | 0.0630 | 0.0330 | −0.0427 |
| (0.0618) | (0.0654) | (0.0934) | (0.0827) | (0.0418) | (0.0715) | (0.0732) | |
| Pollution | −0.716 * | −0.611 ** | 1.271 *** | 0.212 | −0.658 *** | −0.750 *** | −0.852 ** |
| (0.376) | (0.290) | (0.480) | (0.466) | (0.235) | (0.284) | (0.345) | |
| Pollution *TCZ | −0.0431 | −0.0338 | −0.381 *** | −0.426 *** | 0.0920 | 0.0659 | 0.133 |
| (0.105) | (0.0993) | (0.138) | (0.135) | (0.0663) | (0.0938) | (0.107) | |
| Log (GDP_1) | 0.693 *** | 0.331 *** | 0.743 *** | 0.662 *** | 0.705 *** | 0.782 *** | 0.558 *** |
| (0.0848) | (0.0724) | (0.0881) | (0.0510) | (0.0646) | (0.0815) | (0.0737) | |
| Log(population) | 0.364 *** | 0.470 *** | 0.123 | −0.0798 | 0.0468 | 0.0486 | 0.263 *** |
| (0.116) | (0.109) | (0.162) | (0.0655) | (0.0817) | (0.0983) | (0.0669) | |
| Log(area) | 0.00935 | −0.0576 | 0.111 | 0.146 *** | 0.0292 | −0.00451 | −0.0801 ** |
| (0.0726) | (0.0678) | (0.0970) | (0.0444) | (0.0384) | (0.0488) | (0.0407) | |
| Agriculture/GDP | −0.00430 | −0.0106 *** | −0.0319 *** | −0.0327 *** | 0.00213 | −0.00815 * | −0.00343 |
| (0.0072) | (0.0040) | (0.0078) | (0.0042) | (0.0033) | (0.0047) | (0.0050) | |
| Observations | 10,315 | 10,113 | 8525 | 10,241 | 24,815 | 11,512 | 8457 |
| R-squared | 0.461 | 0.321 | 0.500 | 0.367 | 0.371 | 0.333 | 0.302 |
Notes: An observation is an industry-prefecture-year combination. The constant term is included but not reported. A full set of two-digit industry effects and province effects interacted with years effects, are also included. Standard errors clustered at industry-year level are reported in parentheses. *** significant at 1 percent; ** significant at 5 percent; * significant at 10 percent.
Table 8.
DID estimation results for regions (number of new firms).
| Log(Number of New Firms) | North Coastal | North Eastern | East Coastal | South Coastal | Central | South Western | North Western |
|---|---|---|---|---|---|---|---|
| TCZ | 0.0662 | −0.0789 | 0.124 * | 0.159 ** | −0.0327 | 0.0566 | −0.0424 |
| (0.0560) | (0.0546) | (0.0736) | (0.0638) | (0.0334) | (0.0538) | (0.0636) | |
| Pollution | 0.120 | −0.0835 | 0.849 *** | 0.0962 | −0.413 * | −0.401 *** | 0.0799 |
| (0.0855) | (0.214) | (0.199) | (0.0918) | (0.223) | (0.0719) | (0.249) | |
| Pollution *TCZ | −0.120 | −0.0494 | −0.411 *** | −0.153 | 0.0693 | −0.00450 | 0.0322 |
| (0.0855) | (0.0758) | (0.0999) | (0.109) | (0.0463) | (0.0639) | (0.0799) | |
| Log(GDP_1) | 0.170 ** | 0.0211 | 0.450 *** | 0.179 *** | 0.155 *** | 0.228 *** | −0.00520 |
| (0.0766) | (0.0546) | (0.0760) | (0.0427) | (0.0523) | (0.0642) | (0.0683) | |
| Log(population) | 0.308 *** | 0.242 *** | 0.00817 | −0.0292 | 0.0480 | −0.0375 | −0.0477 |
| (0.0969) | (0.0783) | (0.128) | (0.0571) | (0.0630) | (0.0723) | (0.0619) | |
| Log(area) | 0.104 | −0.0689 | −0.0770 | 0.0695 * | 0.0338 | 0.0572 * | 0.0747 ** |
| (0.0656) | (0.0444) | (0.0761) | (0.0357) | (0.0277) | (0.0318) | (0.0342) | |
| Agriculture/GDP | 0.00654 | −0.00367 | 0.0248 *** | −0.00808 ** | 0.00186 | −0.000366 | −0.00620 |
| (0.00688) | (0.00317) | (0.00658) | (0.00370) | (0.00269) | (0.00365) | (0.00481) | |
| Observations | 4419 | 2942 | 3605 | 3726 | 7212 | 2781 | 1167 |
| R-squared | 0.343 | 0.271 | 0.374 | 0.195 | 0.250 | 0.286 | 0.282 |
Notes: An observation is an industry–prefecture–year combination. The constant term is included but not reported. A full set of two-digit industry effects and province effects interacted with years effects, are also included. Standard errors clustered at industry-year level are reported in parentheses. *** significant at 1 percent; ** significant at 5 percent; * significant at 10 percent.
Table 9.
DID regression results (comparison over time).
| 2001–2005 (The 10th Five-Year Plan) | 2006–2009 (The 11th Five-Year Plan) | |||||
|---|---|---|---|---|---|---|
| (1) | (2) | (3) | (4) | (5) | (6) | |
| Log(Sales Value/GDP) | Log(No. of Firms) | Log(No. of New Firms) | Log(Sales Value/GDP) | Log(No. of Firms) | Log(No. of New Firms) | |
| TCZ | 0.139 *** | 0.0766 *** | 0.0528 ** | 0.150 *** | 0.125 *** | 0.0582 ** |
| (0.0443) | (0.0261) | (0.0218) | (0.0421) | (0.0291) | (0.0267) | |
| Pollution | −1.176 *** | −0.306 ** | 0.0531 | −0.387 | −0.315 ** | 0.00379 |
| (0.205) | (0.129) | (0.179) | (0.236) | (0.154) | (0.197) | |
| Pollution *TCZ | −0.121 * | −0.0902 ** | −0.103 *** | −0.127 ** | −0.130 *** | −0.141 *** |
| (0.0658) | (0.0397) | (0.0310) | (0.0646) | (0.0436) | (0.0401) | |
| Log(GDP_1) | 0.195 *** | 0.723 *** | 0.191 *** | 0.0685 | 0.705 *** | 0.214 *** |
| (0.0506) | (0.0321) | (0.0257) | (0.0497) | (0.0361) | (0.0315) | |
| Log(population) | −0.0500 | 0.0618 | 0.00980 | 0.107 * | 0.128 *** | 0.0808 ** |
| (0.0633) | (0.0385) | (0.0320) | (0.0596) | (0.0420) | (0.0389) | |
| Log(area) | −0.119 *** | −0.00574 | 0.0491 *** | −0.114 *** | −0.0123 | −0.00332 |
| (0.0329) | (0.0195) | (0.0171) | (0.0333) | (0.0225) | (0.0211) | |
| Agriculture/GDP | −0.00908 *** | −0.00646 *** | 0.000111 | −0.00310 | −0.000588 | 0.00512 ** |
| (0.00315) | (0.00185) | (0.00161) | (0.00378) | (0.00262) | (0.00238) | |
| Observations | 32,758 | 41,512 | 13,468 | 35,154 | 35,197 | 10,915 |
| R-squared | 0.338 | 0.364 | 0.229 | 0.364 | 0.284 | 0.204 |
Notes: An observation is an industry-prefecture-year combination. The constant term is included but not reported. A full set of two-digit industry effects and province effects interacted with years effects, are also included. Standard errors clustered at the industry-year level are reported in parentheses. *** significant at 1 percent; ** significant at 5 percent; * significant at 10 percent.
Table 10.
PSM-DID regression results.
| (1) | (2) | (3) | |
|---|---|---|---|
| VARIABLES | Log(Sales Value/GDP) | Log(Number of Firms) | Log(Number of New Firms) |
| TCZ | 0.136 *** | 0.0945 *** | 0.0489 ** |
| (0.0410) | (0.0271) | (0.0226) | |
| Pollution | −0.953 *** | −0.326 ** | −0.773 ** |
| (0.203) | (0.156) | (0.324) | |
| Pollution *TCZ | −0.0830 | −0.0920 ** | −0.107 *** |
| (0.0636) | (0.0411) | (0.0334) | |
| Log(GDP_1) | 0.136 ** | 0.697 *** | 0.200 *** |
| (0.0528) | (0.0340) | (0.0290) | |
| Log(population) | 0.0524 | 0.125 *** | 0.0677 * |
| (0.0603) | (0.0394) | (0.0347) | |
| Log(area) | −0.131 *** | −0.0156 | 0.0124 |
| (0.0321) | (0.0209) | (0.0180) | |
| Agriculture/GDP | −0.00369 | −0.00433 ** | 0.00236 |
| (0.00340) | (0.00216) | (0.00184) | |
| Observations | 47,731 | 57,746 | 18,227 |
| R-squared | 0.358 | 0.556 | 0.296 |
Notes: An observation is an industry-prefecture-year combination. The constant term is included but not reported. A full set of two-digit industry effects and province effects interacted with years effects, are also included. Standard errors clustered at the industry-year level are reported in parentheses. *** significant at 1 percent; ** significant at 5 percent; * significant at 10 percent.
Table 11.
Summary results of the Placebo Test (100 runs).
| Log(Sales Value/GDP) | Log(Number of Firms) | Log(Number of New Firms) | |||||||
|---|---|---|---|---|---|---|---|---|---|
| Coeff. | p-value | SE | Coeff. | p-value | SE | Coeff. | p-value | SE | |
| mean value | −0.0369 | 0.3775 | 0.0601 | −0.0258 | 0.4050 | 0.0388 | −0.0060 | 0.4132 | 0.0299 |
Table 12.
Illustration of the DID model.
| Non-Polluting Industries | Polluting Industries | Difference | Remarks | |
|---|---|---|---|---|
| Non-TCZ | D1 | D2 | D2 − D1 | The difference is caused by the nature of the industry (i.e., polluting or not) in areas without TCZ policy |
| TCZ | D3 | D4 | D4 − D3 | The difference is caused by the nature of the industry (i.e., polluting or not) in TCZs |
| Change | D3 − D1 | D4 − D2 | (D4 − D3) − (D2 − D1) | Net policy effect due to the implementation of TCZ policy |
© 2017 by the authors. Licensee MDPI, Basel, Switzerland. This article is an open access article distributed under the terms and conditions of the Creative Commons Attribution (CC BY) license (http://creativecommons.org/licenses/by/4.0/).
Share and Cite
MDPI and ACS Style
Chen, B.; Cheng, Y.-s. The Impacts of Environmental Regulation on Industrial Activities: Evidence from a Quasi-Natural Experiment in Chinese Prefectures. Sustainability 2017, 9, 571. https://doi.org/10.3390/su9040571
AMA Style
Chen B, Cheng Y-s. The Impacts of Environmental Regulation on Industrial Activities: Evidence from a Quasi-Natural Experiment in Chinese Prefectures. Sustainability. 2017; 9(4):571. https://doi.org/10.3390/su9040571
Chicago/Turabian StyleChen, Bin, and Yuk-shing Cheng. 2017. "The Impacts of Environmental Regulation on Industrial Activities: Evidence from a Quasi-Natural Experiment in Chinese Prefectures" Sustainability 9, no. 4: 571. https://doi.org/10.3390/su9040571
Note that from the first issue of 2016, this journal uses article numbers instead of page numbers. See further details here.