Communication

Large-Scale Screening of Intact Tomato Seeds for Viability Using Near Infrared Reflectance Spectroscopy (NIRS)

1
International Technology Cooperation Center, RDA, Jeonju 54875, Korea
2
National Agrobiodiversity Center, National Institute of Agricultural Sciences, RDA, Jeonju 54874, Korea
*
Author to whom correspondence should be addressed.
Sustainability 2017, 9(4), 618; https://doi.org/10.3390/su9040618
Submission received: 21 December 2016 / Revised: 6 April 2017 / Accepted: 11 April 2017 / Published: 15 April 2017

Abstract

:
Near infrared reflectance spectroscopy (NIRS), a non-destructive and rapid analytical method, was used to examine the possibility of replacing a method for the large-scale screening of tomato seed viability. A total of 368 tomato seed samples were used for development and validation of an NIRS calibration model. The accelerating aging method (98 ± 2% R.H., 40 °C) was employed for preparation of a calibration set (n = 268) and a validation set (n = 100) with wider seed viability. Among the tomato NIRS calibration models tested, the modified partial least square (MPLS) regression produced the best equation model. Specifically, this model produced a higher RSQ (0.9446) and lower SEC (6.5012) during calibration and a higher 1-VR (0.9194) and lower SECV (7.8264) upon cross-validation compared to the other regression methods (PLS, PCR) tested in this study. Additionally, the SD/SECV was 3.53, which was greater than the criterion point of 3. External validation of this NIRS equation revealed a significant correlation between reference values and NIRS-estimated values based on the coefficient of determination (R2), the standard error of prediction (SEP (C)), and the ratio of performance to deviation (RPD = SD/SEP (C)), which were 0.94, 6.57, and 3.96, respectively. The external validation demonstrated that this model had predictive accuracy in tomato, indicating that it has the potential to replace the germination test.

1. Introduction

Seeds are essential to the life cycle of most flowering plants and provide a means for survival in unfavorable environments. The characteristics of seeds are a result of adaptation to native habitats; therefore, they are important genetic resources for subsequent generations. Seed aging or deterioration, which commences during physiological maturation and continues during harvest, processing, and storage, is a well-known cause of decreased vigor and viability. Seed deterioration is a major problem in gene banks, and, owing to a number of factors, seeds may die during prolonged dry storage. For example, macromolecules such as nucleic acids, membrane components, and enzymes might become damaged, the structural integrity of the membrane might be lost, and organelles might become damaged and/or fail to differentiate into functional structures [1]. The methods most widely used for the assessment of seed viability are the measurement of the germination percentage or seedling growth rate and biochemical tests such as tetrazolium staining or leachate conductivity [2]. However, these tests have certain difficulties such as time consumption, manual labor, the need of bulk, and highly destructive techniques.
NIRS is a technology based on the absorption of near infrared light by organic compounds and water, which has been used in several applications for single seed analysis with notable success [3,4,5]. NIRS is also known to play a role in simplification of the analysis of chemical and physical properties without sample preparation. NIRS is based on the overtone and combination bands of specific functional groups, e.g., C–H, N–H, and O–H bands, which are the primary structural components of organic molecules [6]. NIRS has become as a powerful tool due to chemometrics. Indeed, NIRS is a rapid and nondestructive technology that does not require use of chemicals or reagents for estimation of the physical and chemical properties of samples. NIRS can assess several constituents at the same time; therefore, it is also efficient for mass-screening.
Most studies published to date have shown that NIRS can accurately estimate the content of several internal components of plants. However, this technique requires the use of chemometric tools, including preprocessing treatment and an assessment of calibration models for the extraction of the maximum amount of information that can be obtained by use of these techniques. NIRS has applications in the agricultural industry as well as many other fields, including food science, biological and biomedical areas, and the pharmaceutical, textile, cosmetic, and chemical industries [7]. Recently, NIRS is applied to discriminate normal seed in radish [8] and wheat [9]. Moreover, this technique has been applied for nondestructive classification of viable and empty seeds of Pinus plata seeds [10] and Raphanus sativus seeds [11]. Similarly, studies on application of NIRS to prediction of seed viability have also been reported [12,13]. The present study was conducted to analyze the feasibility of using NIRS for prediction of tomato seed viability and to develop a reliable equation for its calibration.

2. Materials and Methods

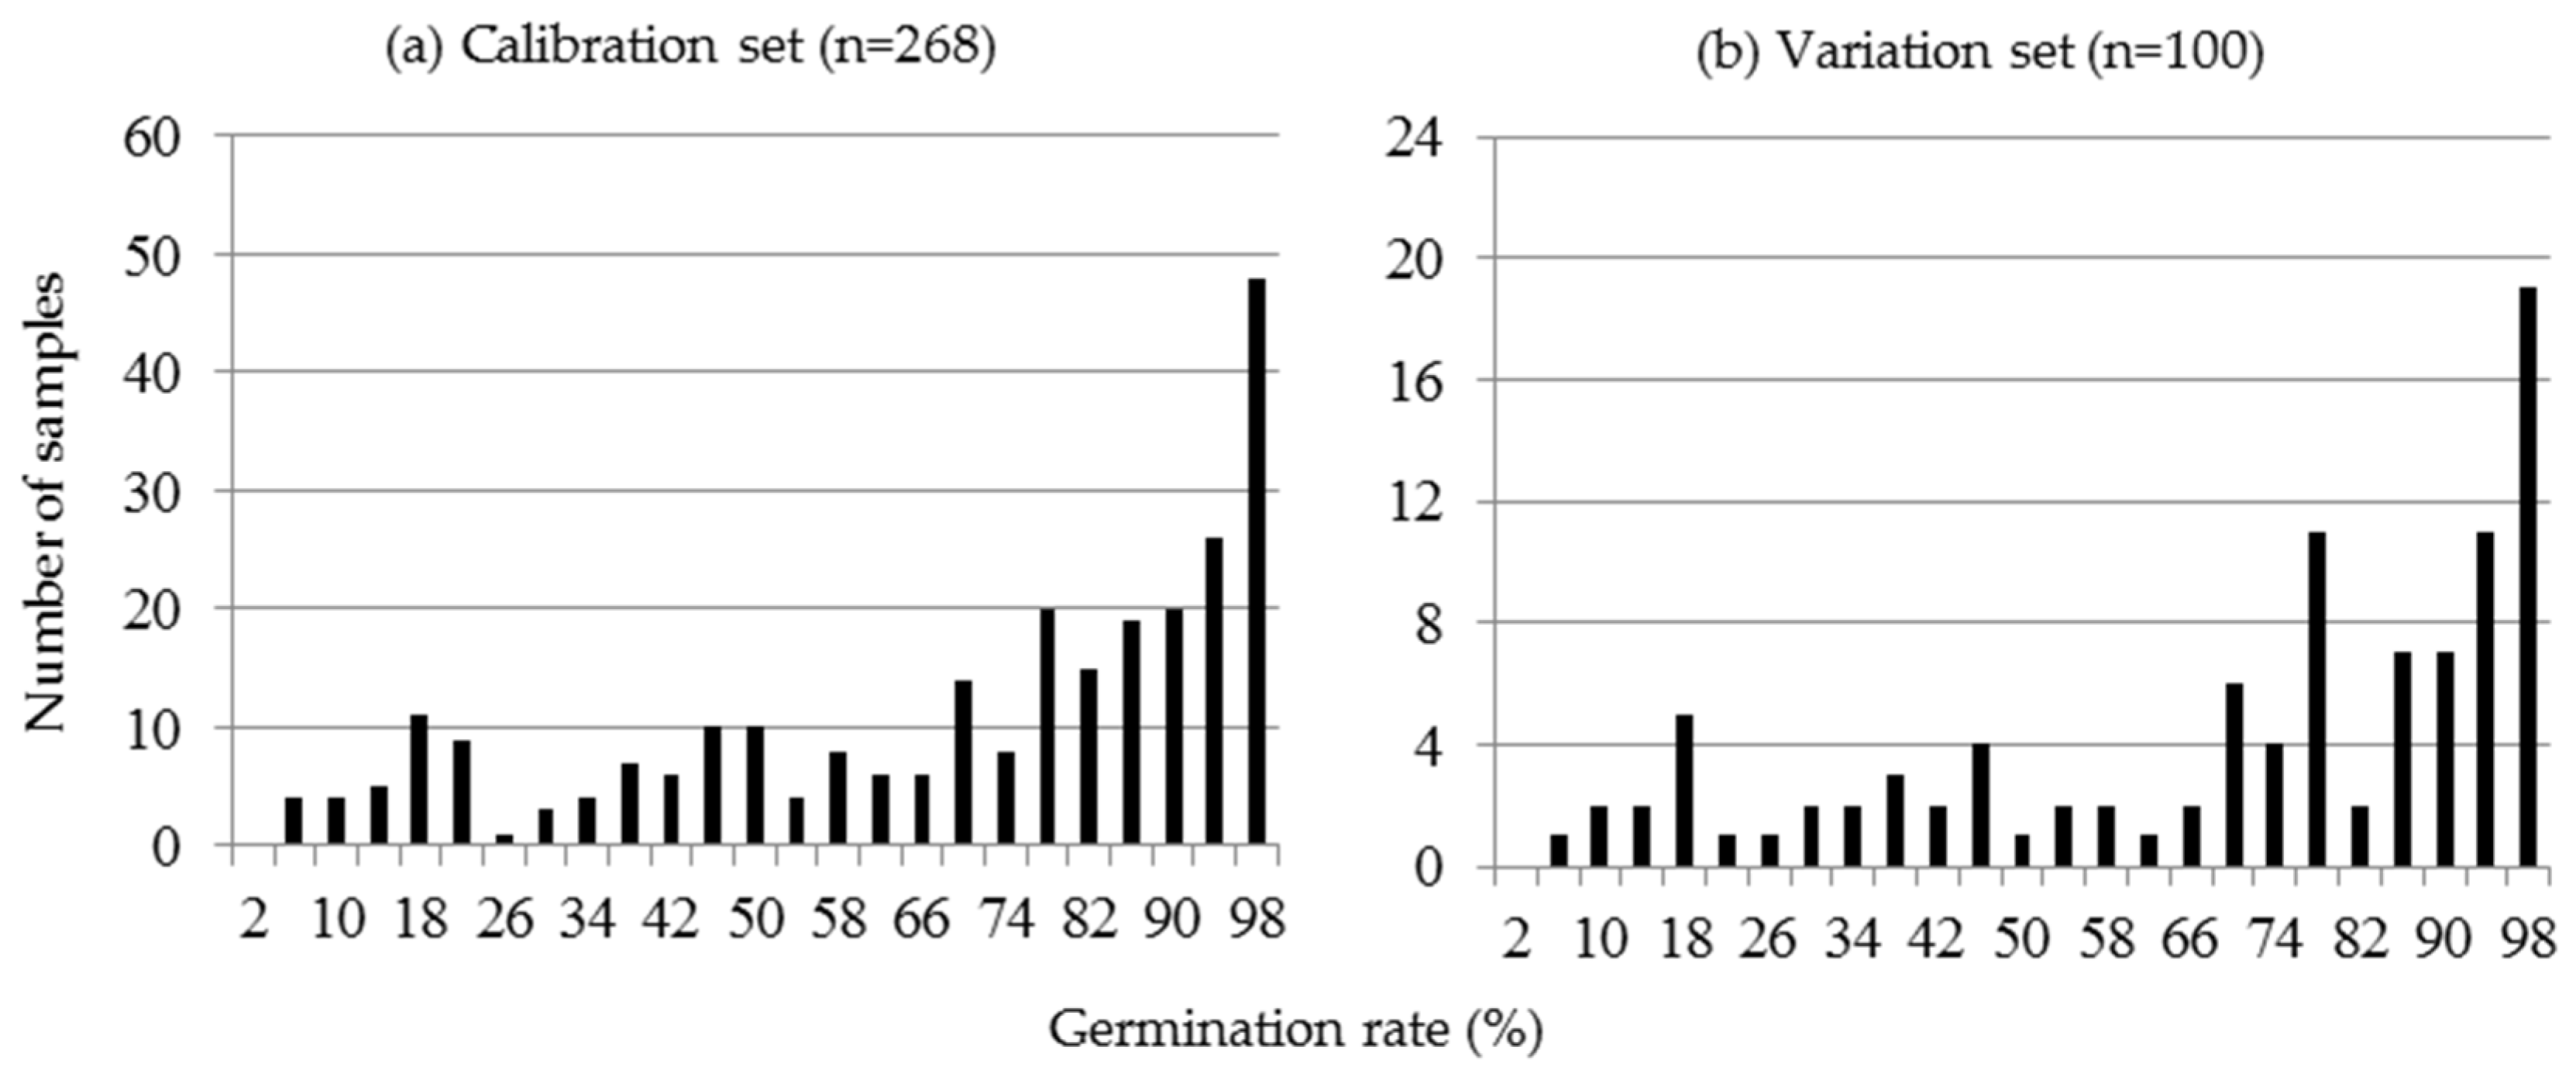
2.1. Preparation of the Calibration Set and Prediction Set by AAT

Eight tomato (Lycopersicon esculentum MILL.) cultivars—Super-Gold (Sejong, Korea), Super-King (Sejong, Korea), Jicored (Jicored (Gana seed co., Gwangju, Korea)), Betatiny (Yeosu, Korea), Tenten (Koregon, Korea), Nate (Sejong, Korea), Yellow-Naver (Sejong, Korea), and Super-Dotaerang (Koregon, Korea)—were purchased from various seed companies. Accelerated aging treatment (AAT) was used as an artificial aging method for the construction of a calibration set and a validation set with diverse seed viability. The seeds were spread in a single layer on the surface of a bronze wire mesh seed holder above 40 mL (1 cm deep) of de-ionized water in plastic boxes (11 × 11 × 4 cm), which were then covered tightly with lids and placed in an aging chamber. In order to obtain a population with a broad germination percentage range, seed samples were exposed to AAT at 40 °C and 98 ± 2% relative humidity for 0–26 days. Times were selected for each cultivar according to results of preliminary experiments (not shown here). At each aging time, 100 seeds and four replications were prepared for NIRS analysis after thoroughly rinsing with de-ionized water for removal of fungal outgrowth and surface-drying using a hair dryer for 10 min in order to control the seed moisture content (SMC) at 7–8%. Untreated seeds were served as a high viability class and the accelerated aging reduced the overall germination capacity.

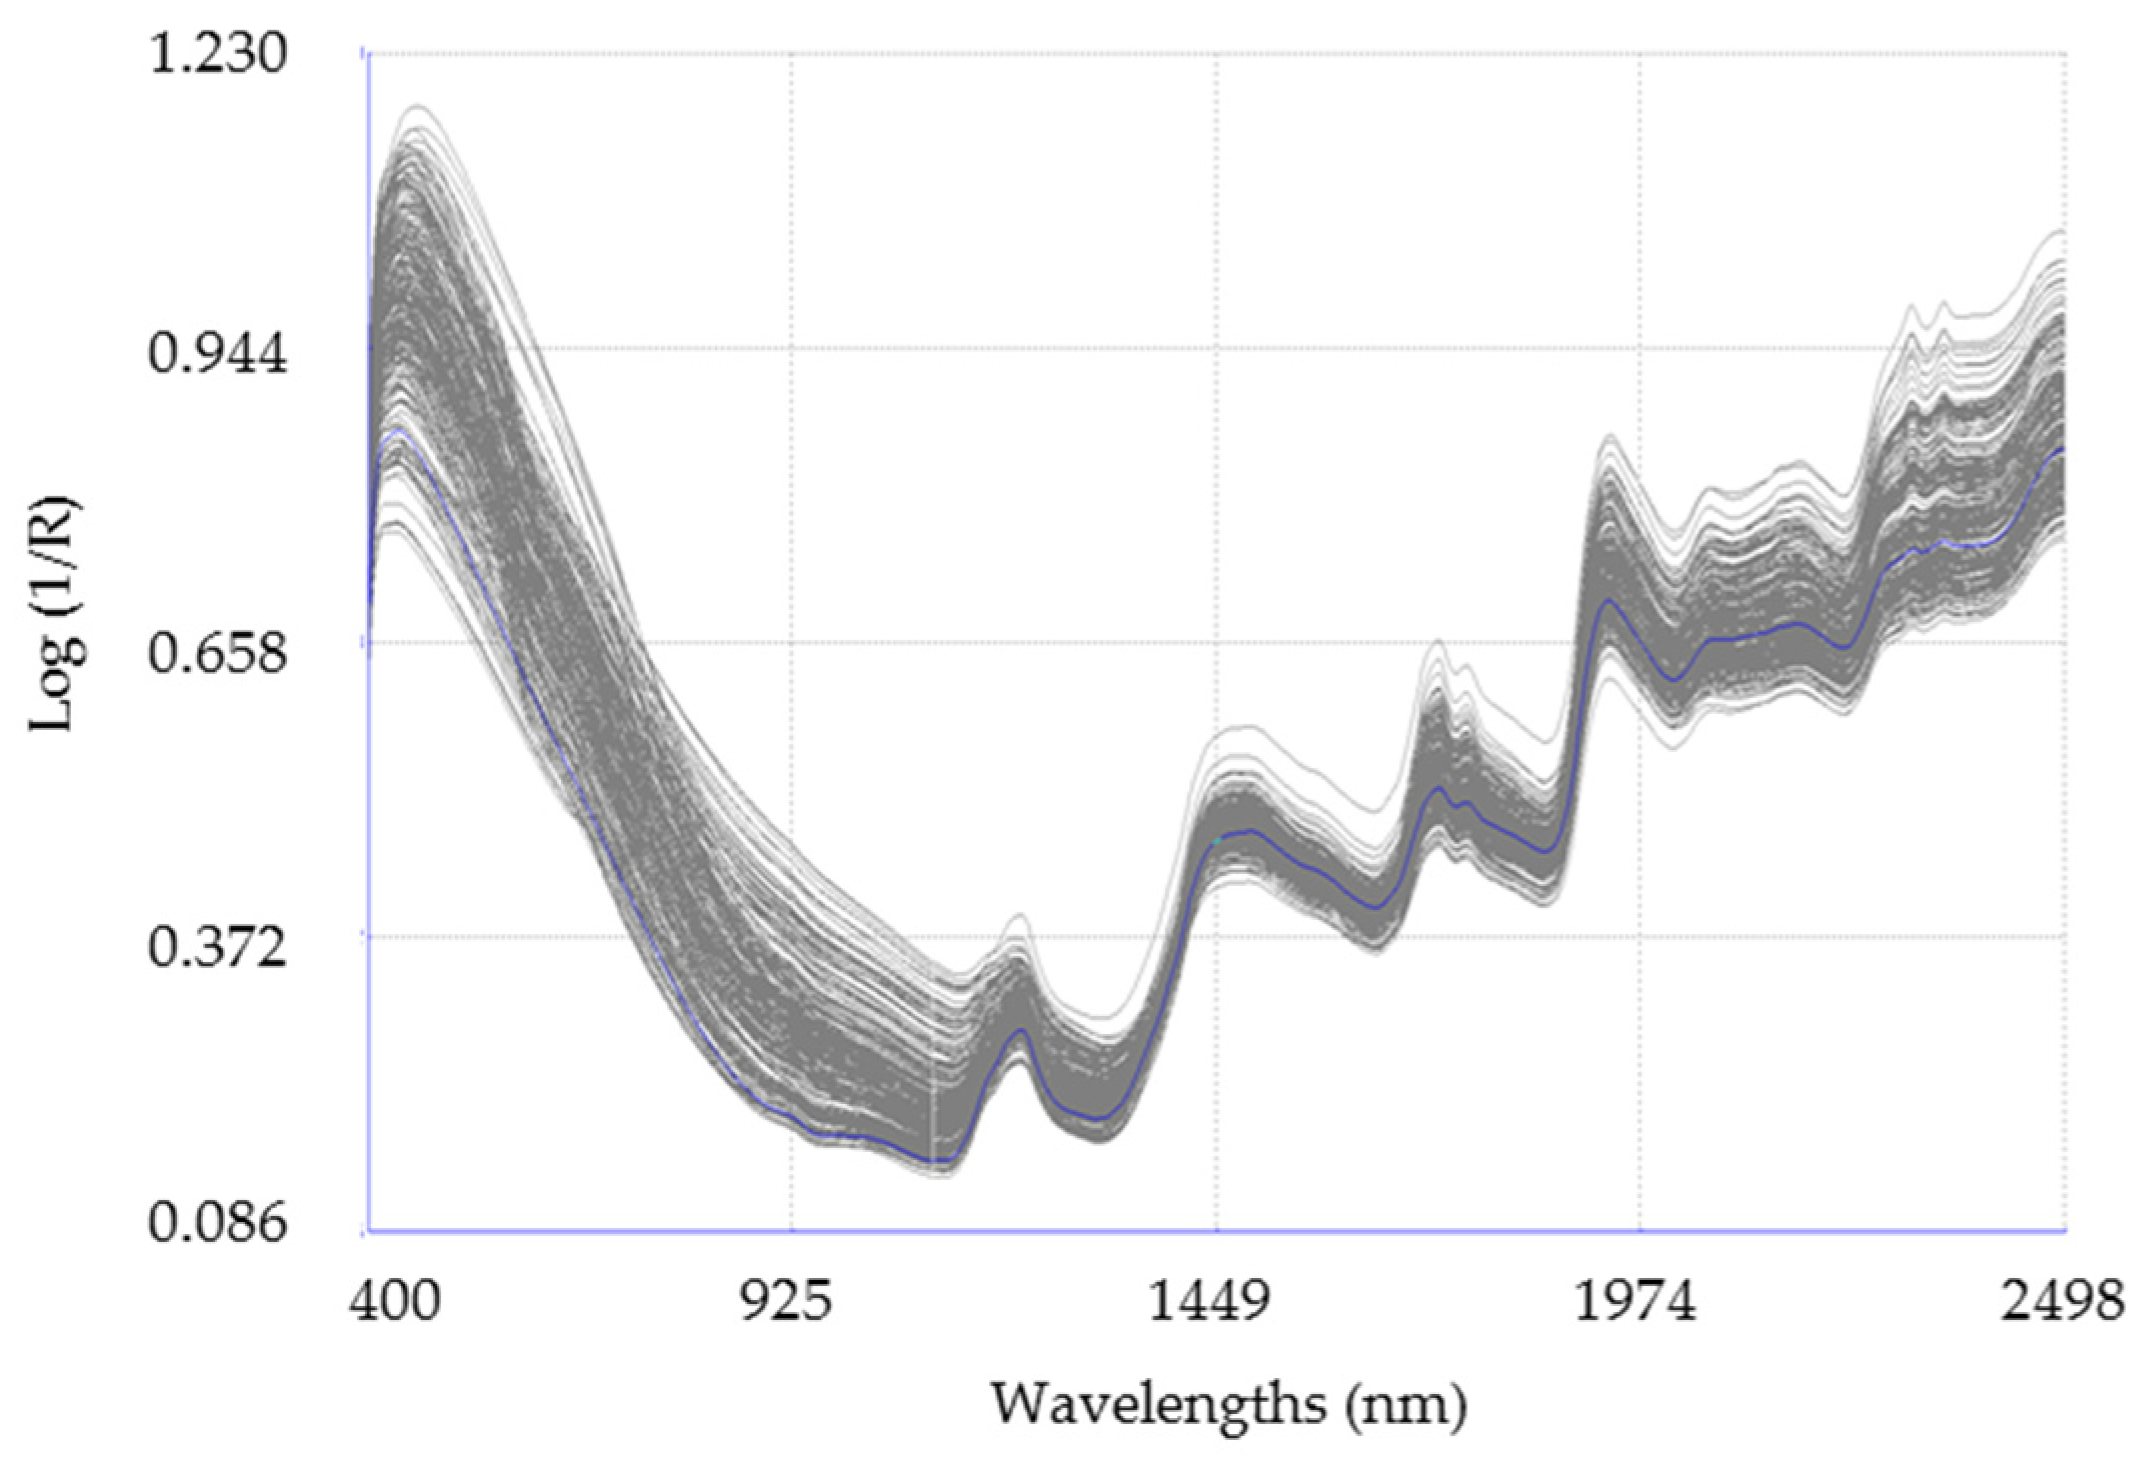
2.2. Collection NIRS Data

A total of 560 samples (100 seeds per sample) that had been subjected to AAT were scanned by NIRSystems model XD spectrophotometer (Foss-NIRSystems, Silver Spring, MD, USA) in reflectance mode. Among these, 268 samples for the calibration set and 100 samples for external validation were selected to check the even distribution of germination rates. The samples were then scanned on a round cup (outer diameter 5 cm, inner diameter 3.5 cm) with a quartz window in the same NIRSystem with a spinning module and their average spectra were recorded as individual files at 2 nm intervals in the 400–2500 nm wavelength range. The manipulation, collection, mathematical processing, and statistical analysis of NIRS data were performed using the ISI Windows Software (Eden Prairie, MN, USA).

2.3. Germination Test

The reference value for the seed viability was measured by determining the germination rate of accelerated-aging-treated seeds placed in Petri dishes and then incubated at 20 °C for 16 h/30 °C for 8 h under dark conditions for 14 days.

2.4. Development and Cross-Validation of the NIRS Calibration Model

WINISI III software (v.1.50) (Eden Prairie, MN, USA) was used to compute the parameters of NIRS for the calibration equation. A calibration equation for screening seed viability in tomato was developed from a calibration set (n = 268). Various mathematical treatments using the raw optical spectrum (log 1/R, where R is reflectance), or first or second derivatives of the 1/R data, were applied for calibration equation development. For example, in 1,4,4,1, the first number 1 indicates the order of the derivative (1, is the first derivative of log 1/R), the second number 4 is the gap in data points over which the derivative was calculated, and the third and fourth numbers as 4 and 1, represent the number of data points used in the first and second smoothings, respectively. These parameters in the mathematical processing were sought through trial and error in order to maximize the coefficient determination during cross validation (1-VR) and to minimize the stand error of cross validation (SECV). In addition, standard normal variate and detrend transformations (SNV-DT) were used for correction of baseline offset due to scattering effects from differences in particle size among samples. The calibration equation was also optimized by removal of outliers for samples using the following criteria: samples with large residual values (the difference between the predicted and the actual values), T-outliers (T > 2.5), and GH-outliers (H > 3). Before calibration, spectral variation was analyzed by principal component analysis (PCA) to eliminate defective spectral outliers.
In order to correlate the spectral data with the reference data, modified partial least-squares (MPLS) regression using wavelengths of the entire visible (400–1100 nm) and near-infrared (1100–2500 nm) regions at every 2 nm was used. A trimmed spectrum including only the near infrared range was tested against the entire spectrum. In addition to MPLS, partial least squares (PLS) regression and principal component regression (PCR) were also tested for determination of the best calibration model. The calibration equation was then cross-validated using an internal validation set (25% of the total samples in a calibration set randomly selected by software) that included outliers removed from the calibration set. The calibration statistics used were the standard error of calibration (SEC), the coefficient of determination in calibration (RSQ), the standard error of cross-validation (SECV), and the coefficient of determination in cross-validation (1-VR). The SECV was used to determine the best number of independent variables for the calibration equation. In addition, SD/SECV was calculated as a criterion for evaluation of the performance of calibrations [14].

2.5. External Validation of the NIRS Calibration Model

The predictive ability of the calibration equation was determined based on the coefficient of determination in external validation (R2) and standard error of prediction, corrected for bias, and the corrected standard error of prediction [SEP(C)]. The ratio of the standard deviation (SD) to the corrected SEP (C) of the validation samples [the ratio of performance to deviation, RPD, defined as SD/SEP (C)] was also used as a criterion for evaluation of the accuracy of the equations. The RPD statistic was used to provide a basis for standardizing the standard error of prediction (SEP (C)). The accuracy of the calibration in terms of RPD confirmed the precision of the equations developed as indicated by values greater than the minimum recommended for prediction (i.e., RPD over 3) according to Williams and Sobering [14].

3. Results

3.1. Preparation of the Calibration Set and Prediction Set by AAT

Seed samples (n = 368) treated with AAT were divided into 268 and 100 samples, and were then used for the calibration model and external validation, respectively. Samples were scanned and tested for prediction of the seed viability. Raw NIRS spectra of the 268 samples for calibration are shown in Figure 1. The germination rate (%) in the calibration set (n = 268) showed a relatively evenly distribution, from 5 to 100% (Figure 2a). The distribution of the germination rate (%) of the external validation set is shown in Figure 2b. In the calibration set, the mean, range, and SD of the germination rate were 70.1%, 5.0–100.0%, and 27.69%, respectively, while in the external validation set, these values were 70.9%, 8.0–100.0%, and 27.97%, respectively. The calibration set showed that the distribution of samples was more concentrated at higher germination rates. Nevertheless, the germination percentages for the calibration set were distributed throughout the range of germination and were sufficient to describe the variation in the range. Inclusion of a broad range of reference values is expected to increase the prediction accuracy; however, more data also results in an increased chance of adding atypical data [15]. In order to achieve a reliable prediction model for a target constituent, a broad range of reference values is needed to avoid predictions beyond those established by the calibration.

3.2. Development and Cross-Validation of the NIRS Calibration Model

Data obtained during development of NIRS models for seed viability are shown in Table 1. The MPLS regression model for the entire VIS/NIRS spectra range (400–2500 nm) using the first derivative transformation with scatter correction (SNVD) of raw reflectance yielded the best equation for seed viability, showing a higher RSQ (0.9446) and lower SEC (6.5012) upon calibration and a higher 1-VR (0.9194) and lower SECV value (7.8264) during cross-validation than the other regression methods (PLS, PCR) tested in this study. In addition, the SD/SECV was 3.53, which was above the criterion point of 3. These findings indicate a high correlation between calibration data and reference data based on the germination test.

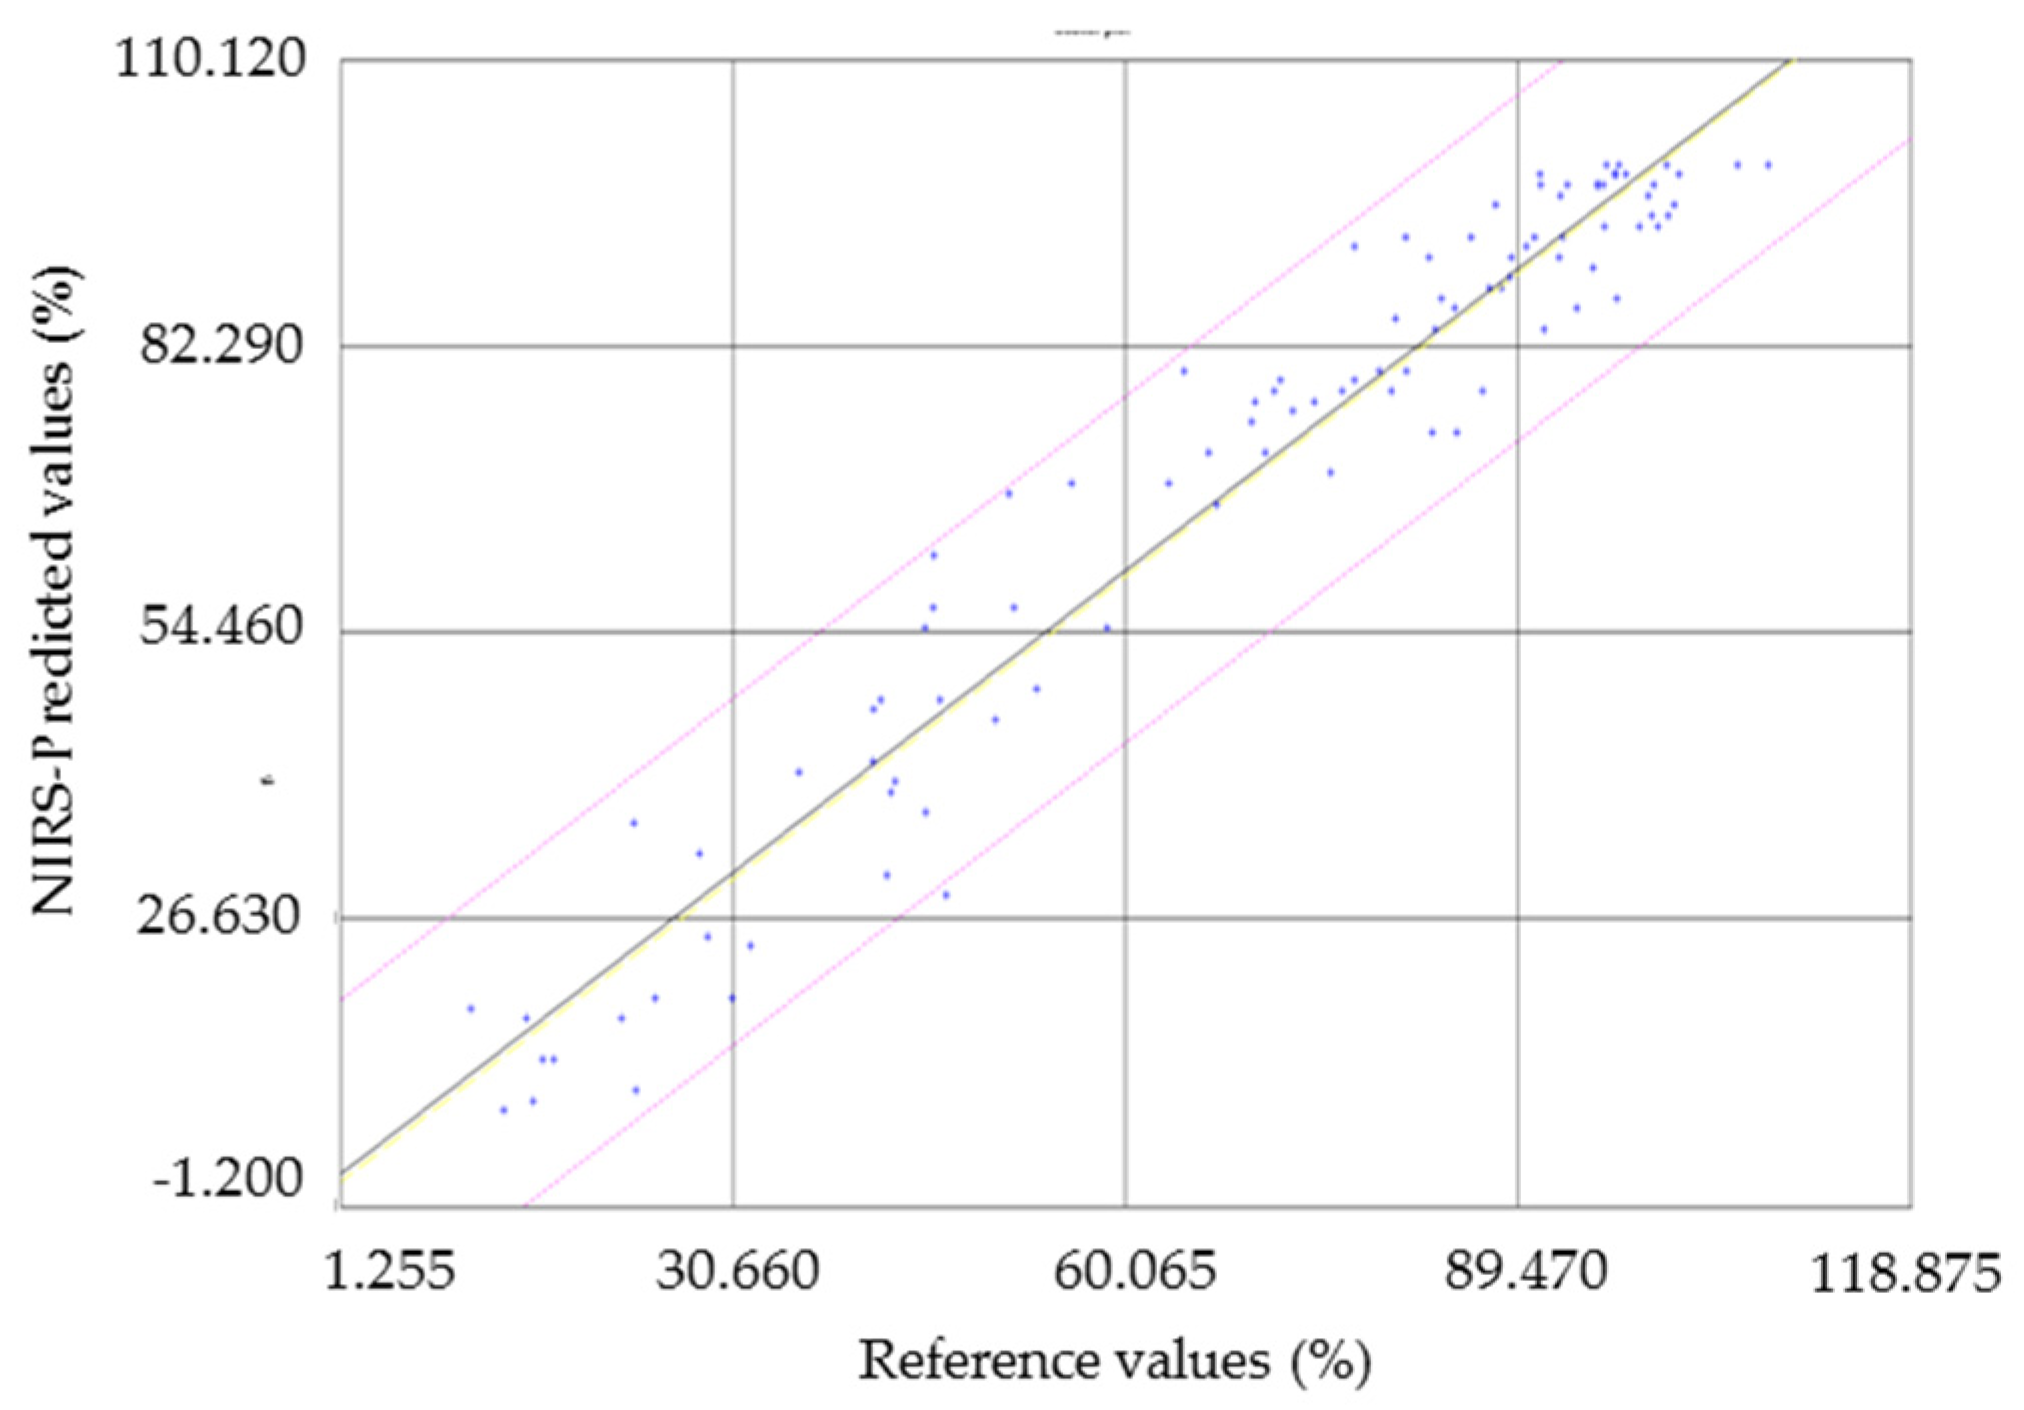
3.3. External Validation

The predictive accuracy of the calibration models developed by NIRS analysis was successfully tested through external validation using 100 samples. External validation statistics for prediction of seed viability in tomato are shown in Table 2. In addition to the reliability of the established calibration models, an accurate prediction can be made based on a lower SEP (C) and a higher R2 and RPD (>3) value. The R2 and RPD values for seed viability in tomato were 0.939 and 3.96, respectively, indicating a good correlation between reference values and NIRS-predicted upon the application of the calibration equation. Results for comparison of germination test data with values predicted using the calibration model for seed viability is shown in Figure 3.

4. Discussion

AAT, an artificial aging treatment, which was initially developed for evaluation of the storage potential of seed lots [16], has evolved into an indicator of seed vigor in many agricultural crops [17]. This treatment has recently been investigated as a tool for evaluating the efficacy of ex situ genetic resources conservation [18]. After proteomic analyses, the authors of [19] reported that similar molecular events accompanied artificial or natural seed aging. Specifically, they found that controlled aging treatment (CAT) at 45 °C and 60% R.H. strongly increased the extent of protein oxidation (carbonylation), which might induce a loss of functional properties of seed proteins and enzymes and enhance their susceptibility to proteolysis. In this study, AAT was used instead of natural aging for construction of a seed population with diverse seed viability.
Several theories have been suggested as basic causes of deterioration including lipid peroxidation, degradation of functional structures, an inability of ribosomes to dissociate, enzyme degradation and inactivation, the formation and activation of hydrolytic enzymes, the breakdown of mechanisms for triggering germination, genetic degradation, the depletion of food reserves, the starvation of meristematic cells, and the accumulation of toxic compounds [1]. As shown in Table 1, these internal changes occurring during the deterioration process could be detected by use of NIRS and chemometric methods. This high correlation of NIRS data with reference data implies that NIRS can be used for the prediction of the seed viability of tomatoes. It will be interesting to determine whether this calibration model can be applied to the prediction of the viability of seeds stored in soils or gene banks. Nonetheless, the results of this study showed that it is possible to monitor seed viability based on NIRS data with high reliability and reproducibility, indicating that the NIRS method could replace conventional germination tests.
There have been many reports on application of NIRS for prediction of seed viability; however, all of these studies concentrated on discriminative analyses of viable and non-viable seeds using a single seed [12,13]. To date, no studies have investigated prediction of tomato seed viability or whether it is worth replacing the germination test. This is the first report on an NIRS calibration model developed for quantitative estimation of tomato seed viability. The results indicate that the calibration model obtained from this experiment could be applicable for a predictive assessment of the seed viability of tomato cultivars. However, the achieved results were different to that of [20], in which the discrimination of non-viable seed from viable seed by NIRS was not possible, perhaps due to the difference in methods (heat and frost damage) used to induce pretreatment and classification of seeds.
In general, multivariate analysis using dimension reduction methods such as PCA has been employed for discrimination of the qualitative traits of samples. A calibration method developed using regression methods such as MPLS, PLS, and PCR was used for determination of quantitative traits. Seed viability is a quantitative characteristic and can therefore be determined using regression methods. In this way, the authors of [21] applied NIRS to detect of viable and nonviable field scot pine seeds by differences of drying rate. Additionally, the authors of [22] studied nondestructive evaluation for viability of watermelon seeds using FT-NIRS.

5. Conclusions

Calibration models are considered robust when the prediction accuracy is insensitive to unknown changes of external factors [23]. However, in this study, the calibration model was validated using seeds originating from the same batches as the calibration data set; accordingly, it is still necessary to determine whether the models are valid for different batches. Future studies should be conducted in order to investigate the development of wider and more robust calibration models for variable tomato seed batches from different environments or heredity. AAT has been investigated as a tool for testing seed vigor in many agricultural crops and successfully applied in genebank. However, the authors of [20] reported the seed aging could be tracked by NIRS, but the non-viable seeds were not differentiable by conventional NIRS. However, the authors of [12,13] reported the NIRS could still be used for classification of viable and non-viable seeds. Further research can be done using chemical and imaging technologies, and the application of NIRS for prediction of the viability of seeds requires an assessment of the robustness of the calibration model across variable seed accessions from different seed lots.

Acknowledgments

This study was carried out with the support of the “Research Program for Agricultural Science & Technology Development (Project No. PJ012040)” and was supported by the 2016 Postdoctoral Fellowship Program of the National Institute of Agricultural Sciences, Rural Development Administration, Republic of Korea.

Author Contributions

H.-S.L. conceived and designed the experiments and wrote the paper; Y.-A.J. and Y.-Y.L. performed the experiments; G.-A.L. and S.R. analyzed the data; K.-H.M. contributed materials. All authors read and approved the final manuscript.

Conflicts of Interest

The authors declare no conflict of interest.

References

  1. Copeland, L.O.; McDonald, M.B. Seed storage and deterioration. In Principles of Seed Science and Technology; Springer: Boston, MA, USA, 2001; pp. 192–230. [Google Scholar]
  2. Copeland, L.O.; McDonald, M.B. Seed viability and viability testing. In Principles of Seed Science and Technology; Springer: Boston, MA, USA, 2001; pp. 124–139. [Google Scholar]
  3. Kusama, T.; Abe, H.; Kawano, S.; Iwamoto, M. Classification of normal and aged soybean seeds by discriminant analysis using principal component scores of near infrared spectra. J. Jpn. Soc. Food Sci. 1997, 44, 569–578. [Google Scholar] [CrossRef]
  4. Cogdill, R.P.; Hurburgh, C.R.; Rippke, G.R. Single-kernel maize analysis by near-infrared hyperspectral imaging. Trans. ASAE 2004, 47, 311–320. [Google Scholar] [CrossRef]
  5. Pearson, T.C.; Wicklow, D.T.; Maghirang, E.B.; Xie, F.; Dowell, F.E. Detecting aflatoxin in single corn kernels by transmittance and reflectance spectroscopy. Trans. ASAE 2001, 44, 1247–1254. [Google Scholar] [CrossRef]
  6. Cozzolino, D.; Kwiatkowski, M.J.; Parker, M.; Cynkar, W.U.; Dambergs, R.G.; Gishen, M.; Herderich, M.J. Prediction of phenolic compounds in red wine fermentations by visible and near infrared spectroscopy. Anal. Chim. Acta 2004, 513, 73–80. [Google Scholar] [CrossRef]
  7. McClure, W. Review: 204 years of near infrared technology: 1800–2003. J. Near Infrared Spectrosc. 2003, 11, 487–518. [Google Scholar] [CrossRef]
  8. Kang, W.S. Nondestructive Determination of Seed Viability by Optical Methods. Ph.D. Thesis, Daegu University, Daegu, Korea, 2008. [Google Scholar]
  9. Juhász, R.; Gergely, S.; Gelencsér, T.; Salgó, A. Relationship between nir spectra and rva parameters during wheat germination. Cereal Chem. J. 2005, 82, 488–493. [Google Scholar] [CrossRef]
  10. Tigabu, M.; Oden, P.C. Discrimination of viable and empty seeds of pinus patula schiede & deppe with near-infrared spectroscopy. New For. 2003, 25, 163–176. [Google Scholar]
  11. Min, T.G.; Kang, W.S. Nondestructive classification of viable and nonviable radish (Raphanus sativus L.) seeds using single near infrared spectroscopy. J. Hortic. Environ. Biotechnol. 2008, 49, 42–46. [Google Scholar]
  12. Olesen, M.H.; Shetty, N.; Gislum, R.; Boelt, B. Classification of viable and non-viable spinach (Spinacia oleracea L.) seeds by single seed near infrared spectroscopy and extended canonical variates analysis. J. Near Infrared Spectrosc. 2011, 19, 171–180. [Google Scholar] [CrossRef]
  13. Daneshvar, A.; Tigabu, M.; Karimidoost, A.; Oden, P.C. Single seed near infrared spectroscopy discriminates viable and non-viable seeds of juniperus polycarpos. Silva Fenn. 2015, 49, 1–14. [Google Scholar] [CrossRef]
  14. Williams, P.C.; Sobering, D.C. How Do We Do It: A Brief Summary of the Methods We Use in Developing near Infrared Calibration; Davis, A.M.C., Williams, P.C., Eds.; NIR Publications: Chichester, UK, 1996. [Google Scholar]
  15. Lin, H.; Ying, Y. Theory and application of near infrared spectroscopy in assessment of fruit quality: A review. Sens. Instrum. Food Qual. Saf. 2009, 3, 130–141. [Google Scholar] [CrossRef]
  16. Delouche, J.C.; Baskin, C.C. Accelerated aging techniques for predicting the relative storability of seed lots. Seed Sci. Technol. 1973, 1, 427–452. [Google Scholar]
  17. Copeland, L.O.; McDonald, M.B. Seed vigor and vigor tests. In Principles of Seed Science and Technology; Springer: Boston, MA, USA, 1999; pp. 153–180. [Google Scholar]
  18. Probert, R.J.; Daws, M.I.; Hay, F.R. Ecological correlates of ex situ seed longevity: A comparative study on 195 species. Ann. Bot. 2009, 104, 57–69. [Google Scholar] [CrossRef] [PubMed]
  19. Rajjou, L.; Lovigny, Y.; Groot, S.P.; Belghazi, M.; Job, C.; Job, D. Proteome-wide characterization of seed aging in arabidopsis: A comparison between artificial and natural aging protocols. Plant Physiol. 2008, 148, 620–641. [Google Scholar] [CrossRef] [PubMed]
  20. Agelet, L.E.; Ellis, D.D.; Duvick, S.; Goggi, A.S.; Hurburgh, C.R.; Gardner, C.A. Feasibility of near infrared spectroscopy for analyzing corn kernel damage and viability of soybean and corn kernels. J. Cereal Sci. 2012, 55, 160–165. [Google Scholar] [CrossRef]
  21. Lestander, T.A.; Oden, P.C. Separation of viable and non-viable filled scots pine seeds by differentiating between drying rates using single seed near infrared transmittance spectroscopy. Seed Sci. Technol. 2002, 30, 383–392. [Google Scholar]
  22. Lohumi, S.; Mo, C.; Kang, J.-S.; Hong, S.-J.; Cho, B.-K. Nondestructive evaluation for the viability of watermelon (citrullus lanatus) seeds using fourier transform near infrared spectroscopy. J. Biosyst. Eng. 2013, 38, 312–317. [Google Scholar] [CrossRef]
  23. Nicolaï, B.M.; Beullens, K.; Bobelyn, E.; Peirs, A.; Saeys, W.; Theron, K.I.; Lammertyn, J. Nondestructive measurement of fruit and vegetable quality by means of nir spectroscopy: A review. Postharvest Biol. Technol. 2007, 46, 99–118. [Google Scholar] [CrossRef]
Figure 1. Raw NIRS spectra of 268 seed samples treated with accelerated aging (at 40 °C and 98 ± 2% R.H.).
Sustainability 09 00618 g001
Figure 2. Histograms describing the distribution of germination rate in the accelerated-aging-treated seed samples used for the calibration equation (a) and the prediction (b). The test for seed viability was performed 14 days after placing the seeds in Petri dishes.
Sustainability 09 00618 g002
Figure 3. Scatter plots of the values predicted using an equation developed from NIRS data versus the actually analyzed reference values for seed germination rate in the external validation set (n = 100) of accelerated-aging-treated seeds.
Sustainability 09 00618 g003
Table 1. Equations developed using regression models (MPLS, PLS, and PCR), scatter correction (SNV-DT) and math treatments for the NIRS prediction of seed viability in a calibration set (n = 268) of accelerated aging treated seeds.
Regressio Method zGH yMath TreatmentN xMean wSD vCalibration uCross-Validation t
SECRSQSECV1-VRSD/SECV
MPLS101,4,4,126070.5827.496.61190.94217.82910.91873.51
31,4,4,125670.7227.616.50120.94467.82640.91943.53
32,4,4,125570.9327.236.55150.94218.27290.90743.29
32,8,6,125670.6027.456.63740.94168.04040.91393.41
PLS101,4,4,126070.0627.687.73360.92208.58020.90363.23
31,4,4,125970.2027.657.79010.92068.72770.90013.17
32,4,4,125870.1627.328.63060.900210.1750.86082.69
32,8,6,125870.3827.527.94580.91679.29010.88572.96
PCR101,4,4,126269.8727.7113.05890.777913.06990.77692.12
31,4,4,126169.7627.7013.01640.779213.03230.77802.13
32,4,4,126069.9227.5912.81530.784313.12160.77332.10
32,8,6,125969.7027.5714.52490.722514.53530.72121.90
z MPLS: Modified partial least squares; PLS: Partial least squares; PCR: Principal component regression; y GH: Global H; x N: Number of samples; w Mean: Data measured by the germination test; v SD: Standard deviation; u SEC: Standard error of calibration; RSQ: Coefficient of determination in calibration; t SECV: Standard error of cross validation; 1-VR: Coefficient of determination in cross-validation; SD/SECV: Standard deviation/Standard error of cross validation.
Table 2. External validation statistics for predicting seed viability in eight tomato cultivars. The regression method used was MPLS.
GH zNMean (P)Mean (M)SD (P)SD (M)BiasSlopeR2SEPSEP (C)RPD
310070.8970.2628.1227.460.6260.9920.9396.936.573.96
z GH: Global H; N: Number of samples; Mean (P): Mean of data predicted using the calibration model; Mean (M): Mean of data measured by the germination test; SD (P): Standard deviation of data predicted using the calibration model; SD (M): Standard deviation of data measured by the germination test; Bias: Average difference between predicted and actual values; R2: Coefficient of determination in external validation; SEP: Standard error of prediction; SEP (C): Standard error of prediction (corrected for bias); RPD: Ratio of performance to deviation.

