1. Introduction
Improving the public transit system is an effective strategy to facilitate the development of green transportation, which attracts trip makers shifting from the use of private transport modes to the use of public transport modes [
1]. Constructing an indicator system to measure the performance of a public transit system provides a direction to improve public transit system. For example, an integrated cost benefit analysis framework was proposed to evaluate the effects of economic welfare and human capital accumulation by improving public transit services [
2]. Measuring the performance of a public transit system is a multidimensional problem. Commuters experience public transit service quality from three sources: transit route arrangement, equipment and performance of transit vehicles, and transit drivers’ attitude and behavior. These complex factors constitute a difficult task to measure the service quality of a transit system. Pternea et al. [
3] involved an air pollution indicator for developing a transit network design model. Aydin et al. [
4] evaluated the rail transit system using a customer satisfaction indicator. Zhang et al. [
5] developed a bus comfort model to evaluate bus transit performance. The model considers physical parameters of a bus and passengers’ perception. Verbich et al. [
6] evaluated urban public transit from the perspective of transit users (service quality), society (transit ridership per capita), and agency (financial viability).
Regarding spatial configuration, network-based public transit service provides a basis for modeling the comprehensive performance measurement of a public transit system. Derrible and Kennedy [
7] proposed three network design indicators by using an updated graph theory: coverage, directness, and connectivity. The main findings of this research reveal a significant correlation between the ridership and the three indicators, based on a case study of 19 subway systems worldwide. Coverage is a relatively simple concept derived by calculating the accessible area of a transit system. Gleason [
8] and Murray [
9] applied the location set-covering problem to evaluate transit accessibility. Murray [
10] developed a hybrid set-covering problem to evaluate the expansion of new transit stops and the corresponding increase in transit accessibility. Additionally, suitable service distance defines transit coverage in their set-covering models.
Derrible and Kennedy [
7] also defined the directness indicator of a public transportation system by referring to the concept of
π, explained by Kansky [
11] as a number that links the relationship between the circumference of a circle and its diameter. They analogized the total route length to the circumference of a circle and analogized the maximal number of transfers from any origin to any destination to the diameter.
Degree of centrality is a widely-used indicator for measuring the connectivity of a network. Freeman [
12] reviewed the concepts of point and graph centrality in social networks. Jiang and Claramunt [
13] introduced the centrality indicator to measure urban street networks. Guimera et al. [
14] analyzed air transportation networks worldwide and observed that the most connected cities were not necessarily the most central. The degree of centrality does not weight the quality of the node connections. Therefore, other centrality indicators were used. For example, Garroway et al. [
15] used eigenvector centrality to analyze landscape genetics; Crucitti et al. [
16] compared five distinct centrality measures in urban street applications, including degree, closeness, betweenness, straightness, and information. To account for transfer characteristics, Derrible and Kennedy [
7] used transfer opportunities to form a connectivity indicator. Park and Kang [
17] introduced transit line characteristics into the connectivity indicator. They defined the inbound and outbound connecting power of transit lines at transit stops (and stations), and included the transit line characteristics of capacity, speed, and length (distance from origin to a specific stop and distance from a specific stop to destination). Additionally, the connectivity indicator for a transit stop, a transfer center, a transit line, and a specific region were formulated. Mishra et al. [
18] extended the connectivity indicator framework proposed by Park and Kang [
17] and added activity density to reflect the characteristics of land use and transportation.
Lee et al. [
19] focused on the measurement of directness to represent public transit performance. Chowdhury et al. [
20] used connectivity indicator to compare public transit performance of different cities. Labelle [
21] initiated an idea of enhancing transit connectivity to improve mobility. Mamdoohi and Zarei [
22] applied connectivity indicator to measure transit performance in Tehran. Quintero-Cano et al. [
23] recognized coverage, connectivity, and directness can be used to measure public transit performance. Moreover, connectivity indicator was proposed to measure bus network performance. Huang and Levinson [
24] examined urban transit network using circuity indicator, which reflects directness and efficiency of the network.
The aforementioned studies advocated substantial progress in measuring network-based public transit performance. However, the indicators including coverage, connectivity, and directness were measured individually and were not integrated into an aggregate indicator to express the comprehensive performance of a public transit system. The present study revises the indicators proposed by Derrible and Kennedy [
7] and proposes an indicator integration model to measure network-based public transit performance. The preferential dependencies between indicators were considered, and a case study of Taipei City is also discussed to demonstrate the application of the integration model.
2. Methods
Indicator integration is a popular concept that has been applied in numerous fields. For example, Miller et al. [
25] used multicriteria analysis to aggregate livability indicators for initiating transportation improvement strategies. Shiau and Chuang [
26] applied SEEbalance (Social-Eco-Efficient) analysis to evaluate gravel transport sustainability and used the analytic hierarchy process (AHP) to aggregate sustainability indicators. Most multicriteria analysis methods used for integrating indicators are based on a central assumption: preferential independence. The AHP is a widely used multicriteria analysis method. Preferential independence is an inherent assumption in its additive utility decomposition form [
27,
28]. Examining the coverage, directness, and connectivity indicators proposed by Derrible and Kennedy [
7] to measure network-based public transit performance, transportation experts’ preferences in weighting indicators might violate the assumption of preferential independence. For example, grid bus lines were designed to reduce bus line circuity in Taipei City. Transportation experts observed that a substitution effect exists between the directness and connectivity indicators. Well-connected grid bus lines that provide convenient transfers can reduce commuter travel time. Therefore, bus commuters do not necessarily choose direct but circuit bus lines. Transportation experts have also observed that a complementary effect exists between the coverage and connectivity indicators. Well-connected and highly covered bus lines might create multiplier effects in attracting commuters to ride buses. Considering the likely substitution and complementary effects, the present study focuses on resolving preferential dependence in modeling indicator integration for measuring public transit performance.
2.1. The Analytical Framework
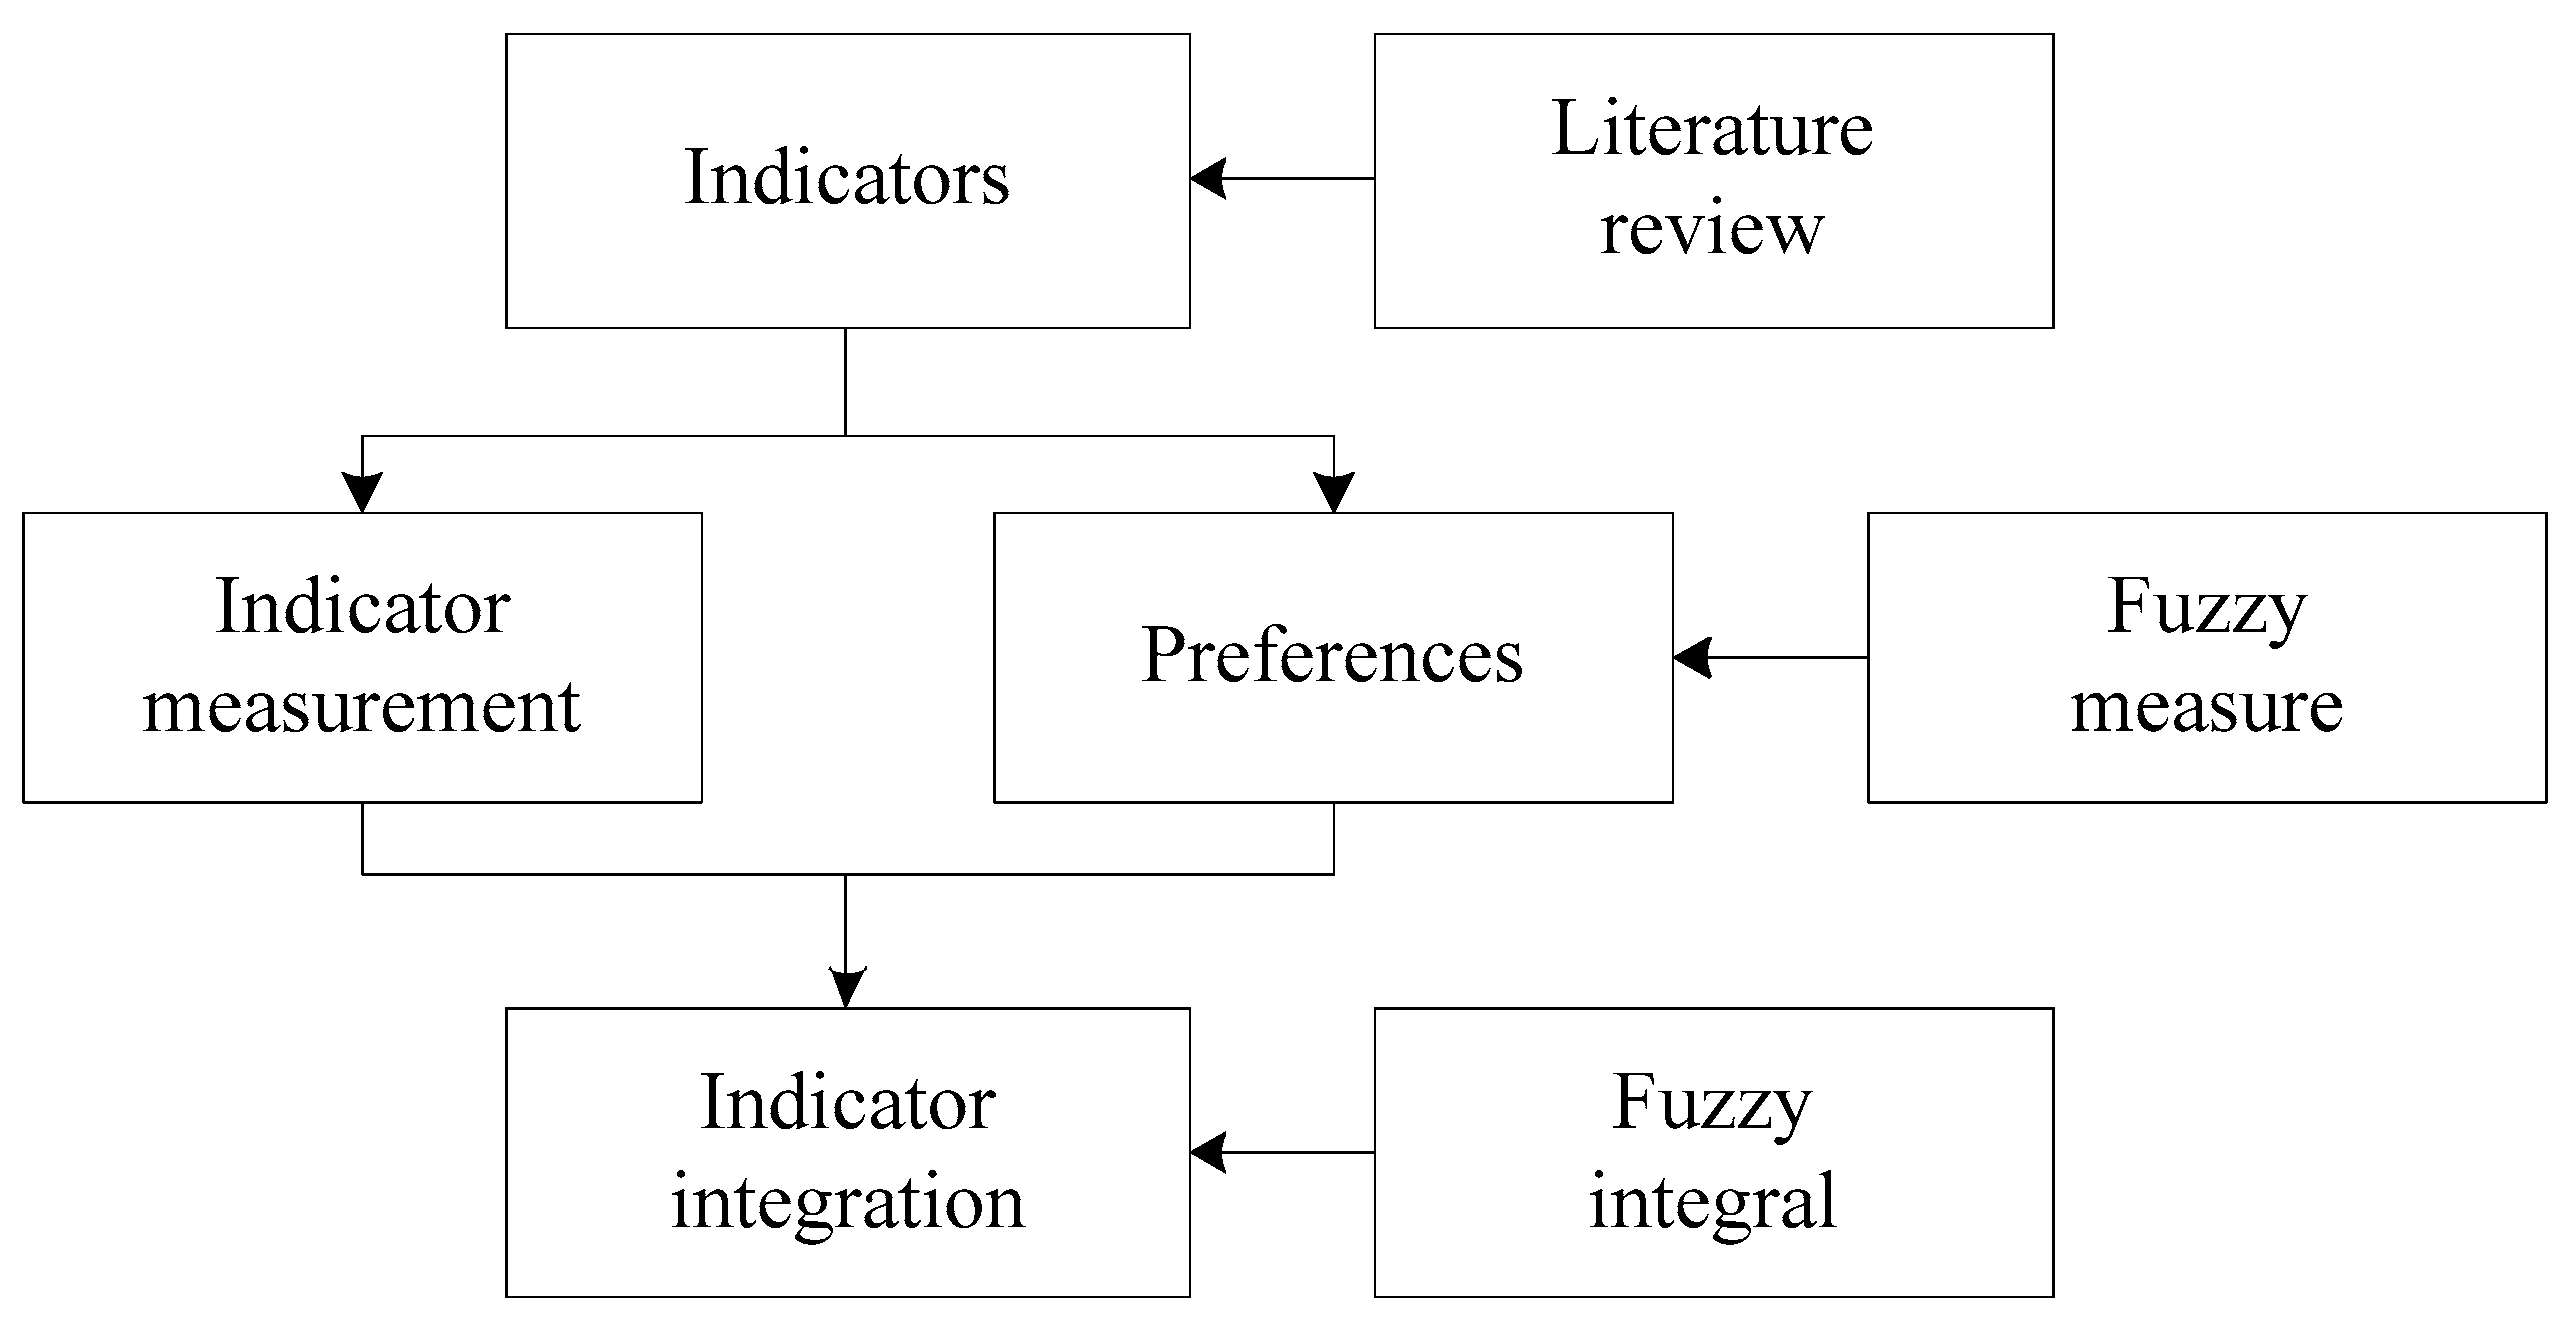
This study began by choosing the indicators by referring to the related literature. Subsequently, the measurement of indicators was reviewed and revised. Fuzzy measure was applied to elicit the preferences regarding the relative importance of the indicators. Moreover, fuzzy integral was used to integrate the indicators. Preferential dependence between the indicators could be solved by using the integration of fuzzy measure and fuzzy integral. The analytical framework is shown in
Figure 1.
2.2. Indicator Measurement
The measurements of coverage, directness, and connectivity indicators were based on relevant research conducted by Derrible and Kennedy [
7], Park and Kang [
17], and Mishra et al. [
18]. The details are described in the subsequent sections.
2.2.1. Coverage
The coverage indicator accounts for the accessible area of a public transit network. Derrible and Kennedy [
7] considered a 0.5 km radius as a threshold for the coverage area of a subway station and defined the coverage indicator by using Equation (1):
where
is the coverage,
is the service area of a subway network, and
is the number of stations. The coverage threshold of a subway station depends on the perception of users. Furthermore, the overlap of service area between two adjacent stations needs to be considered. Therefore, this study adjusted Equation (1) by considering the coverage area overlap and generalization of the radius threshold for a coverage area of a public transit station (and stop), as shown in Equation (2):
where
is the radius threshold for a coverage area of a public transit station (and stop) and
is the coverage area overlap.
2.2.2. Directness
Derrible and Kennedy [
7] defined the directness indicator by using Equation (3) to maintain the dimensionless ratio:
where
is the directness,
is the total length of a network,
is the maximal number of transfers required from any origin to any destination,
is the total number of lines of a network, and
is a segment of the average line length.
The present study defined the directness indicator as the accessible route length for one transfer by referring to Derrible and Kennedy [
7]. The definition of directness is clear and dimensionless is not necessary. Therefore, we maintained the original dimension, as shown in Equation (4):
2.2.3. Connectivity
Park and Kang [
17] defined the outbound and inbound connecting powers of transit line
l at transit stop
v by using Equations (5) and (6), respectively:
where
and
are the outbound and inbound connecting powers of transit line
l at transit stop
v, respectively;
is the daily capacity of transit line
l;
is the average speed of transit line
l;
and
are the distances from stop
v to the destination of transit line
l and the distance from the origin of transit line
l to stop
v, respectively; and
,
, and
are the scaling constants.
The connecting power of transit line
l at transit stop
v can be obtained by averaging the outbound and inbound connecting powers, as shown in Equation (7):
where
is the connecting power of transit line
l at transit stop
v.
Based on the connecting power of transit line
l at transit stop
v, the connectivity index of transit stop
v was defined as Equation (8):
where
is the connectivity index of transit stop
v;
is a dummy variable that receives 1 if transit stop
v is served by transit line
l, and 0 otherwise; and
is the set of transit lines.
The connectivity index of transit line
l, denoted by
and the connectivity index of area
R, denoted by
can also be defined using Equations (9) and (10), respectively:
where
is the set of transit stops that transit line
l serves,
refers to the number of transit stops that transit line
l serves, and
is the original stop of transit line
l:
where
is the set of transit stops in area
R and
is a scaling constant.
Mishra et al. [
18] redefined the outbound and inbound connecting power of transit line
l at transit stop
v by incorporating an activity density variable into Equations (5) and (6). The measurements of the connectivity indicator for a transit stop, a transit line, and a region were similar to those defined in Equations (7)–(10). The activity density is a measurement of the development pattern. However, Mishra et al. [
18] did not provide a clearly defined measurement formula.
The present study has revised Equations (5) and (6), by incorporating population density to represent activity density, as shown in Equations (11) and (12), respectively:
where
is the population density in the service area of transit stop
v,
is the average vehicle capacity of transit line
l,
is the hourly frequency of transit line
l,
is the daily operation hours of transit line
l, and
is a scaling constant.
These revisions were based on Mishra et al. [
18]. The definition of the connecting power of transit line
l at transit stop
v and the connectivity index of transit stop
v were similar to those of Equations (7) and (8).
We also revised Equations (9) and (10) to Equations (13) and (14), respectively:
In Equation (9), Park and Kang [
17] introduced a scaling constant
to allow various modes to be compared. However, the meaning of
is changed to the average connectivity index of a transit stop
v along transit line
l. In the present study, a transit network design featuring a subway line comprising few stations but large vehicle capacity and a bus line containing numerous stops, but low vehicle capacity was observed. The two transit modes were comparable regarding the connectivity index of transit lines when using Equation (13) because the connectivity index of a transit line is the sum of the connectivity index of transit stops along that transit line.
Compared with Equation (10), in the present study, the scaling constant was removed from Equation (14) to prevent double counting of the effect of activity density because this factor was considered in Equations (11) and (12).
2.3. Indicator Integration
Two types of indicator dependency can be distinguished. One type of indicator dependency exists in performance measurement; this problem can be easily solved using principal component analysis (PCA). For example, Shiau et al. [
29] proposed a two-stage PCA to measure the transport sustainability of Taiwan. Certain indicators are significantly interrelated (e.g., fossil fuel consumption by transport systems is strongly associated with transport air pollutant emissions). Fuzzy cognitive maps (FCMs) are another useful tool used for solving the indicator dependency problem. For example, Shiau and Liu [
30] used FCMs to evaluate strategies to improve the transport sustainability of the Taipei metropolitan area. The strategies, which can increase the modal split of transit, can also reduce the emission intensity of air pollutants. This type of indicator dependency exists in performance measurement and is different from the type of preferential dependence.
Preferential dependence is another type of indicator dependency. Keeney and Raiffa [
28] suggested a utility decomposition form (excluding the additive and multiplicative form) to resolve the preferential dependence problem. However, the utility decomposition form was too complex to be applied to real problems. Fuzzy theory provides a powerful integration of multiple indicators. Yager [
31] introduced an ordered weighted aggregation (OWA) operator to evaluate multiple criteria decision problems. The operator designs a general functional form to adjust the degree of “satisfying all the criteria” and “satisfying at least one of the criteria” in the aggregation process. Fuzzy measures and fuzzy integrals were proposed to resolve the preferential dependence problem. For example, Feng et al. [
32] used fuzzy measures and fuzzy integrals to facilitate the multiple criteria decision analysis for locating manufacturing centers, and the preferential dependence between various criteria was considered.
Indicator dependency does not necessarily exist in the performance measurement of the coverage, directness, and connectivity indicators. A transit network with high coverage does not necessarily correspond with high (or low) directness, and vice versa. This fact is also applicable to describing the relationships between coverage and connectivity as well as the relationships between directness and connectivity. However, these indicators might exhibit substantial preferential dependence for certain experts’ subjective judgments. An expert might prefer a transit network displaying high connectivity to substitute high directness, and vice versa. Therefore, this study used fuzzy measures and fuzzy integrals to integrate the three indicators for measuring the performance of a public transit network.
The introduction of fuzzy measures and related fuzzy integrals [
33] provides a basis to link the effects of preferential dependence in the multicriteria decision-making problem. Grabish [
34,
35] presented a detailed synthesis and application of fuzzy integrals as an aggregation operator in multicriteria decision-making.
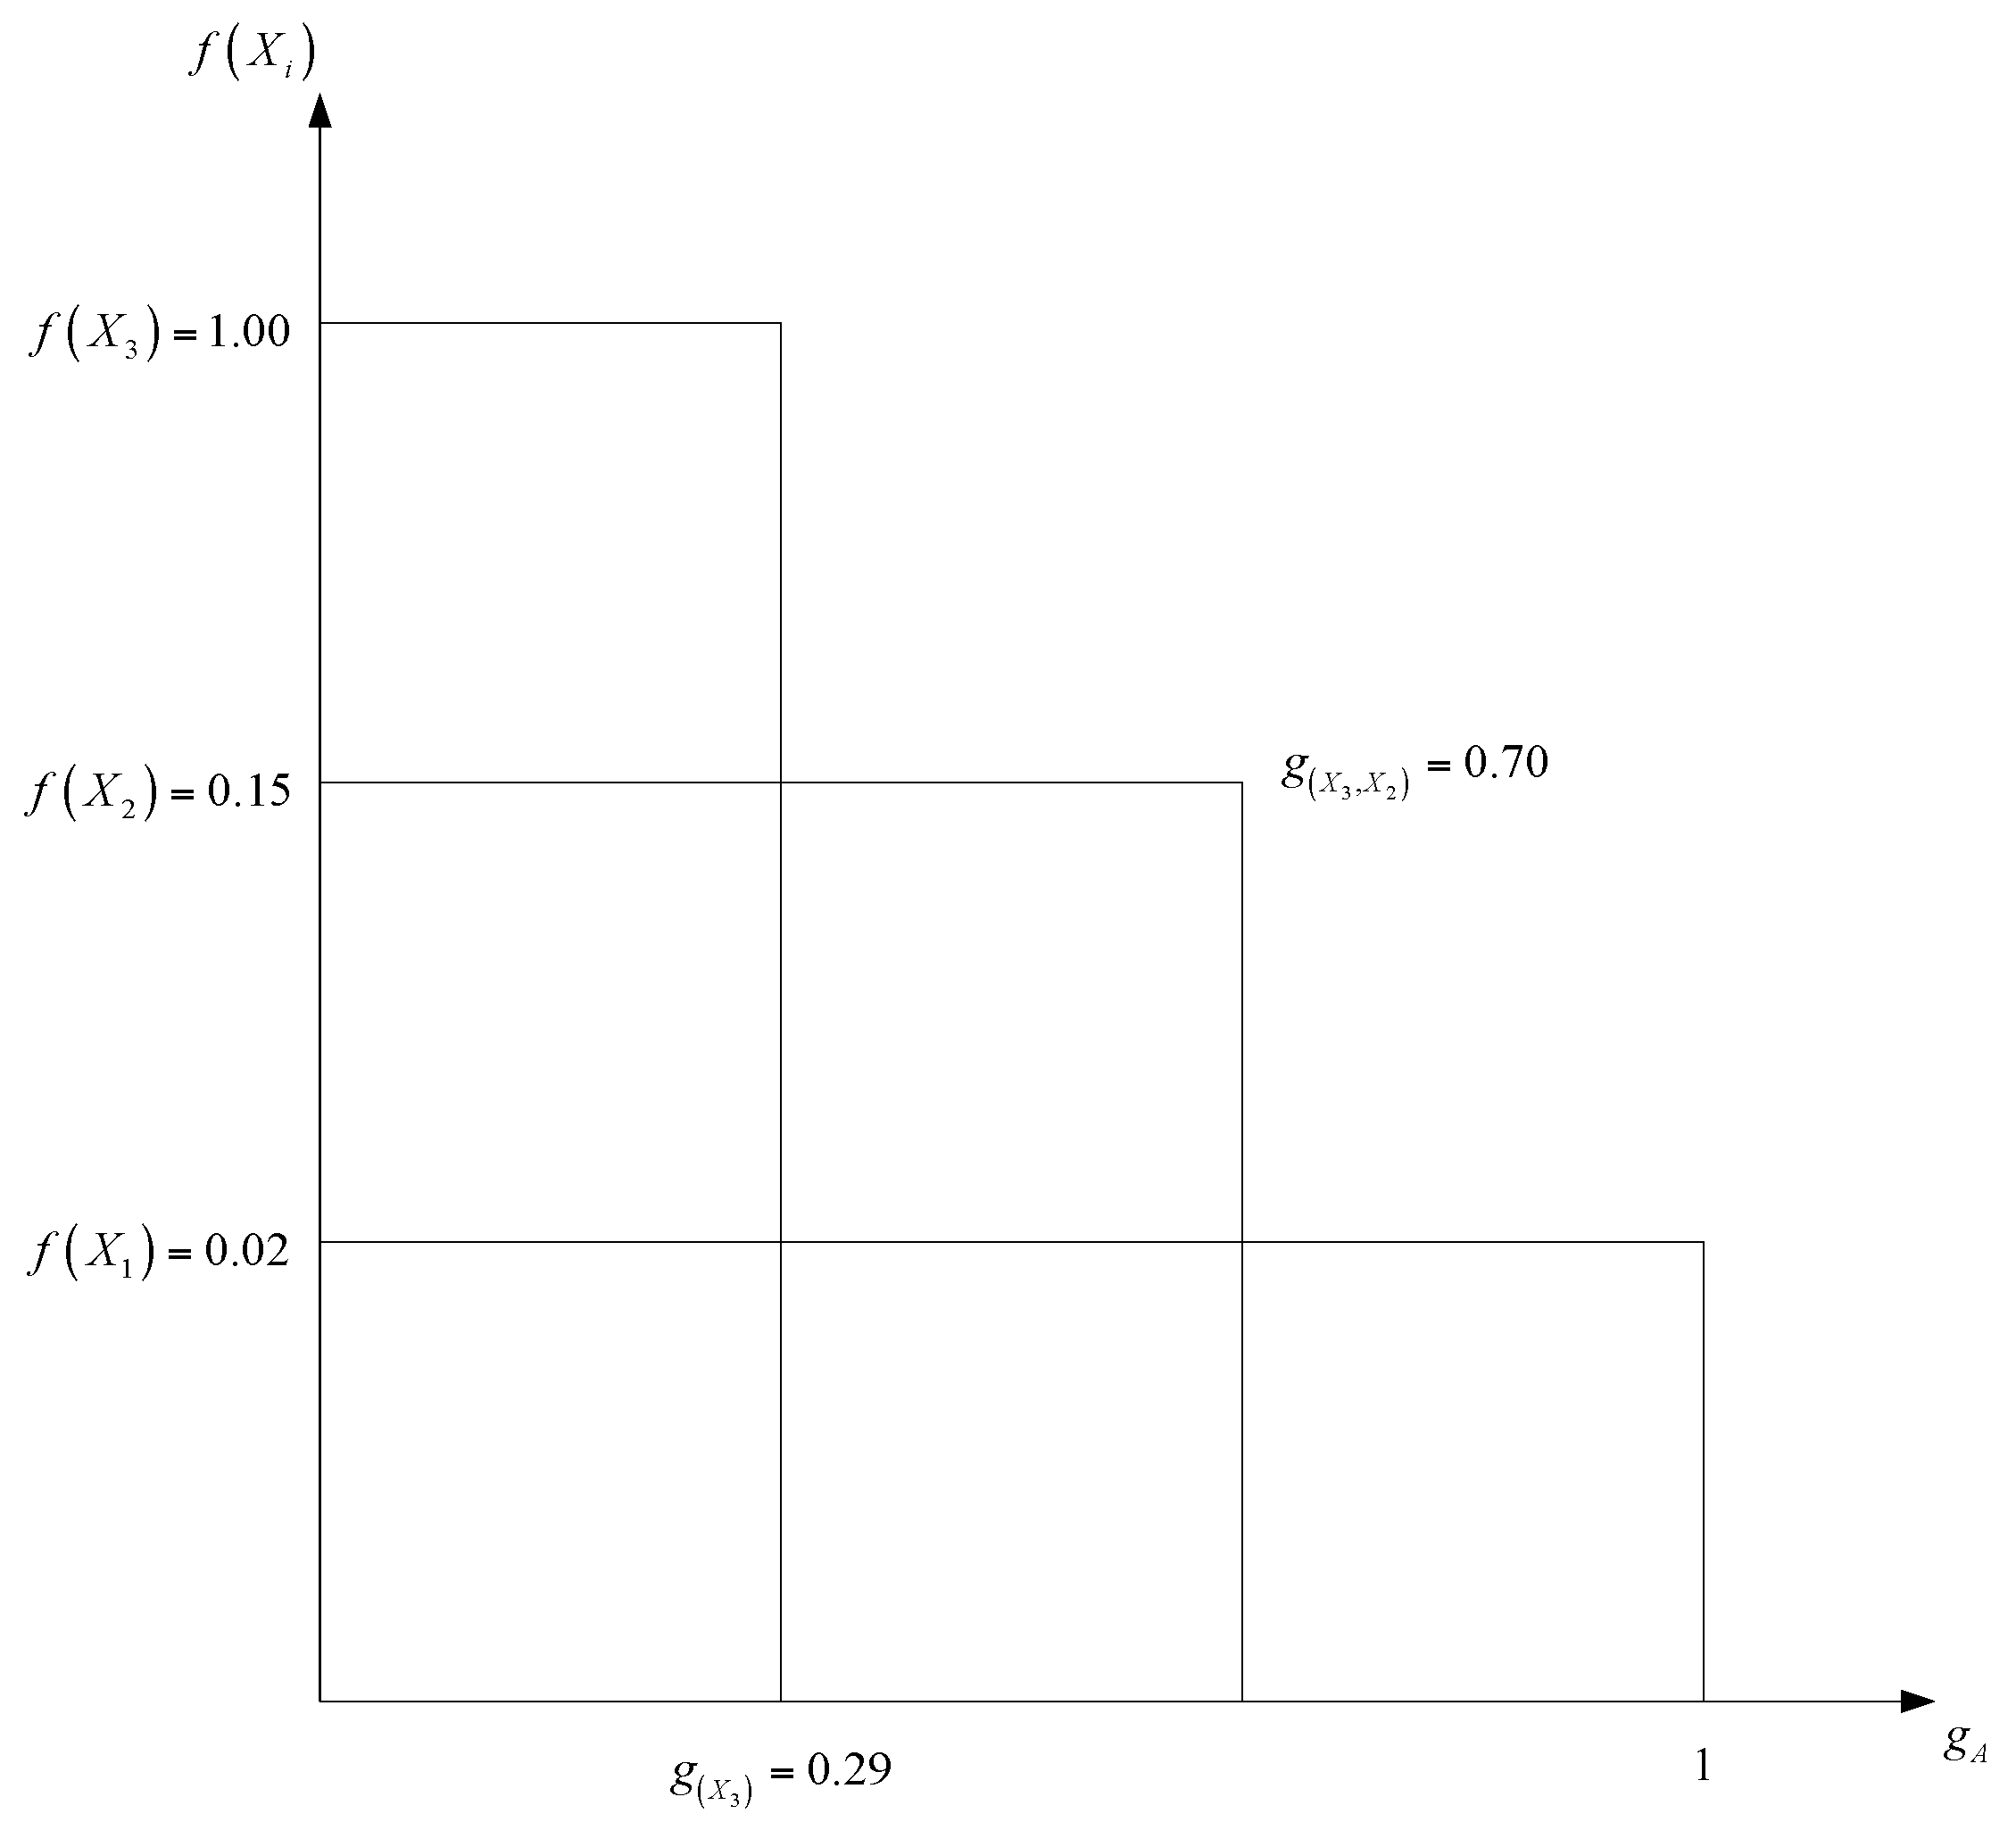
2.3.1. Fuzzy Measure
Let
be the set of criteria in the multicriteria decision-making problem and let
be the set of all subsets of
. A fuzzy measure
g is a set function defined on
, denoted by
, which satisfies the following properties [
35]:
- (a)
; and
- (b)
implies .
For the multicriteria decision-making problem, represents the weight (relative importance) of the set of criteria A. A fuzzy measure can lead to the following three results:
- (a)
preferential independence if ,
- (b)
the substitutive effect if , and
- (c)
the complementary effect if .
Lee and Leekwang [
36] reviewed the
-fuzzy measure, denoted as
, containing the property in Equation (15):
In the case of the multicriteria decision-making problem,
, the
-fuzzy measure can be formulated as Equation (16):
Based on the property
, Equation (16) can be derived and obtained Equation (17):
The -fuzzy measure provides a simple method to solving the value by using Equation (17), and the weight of the set of criteria A is measured by considering preferential dependence effects. The aggregation of indicators can be obtained using the integration of fuzzy measures and fuzzy integrals.
2.3.2. Fuzzy Integral
Grabish [
35] compared the Sugeno and Choquet fuzzy integrals. The Sugeno integral is based on min and max operators; the nonlinear form is relatively complex. By contrast, the Choquet integral is based on linear operators and was generally used in real problem application. The present study adopted the Choquet integral to evaluate network-based public transit performance.
Let
be a fuzzy measure on
X, the Choquet integral of a function
regarding
is defined by Equation (18):
Assuming that
, the Choquet integral can be expressed as Equation (19):
where
.
Regarding the multicriteria decision-making problem, is a performance function used to measure the performance of alternatives regarding criteria; and represents the weight (relative importance) of the set of criteria A. Thus, the Choquet integral in Equation (19) is a measure of the aggregation of multiple criteria. Applying this concept to a network-based public transit performance measurement, the coverage, directness, and connectivity indicators represent the criteria and regions represent the alternatives. The indicator integration regarding preferential dependence can be measured using the integration of fuzzy measures and fuzzy integrals.
4. Discussion
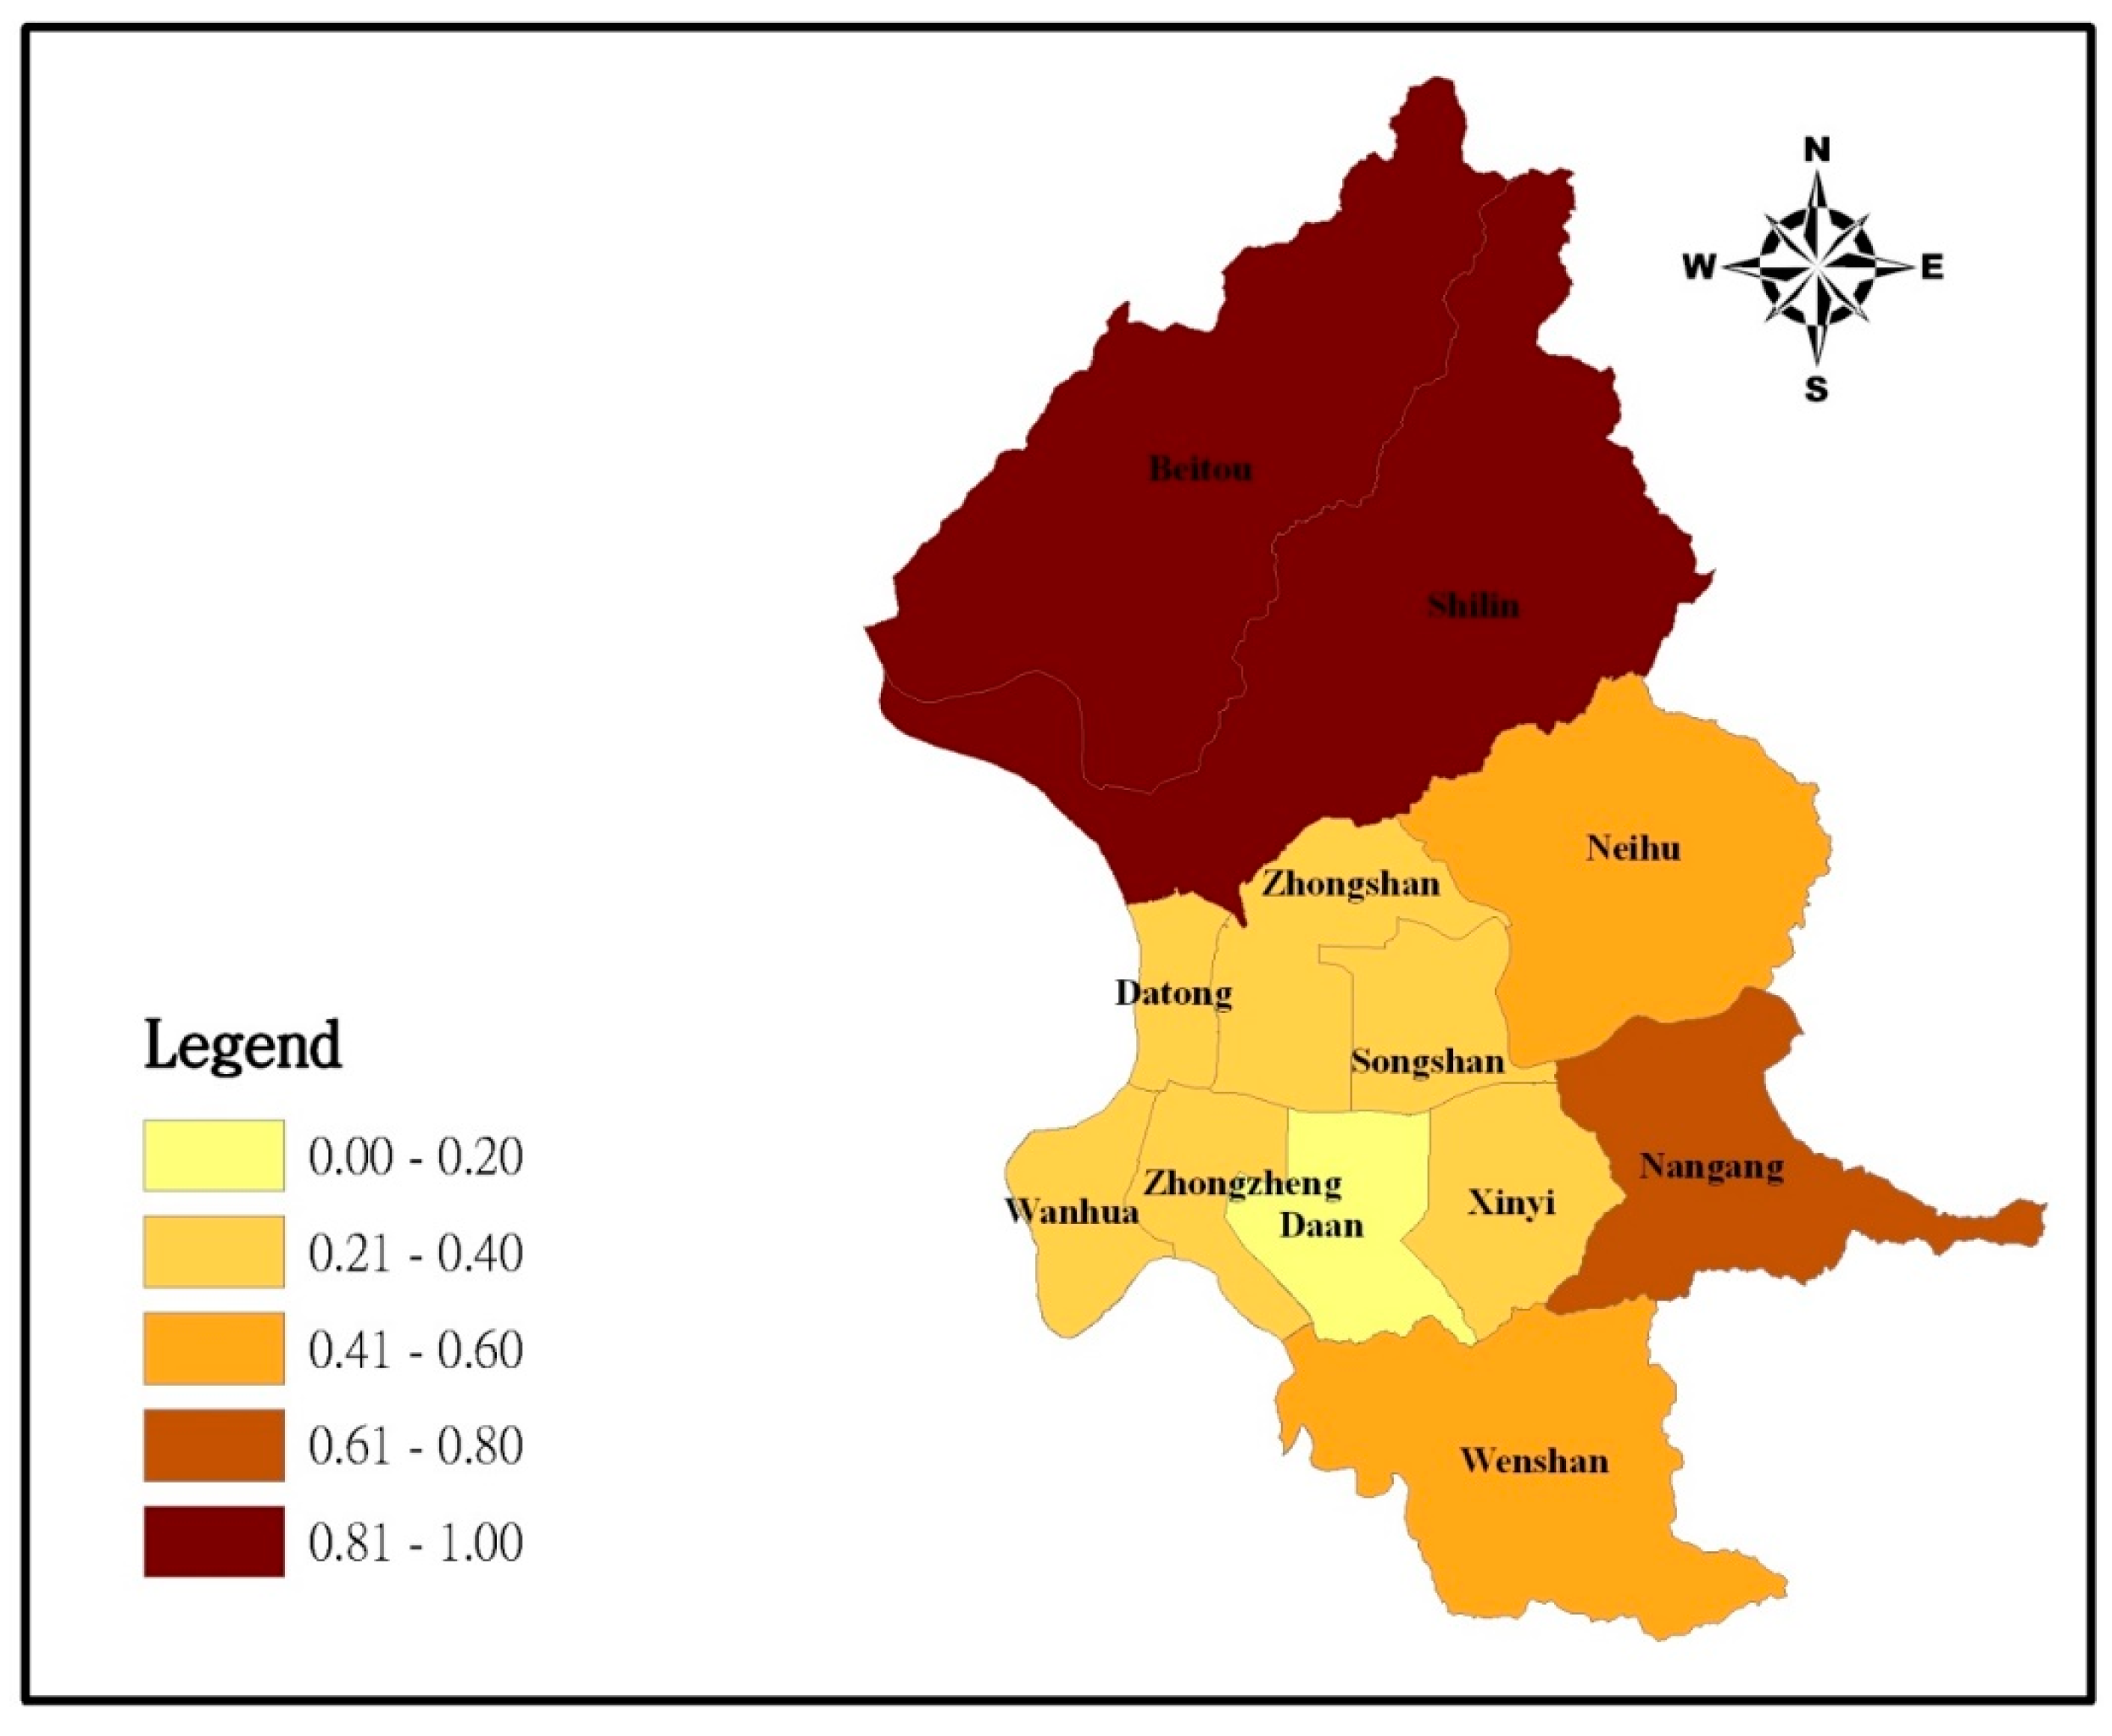
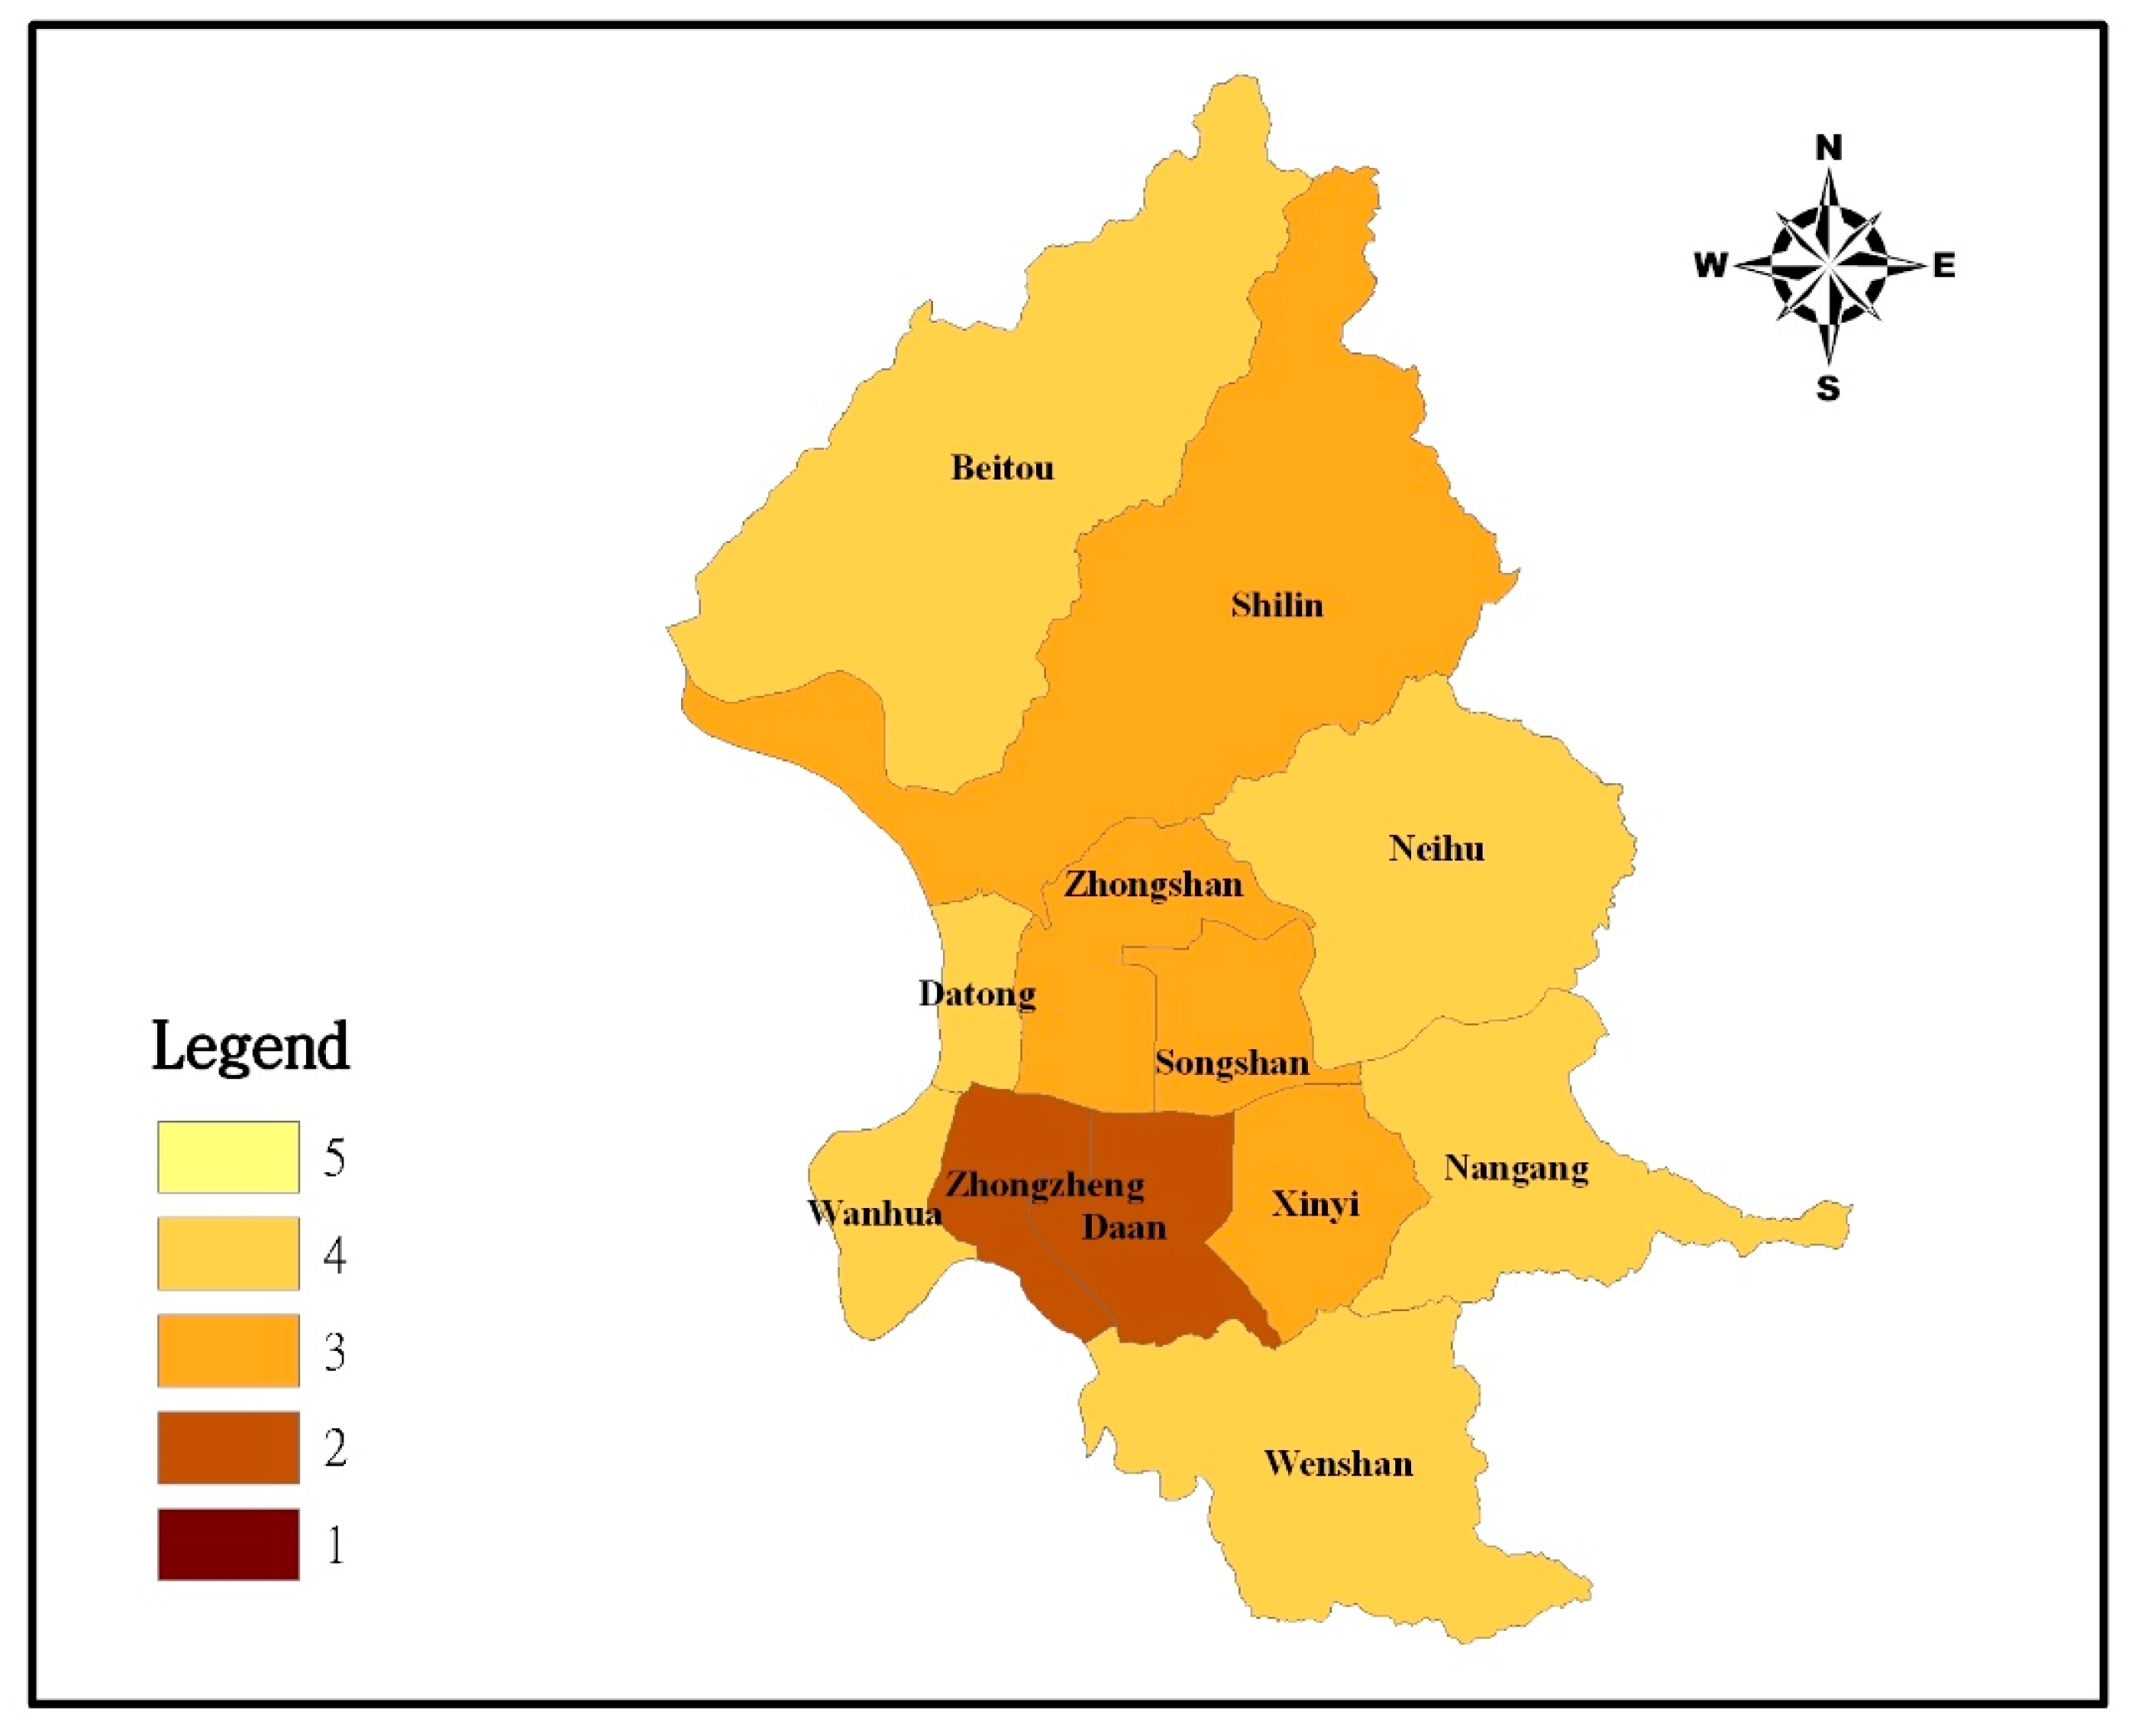
According to the coverage indicator, Taipei City features a widespread public transit network, particularly in the CBD. The Taipei City government has expended much effort to improve the level of transit service in suburbs. Nangang, Beitou, Neihu, Shilin, and Wenshan are the surrounding districts and exhibit relatively little public transit system coverage (below 63%) because of the abundant volcanic mountains and hills. However, these districts exhibit relatively high connectivity to fulfill the insufficient coverage. Particularly, Yangmingshan National Park is primarily located in the Beitou and Shilin districts of Taipei City, and improving the level of bus service in this area was the focus of Taipei City’s transportation policy; thus, the connectivity indicator was higher for these two districts.
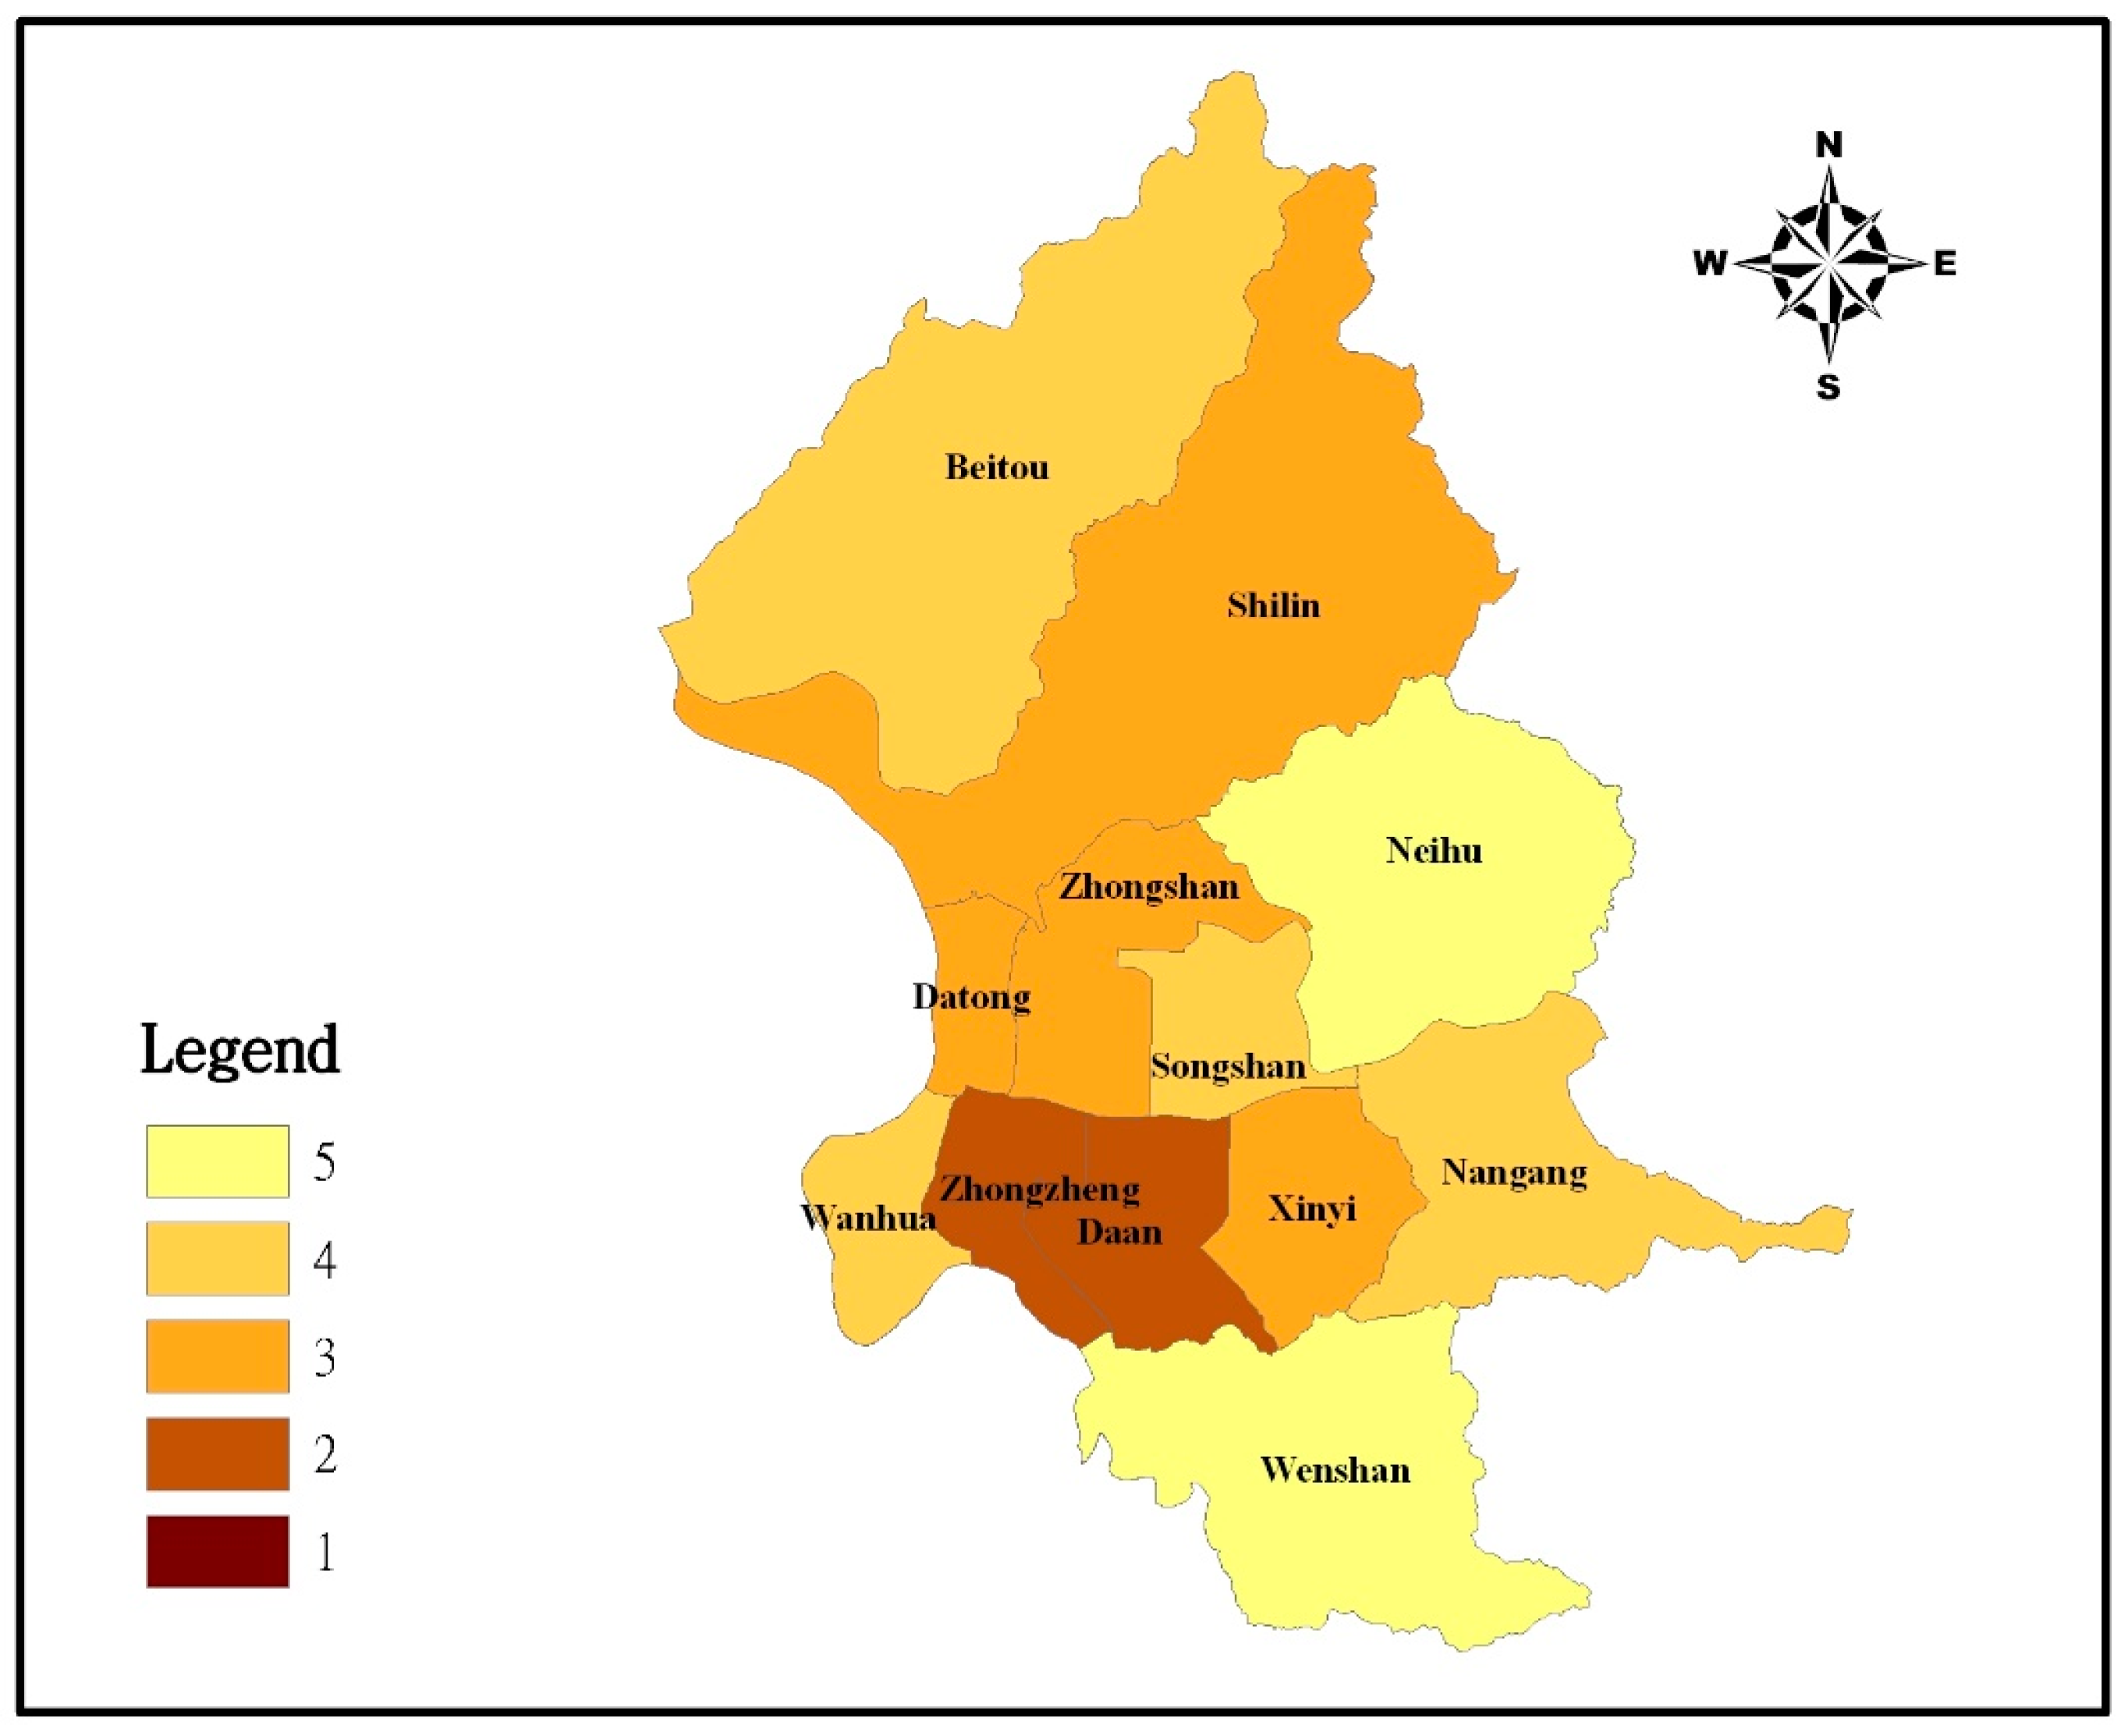
The integration of the coverage, directness, and connectivity indicators indicates that the Wenshan, Neihu, Nangang, Datong, Beitou, and Wanhua districts were ranked as exhibiting relatively inferior public transit performance in Taipei City. Regarding the surrounding areas, including the Wenshan, Neihu, Nangang, and Beitou districts, enhancing the Demand Responsive Transportation Service (DRTS) is a major policy to improve the performance of the coverage indicator. Contrary to expectation, the Datong and Wanhua districts, which are located in the CBD, featured relatively inferior public transit networks. Considering that these districts have a high population density, this study suggests a considerable increase in bus service frequency to improve the performance of the connectivity indicator.
The districts with both high coverage and directness measures were mainly ranked well as per the integration model. In contrast, the districts with both low coverage and directness measures were mainly ranked badly as per the integration model. The top three districts (Zhongzheng, Daan, and Songshan) and bottom three districts (Wenshan, Neihu and Nangang) in transit performances reveal these rules. These rules indicate that coverage and directness indicators are prior to connectivity indicator in initiating improvement strategies for upgrading transit performance.
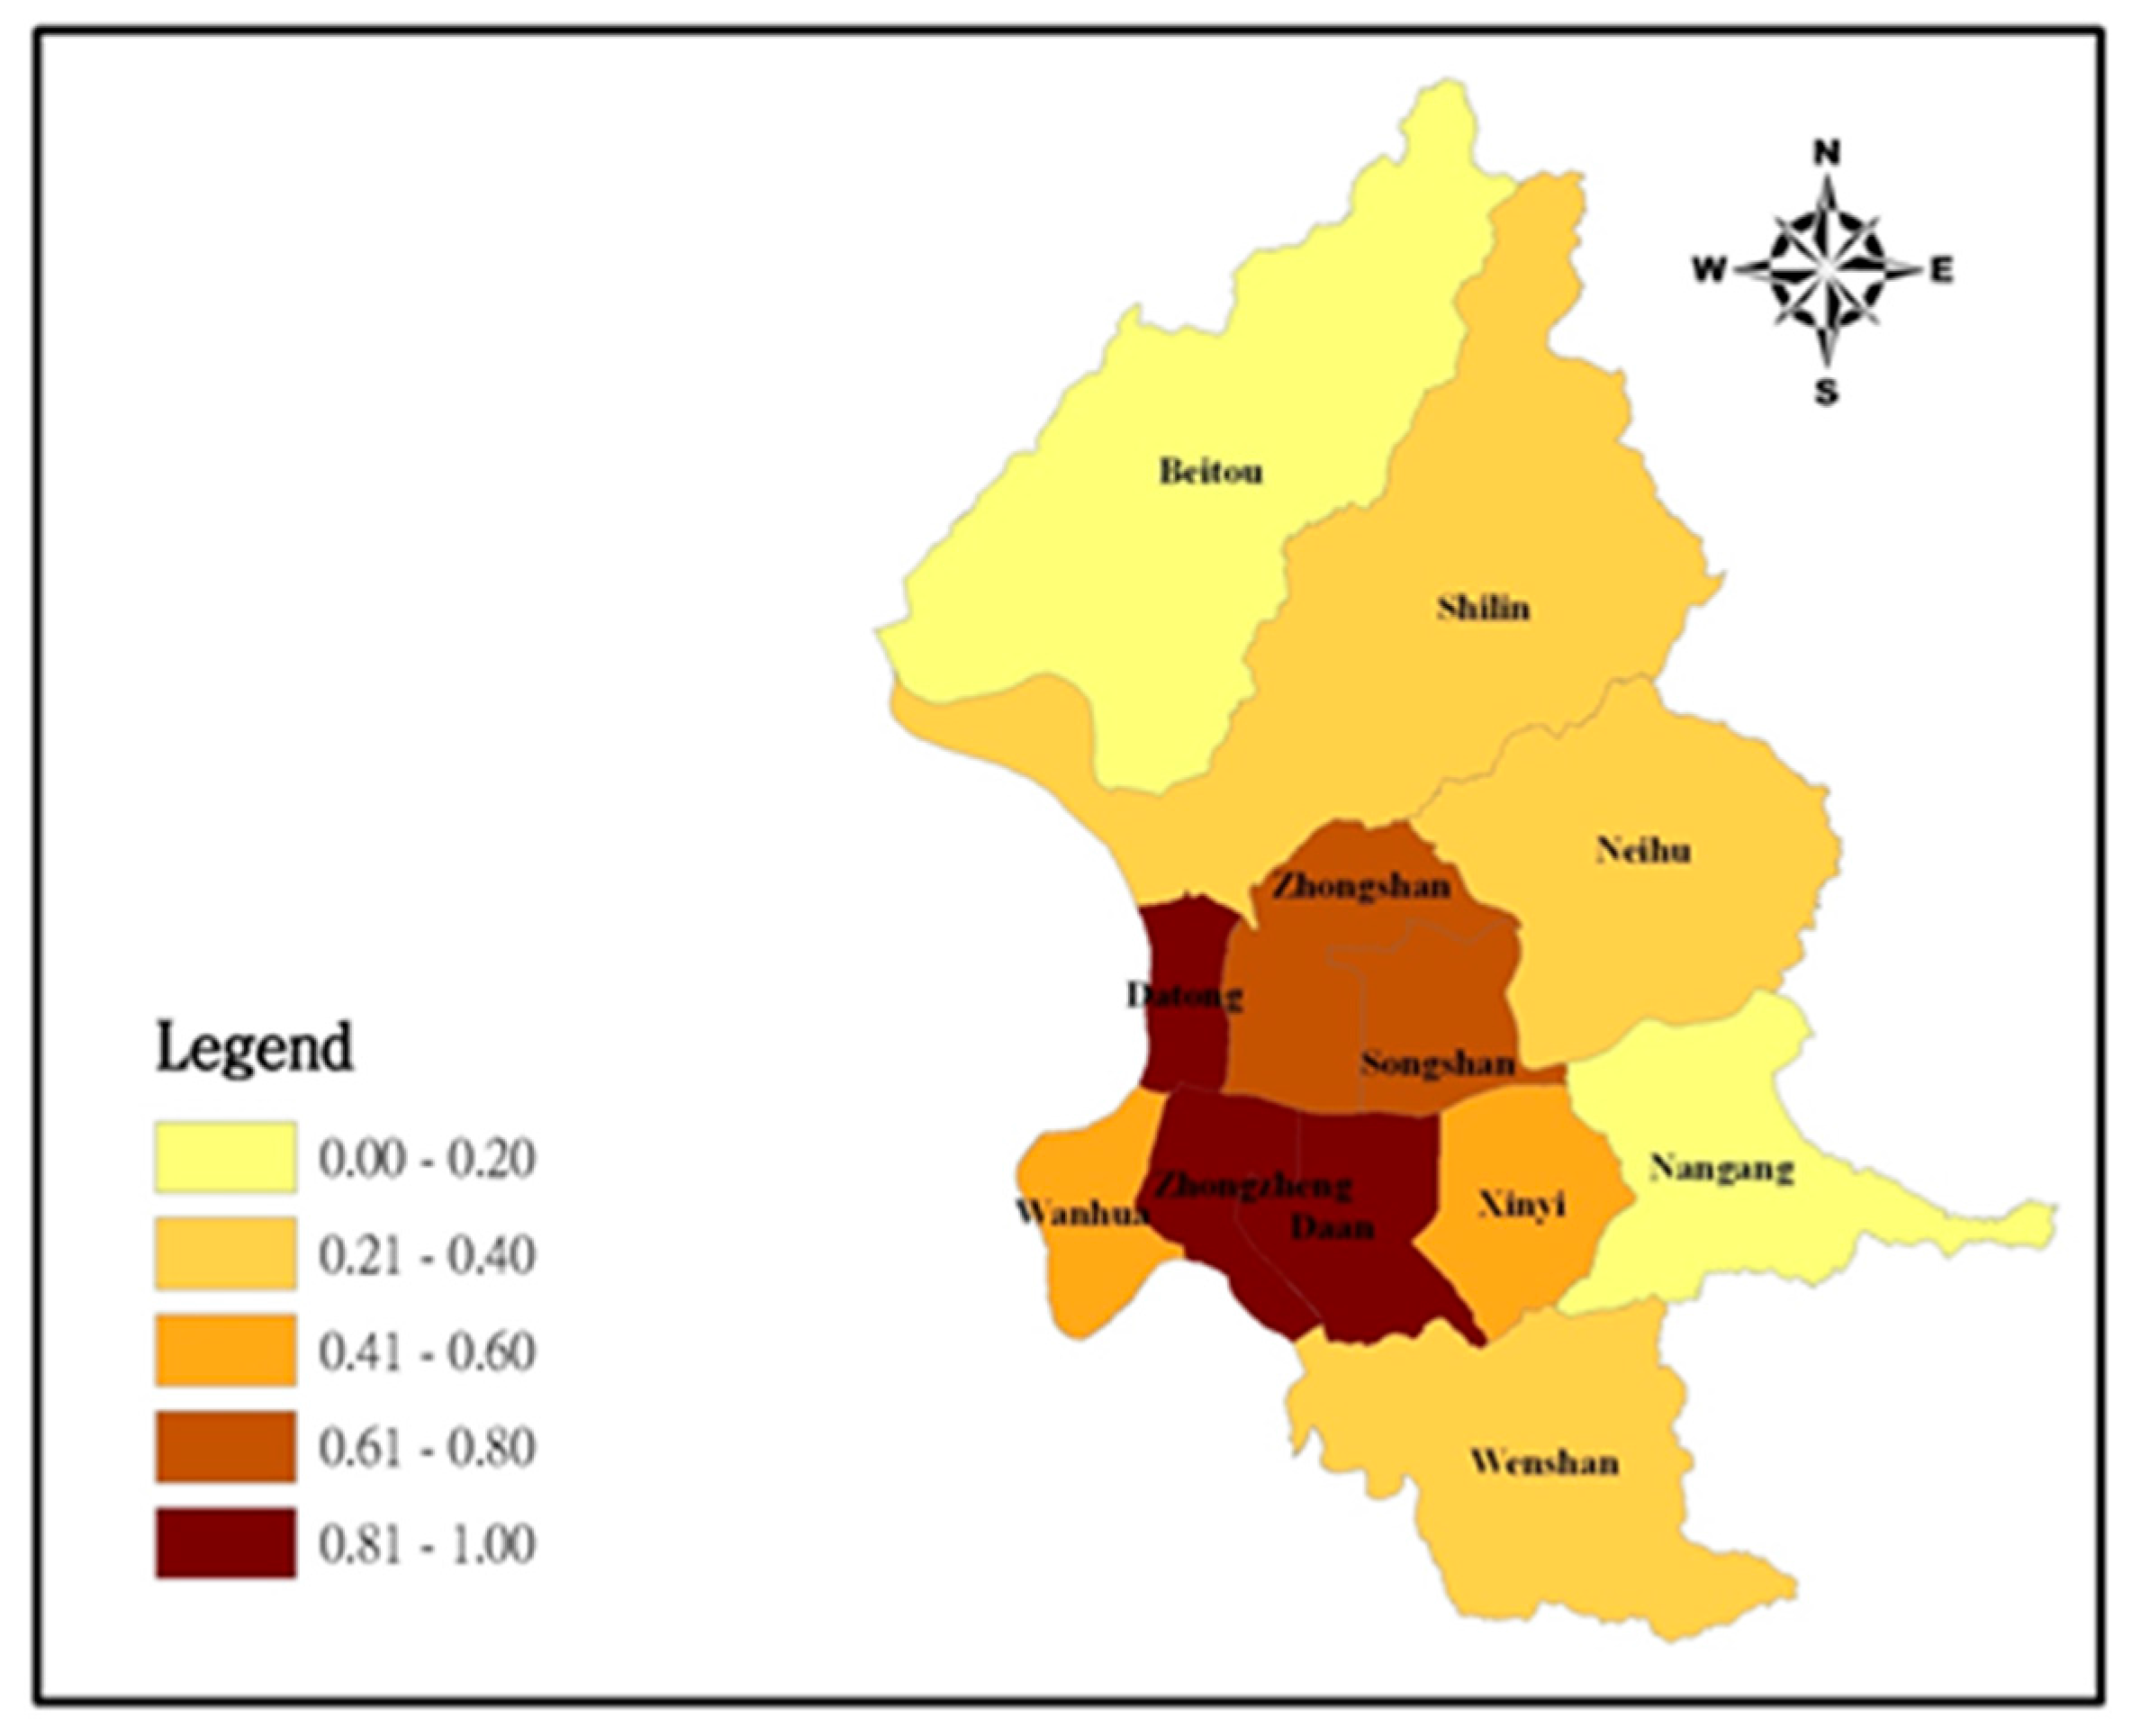
Considering that a substantial amount of land area in the mountainous region is unsuitable for development, this study redefined the service area of public transit (
A) in Equation (2) as total land area that is suitable for development. The performances of the coverage indicator, and, thus, the integration of indicators was revised, as shown in
Figure 7. The ranking of certain districts was subsequently changed. The Songshan district was ranked in Class 4 (Class 3 in
Figure 6), the Datong district was ranked in Class 3 (Class 4 in
Figure 6), the Wenshan and Neihu districts were ranked in Class 5 (Class 4 in
Figure 6), and the rank of the remaining districts did not change.
The measurement of public transit performance incorporates the complexity of transit route arrangement, equipment and performance of transit vehicles, and transit drivers’ attitude and behavior. Network-based public transit performance evaluation focuses on the aspect of transit route arrangement. The efforts can be used as a basis for expanding the complexity of all aspects.
5. Conclusions
This study focused on a multidimensional performance measurement of a network-based public transit system. Previous studies have used the coverage, directness, and connectivity indicators to measure network-based public transit performances individually. However, these studies did not provide a comprehensive measurement of the indicators. This study revised the indicators proposed by Derrible and Kennedy [
7], and used fuzzy measures and fuzzy integrals to integrate the three indicators. The major contributions are twofold: one contribution is providing a comprehensive performance measurement for multimodal transit network and the other is resolving the preferential dependence between indicators. A case study of Taipei City illustrated the integration model application. The major results can be summarized as follows:
According to the decision group preferences, the priority ranking of the indicators is as follows: coverage is preferred to directness and directness is preferred to connectivity.
The districts of Taipei City in the CBD generally feature higher transit coverage compared with the districts in the surrounding areas.
The districts in the surrounding areas generally feature high transit connectivity compared with the districts in the CBD.
The 12 districts of Taipei City do not differ substantially in transit directness performance.
The integration of the indicators revealed that most of the districts of Taipei City in the CBD exhibit relatively superior transit performance, except for the Datong and Wanhua districts, and most of the districts of Taipei City in the surrounding areas exhibit relatively inferior transit performance, except for the Shilin district.
When the service area of public transit was redefined as total land area that is suitable for development, the comprehensive transit performance of the 12 districts in Taipei City changed slightly.
Additionally, this paper suggests policy directions to improve network-based public transit performance. Regarding the surrounding areas, including the Wenshan, Neihu, Nangang, and Beitou districts, enhancing the DRTS is a feasible policy to improve the performance of the coverage indicator. We suggest a considerable increase in bus service frequency to improve the performance of the connectivity indicator in the Datong and Wanhua districts located in the CBD.
A variety of expert-based information integration model has been used in the policymaking process [
37]. In the case of public decision making in Taiwan (including Taipei City), expert-based group decision making model is commonly applied [
38]. The preference structure of the decision group decides the evaluation of public transit performance and improvement direction. However, the representatives of the decision group may vary with the times. A formal mechanism to decide the representatives of the decision group is a crucial topic in the future research.
The radius thresholds of MRT stations, Taiwan railway stations, and bus stops are decided by commuters. This paper suggests employing a constant survey mechanism to determine commuter attitude, thereby obtaining feedback to revise the measurement of network-based public transit performances in the future. Additionally, transit route arrangement is only one concern of commuters regarding the service quality of public transit. This study suggests that further research incorporate transit route arrangement, equipment and performance of transit vehicles, and transit drivers’ attitude and behavior into the integration model. The network-based performance measurement presented in this study provides a concrete basis for expanding future research.


