Effect of National-Scale Afforestation on Forest Water Supply and Soil Loss in South Korea, 1971–2010


Department of Environmental Science and Ecological Engineering, Korea University, Seoul 02841, Korea
*
Author to whom correspondence should be addressed.
†
These authors contributed equally to this work.
Sustainability 2017, 9(6), 1017; https://doi.org/10.3390/su9061017
Submission received: 29 April 2017
/
Revised: 6 June 2017
/
Accepted: 8 June 2017
/
Published: 13 June 2017
(This article belongs to the Special Issue Regional Sustainability Research Network: Selected Papers from the Expert Group Meeting on Achieving the Sustainable Development Goals with Water–Food–Ecosystem Resilience in the Mid-Latitude Region)
Abstract
:Afforestation of forests in South Korea may provide an example of the benefit of afforestation on precipitation storage and erosion control. In this study, we presented the effects of afforestation on water supply and soil loss prevention. A spatio-temporal simulation of forest water yield and soil loss was performed from 1971–2010 using InVEST water yield and SWAT models. A forest stock change map was produced by combining land cover data and National Forest Inventory data. The forest water yield increased about twice with changes in forest stock and climate from 1971–2010 and showed a spatially homogeneous water supply capacity. In the same period, the soil loss decreased more than three times, and the volatility of soil loss, in the 2010s, was smaller than before. The analysis of the change in forest stock without considering climate change showed an increase of 43% in forest water yield and a decrease of 87% in soil loss. An increase in precipitation increased the water yield, but also increased the soil loss volume. A change in forest stock led to positive changes in both. This study presents functional positive effects of the afforestation program in South Korea that can be useful in various afforestation programs in other countries.
1. Introduction
Forest has many diverse environmental functions, and afforestation is the most effective way to promote and restore environmental functions and ecosystems [1,2,3]. However, deforestation is common in many countries mainly due to food and fuel supplies, and there have been few successful cases of afforestation programs. Currently, a number of forests in North Korea and in the tropical forests of South America, Central Africa and Southeast Asia are being destroyed [4,5].
South Korea is one of the four countries and the only (former) developing country that has a successful history of forest rehabilitation following World War II [6]. The success of afforestation promotes the diverse functions of forests and affects national security by focusing on disaster reduction and water supply issues [7,8]. Many studies have analyzed the effects of forestation in Korea, but most focused only on forestry or carbon uptake issues [9,10,11]. It is necessary to quantitatively analyze not only the carbon uptake, but also the effects derived from forest functions.
Forests are the largest units of ecosystem services providing significant functions including natural conservation, disaster reduction, water supply, recreation and wood production [12]. Above all, forests have traditionally been important to store and supply water on the surface of the Earth and protect the soil through the layer of roots, thereby preventing soil loss from wind and precipitation [13]. There were some studies that researched the effects of the changes in forest area and stock, which is the density of forest, on ecosystem services in water supply or rehabilitation and soil erosion prevention [14,15,16]. Both water yield and soil loss prevention functions are altered not only from changes in forest, but also those in land cover and climate [17,18]. Therefore, we should use the method that takes land cover and climate into consideration, such as using a model that needs these factors as input data, to quantify these functions.
Various methods have been presented previously to estimate the water resources conserved by forests over time, but research of the South Korean example that considers the time series changes on a country-wide scale has not yet been conducted. Kim et al. [19] have introduced a method to estimate the water storage to quantify the water resources’ conservation function, but it has its limitations as it does not reflect the hydrological cycle and time series changes of climate or land use. Studies on soil loss and soil erosion in South Korea have also been conducted at a local, and a regional, scale, but they have not examined the functional levels of forests [20,21,22]. For this reason, it is necessary to explain the impact of the changes in forest stock and land cover on soil loss.
In this study, we quantitatively analyzed the effects of afforestation on two forest functions, which have not been addressed previously. The effects of afforestation on forest water supply and soil loss were analyzed using two models for the period from the 1970s to the 2010s, when the forestation was successfully carried out in South Korea. The effect of afforestation on the water supply and soil loss identified in this study will be useful for other afforestation efforts in other countries.
2. Data and Method
2.1. Afforestation in South Korea
2.1.1. Study Area
South Korea is a peninsula located in mid-latitude East Asia, and it has a temperate climate. Annual average precipitation is 1000–1800 mm, and 50–60% of precipitation is concentrated in summer. The average annual temperature is 10–15 °C; the warmest month is August; and the coldest month is January. The annual average humidity is 60–75%, 70–85% in summer and 50–70% in spring [23].
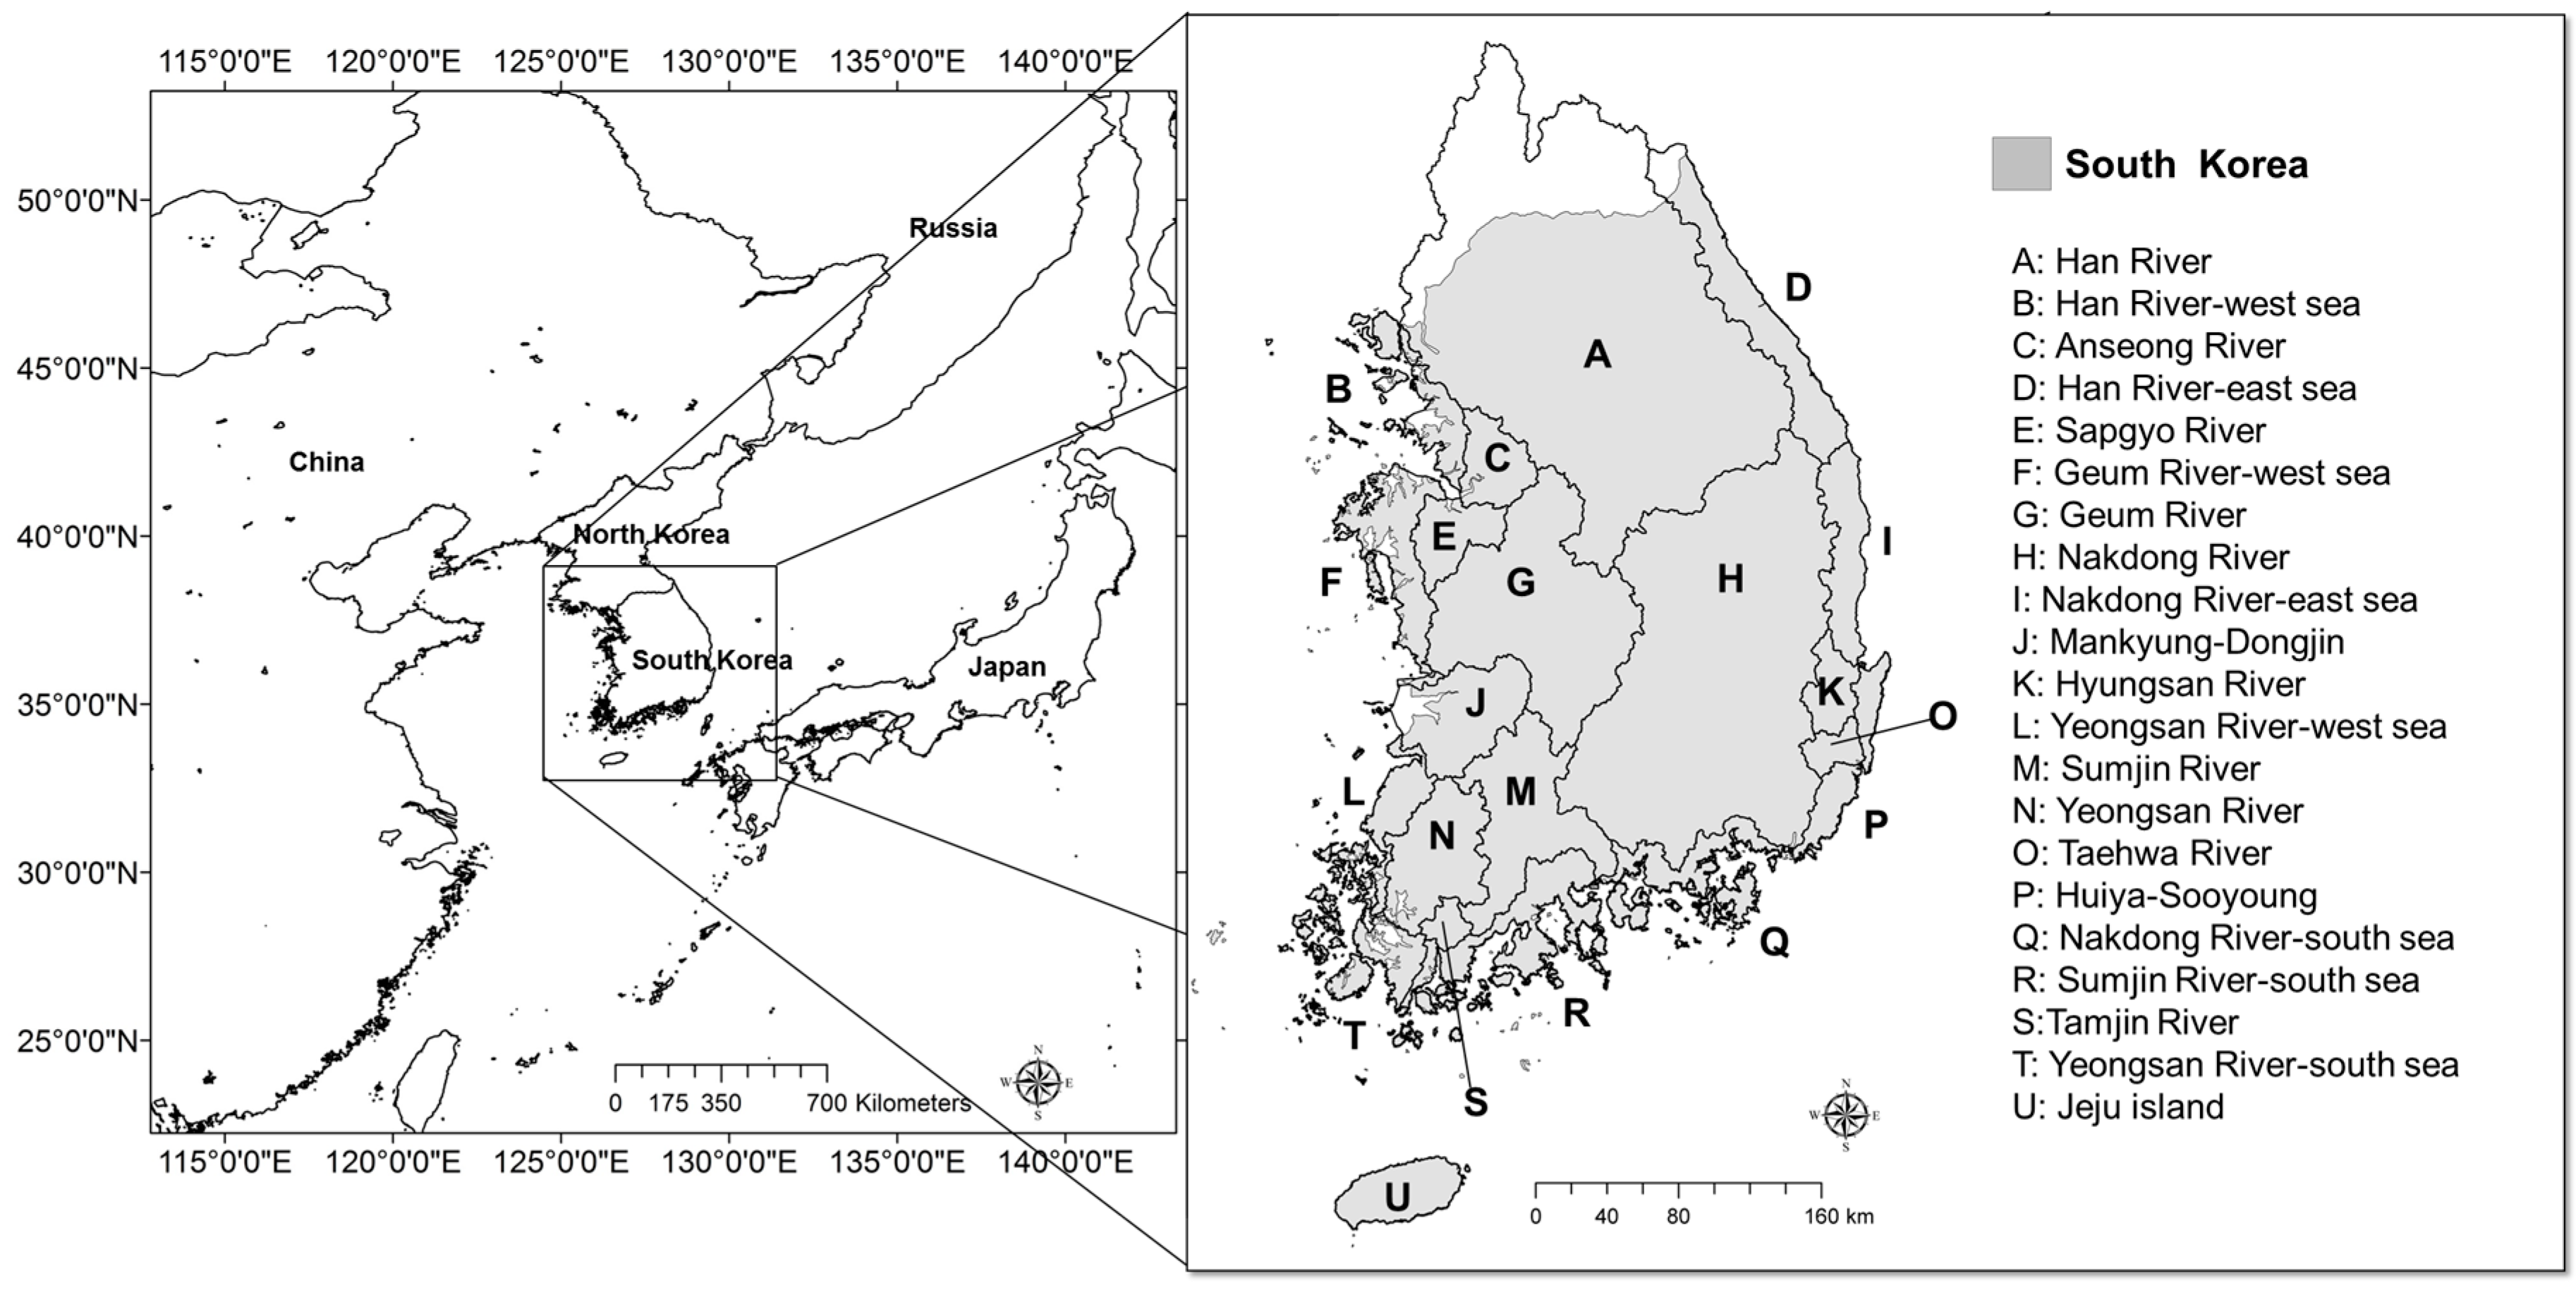
More than 60% of the entire country is mountainous, and the terrain is high in the east and low in the west. Most forests in South Korea are located in mountainous areas [24]. The total area of the country is 99,720 km2, and the forest area is 64,081 km2. The Korean peninsula consists of 20 major watersheds, of which five major basins (Han River, Nakdong River, Geum River, Yeongsan River and Sumjin River) cover more than 80% of the peninsula (Figure 1). The 20 major watersheds can be categorized into a total of 849 sub-watersheds according to the tributaries.
2.1.2. Afforestation Program
More than half of the forests in South Korea were destroyed after the Korean War (1950–1953). In addition, the country suffered from a shortage of timber at that time. Under those circumstances, the forests of South Korea hardly recovered for about two decades after the Korean War. During that period, severe forest degradation occurred, along with flooding, soil erosion and other disasters. The South Korean government established several forestation programs including tree planting and forest protection efforts after the Korean War.
Beginning in the 1970s, the forestation program started to become increasingly successful. The major factors of the success were economic growth, governmental policies and citizen involvement [13]. The economic growth moved the rural population to urban areas, and that reduced illegal logging and harvesting activities. In addition, the Korea Forest Service was moved under the Ministry of Internal Affairs to support the forestation program. The forestation policies were implemented to monitor illegal logging, changed the domestic energy sources from wood to fossil fuels and undertook tree planting at the national scale. Especially, the shift in the composition of energy sources significantly decreased the demand for fuelwood.
The active involvement of the citizens was also a major contributor to the success of the national-scale forestation program. The villagers managed the nurseries, planted seedlings and monitored the planted trees, as well as received economic support from the government in return. The campaigns also encouraged students to plant and manage trees and generated a widespread interest in forestation. In summary, the forestation program was a comprehensive technical and social framework that recovered the forest ecosystems and enhanced the economic performance of rural regions.
2.1.3. Establishing the Forest Stock Map
The effects of afforestation should be analyzed based on the concept of the forest stock. Forest density is the stocking volume density per area. However, in the models simulating the spatial units, data on the forest area are needed, but the forest area in the land cover data from the 1970s to the present is similar to the forest statistics. In other words, the change is not reflected in the forest stock, but only the total forest area is provided in the statistics. For this reason, in this study, a land cover map that can reflect the forest stock changes was developed for use in the models.
The land cover data from the 1990s were used as the basis because other land cover data in the past years were considered constant in this study. In order to consider the changes in the forest stock, the forest area was divided into non-stocked forests and stocked forests based on the 5th National Forest Inventory of South Korea (NFI) and the age information presented by Lee et al. [10] as the forest recovery scenario. Systematic sampling was then applied to the 5th NFI data with a 4-km grid size to place the sampling points within the grids to be surveyed from 2006–2010 [25]. Assuming that the forest stock was not deforested after afforestation during the study period, the forest stock was calculated by decreasing the yearly margins from the age information (NFI data), so as to derive the areas of non-stock forests and stocked forests. Finally, the age information and the land cover of the 1990s were combined into time series land cover data to analyze the change in the forest stock.
2.1.4. Forest Stock Change Map in the Past Four Decades
Stocked forests, which covered 532,900 ha in 1971, increased more than ten-times to 5,576,800 ha in 2010. Since 2005, all of the forests in the NFI data were indicated as the same grade, so the forest stock change maps from 2005–2010 are the same. Between 1980 and 1990, the growth rate of stocked areas was the highest among the others, with a gradual increase from 1995 (Figure 2). Spatially, in the 1970s, stocked forests were distributed only around high mountains, but gradually expanded to the whole country. In the 2000s, most forests became stocked forests (Figure 2).
These forest stock change maps do not perfectly match the stocking volume of South Korean forests, but show the same tendency of quantitative increasing (Figure 2). This method is considered to be the only method that can be used in mapping without needing any spatial data on forest stock change.
2.2. Forest Water Supply by the InVEST Model
2.2.1. The Concept of Forest Water Supply and Yield
Providing water in forests is explained using many terms such as water resources, water supply and water yield. Here, the water resource means the total amount as a static concept, and the water supply and water yield can be understood as the quantity supplied as a dynamic concept [1,3,8,26,27]. Specifically, water yield is theoretically included in the water supply and is effective for expressing the amount of water supplied [26,27]. Forest water yield is a concept for quantifying a forest’s functionality of providing water resources. In this study, the concept of forest water yield was used to explain water supply in forests.
Forests are the largest terrestrial ecosystems that supply water; however, forests with the highest vegetation density have the highest actual transpiration rates [26]. Therefore, the potential of forests in providing water resources is lower than other land cover types. Nevertheless, forests with deep roots and low direct runoff provide the largest part of the water supply, and forest water yields can be used to determine the amount of total supply [27]. For the calculation of the water yield, various methods suggested by the previous studies included factors such as land use, forest species, age-class, precipitation, amount of evapotranspiration, porous ratio and depth of root [28,29].
2.2.2. InVEST Model
The Integrated Valuation of Ecosystem Services and Tradeoff (InVEST) model is a suitable tool for spatial quantification of ecosystem services, especially in large areas [30]. In particular, this model was developed to provide decision makers with a trade-off of ecosystem services to compare the impacts of the changes in land cover or climate [30]. InVEST Water Yield (InVEST-WY) is one of the modules of the InVEST model to estimate water supply, demand and hydropower [31,32] and has been used in previous studies in Korea [33,34]. This study aims to identify the time series changes in forest water supply; thus, the InVEST-WY model was considered the most appropriate one as it allows the spatial-temporal change analysis.
This model estimates the total annual water yield for each grid of the study area. The amount of water supply Y(x), calculated from each pixel of the InVEST-WY model, follows the average annual precipitation function of the Budyko curve as shown in Equation (1). AET(x) is the actual evapotranspiration in a pixel and P(x) is the annual precipitation in a pixel. Here, the amount lost through evapotranspiration can be calculated using Equation (2); porous ratio W(x) is calculated using Equation (3) according to the seasonality factor value, Z, and the potential evapotranspiration ratio in comparison to precipitation R(x) is given by Equation (4). The final AET(x) is calculated using Equation (5) [30].
2.2.3. Input Data and Parameters of the InVEST Model
The eight principle data items necessary for the InVEST-WY model are as follows: annual precipitation, potential evapotranspiration, depth-to-root restricting layer, plant’s available water content (AWC), land use, watersheds, biophysical table and the seasonality factor that can be classified into meteorological data, physical data and attribute data. The biophysical table is the basic parameter estimating water yield, which includes land cover types, species Kc factor, maximum root depth per land cover, etc. [30]. The input data were formatted according to the user guide and the sample data form provided by the InVEST model. If the requested input data could not be found, the default data in the InVEST model or global data were used.
Precipitation data were obtained from the Korean Meteorological Administration’s (KMA) meteorological data open portal system for 75 weather stations for the period of 1971–2010. Monthly precipitation data were constructed at 1-km spatial resolution for each year by reflecting the elevation changes using the topography correction formula devised by Yun et al. [35]. Since there are no potential evapotranspiration (PET) data from the observation network or from the satellite images for a large area or for a long time period, we used data from the Global Land Data Assimilation System Version 2 (GLDAS-2) product by the National Aeronautics and Space Administration (NASA). The three-hour evapotranspiration data for South Korea were extracted from the global data, converted to annual units and interpolated at 1-km spatial resolution.
The depth-to-root restricting layer is the soil depth at which root penetration is inhibited because of physical or chemical characteristics, and there are no related spatial data at present in Korea. In this study, we applied the type classification method for the forest ecosystem service assessment proposed by Jeon et al. [36] using the maximum depth of roots classified as coniferous, broadleaf, cropland and grassland by Canadell et al. [37]. For coniferous and broadleaf trees indicated in the classification method, the maximum root depths of 3.9 m and 2.9 m were applied, respectively. For mixed forests, the mean value of 3.4 m was used. This includes all of the forest areas classified by the ecosystem classification method. However, since the data may not be complete for the whole country, the land cover (see below) map is used to fill the gaps in the data; depths of 2.6 m and 2.1 m were used for the grassland area and the agricultural land area, respectively. AWC is the pore space ratio in plant soil and refers to the range of porosity of soil containing water divided into clay, silt and uniform sand. This was applied to the soil type in the soil map data prepared by the Korea Rural Development Administration (RDA) [38].
The afforestation information prepared in this study was combined with the land cover map (Ministry of Environment, Sejong-si, South Korea) produced using the Landsat satellite images in the late 1990s. There is no change in other land cover types, but the forest area has been reconstructed every year. The coefficients of the biophysical table were determined according to the land cover information, and the Kc coefficients of the forest area were set to 1 based on the previous studies [31,32].
2.3. Soil Loss by the SWAT Model
2.3.1. The Concept of Soil Loss
Soil loss is a phenomenon in which soil particles are detached, transported and deposited by water surface runoff. Soil loss occurs mainly when the rainfall intensity is high; therefore, in South Korea, there is a vast amount of soil loss during the summer season when heavy rainfall occurs. Excessive soil loss can cause nutrient and carbon depletion in terrestrial ecosystems and can progress to natural disasters such as landslides. The amount of soil loss is determined by soil characteristics, land cover and topographical factors. The magnitude of soil loss is lower in forest land than in other land cover types due to the protection by litter and humus layers, which cover the forest floor. Therefore, deforestation and vegetation change can increase the amount of soil loss [41].
To calculate the soil loss, the Universal Soil Loss Equation (USLE) and the Modified Universal Soil Loss Equation (MUSLE) are widely used. USLE was developed by Wischmeier and Smith and considers rainfall energy, topographic, land cover and hydrological factors [42,43]. MUSLE is the modified equation improving the USLE formula by replacing the rainfall energy factor with the runoff factor [44]. Therefore, USLE can only calculate the loss of soil detached by rainfall energy, but MUSLE can calculate the loss of soil detached and transported by runoff.
2.3.2. SWAT Model and MUSLE
The Soil and Water Assessment Tool (SWAT) model is a semi-distributed hydrological model developed by the United States Department of Agriculture (USDA) Agricultural Research Service (ARS) [45]. This model is widely used because of its accessibility and effectiveness in hydrological simulations. It has various equations and modules for each function. The SWAT model creates HRU (hydrological response units) based on land cover, soil and slope, which are the main units of the SWAT model, and performs spatial simulations based on these units. The SWAT model can estimate runoff factors that can be used by the MUSLE equation to calculate soil loss. There are many studies on soil loss simulations using the SWAT model for small watersheds [46,47].
MUSLE is expressed by Equation (6), where sed is sediment yield on a given day (ton), Qsurf is surface runoff volume (mm H2O ha−1), qpeak is peak runoff rate (m3 s−1), areahru is the area of the HRU (ha), KUSLE is the USLE soil erodibility factor (0.013 metric ton m2 h (m3-metric ton cm)−1), CUSLE is the USLE cover and management factor, PUSLE is the USLE support practice factor, LUUSLE is the USLE topographic factor and CFRG is the coarse fragment factor.
2.3.3. Input Data and Parameters of the SWAT Model
The four principle data items necessary for MUSLE in the SWAT model are daily precipitation, topographic data, land cover and soil properties that can be classified into meteorological data, spatial and attribute data. The input data are modified according to the SWAT model format. The spatial resolution was set to 50 m.
Precipitation data were obtained from the Climate Forecast System Reanalysis (CFSR) and the KMA meteorological data open portal system for the period of 1971–2010. CFSR provides 38-km resolution global meteorological data used in watershed models. KMA observes daily weather at 55 stations and provides weather statistics.
Topographic data including slope, elevation and watershed are the essential physical factors for hydrological simulations. The digital elevation model (DEM) data are used to delineate watersheds and calculate the slope. DEM is a spatial map that contains the altitude information above sea level for each spatial point and represents the 3D Earth surface.
The afforestation information prepared in this study was combined with the land cover map (Ministry of Environment, South Korea) produced using the Landsat satellite images in the late 1990s. The forest area data have been reconstructed using the updated land cover data every year. To make a clear distinction between stock forests and non-stock forests in the forest area, we categorized them as the forest-mixed area and the barren area in the SWAT land cover classification.
The detailed soil map of South Korea was obtained from the RDA. Each soil was classified by soil series, and the basic information such as depth and organic carbon of soil series was provided by the Soil Information System (SIS) of RDA. Other hydrological factors such as bulk density and available water capacity were calculated by specific equations [48].
Model parameters were adjusted based on the 2008 results. Soil loss measurements in Korea are available for the short term; therefore, they are not suitable for long-term simulation studies, such as this one. Instead, soil loss can be estimated by using the discharge flow-total sediment discharge relation curve that can be calculated for each watershed [49]. Therefore, estimated flow values were compared with the observed flow values at the Hapgang station (127°19′10″ E, 36°31′32″ N) and calibrated by the main parameters, Soil Conservation Service (SCS) curve number (CN), soil evaporation compensation coefficient (ESCO) and available water capacity (AWC) that affect soil loss [50,51].
2.4. Evaluation and Sensitivity Analysis
2.4.1. InVEST Model
Sensitivity analysis was performed to estimate the water yield and its response to the variables using the InVEST model. Quantitative observations of the amount of water supplied by forests are not available in Korea; therefore, the gap between precipitation and actual evapotranspiration (AET) is estimated. Water supply potential is the difference between the annual precipitation and AET of the forest area, which means the maximum amount of water that can be supplied by forests. Since precipitation in forests represents the total amount of water input and AET represents the total amount of water used by forests, the difference can be defined as the amount supplied by forests. The accuracy of the trends and water yield levels was confirmed by linear regression analysis for the gap between precipitation and AET and the estimated water yield.
Three key factors were used for the sensitivity analysis of the InVEST model. In the study of Redhead et al. [32], the sensitivity of precipitation and PET and the forest stock data that change every year were used in the analysis. Our analysis was conducted at the main watershed level. The raster data were changed by ±10% and ±20% on average for each variable and applied to the model. The Kc coefficients were excluded from the sensitivity analysis because only the forest area was included in this study.
2.4.2. SWAT Model
In order to evaluate the estimated soil loss results, estimated flow values were compared with the observed values at Hapgang station in 2009 and 2010 for verification. The forest cover map used in this study was based on the currently observed NFI data, so the most recent model values were considered appropriate for evaluation. Owing to the limitations of the SWAT model, sensitivity analysis was not performed because it was not possible to adjust the stock forest area and precipitation intensity, which were the main factors related to soil loss in the input data.
3. Result and Discussion
3.1. Forest Water Supply by the InVEST Model
3.1.1. Evaluation and Sensitivity of the Model Estimate
In this study, meteorological comparative variables were extracted and compared with our results to verify the estimated forest water yield data. The meteorological comparative variable, the gap between precipitation and AET, was defined as the water supply potential in this study. The water supply potential, which is the maximum value that can be supplied by forests, is highly similar to the forest water yield estimated by InVEST-WY (Figure 3). In the linear regression analysis, the determination-square value was 0.99, indicating that the accuracy and correlation were very high. In the absence of water supply observations, estimates made within the calculated water supply data can prove the credibility of the results.
The estimated water yield was the most sensitive to changes in precipitation (Figure 4). A 10% (20%) increase in precipitation increased the mean water yield by 20% (40%). Even when precipitation decreases, the water yield shows a similar level of response. Sensitivity to PET was also relatively high, and PET was inversely related to the water yield (Figure 4). When PET increased by 10% (20%), the water yield decreased by 13% (20%) on average. When PET decreased, water yield increased at a slightly larger rate than when PET increased. Water yield was less sensitive to changes in PET than in precipitation, but this result varied significantly by watershed. Forest stocks are less sensitive to PET or precipitation, but variations by watershed are relatively large because of the differences in forest stock per watershed. In watersheds where the changes were large, the water yield increased by more than 20% with a change of 10% in forest stock. The sensitivity of the changes in the forest stock is relatively low compared to the sensitivity of other variables, but the forest stock is the only factor that can be changed by human activities. Since the water yield was also sensitive to changes in precipitation, the effects of the changes in forest stock should be identified by setting long-term mean values or fixing precipitation.
3.1.2. Estimating Forest Water Yield by Afforestation
Estimates of the forest water yields over the past four decades showed that the annual differences between the water yield values were very large, but the annual average water supply in the decade has doubled. The East Asian Monsoon climate experiences abundant precipitation as reflected in the results of InVEST-WY that are highly sensitive to precipitation. Estimated forest stocks in this study continued to increase until the 2000s, but water yields were the lowest in 1988 (333.46 million m3 y−1) due to higher annual discharge (Figure 5). The decadal average results clearly showed an increase in the time series. The total annual forest water yield was 1276 million m3 y−1 in the 1970s, 1658 million m3 y−1 in the 1980s, 1813 million m3 y−1 in the 1990s and 2220 million m3 y−1 in the 2000s (Table 1). The decadal results show that the water yield increases significantly with forest stock regardless of the variability in precipitation. Although the water yield fluctuation was very large because of the high sensitivity to precipitation, forest stock contributed greatly to long-term changes.
The spatial distribution of the forest water yield also showed an increase in the time series of water yield. A gradual increase in the central forest area, which was very low in the 1970s and 2000s, showed high water yields in most areas (Figure 6). There is no significant difference in the spatial pattern because the regional variations of precipitation and evapotranspiration were not great, although the annual variation of precipitation was large [23]. In particular, in the 1970s, the Nakdong River watershed, the longest river in Korea, showed a very low level of forest water yield, but the water resources of the entirety of south-east Korea showed a significant improvement in the 2000s. The Han River watershed, which is the main water resource for the metropolitan area, has also been greatly improved in recent years, leading to significant changes in the long-term water security.
3.2. Soil Loss by SWAT
3.2.1. Calibration and Validation of SWAT Model
Because soil loss measurements in Korea are available only as short-term data and unsuitable for long-term simulation studies such as this one, flow data were used for evaluating the SWAT model. In comparison with data collected in 2008, the parameters were calibrated so that the R-square of the calibration curve was 0.82. Following calibration, estimated values and observed values of the 2009–2010 period were compared, and an R-square value of 0.80 was calculated, indicating a strong correlation between the model results and observed values. During the 2009 period, the difference between the simulated and observed values is shown (Figure 7). The observed flow values of 2009 were low, considering the relationship between precipitation measurements and flow in other years, suggesting a potential measurement error. If the 2009 values observed were underestimated, the actual and estimated values in other years were similar.
3.2.2. Estimating Soil Loss by Afforestation
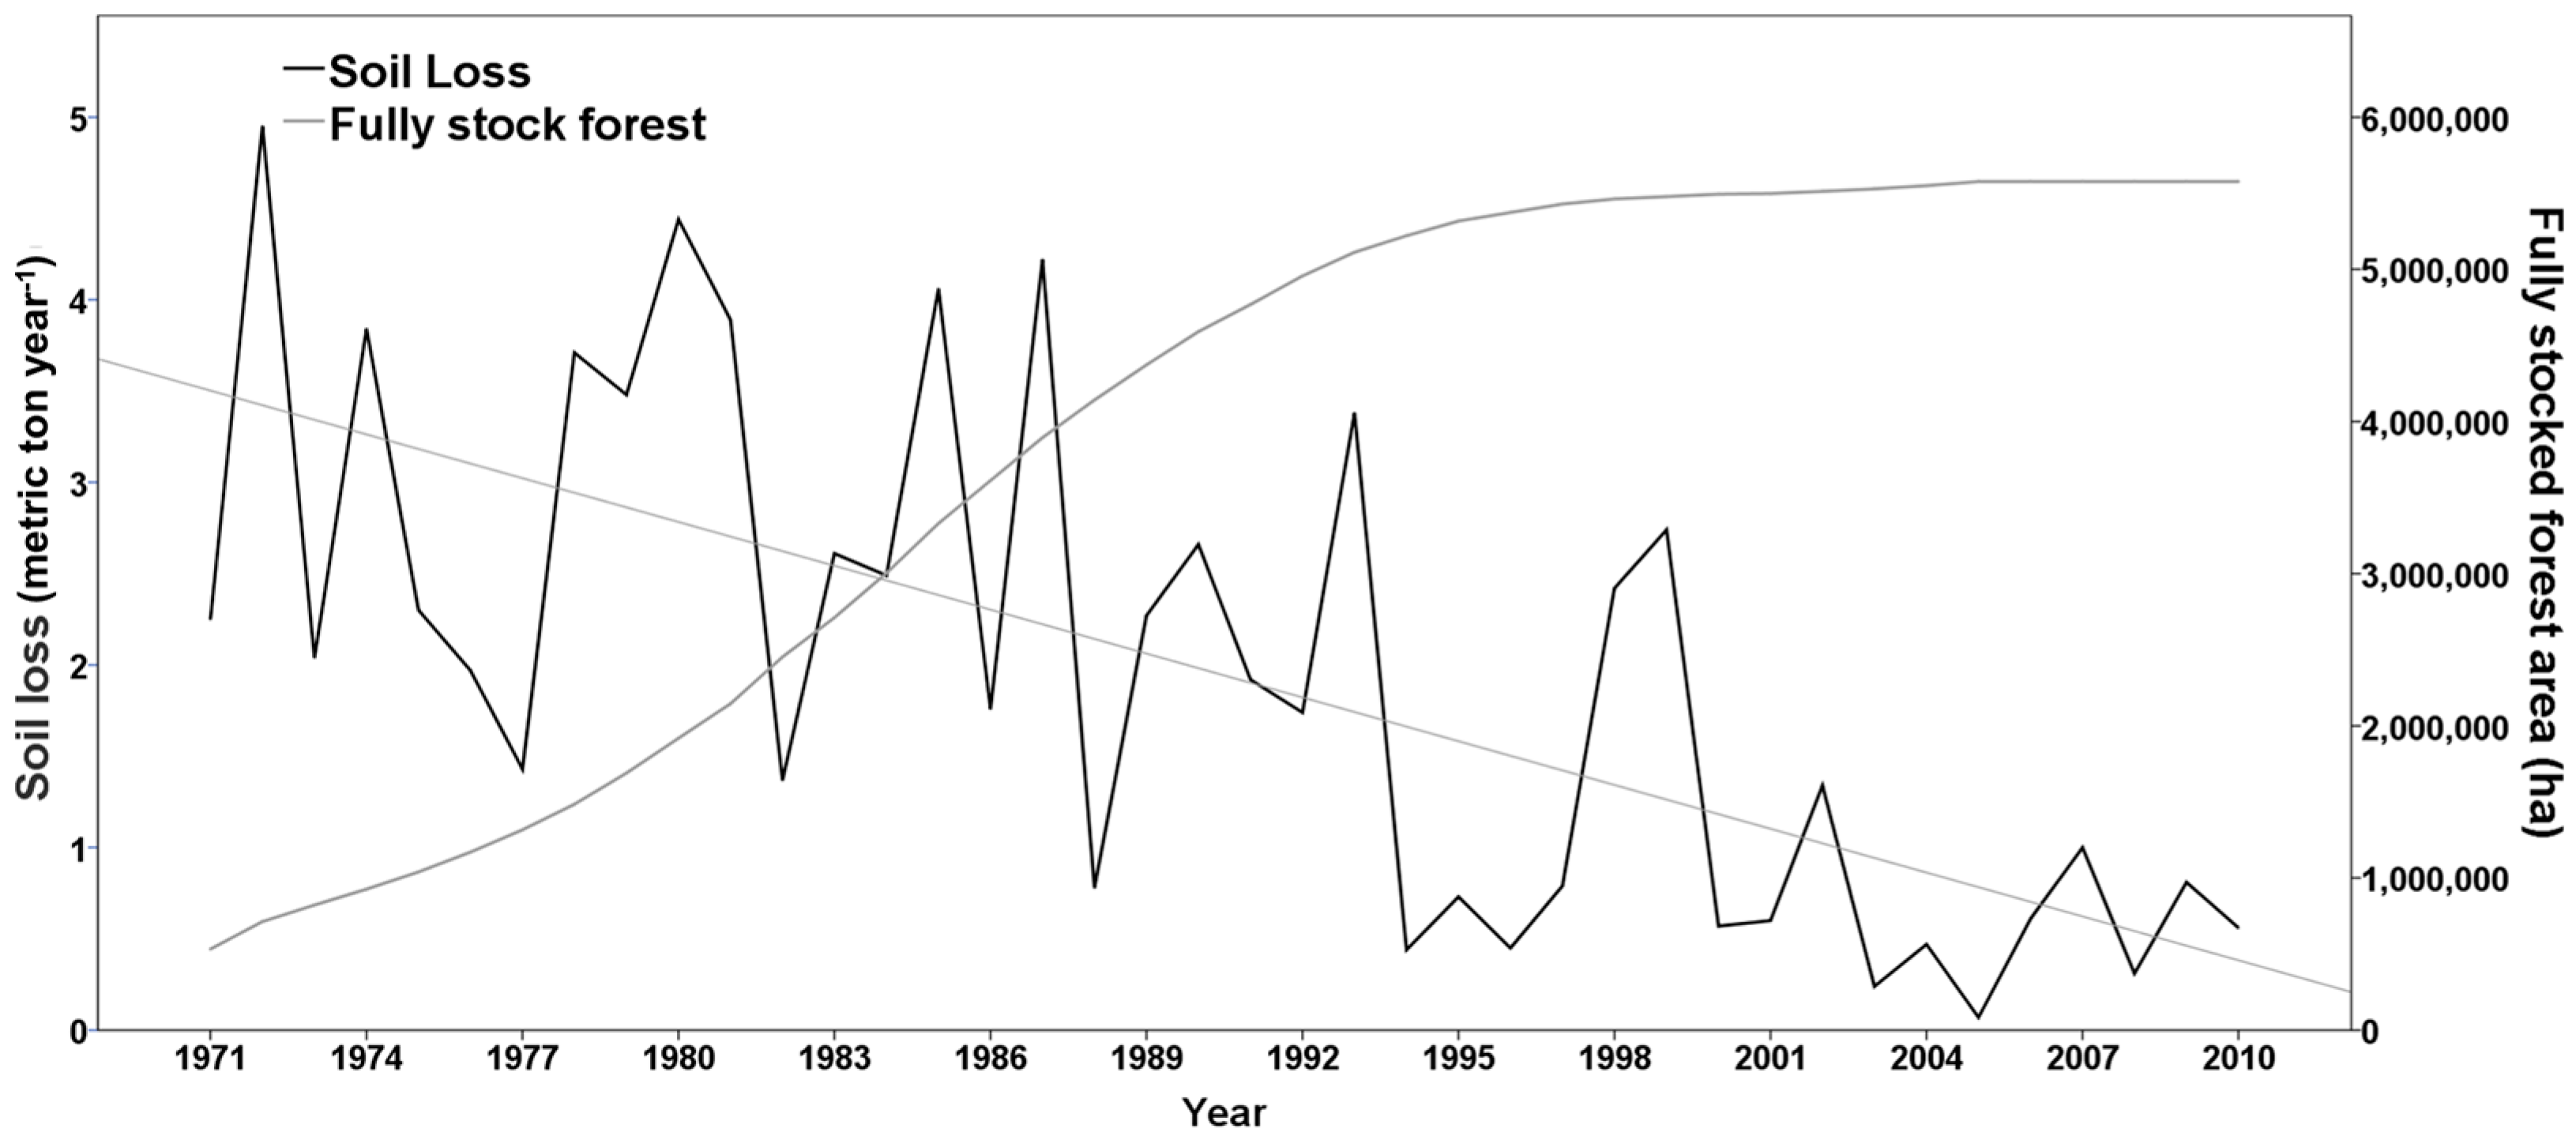
Estimation of soil loss over the past four decades showed that the annual differences in soil loss were very large, but average annual soil loss in the 2000s was one-fifth of the average annual soil loss in the 1970s (Figure 8). In South Korea, rainfall occurs intensively in the summer; therefore, the soil loss also increases in the season. The larger the amount of precipitation in the summer, the larger the annual soil loss. Annual soil loss tended to decline during the study period. Until 2000, there was a large difference in the annual soil loss because the difference in annual precipitation affected the amount of soil loss. However, since 2000, the difference in the annual soil loss has been much smaller, as the forest areas have increased, and the adaptability to precipitation has changed in the soil control areas. A linear regression analysis was performed to identify the overall trends of soil loss. The linear regression equation for the soil loss is y = −0.08x + 196.4 (x = year, y = soil loss), and the R-square value is 0.47, indicating that soil loss in South Korea decreased with increasing forest area.
Figure 9 shows the decadal changes in soil loss by watershed unit in South Korea. Overall, soil loss has decreased; however, the difference between the soil loss estimators was very large according to east and west, because of the difference in slope. Among the five largest basins in South Korea (Han River, Nakdong River, Geum River, Yeongsan River and Sumjin River), Nakdong River showed the highest rate of soil loss, followed by Yeongsan River and Han River. The average slope is lower than the Han River, but because the Yeoungsan River watershed has much agricultural area with high soil loss rates, the amount of soil loss in the Yeoungsan River is relatively high.
3.3. Comparisons of the Effect of Afforestation and Climate Change
The simulation results from 1971–2010 in this study reflected the changes in climate together with the changes in forest stock. To further elucidate the effects of afforestation, we re-estimated the water yield by changing the forest stock or the climate in the simulation (Table 1).
The annual total forest water yield estimate for the climate of the 1970s and the forest stock of 1971 was 1105 million m3 year−1, and for the climate of the 1970s and forest stock of 2005, it was 1581 million m3 year−1. The estimate of the annual total forest water yield for the climate of the 2000s and forest stock of 1971 was 1639 million m3 year−1, and for the climate of the 2000s and forest stock of 2005, it was 2046 million m3 year−1. The forest water yield increased by 43% with the change in the forest stock and by 48% due to climate change. When both were changed, the forest water yield increased by 85% (Figure 10).
The results showed that climate change, i.e., increased precipitation, had a greater impact on forest water yield than on the forest stock, but this was probably caused by high sensitivity to precipitation and the increased regional rains in the 2000s. On the other hand, the forest water yield increased in wider areas when only the forest stock was changed (Figure 10). Especially, in Nakdong and Geum River watersheds, the yield remarkably increased compared to the change in the yield by only changing the climate. The increases in spatial uniformity indicate that forest area can reduce the impact of climate variability and provide stable water resources nationwide. Changes in climate have contributed almost equally to the increases in forest water yields, but afforestation has contributed significantly to the ultimate increase in water supplies.
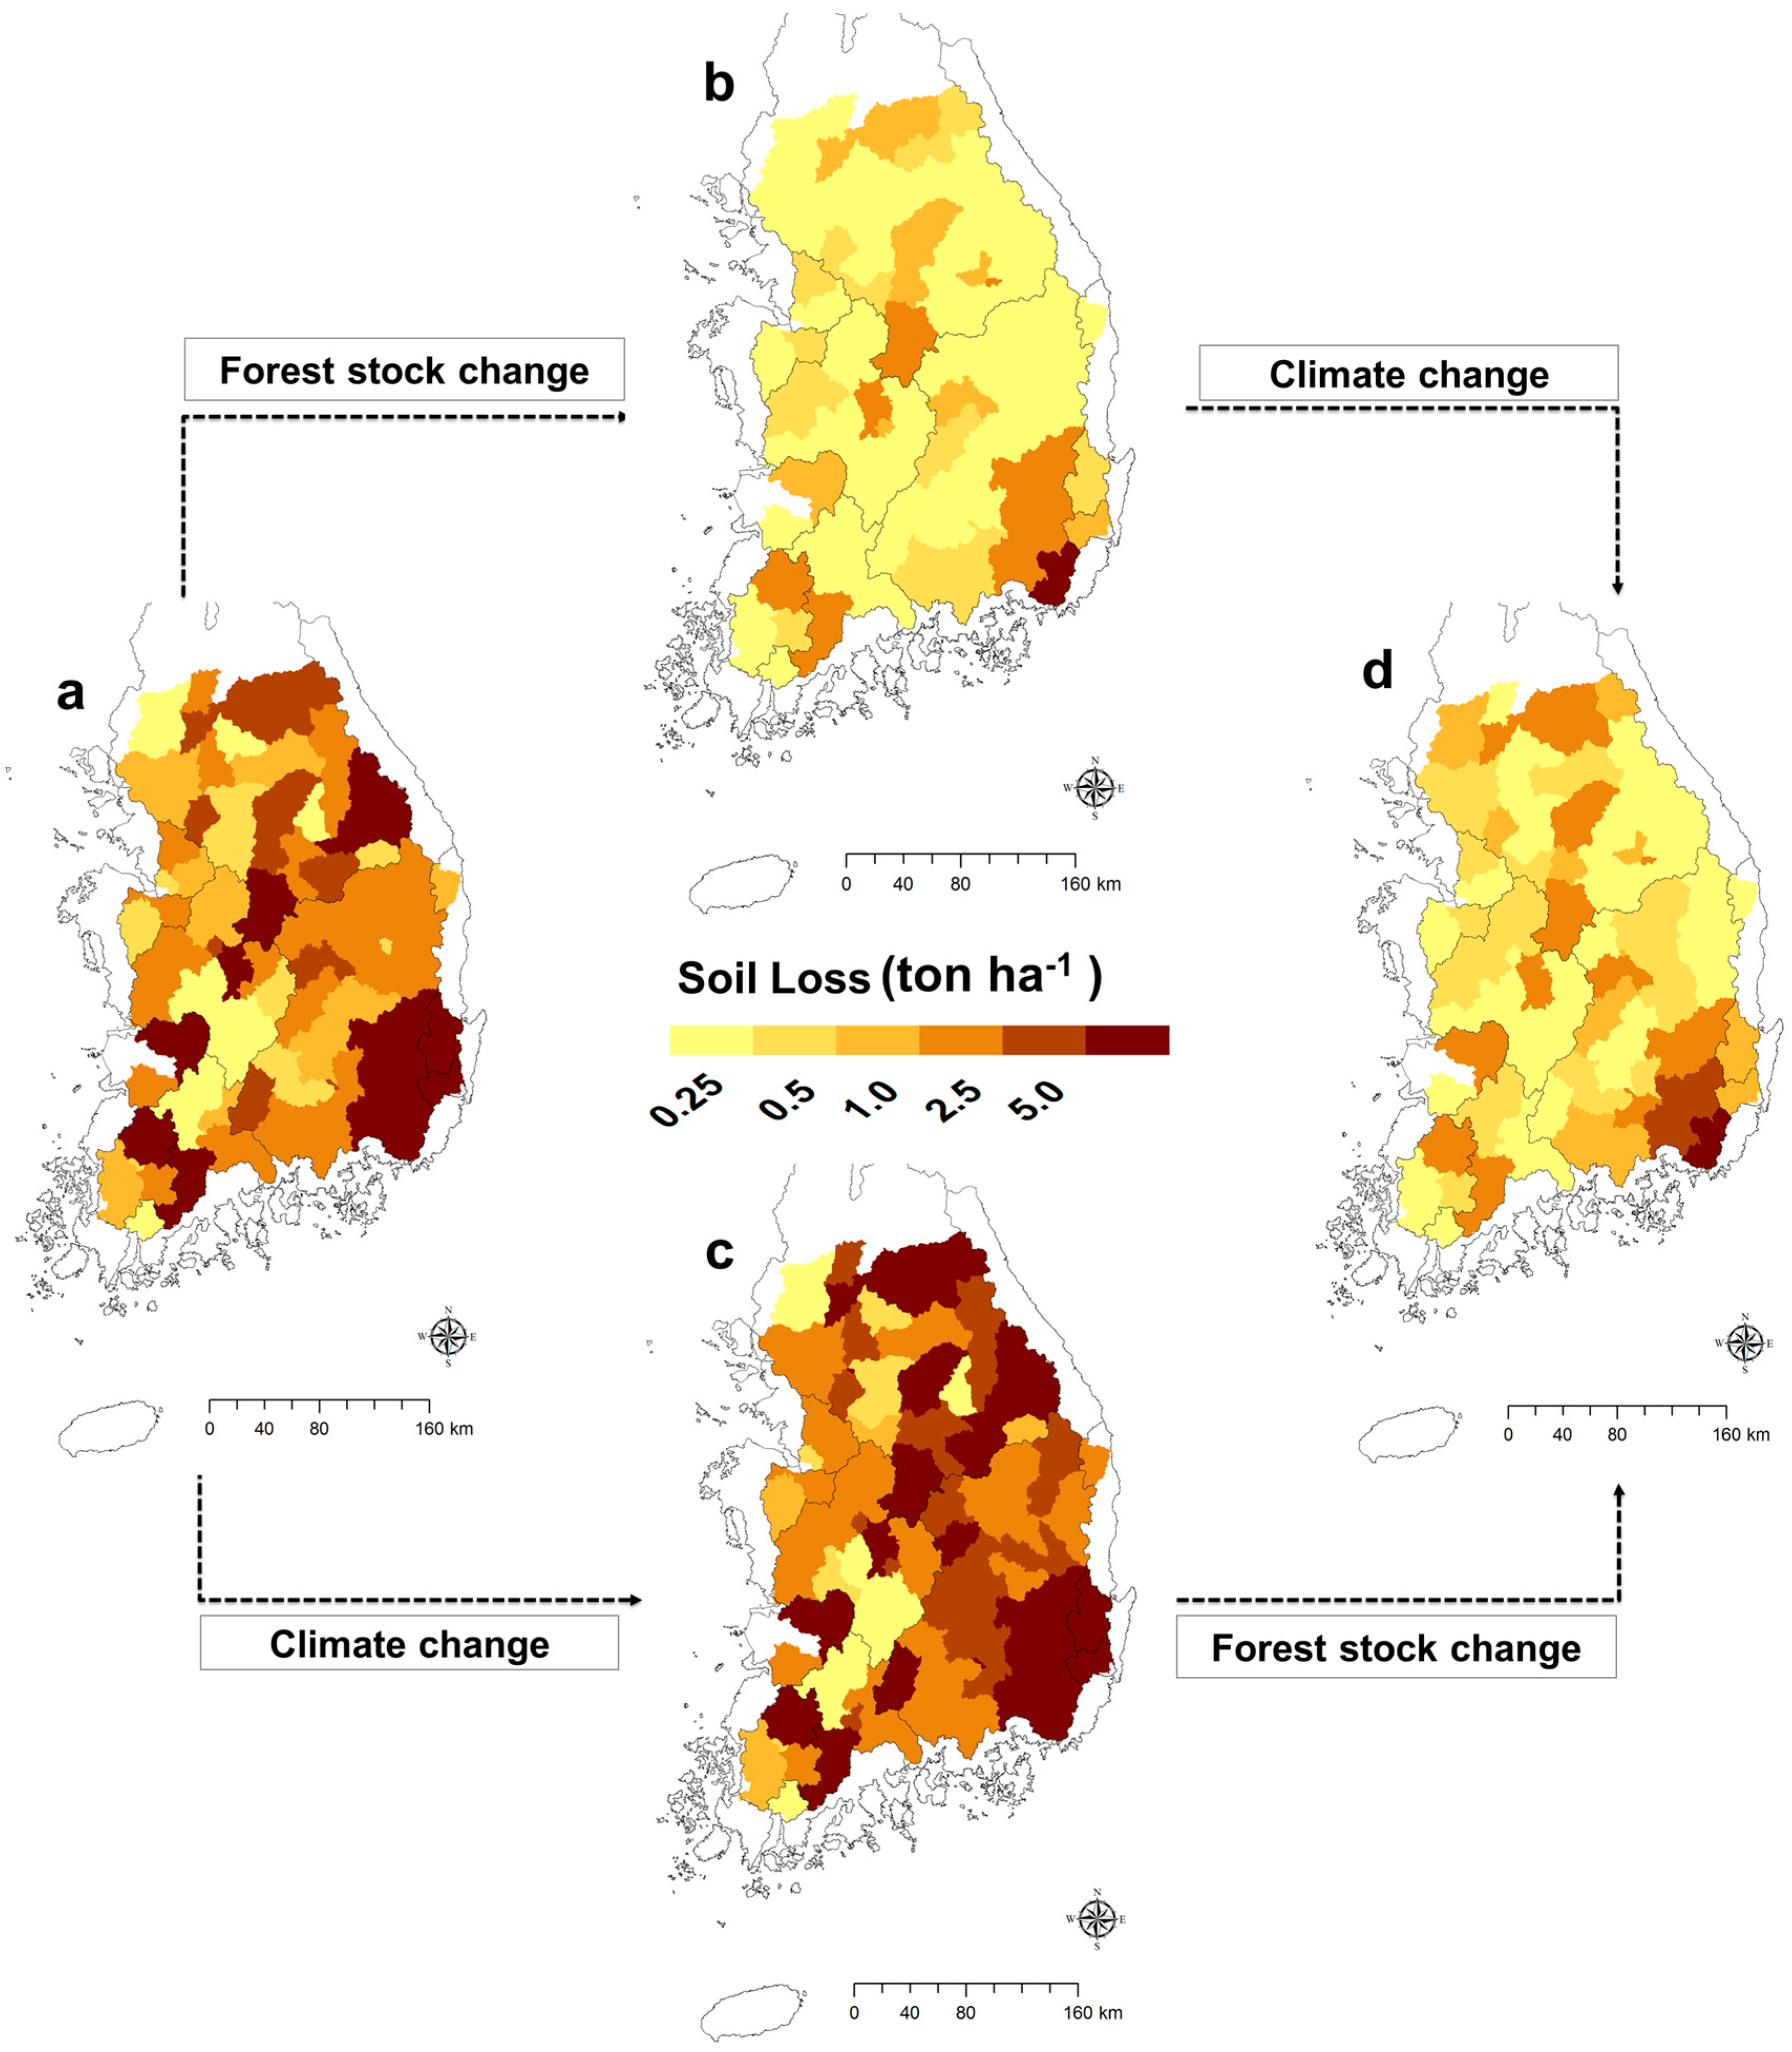
The annual soil loss estimate for the climate of the 1970s and forest stock of 1971 was 3.04 ton ha−1, and for the climate of the 1970s and forest stock of 2005, it was 0.39 ton ha−1. The estimate of the annual soil loss for the climate of the 2000s and forest stock of 1971 was 4.00 ton ha−1, and for the climate of the 2000s and forest stock of 2005, it was 0.60 ton ha−1. The soil loss decreased by 87% due to the changes in forest stock and increased by 33% due to climate change. When both were changed, the soil loss yield decreased by 80% (Figure 11).
Consequently, climate change and afforestation affected the soil loss prevention during the study period. However, afforestation had the greatest effect on the soil loss prevention, and the change in forests had greater impact than climate change. Thus, the national-scale afforestation in South Korea could be a major contributor to the soil loss prevention. In addition, considering the spatial distribution of soil loss, the decrease in soil loss is greater in the east than in the west. This is because the increase in the forest stock in the east is larger than in the west; the soil loss was also spatially different according to the forest stock distribution.
The precipitation increase in the 2000s caused an increase in forest water yield, but it also increased the soil loss. Nevertheless, changes in the forest stock have been instrumental in promoting forest water yield and soil loss prevention, while at the same time reducing the soil loss rates.
3.4. Implications of National Scale Afforestation to Other Regions
Forests have a variety of environmental functions, including the ability to provide water for forests. Water yield is one of the concepts of water supply, and forest water yield can be seen as a concept explaining water supply in forests. There is an on-going debate of forest cover-water yield. This is mainly whether forest cover will increase or reduce water yield. Previous studies that estimated the amount of water resources or the supply service of the Korean forestry [3,52,53] focused on assessing the current supply of water. On supply-side thinking, afforestation will raise water supply and strengthen the hydrological cycle [54]. Furthermore, vegetation destruction and land cover change resulting from deforestation could be the main cause of soil degradation and soil loss [41,55]. Forests affect soil loss prevention, because thick forest litter and extensive root systems of forest capture raindrops, store rainwater and release water through seepage at non-erosive velocities [56]. Particularly, because the change of the forest stock in South Korea is very huge [24], it was expected to have a great impact on the prevention of soil loss. Therefore, afforestation is frequently one of the most appropriate ways to reduce soil erosion [57,58].
The factors that determine the forest water yield of the InVEST model are mostly factors controlled by nature, but the vegetation factor can be controlled by human activities. Furthermore, the factors of MUSLE that can be controlled by human activities are the vegetation factor and the support practice factor. Since the support practice factor is only controlled in the area where humans can reach, the vegetation factor is the only factor that can easily affect both forest water yield and soil loss. Additionally, the method that can effectively increase the vegetation factor of these two models is afforestation. Therefore, afforestation is a method that can easily control water supply and soil loss even among other human activities.
Today, 60% of the area of South Korea is forest area, and total stocking volume shows an enormous increase from 63.75 million m3 in 1967 to 924.81 million m3 in 2015 [24]. In this context, analyzing the experience of South Korea and quantifying ecosystem services of afforestation activities are expected to provide useful lessons for other countries. In this study, we have observed that forest water yield and soil loss prevention are related to forest growth, but there are also a number of environmental functions that increase with the increase in forests. Forest basically provides harvest wood and natural product, which can provide economic benefits. As the role of carbon pools, forest carbon in South Korea has now doubled since the 1950s, and the proportion of biomass has increased significantly [10]. Forests also have an air-purifying function and can act to purify chemical substances such as nitrogen oxides, sulfur oxides and semi-volatile organic compounds [59,60]. This implies that various environmental functions and benefits can be obtained by afforestation.
As noted in FAO [6], only four countries have successfully afforested forests since World War II. In particular, most of the mid-latitude region except for America and Europe is deforested. If national afforestation is carried out in the mid-latitude region, as mentioned above, there will be many benefits in addition to forest water yield and soil loss prevention. Especially, as the economic paradigm shifts, environmental functions and ecosystem services become increasingly valuable, and the potential of the benefits that afforestation will bring will be even higher.
4. Conclusions
The national-scale afforestation program in South Korea is one of the few successful programs that has greatly improved the functional dimension of forest ecosystems. The key findings of this study are summarized as follows.
The forest water yield using the InVEST-WY model increased by about twice the amount with changes in the forest stock and climate from 1971–2010 and showed a spatially-uniform water supply capacity. In the same period, the estimated soil loss using the SWAT model decreased more than three times.
The analysis of the change in forest stock without considering climate change showed that the forest water yield increased by 30%, and the soil loss decreased by 87%. An increase in precipitation showed a positive change in water yield levels, but it led to an increase in soil loss volume. A change in forest stock led to a positive change in both parameters. This means that national-scale afforestation positively affects the forest water yield and soil loss prevention in one country.
This study analyzed the spatio-temporal effects of the national-scale afforestation program. As a result, it provides the functional positive effects of the program for the other applications. Therefore, the afforestation program in South Korea is a precedent for future afforestation projects and could be applied on dry land and desolate areas in the mid-latitude region and in North Korea. In addition, the benefit analysis considering the cost of the afforestation project would complement the results of this study and reveal the economic implications of future afforestation projects.
Supplementary Files
Supplementary File 1Acknowledgments
This study was supported by the Korean Ministry of Environment as part of the “Climate Change Correspondence Program” (Project Number 2014001310008) and the Korean Ministry of Oceans and Fisheries as part of the “Development of satellite based ocean carbon flux model for seas around Korea” (Project Number 20130270). We also thank the UNDP (United Nations Development Programme) Seoul Policy Centre for their co-operation.
Author Contributions
Gas Sun Kim and Chul-Hee Lim designed this research, analyzed the result and wrote the paper. Sea Jin Kim and Jongyeol Lee participated in the review and analyzed the results together. All authors including Yowhan Son and Woo-Kyun Lee gave comments and approved the final manuscript.
Conflicts of Interest
The authors declare no conflict of interest.
References
- Sahin, V.; Hall, M.J. The effects of afforestation and deforestation on water yields. J. Hydrol. 1996, 178, 293–309. [Google Scholar] [CrossRef]
- Paul, K.I.; Polglase, P.J.; Nyakuengama, J.G.; Khanna, P.K. Change in soil carbon following afforestation. For. Ecol. Manag. 2002, 168, 241–257. [Google Scholar] [CrossRef]
- Farley, K.A.; Jobbágy, E.G.; Jackson, R.B. Effects of afforestation on water yield: A global synthesis with implications for policy. Glob. Chang. Biol. 2005, 11, 1565–1576. [Google Scholar] [CrossRef]
- Aide, T.M.; Clark, M.L.; Grau, H.R.; López-Carr, D.; Levy, M.A.; Redo, D.; Muñiz, M. Deforestation and reforestation of Latin America and the Caribbean (2001–2010). Biotropica 2013, 45, 262–271. [Google Scholar] [CrossRef]
- Kim, D.; Lim, C.H.; Song, C.; Lee, W.K.; Piao, D.; Heo, S.; Jeon, S. Estimation of future carbon budget with climate change and reforestation scenario in North Korea. Adv. Space Res. 2016, 58, 1002–1016. [Google Scholar] [CrossRef]
- Gregersen, H.M. Village Forestry Development in the Republic of Korea. A Case Study; FAO: Rome, Italy, 1982. [Google Scholar]
- Creed, I.F.; Spargo, A.T.; Jones, J.A.; Buttle, J.M.; Adams, M.B.; Beall, F.D.; Green, M.B. Changing forest water yields in response to climate warming: Results from long-term experimental watershed sites across North America. Glob. Chang. Biol. 2014, 20, 3191–3208. [Google Scholar] [CrossRef] [PubMed]
- Lu, C.; Zhao, T.; Shi, X.; Cao, S. Ecological restoration by afforestation may increase groundwater depth and create potentially large ecological and water opportunity costs in arid and semiarid China. J. Clean. Prod. 2016, in press. [Google Scholar] [CrossRef]
- Song, M.; Bae, J.S.; Seol, M.H. Development of the Forest Carbon Sink Index on Afforestation and Reforestation Activities. J. Korean For. Soc. 2014, 103, 137–146. [Google Scholar] [CrossRef]
- Lee, J.; Yoon, T.K.; Han, S.; Kim, S.; Yi, M.J.; Park, G.S.; Kim, S.; Son, Y.M.; Kim, R.; Son, Y. Estimating the carbon dynamics of South Korean forests from 1954 to 2012. Biogeosciences 2014, 11, 4637–4650. [Google Scholar] [CrossRef]
- Park, H.; Lee, J.Y.; Song, M. Scientific activities responsible for successful forest greening in Korea. For. Sci. Technol. 2017, 13, 1–8. [Google Scholar] [CrossRef]
- The Economics of Ecosystems and Biodiversity (TEEB). The Economics of Ecosystems and Biodiversity Ecological and Economic Foundations; Kumar, P., Ed.; Earthscan: London, UK; Washington, DC, USA, 2010. [Google Scholar]
- Gao, J.; Li, F.; Gao, H.; Zhou, C.; Zhang, X. The impact of land-use change on water-related ecosystem services: A study of the Guishui River Basin, Beijing, China. J. Clean. Prod. 2016, in press. [Google Scholar] [CrossRef]
- Kim, J.H.; Kim, K.D.; Kim, R.H.; Park, C.Y.; Yoon, H.J.; Lee, S.W.; Choi, H.T.; Kim, J.J. A Study on the Estimation and the Evaluation Methods of Public Function of Forest, Research Report 10–26; Korea Forest Research Institute(later called as National Institute of Forest Service (NIFoS)): Seoul, Korea, 2010.
- National Institute of Forest Science (NIFoS). Causes of Forest Degradation and Drivers of Forest Recovery in South Korea; NIFoS: Seoul, Korea, 2010.
- Bangash, R.F.; Passuello, A.; Sanchez-Canales, M.; Terrado, M.; López, A.; Elorza, F.J.; Schuhmacher, M. Ecosystem services in Mediterranean river basin: Climate change impact on water provisioning and erosion control. Sci. Total Environ. 2013, 458, 246–255. [Google Scholar] [CrossRef] [PubMed]
- De Groot, R.S.; Wilson, M.A.; Boumans, R.M. A typology for the classification, description and valuation of ecosystem functions, goods and services. Ecol. Econ. 2002, 41, 393–408. [Google Scholar] [CrossRef]
- Millennium Ecosystem Assessment. Ecosystems and Human Well-being: Synthesis; Island Press: Washington, DC, USA, 2005. [Google Scholar]
- Kim, J.H.; Kim, R.H.; Youn, H.J.; Lee, S.W.; Choi, H.T.; Kim, J.J.; Park, C.R.; Kim, K.D. Valuation of nonmarket forest resources. J. Korean Inst. For. Recreat. 2012, 16, 9–18. [Google Scholar]
- Jung, Y.G.; Lee, S.W.; Lee, K.H.; Park, K.Y.; Lee, H.H. Application of RUSLE and MUSLE for prediction of soil loss in small mountainous basin. J. Korean For. Soc. 2014, 103, 98–104. [Google Scholar] [CrossRef]
- Jang, C.; Shin, Y.; Kum, D.; Kim, R.; Yang, J.E.; Kim, S.C.; Jung, Y. Assessment of soil loss in South Korea based on land-cover type. Stoch. Environ. Res. Risk Assess. 2015, 29, 2127–2141. [Google Scholar] [CrossRef]
- Ewane, B.E.; Lee, H.H. Influence of vegetation cover and other sources of variability on sediment and runoff response in a burned forest in South Korea. J. Mt. Sci. 2017, 14, 296–315. [Google Scholar] [CrossRef]
- Korea Meteorological Administration. Available online: http://www.kma.go.kr/weather/climate/average_south.jsp (accessed on 7 April 2017).
- Korea Forest Service (KFS). Statistical Yearbooks of Forestry (1968–2010); KFS: Daejeon, Korea, 1968–2010.
- National Institute of Forest Service (NIFoS). The 5th National Forest Inventory Report; NIFOS: Seoul, Korea, 2011. (In Korean)
- Bagstad, K.J.; Semmens, D.J.; Winthrop, R. Comparing approaches to spatially explicit ecosystem service modeling: A case study from the San Pedro River, Arizona. Ecosyst. Serv. 2013, 5, 40–50. [Google Scholar] [CrossRef]
- Zhou, G.; Wei, X.; Chen, X.; Zhou, P.; Liu, X.; Xiao, Y.; Su, Y. Global pattern for the effect of climate and land cover on water yield. Nat. Commun. 2015, 6. [Google Scholar] [CrossRef] [PubMed]
- Dennedy-Frank, P.J.; Muenich, R.L.; Chaubey, I.; Ziv, G. Comparing two tools for ecosystem service assessments regarding water resources decisions. J. Environ. Manag. 2016, 177, 331–340. [Google Scholar] [CrossRef] [PubMed]
- Elliott, K.J.; Caldwell, P.V.; Brantley, S.T.; Miniat, C.F.; Vose, J.M.; Swank, W.T. Water yield following forest-grass-forest transitions. Hydrol. Earth Syst. Sci. 2017, 21, 981. [Google Scholar] [CrossRef]
- Sharp, R.; Tallis, H.T.; Ricketts, T.; Guerry, A.D.; Wood, S.A.; Chaplin-Kramer, R.; Nelson, E.; Ennaanay, D.; Wolny, S.; Olwero, N.; et al. InVEST 3.2.0 User’s Guide; The Natural Capital Project: Stanford, CA, USA, 2015. [Google Scholar]
- Boithias, L.; Acuña, V.; Vergoñós, L.; Ziv, G.; Marcé, R.; Sabater, S. Assessment of the water supply: Demand ratios in a Mediterranean basin under different global change scenarios and mitigation alternatives. Sci. Total Environ. 2014, 470, 567–577. [Google Scholar] [CrossRef] [PubMed]
- Redhead, J.W.; Stratford, C.; Sharps, K.; Jones, L.; Ziv, G.; Clarke, D.; Bullock, J.M. Empirical validation of the InVEST water yield ecosystem service model at a national scale. Sci. Total Environ. 2016, 569, 1418–1426. [Google Scholar] [CrossRef] [PubMed]
- Song, C.H.; Lee, W.K.; Choi, H.A.; Jeon, S.W.; Kim, J.U.; Kim, J.S.; Kim, J.T. Application of InVEST water yield model for assessing forest water provisioning ecosystem service. J. Korean Assoc. Geogr. Inf. Stud. 2015, 18, 120–134. [Google Scholar] [CrossRef]
- Cho, H.W.; Song, C.H.; Jeon, S.W.; Kim, J.S.; Lee, W.K. Evaluation of the spatial distribution of water yield service based on precipitation and population. J. Korean Assoc. Geogr. Inf. Stud. 2016, 19, 1–15. [Google Scholar] [CrossRef]
- Yun, J.I.; Choi, J.Y.; Ahn, J.H. Seasonal trend of elevation effect on daily air temperature in Korea. Korean J. Agric. For. Meteorol. 2001, 17, 35–44. [Google Scholar]
- Jeon, S.W.; Kim, J.; Jung, H. A study on the forest classification for ecosystem services valuation – focused on forest type map and landcover Map. J. Korea Soc. Environ. Restor. Technol. 2013, 16, 31–39. [Google Scholar] [CrossRef]
- Canadell, J.; Jackson, R.B.; Ehleringer, J.B.; Mooney, H.A.; Sala, O.E.; Schulze, E.-D. Maximum rooting depth of vegetation types at the global scale. Oecologia 1996, 108, 583–595. [Google Scholar] [CrossRef] [PubMed]
- Yoon, T.H. Eco-Environmental Hydraulics; Cheong Moon Gak: Seoul, Korea, 2003. [Google Scholar]
- Donohue, R.J.; Roderick, M.L.; McVicar, T.R. Roots, storms and soil pores: Incorporating key ecohydrological processes into Budyko’s hydrological model. J. Hydrol. 2012, 436–437, 35–50. [Google Scholar] [CrossRef]
- Hamel, P.; Guswa, A.J. Uncertainty analysis of a spatially explicit annual water-balance model: Case study of the Cape Fear basin, North Carolina. Hydrol. Earth Syst. Sci. 2015, 19, 839–853. [Google Scholar] [CrossRef]
- Zheng, F.L. Effect of Vegetation Changes on Soil Erosion on the Loess Plateau11Project supported by the Chinese Academy of Sciences (No. KZCX3-SW-422) and the National Natural Science Foundation of China (No. 9032001 and 40335050). Pedosphere 2006, 16, 420–427. [Google Scholar] [CrossRef]
- Wischmeier, W.H.; Smith, D.D. Predicting Rainfall-Erosion Losses from Cropland East of the Rocky Mountains; Agriculture Handbook 282; USDA-ARS: Washington, DC, USA, 1965.
- Wischmeier, W.H.; Smith, D.D. Predicting Rainfall Losses: A Guide to Conservation Planning; USDA Agricultural Handbook No. 537; U.S. Government Printing Office: Washington, DC, USA, 1965.
- Williams, J.R. Sediment-yield prediction with universal equation using runoff energy factor. In Present and Prospective Technology for Predicting Sediment Yield and Sources, Proceedings of the Sedimentyield Workshop, USDA Sedimentation Laboratory, Oxford, MS, USA, 28–30 November 1972; ARS-S-40; USDA-ARS: Washington, DC, USA, 1975; pp. 244–252. [Google Scholar]
- Gassman, P.W.; Reyes, M.R.; Green, C.H.; Arnold, J.G. The soil and water assessment tool: Historical development, applications, and future research directions. Invited Review Series. Trans. Am. Soc. Agric. Biol. Eng. 2007, 50, 1211–1250. [Google Scholar]
- Phuong, T.T.; Thong, C.V.T.; Ngoc, N.B.; Van Chuong, H. Modeling Soil Erosion within Small Moutainous Watershed in Central Vietnam Using GIS and SWAT. Resource Environ. 2014, 4, 139–147. [Google Scholar]
- Schiffer, R.; Klik, A.; Strohmeier, S.; Srinivasan, R. Simulation of surface runoff and soil erosion in small watersheds in Northern Ethiopia-application and verification of the SWAT model. In Proceedings of the EGU General Assembly Conference Abstracts, Vienna, Austria, 12–17 April 2015; Volume 17, p. 3438. [Google Scholar]
- Ministry of Science and Technology, Korea Institute of Civil Engineering and Building Technology (KICT). Development of Analysing System for Surface Water Hydrological Components—Sustainable Water Resources Research Program; Ministry of Science and Technology: Gwacheon, Korea, 2007. (In Korean)
- Lee, J.S.; Lee, M.H.; Son, H.G. A study on analysis of discharge and sediment for the stream in Korea. Korea Water Resour. Assoc. 2013, 5, 494–498. [Google Scholar]
- Arnold, J.G.; Moriasi, D.N.; Gassman, P.W.; Abbaspour, K.C.; White, M.J.; Srinivasan, R.; Santhi, C.; Harmel, R.D.; Van Griensven, A.; Van Liew, M.W.; et al. SWAT: Model Use, Calibration, and Validation. Trans. ASABE 2015, 55, 1491–1508. [Google Scholar] [CrossRef]
- Yesuf, H.M.; Assen, M.; Alamirew, T.; Melesse, A.M. Modeling of sediment yield in Maybar gauged watershed using SWAT, northeast Ethiopia. Catena 2015, 127, 191–205. [Google Scholar] [CrossRef]
- Bosch, J.M.; Hewlett, J.D. A review of catchment experiments to determine the effect of vegetation changes on water yield and evapotranspiration. J. Hydrol. 1982, 55, 3–23. [Google Scholar] [CrossRef]
- Liu, M.; Tian, H.; Chen, G.; Ren, W.; Zhang, C.; Liu, J. Effects of Land-Use and Land-Cover Change on Evapotranspiration and Water Yield in China during 1900–2001. J. Am. Water Resour. Assoc. 2008, 44, 1193–1207. [Google Scholar] [CrossRef]
- Ellison, D.N.; Futter, M.; Bishop, K. On the forest cover-water yield debate: From demand-to supply-side thinking. Glob. Chang. Biol. 2012, 18, 806–820. [Google Scholar] [CrossRef]
- Van Rompaey, A.J.; Govers, G.; Puttemans, C. Modelling land use changes and their impact on soil erosion and sediment supply to rivers. Earth Surf. Process. Landf. 2002, 27, 481–494. [Google Scholar] [CrossRef]
- Blanco-Canqui, H.; Lal, R. Soil erosion under forest. In Principles of Soil Conservation and Management; Springer: Dordrecht, The Netherlands, 2010; pp. 321–344. [Google Scholar]
- Zhou, Z.C.; Shangguan, Z.P.; Zhao, D. Modelling vegetation coverage and soil erosion in the Loess Plateau Area of China. Ecol. Model. 2006, 198, 263–268. [Google Scholar] [CrossRef]
- Porto, P.; Walling, D.E.; Callegari, G. Investigating the effects of afforestation on soil erosion and sediment mobilisation in two small catchments in Southern Italy. Catena 2009, 79, 181–188. [Google Scholar] [CrossRef]
- Terzaghi, E.; Wild, E.; Zacchello, G.; Cerabolini, B.E.; Jones, K.C.; Di Guardo, A. Forest filter effect: Role of leaves in capturing/releasing air particulate matter and its associated PAHs. Atmos. Environ. 2013, 74, 378–384. [Google Scholar] [CrossRef]
- Song, C.H.; Lee, W.K.; Choi, H.A.; Kim, J.; Jeon, S.W.; Kim, J.S. Spatial assessment of ecosystem functions and services for air purification of forests in South Korea. Environ. Sci. Policy 2016, 63, 27–34. [Google Scholar] [CrossRef]
Figure 1.
Main watersheds in study area.

Figure 2.
Forest stock change map during the past four decades.

Figure 3.
Evaluation of estimated forest water yield ((a) annual water supply potential, (b) linear regression of water supply potential and estimated forest water yield). AET, actual evapotranspiration.
Figure 3.
Evaluation of estimated forest water yield ((a) annual water supply potential, (b) linear regression of water supply potential and estimated forest water yield). AET, actual evapotranspiration.

Figure 4.
Sensitivity of the InVEST Water Yield model to variations in key input parameters for 20 main watersheds ((a) water yield-precipitation, (b) water yield-PET, (c) water yield-forest stock).
Figure 4.
Sensitivity of the InVEST Water Yield model to variations in key input parameters for 20 main watersheds ((a) water yield-precipitation, (b) water yield-PET, (c) water yield-forest stock).

Figure 5.
Estimated result of time series forest water yield and stocked forest area.

Figure 6.
Spatial distribution of forest water yield in each decade.

Figure 7.
Calibration (2008) and validation (2009–2010) of the flow values to evaluate the simulation results.
Figure 7.
Calibration (2008) and validation (2009–2010) of the flow values to evaluate the simulation results.

Figure 8.
Estimated result of time series soil loss and stocked forest area.

Figure 9.
Spatial distribution of soil loss in each decade.

Figure 10.
Spatial distribution of the change in forest water yield from forest stock change and climate change ((a) 1971-forest stock and 1970s climate, (b) 2005-forest stock and 1970s climate, (c) 1971-forest stock and 2000s climate, (d) 2005-forest stock and 2000s climate).
Figure 10.
Spatial distribution of the change in forest water yield from forest stock change and climate change ((a) 1971-forest stock and 1970s climate, (b) 2005-forest stock and 1970s climate, (c) 1971-forest stock and 2000s climate, (d) 2005-forest stock and 2000s climate).

Figure 11.
Spatial distribution of the change in soil loss from forest stock change and climate change ((a): 1971-forest stock and 1970s climate, (b) 2005-forest stock and 1970s climate, (c) 1971-forest stock and 2000s climate, (d) 2005-forest stock and 2000s climate).
Figure 11.
Spatial distribution of the change in soil loss from forest stock change and climate change ((a): 1971-forest stock and 1970s climate, (b) 2005-forest stock and 1970s climate, (c) 1971-forest stock and 2000s climate, (d) 2005-forest stock and 2000s climate).


Table 1.
Decadal results of water yield and soil loss with key changing factors.
| Period | Precipitation (mm) | Forest Stock (million m3) | Water Yield (million m3 year−1) | Soil Loss (ton ha−1) |
|---|---|---|---|---|
| 1970s | 1253 | 102.18 | 1276.42 | 3.041 |
| 1980s | 1304 | 191.74 | 1658.73 | 2.611 |
| 1990s | 1260 | 324.16 | 1813.64 | 1.518 |
| 2000s | 1317 | 564.66 | 2220.95 | 0.601 |
© 2017 by the authors. Licensee MDPI, Basel, Switzerland. This article is an open access article distributed under the terms and conditions of the Creative Commons Attribution (CC BY) license (http://creativecommons.org/licenses/by/4.0/).
Share and Cite
MDPI and ACS Style
Kim, G.S.; Lim, C.-H.; Kim, S.J.; Lee, J.; Son, Y.; Lee, W.-K. Effect of National-Scale Afforestation on Forest Water Supply and Soil Loss in South Korea, 1971–2010. Sustainability 2017, 9, 1017. https://doi.org/10.3390/su9061017
AMA Style
Kim GS, Lim C-H, Kim SJ, Lee J, Son Y, Lee W-K. Effect of National-Scale Afforestation on Forest Water Supply and Soil Loss in South Korea, 1971–2010. Sustainability. 2017; 9(6):1017. https://doi.org/10.3390/su9061017
Chicago/Turabian StyleKim, Gang Sun, Chul-Hee Lim, Sea Jin Kim, Jongyeol Lee, Yowhan Son, and Woo-Kyun Lee. 2017. "Effect of National-Scale Afforestation on Forest Water Supply and Soil Loss in South Korea, 1971–2010" Sustainability 9, no. 6: 1017. https://doi.org/10.3390/su9061017
Note that from the first issue of 2016, this journal uses article numbers instead of page numbers. See further details here.