
Public Participatory Mapping of Cultural Ecosystem Services: Citizen Perception and Park Management in the Parco Nord of Milan (Italy)

 ,
,
Abstract
:1. Introduction
2. Materials and Methods
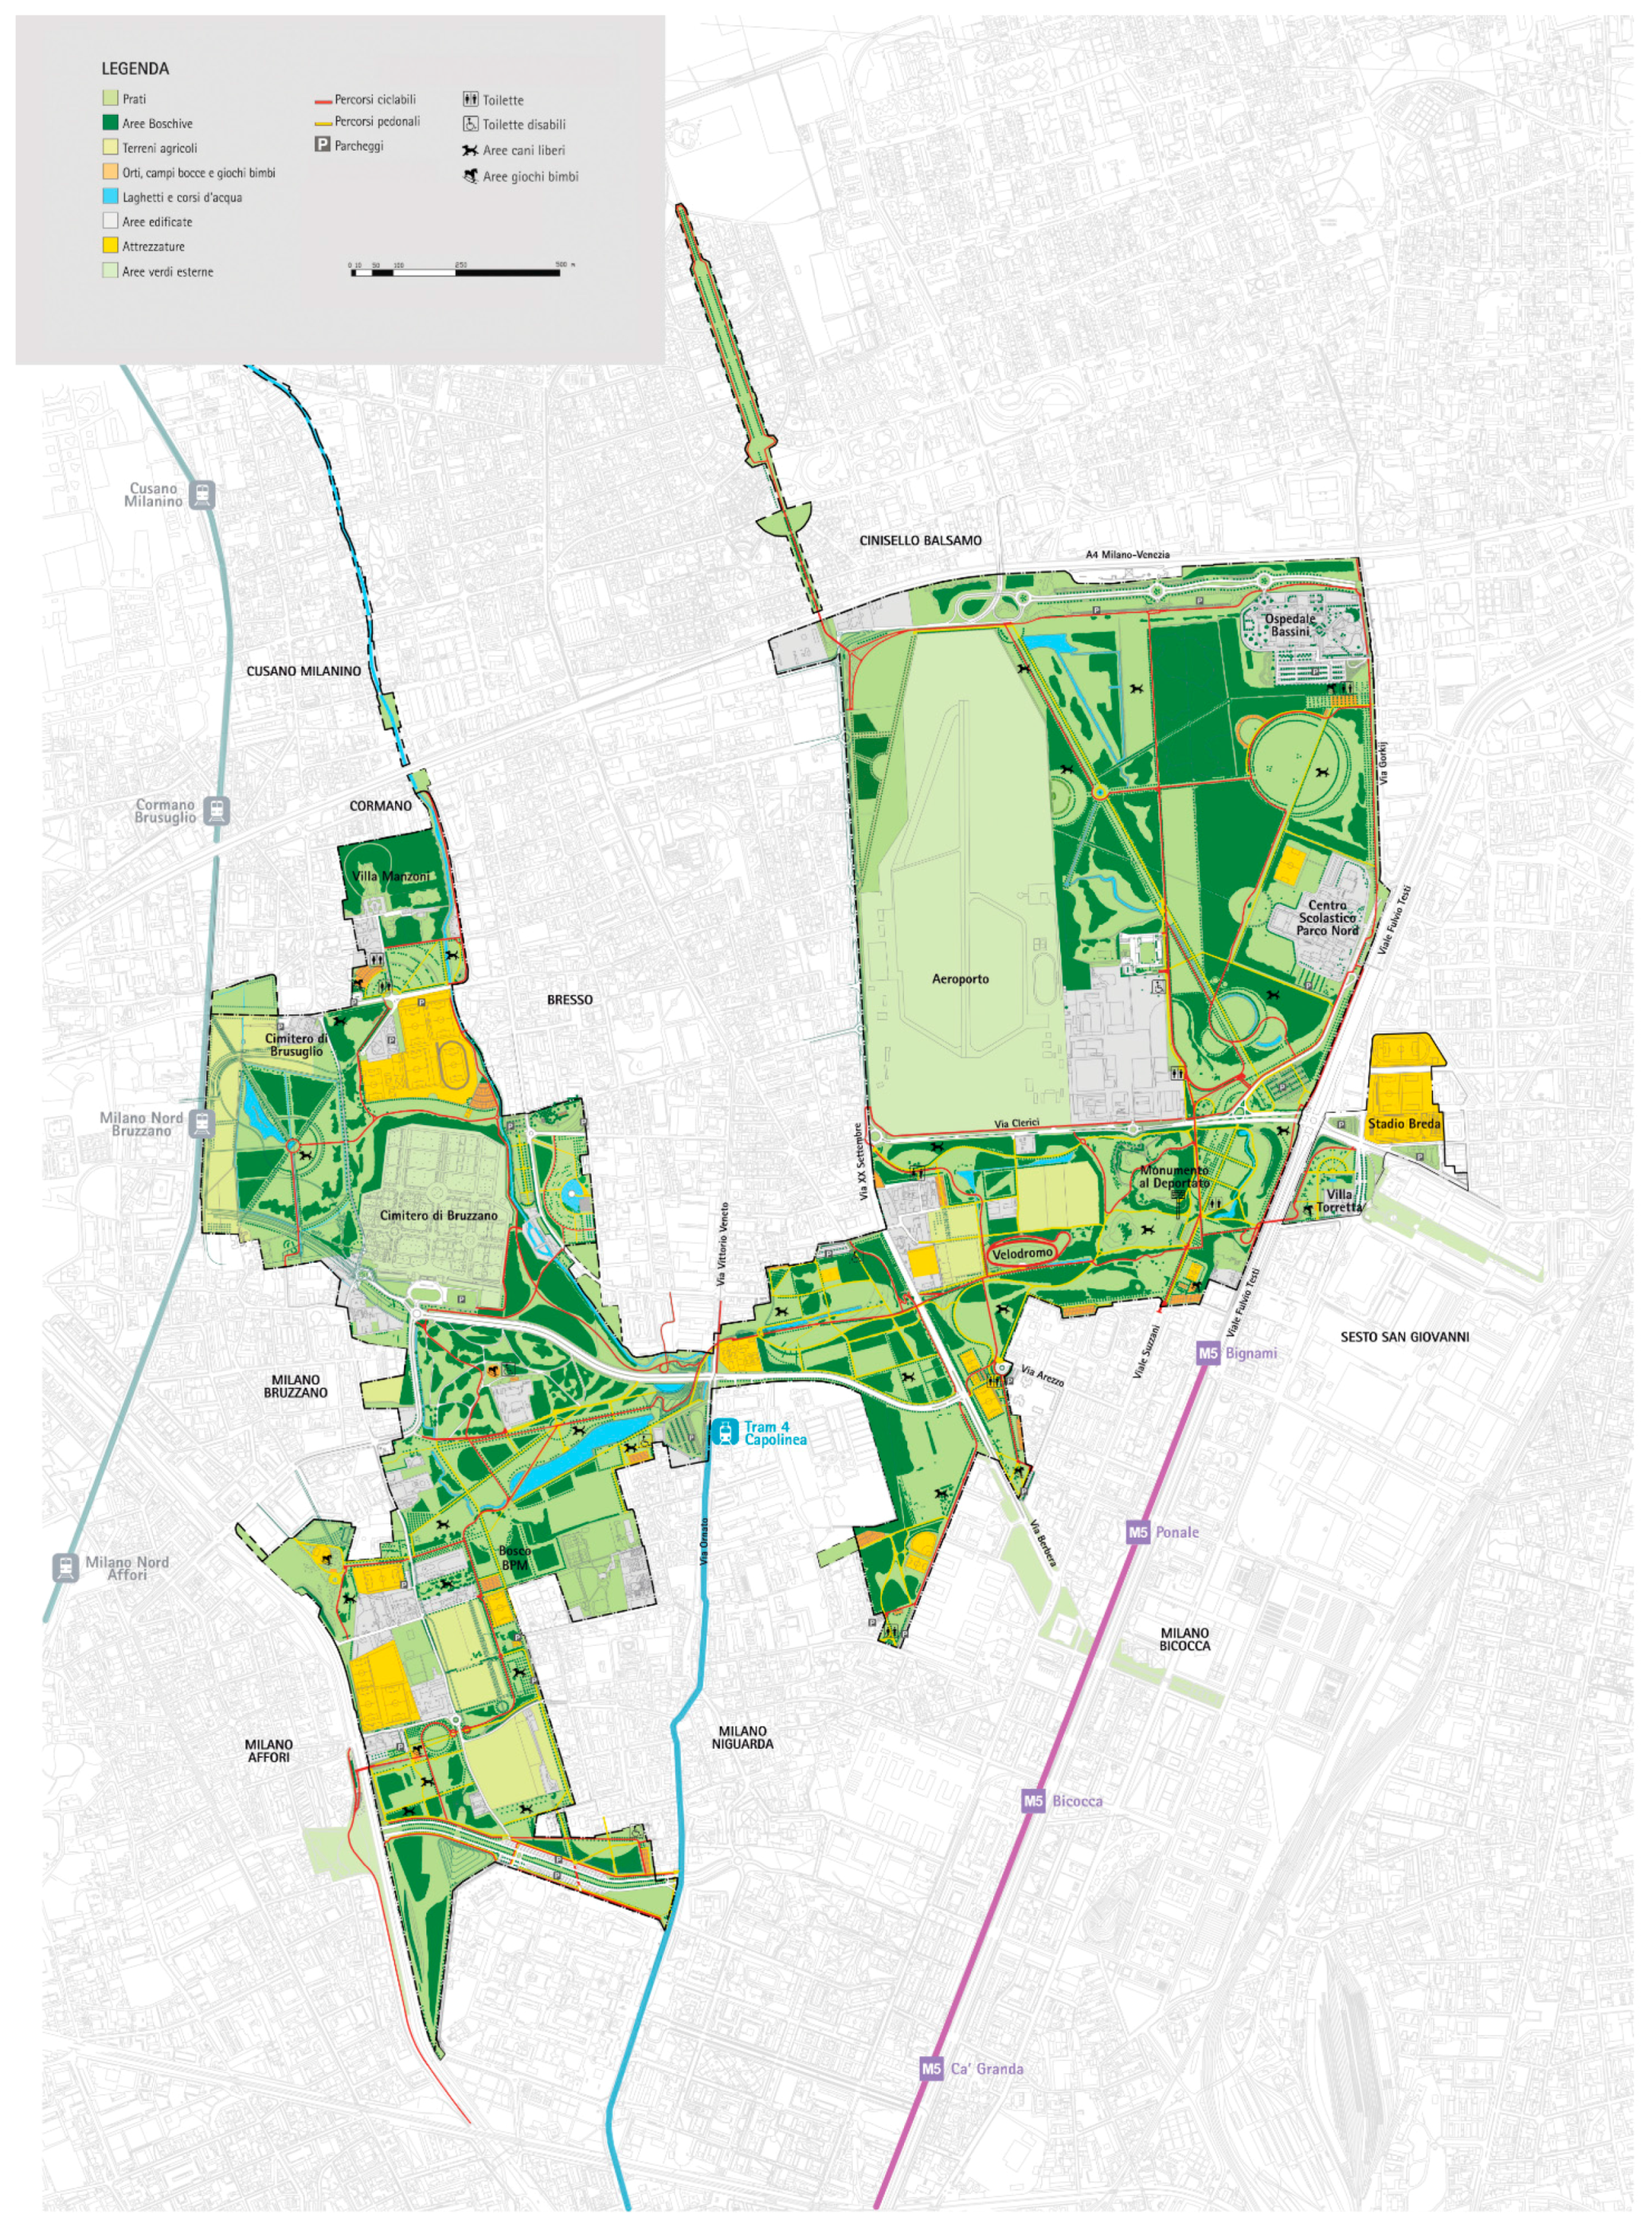
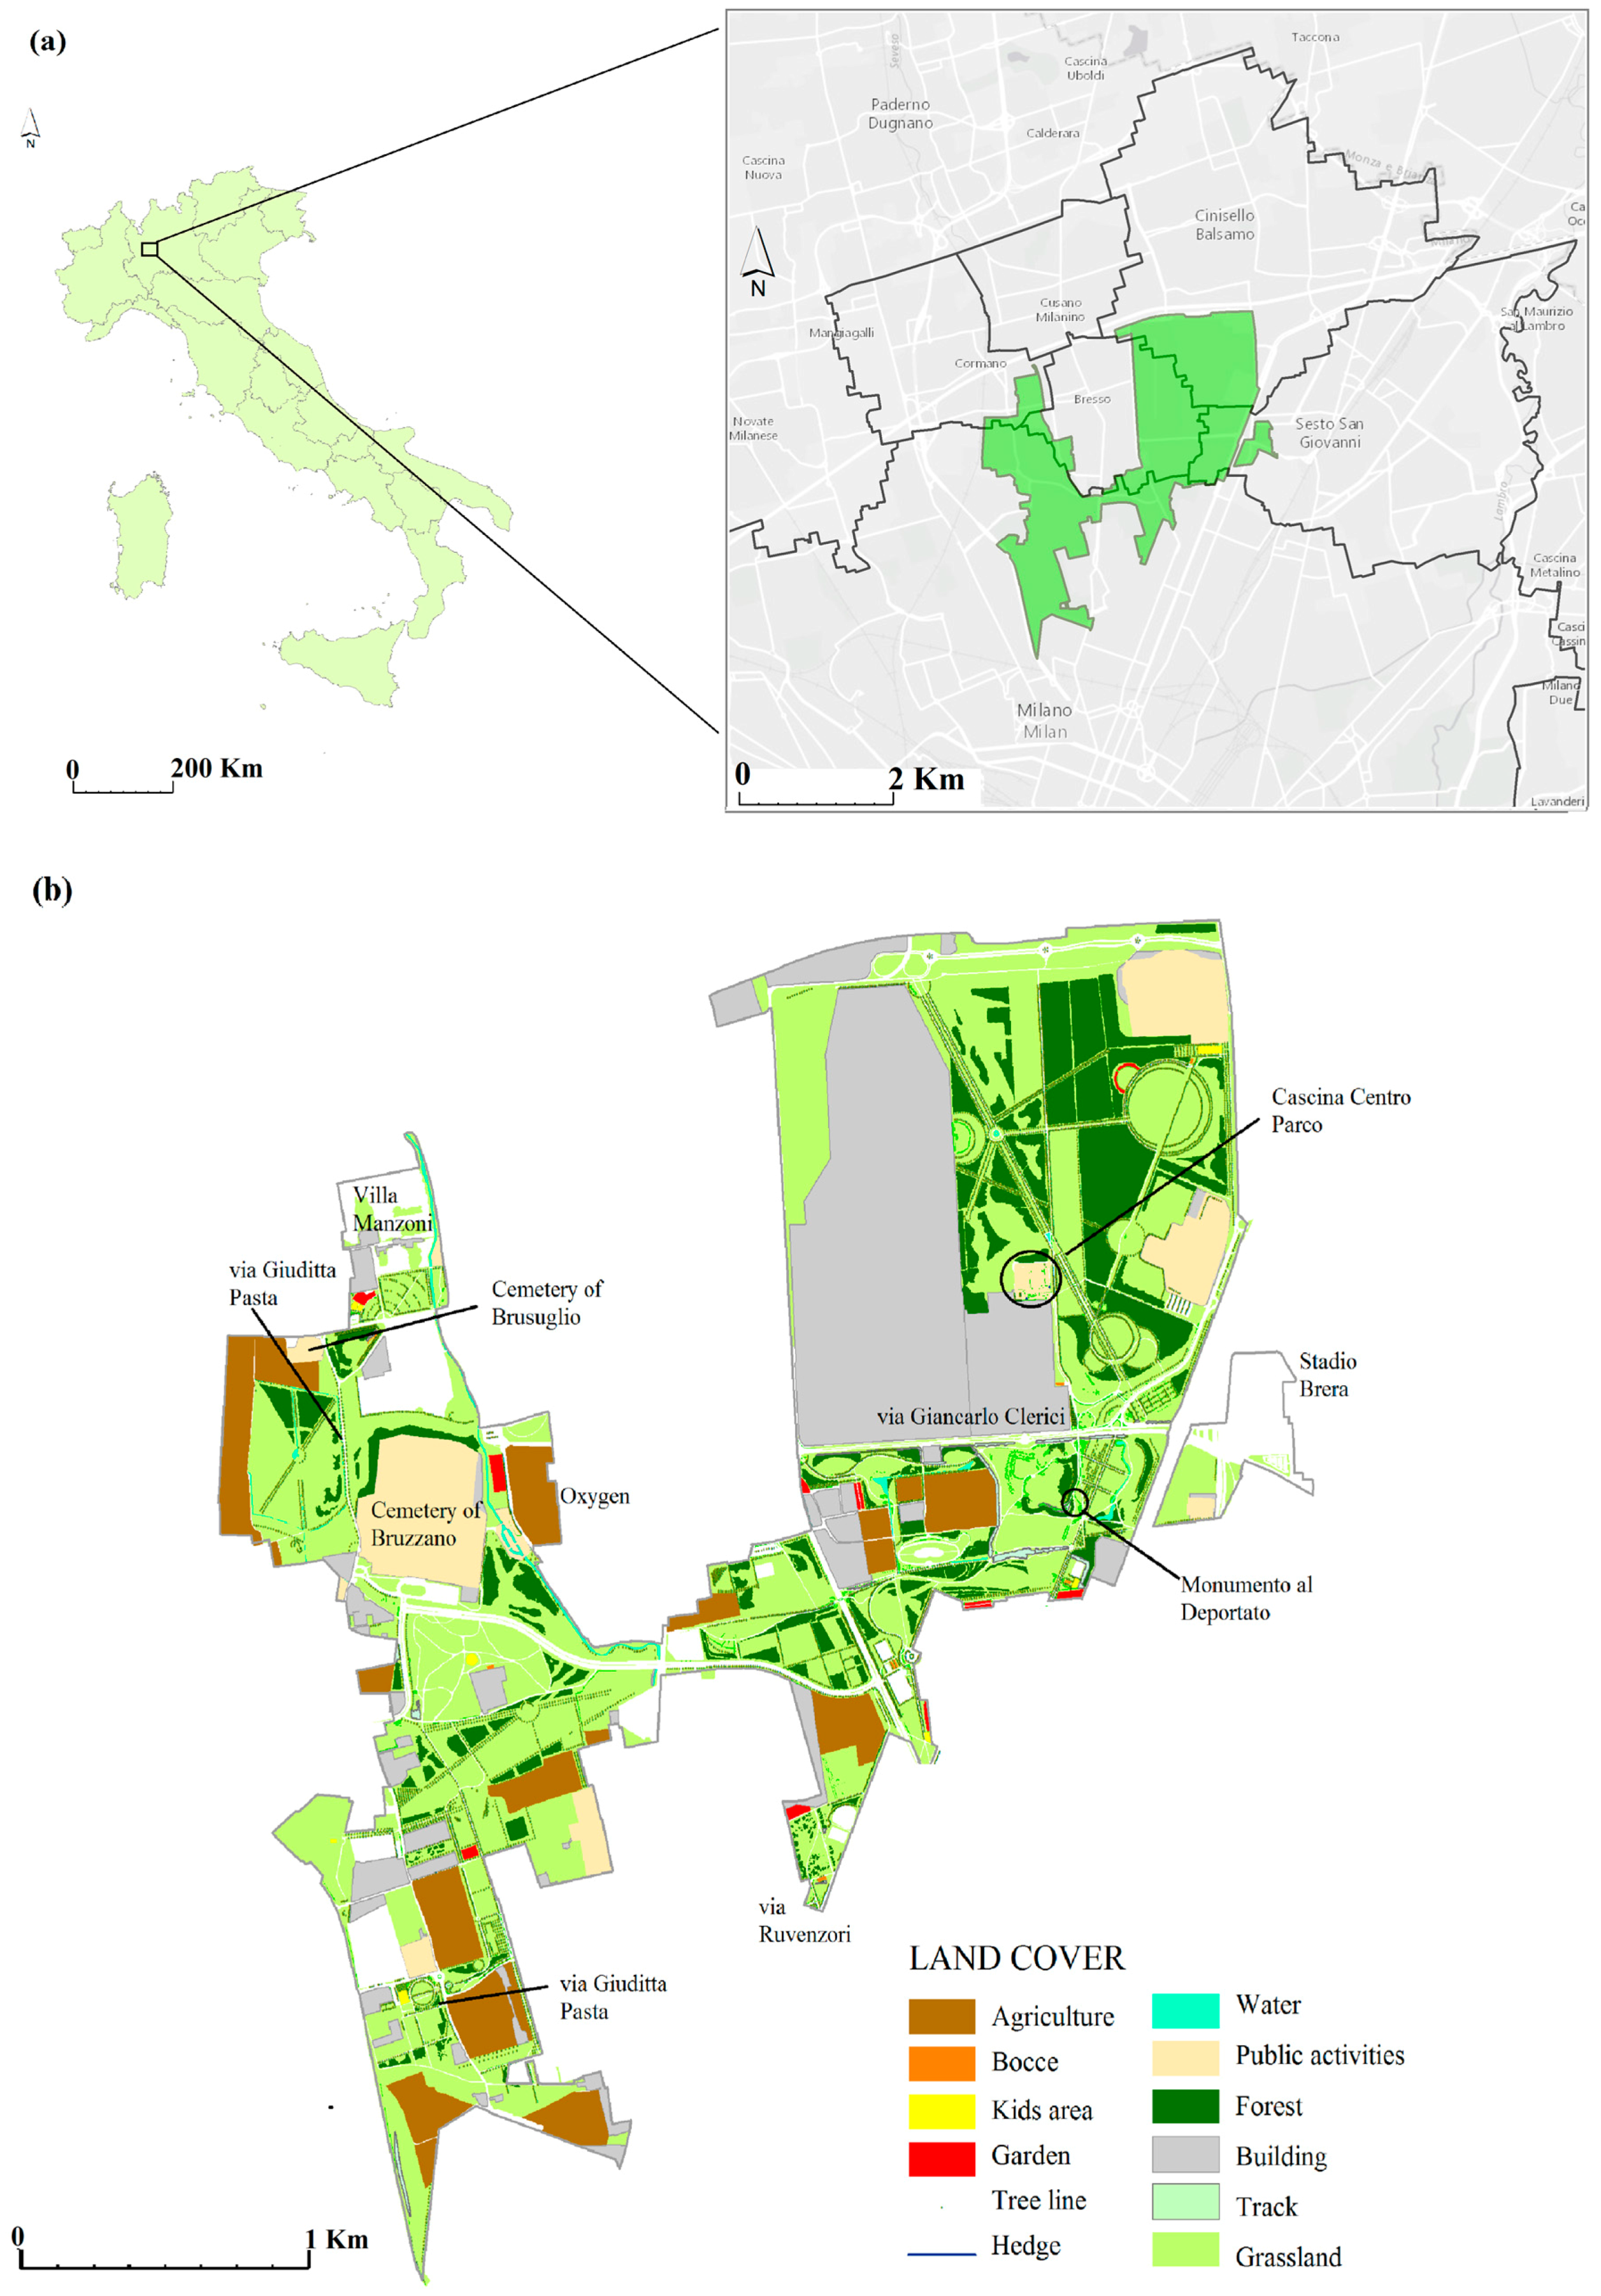
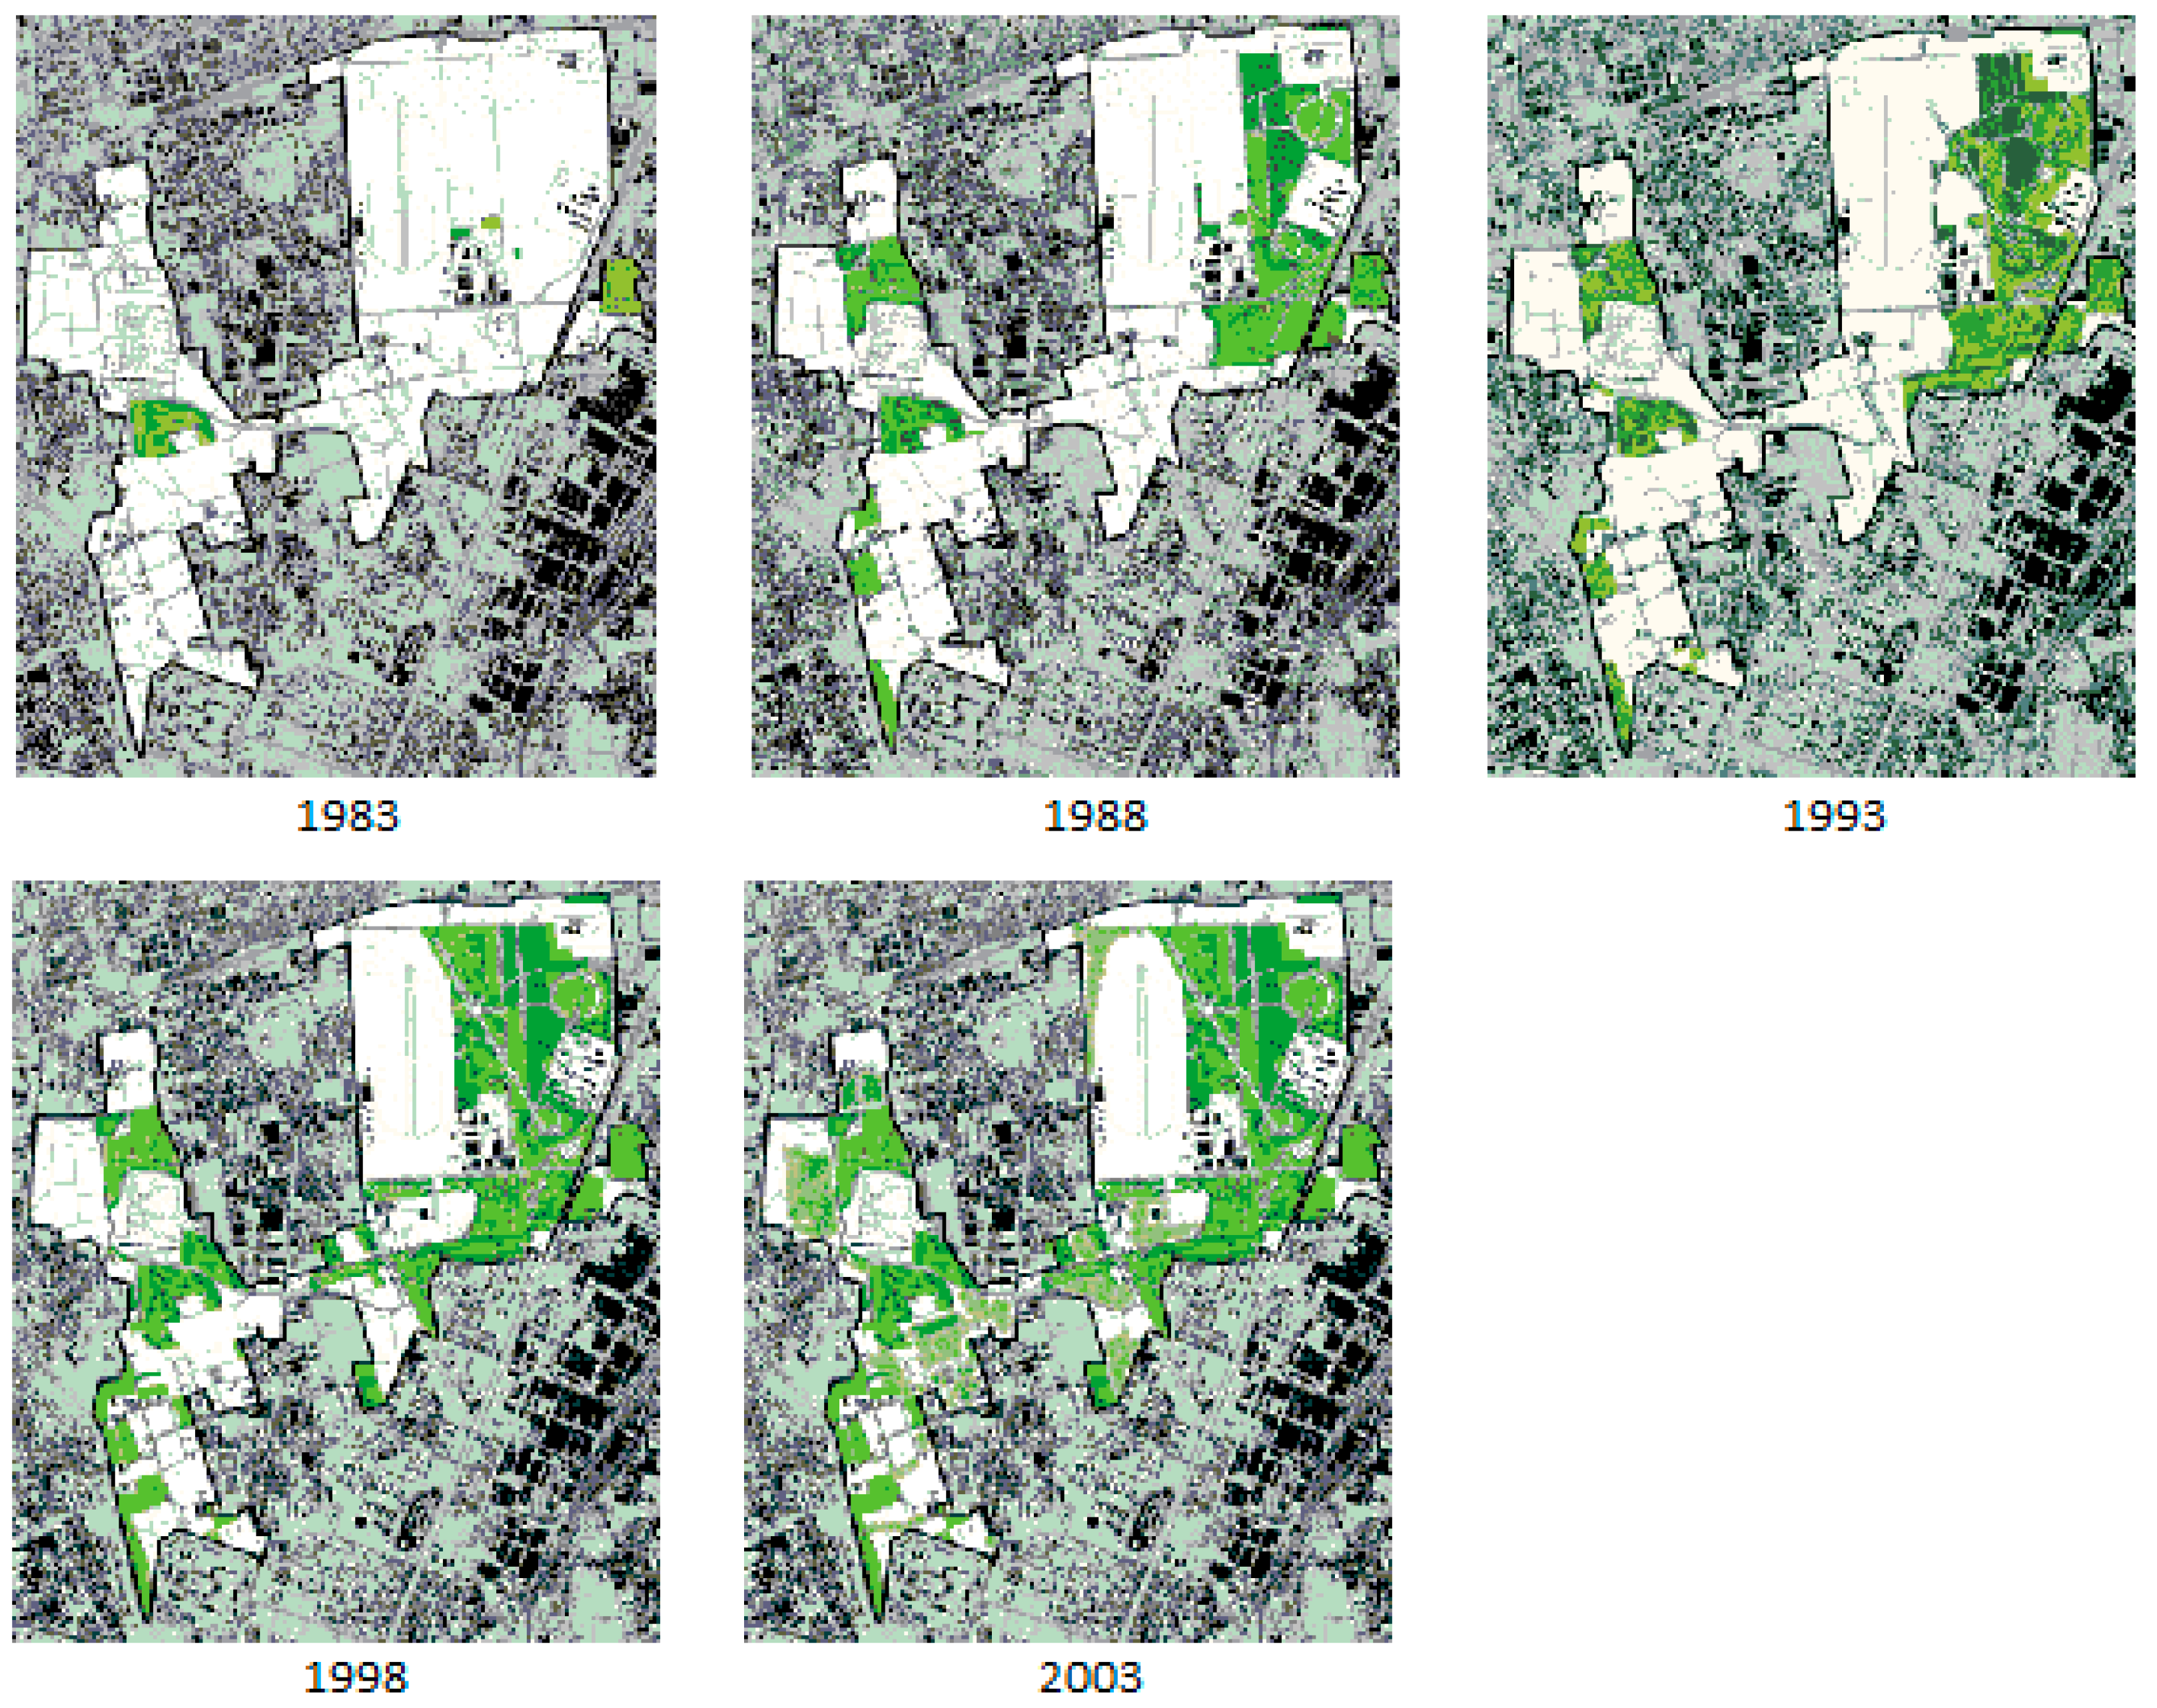
2.1. Study Area
2.2. Participatory Mapping of CES
2.3. Data Analysis
2.4. User Feedback: Consultation on Potential Application of the Method
3. Results and Discussion
3.1. CES Perceived in Parco Nord
3.1.1. Demographics of Park Users Sample
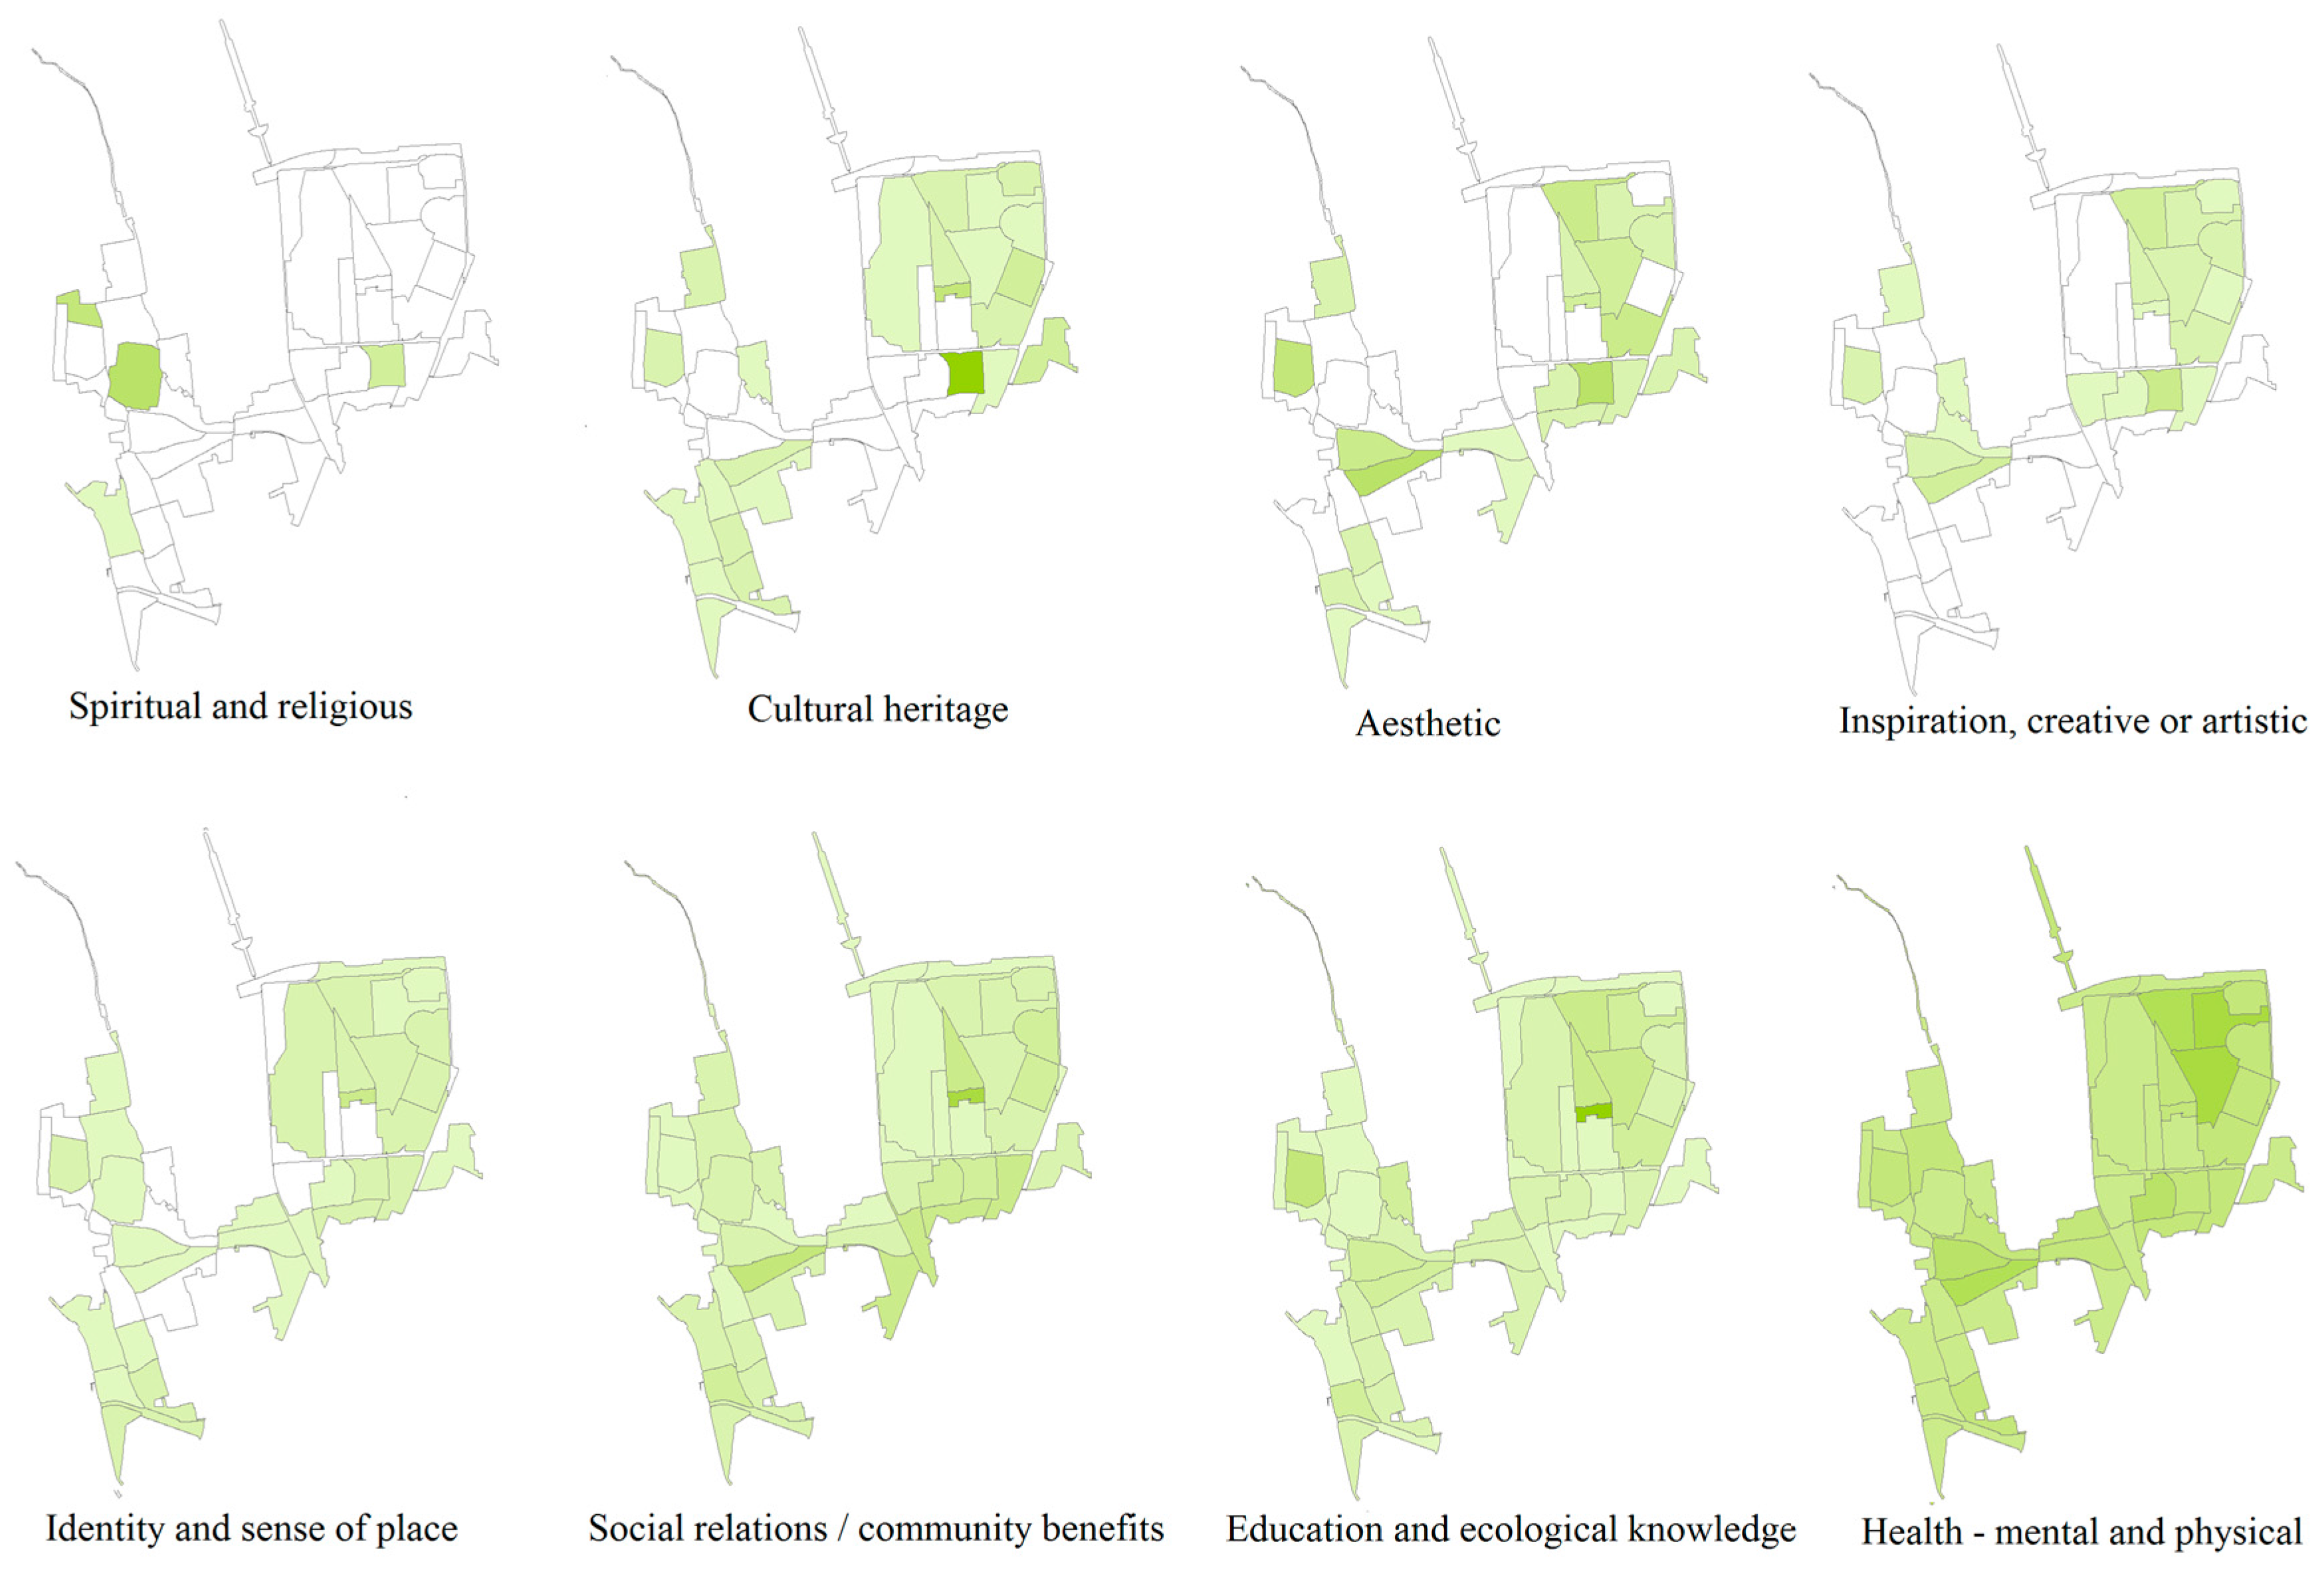
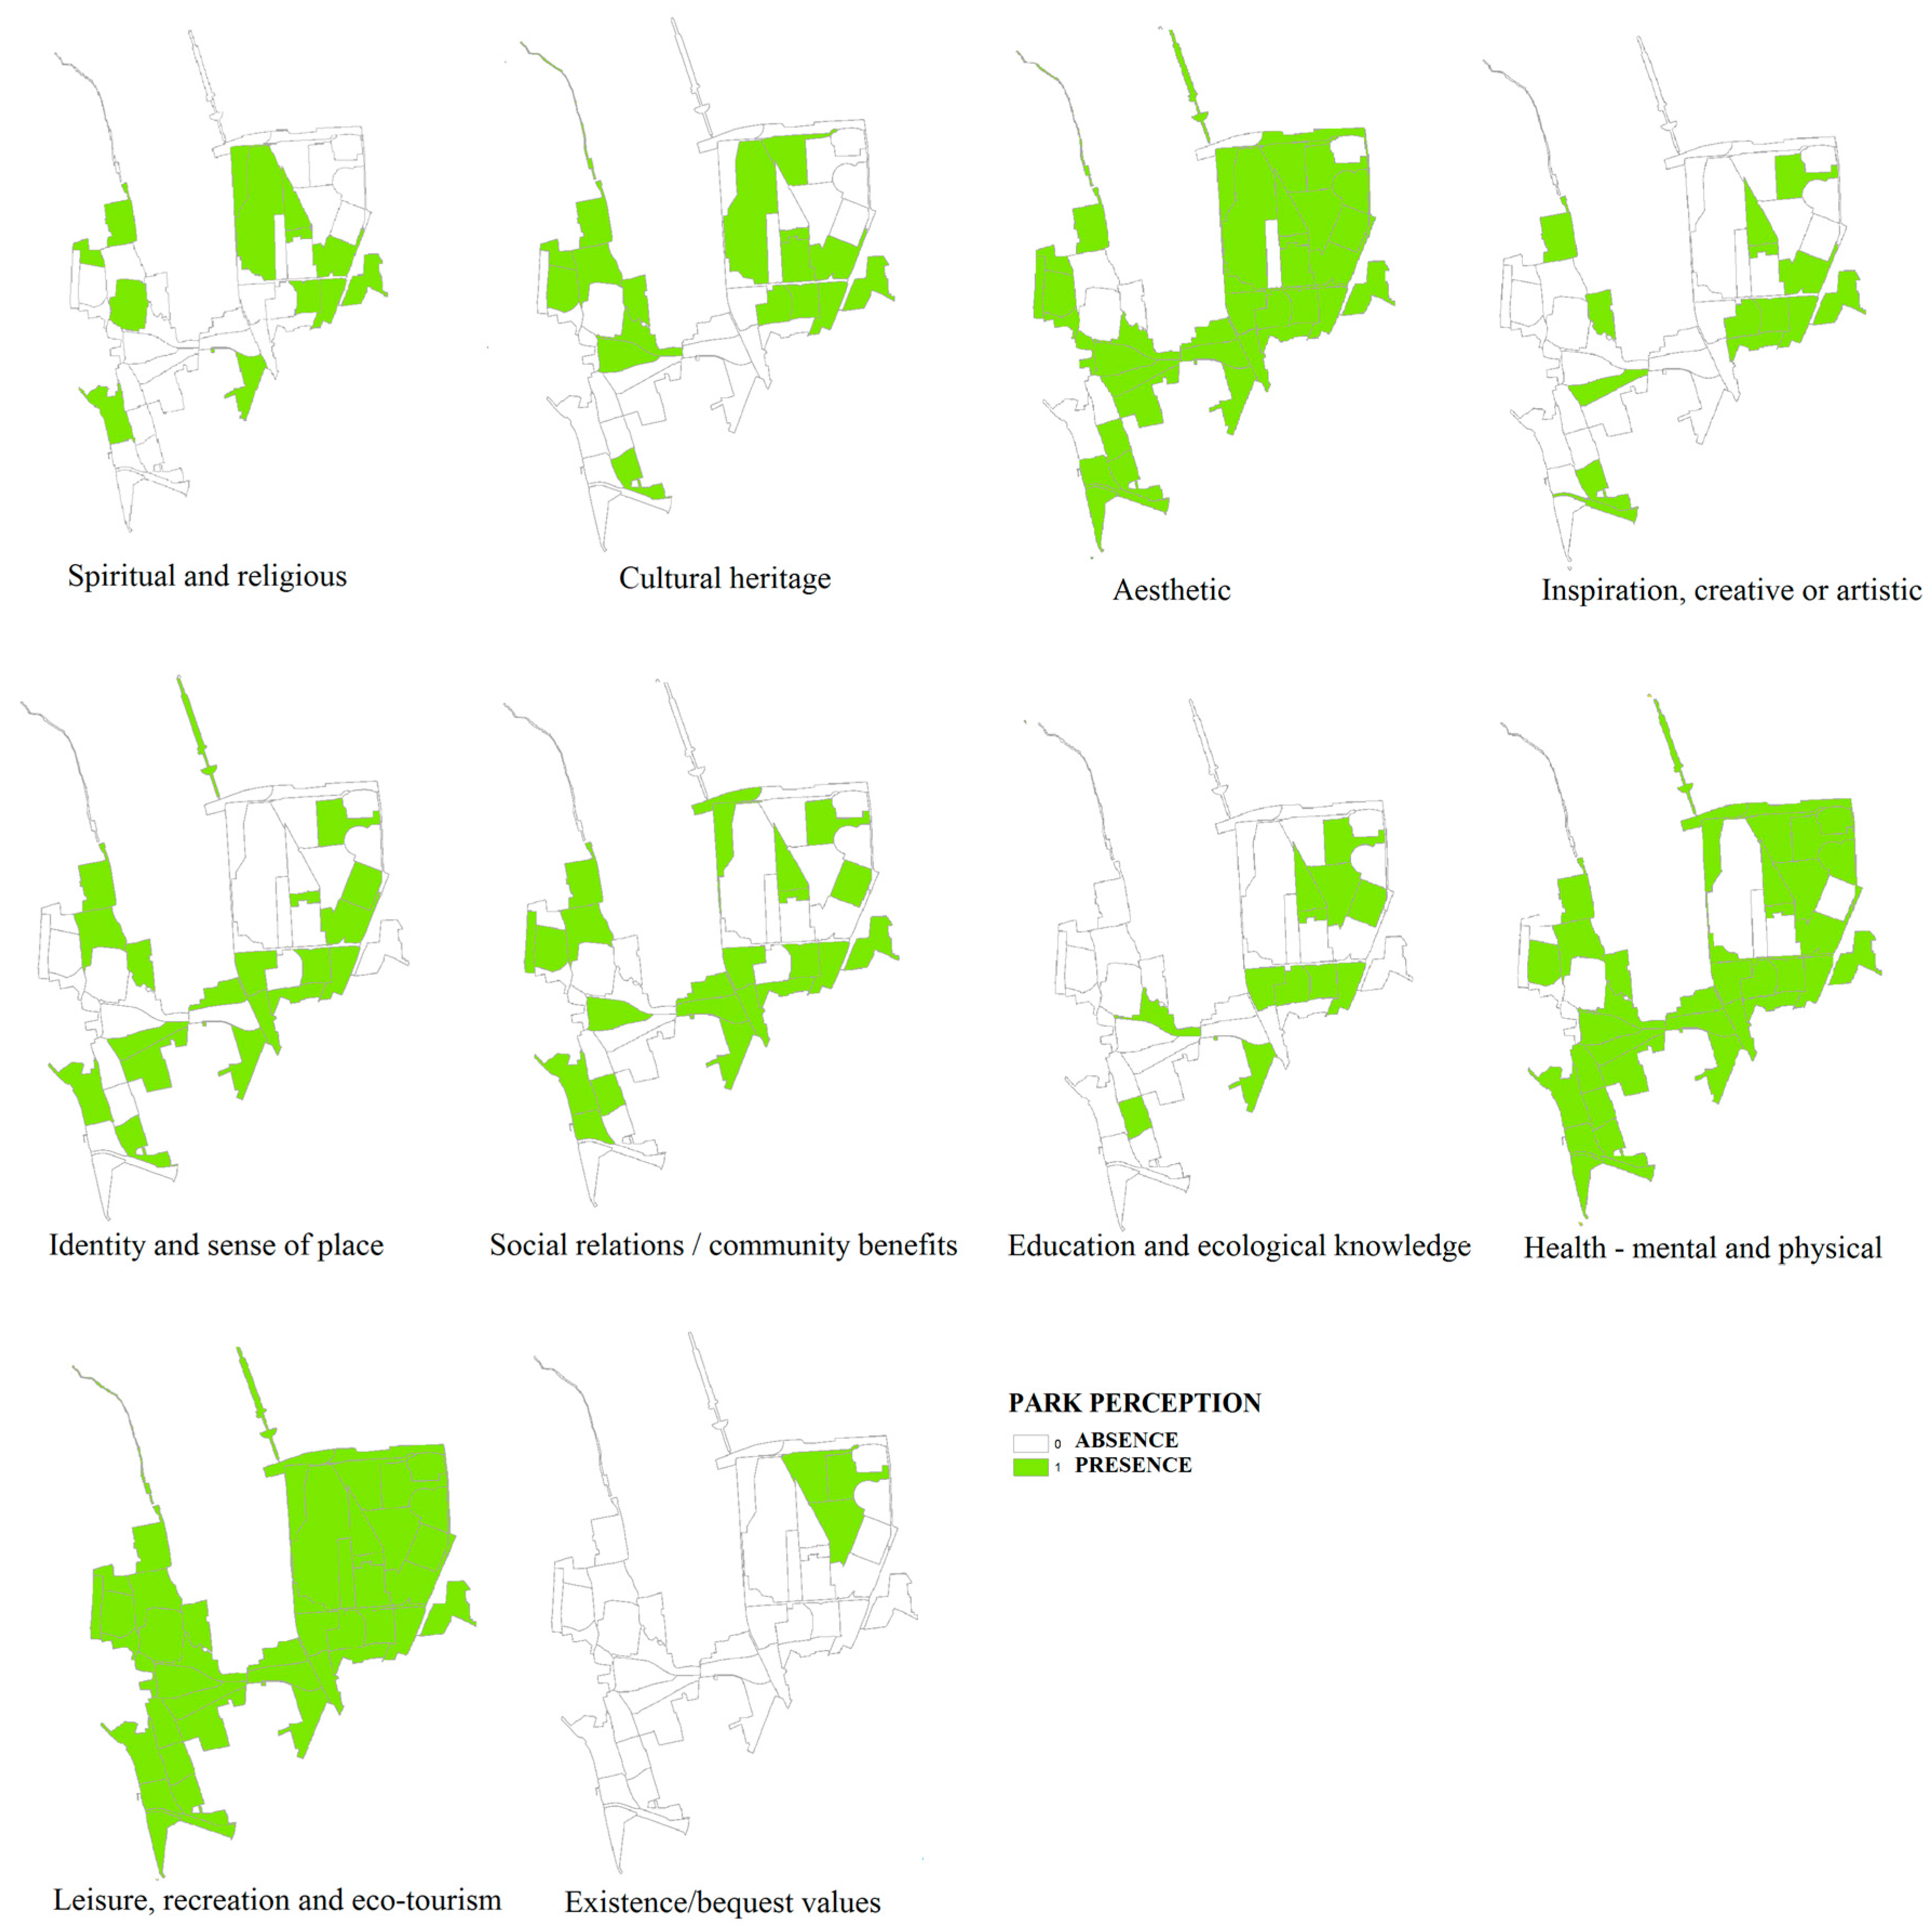
3.1.2. Cultural Benefits Perceived by Citizens
3.1.3. Cultural Benefits Arising from Park Management
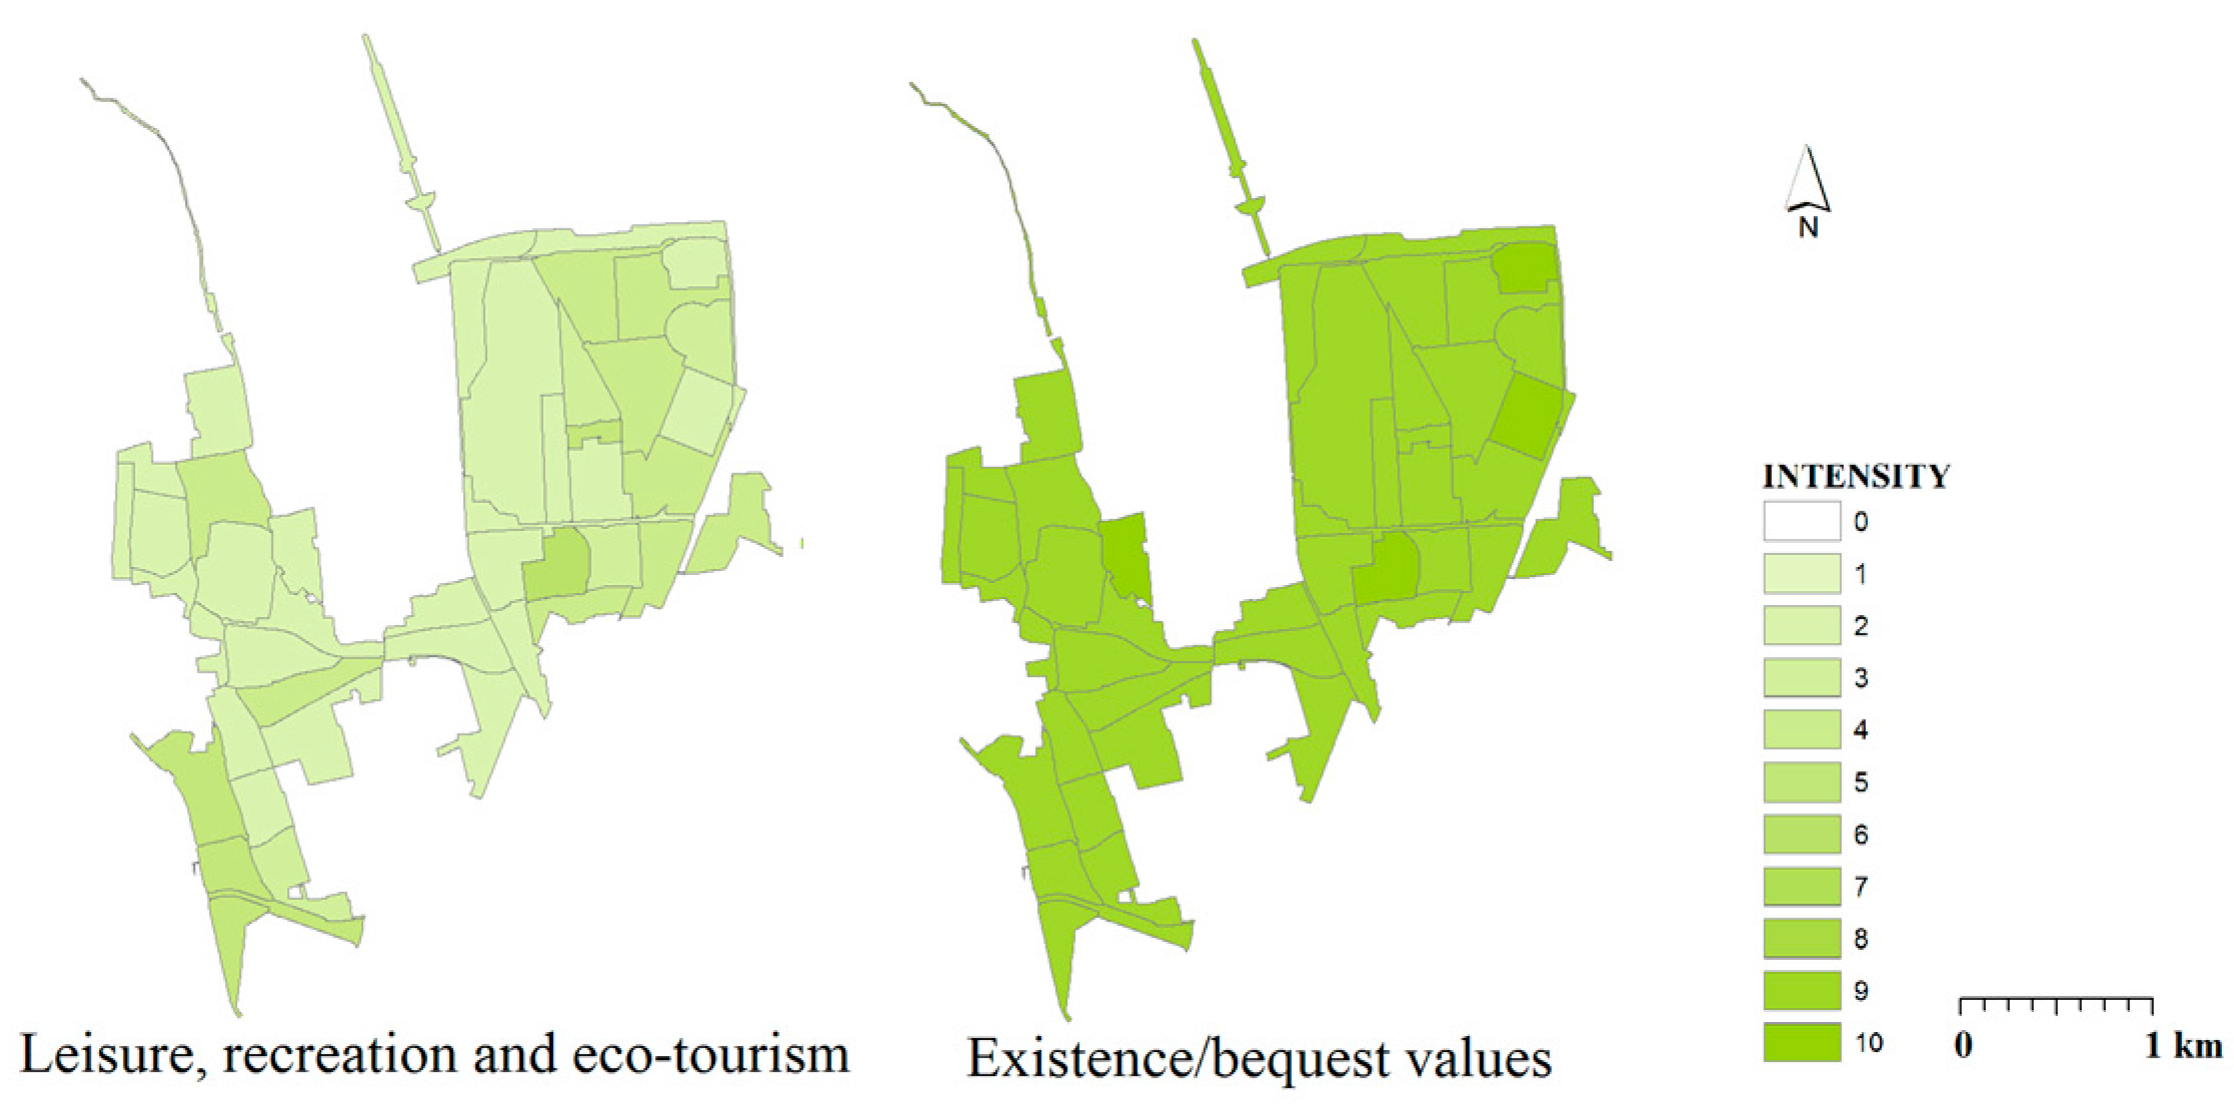
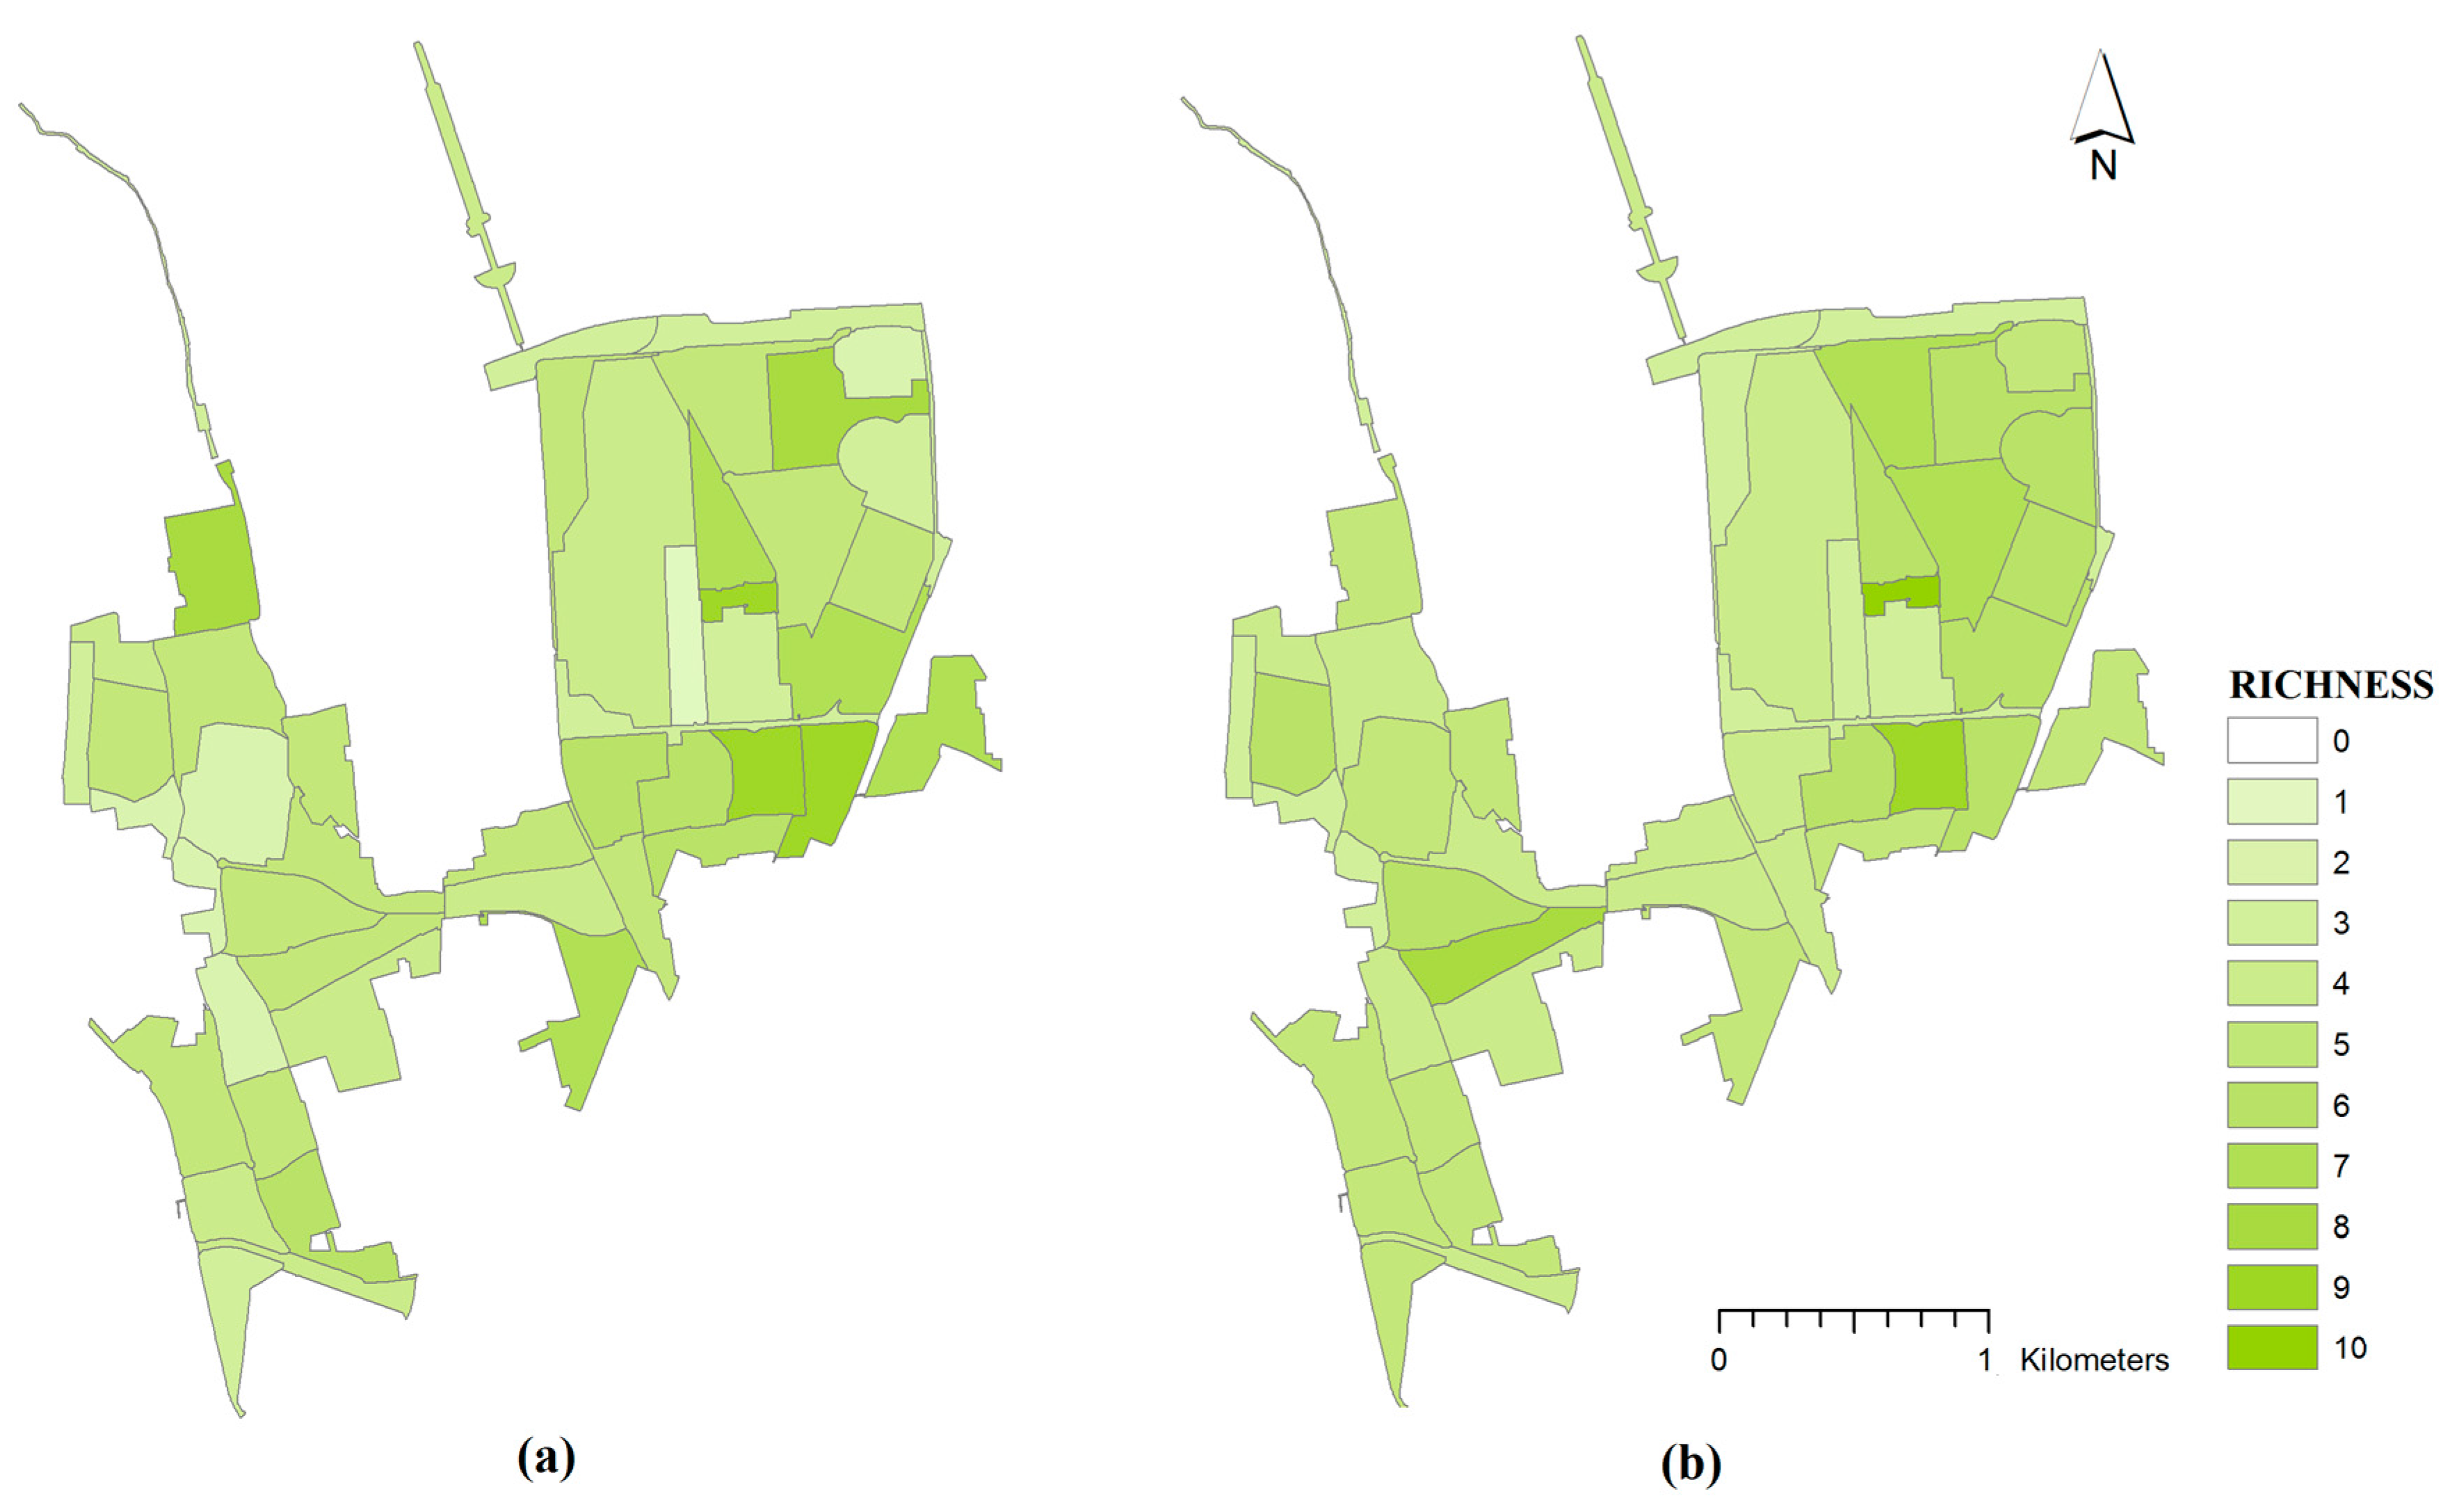
3.2. Comparison of Maps of CES
4. Conclusions
Acknowledgments
Author Contributions
Conflicts of Interest
Appendix A

| QUESTIONNAIRE—PART 1 | ||
| Where in this area do you perceived cultural services? | ||
| Identify and mark on the map the places in the park where you perceived (find or use) the following cultural benefits. | ||
| (Remember to always link the places marked on the map with the CODE of the corresponding cultural benefit) | ||
| CODE | Cultural Benefits | Description |
| SP | Spiritual and religious | I value this place for its spiritual or religious values. |
| CULT | Cultural Heritage | This place has an historical past (social, natural) that link to my cultural heritage. |
| EST | Aesthetic | This place has an aesthetic value (scenery, landscape, sounds or smells). |
| ISP | Inspiration, creative or artistic | This place is a source of inspiration (for photography, painting, writing, music and other artistic or creative arts). |
| APP | Sense of place and Identity | This place produces a feeling of belonging and identity (to feel “at home”, a feeling of familiarity, to identify yourself in the place and in its characteristics). |
| REL | Social relations/community benefits | This place allows social interaction and relationship opportunities (friends, family, and community). |
| ED | Education and ecological knowledge | This is a place where ecological knowledge and environmental education can be developed. |
| SAL | Health—mental and physical | This place contributes to mental (emotional, serenity) and physical (open-air activities) health. |
| RIC | Leisure, recreation and eco-tourism | This place gives recreational and/or touristic opportunities (walk, run, dog, play with friends, observe flora and fauna) |
| INT | Existence/bequest values | This place has its own intrinsic value, regarding to my utility. I value the fact that this place exists and will exist for future generations. |
| QUESTIONNAIRE—PART 2 | ||
| How important are these benefits to you? | ||
| (Think about how much do you think these benefits are important in this urban park itself). | ||
| Give a score to each cultural benefit from 1 to 10, where | ||
| 1 = minimum (I don’t think it is important at all), | ||
| 10 = maximum (I think it is of fundamental importance) | ||
| CODE | Cultural Benefits | Score |
| SP | Spiritual and religious | x |
| CULT | Cultural heritage | x |
| EST | Aesthetic | x |
| ISP | Inspiration, creative or artistic | x |
| APP | Sense of place and Identity | x |
| REL | Social relations/community benefits | x |
| ED | Education and ecological knowledge | x |
| SAL | Health—mental and physical | x |
| RIC | Leisure, recreation and eco-tourism | x |
| ES | Existence/bequest values | x |
| QUESTIONNAIRE—PART 3 | |||||
| Age: | 20–30 | 31–40 | 41–50 | 51–60 | 61–70 |
| Gender: | M | F | |||
| Employment: | Student | Retired/unemployed | Part-time worker | Full-time worker | Other |
| Education: | Primary school | Secondary school | High school | University | |
| Do you have children (less than 14 years old)? | Yes | No | |||
| Do you have a dog? | Yes | No | |||
| Where do you live? (indicate the municipality) | |||||
| You live in | Apartment | House with garden | Other | ||
| How far do you distance from the park? | Less than 15 min | Between 15 and 30 min | Between 30 and 60 min | More than 1 h | |
| Do you work close to the park? | Yes | No | |||
| For what reasons do you visit the park? | Walk Volunteer | Children Launch-break | Sport Other | Dog Meet people/ friends | |
| How often do you visit the park? | Every day | At least three times a week | At least one time a week | At least one time per month | |
| At least 1 time per month | Only during festivity/events | Other | |||
| How long does every visit last on average? | 1 h | Half a day | One day | Other | |
| QUESTIONNAIRE—PART 4 (Optional) |
| Do you want to add some impression about this exercise? ____________________________________________________________________________________ ____________________________________________________________________________________ ____________________________________________________________________________________ |
| Data Questions |
| a) Was the data on cultural values preferences in the study something they had they ever thought about or come across before? Did they like the idea? What might the barriers be to do this task within their work? |
| b) Do they think this type of data is relevant and useful to their work in terms of park design and management or education activities? |
| c) Do they think the data might be useful for other reasons (e.g., explaining the benefits of having a park to funding agencies, ensuring that its value is recognized by local government, the public or environmental education, for other reasons etc.) |
| d) Based on the results of the study, would the park management consider trying to enhance the cultural values that are considered the most important to the participants in the study (e.g., ecological education, mental and physical health)? |
| Process Questions |
| e) Do they think it is a good idea to consult with the public about how they experience and use the park from time to time? What are the barriers to this? What are the benefits? |
| f) How do they think this methodology can be implemented in terms of data collection (e.g., representativeness of the sample, benefits perception monitoring, additional information about reasons for identifying specific places etc.)? |


References
- Chiesura, A. The role of urban parks for the sustainable city. Landsc. Urban Plan. 2004, 68, 129–138. [Google Scholar] [CrossRef]
- Sandifer, P.A.; Sutton-Grier, A.E.; Ward, B.P. Exploring connections among nature, biodiversity, ecosystem services, and human health and well-being: Opportunities to enhance health and biodiversity conservation. Ecosyst. Serv. 2015, 12, 1–15. [Google Scholar] [CrossRef]
- Haase, D.; Frantzeskaki, N.; Elmqvist, T. Ecosystem services in urban landscapes: Practical applications and governance implications. Ambio 2014, 43, 407–412. [Google Scholar] [CrossRef] [PubMed]
- Gómez-Baggethun, E.; Gren, Å.; Barton, D.N.; Langemeyer, J.; McPhearson, T.; O’Farrell, P.; Andersson, E.; Hamstead, Z.; Kremer, P. Abstract Urban Ecosystem Services. In Urbanization, Biodiversity and Ecosystem Services: Challenges and Opportunities; Springer: Dordrecht, The Netherlands, 2013; pp. 175–251. [Google Scholar]
- Niemelä, J.; Saarela, S.R.; Söderman, T.; Kopperoinen, L.; Yli-Pelkonen, V.; Väre, S.; Kotze, D.J. Using the ecosystem services approach for better planning and conservation of urban green spaces: A Finland case study. Biodivers. Conserv. 2010, 19, 3225–3243. [Google Scholar] [CrossRef]
- Andersson, E.; Tengö, M.; McPhearson, T.; Kremer, P. Cultural ecosystem services as a gateway for improving urban sustainability. Ecosyst. Serv. 2015, 12, 165–168. [Google Scholar] [CrossRef]
- Brown, G.; Fagerholm, N. Empirical PPGIS/PGIS mapping of ecosystem services: A review and evaluation. Best Pract. Mapp. Ecosyst. Serv. 2015, 13, 119–133. [Google Scholar] [CrossRef]
- Hunter, M.R. Impact of ecological disturbance on awareness of urban nature and sense of environmental stewardship in residential neighborhoods. Landsc. Urban Plan. 2011, 101, 131–138. [Google Scholar] [CrossRef]
- Ernstson, H.; Sörlin, S. Weaving protective stories: Connective practices to articulate holistic values in the Stockholm National Urban Park. Environ. Plan. A 2009, 41, 1460–1479. [Google Scholar] [CrossRef]
- Saldivar-Tanaka, L.; Krasny, M.E. Culturing community development, neighborhood open space, and civic agriculture: The case of Latino community gardens in New York City. Agric. Hum. Values 2004, 21, 399–412. [Google Scholar] [CrossRef]
- Schmelzkopf, K. Incommensurability, Land Use, and the Right to Space: Community Gardens in New York City. Urban Geogr. 2002, 23, 323–343. [Google Scholar] [CrossRef]
- Kaplan, R.; Kaplan, S. The Experience of Nature: A Psychological Perspective; Cambridge University Press: Cambridge, UK, 1989. [Google Scholar]
- La Rosa, D.; Spyra, M.; Inostroza, L. Indicators of Cultural Ecosystem Services for urban planning: A review. Ecol. Indic. 2016, 61, 74–89. [Google Scholar] [CrossRef]
- Buchel, S.; Frantzeskaki, N. Citizens’ voice: A case study about perceived ecosystem services by urban park users in Rotterdam, The Netherlands. Ecosyst. Serv. 2015, 12, 169–177. [Google Scholar] [CrossRef]
- Peh, K.S.H.; Balmford, A.; Bradbury, R.B.; Brown, C.; Butchart, S.H.M.; Hughes, F.M.R.; Stattersfield, A.; Thomas, D.H.L.; Walpole, M.; Bayliss, J.; et al. TESSA: A toolkit for rapid assessment of ecosystem services at sites of biodiversity conservation importance. Ecosyst. Serv. 2013, 5, 51–57. [Google Scholar] [CrossRef]
- Sieber, R. Public participation geographic information systems: A literature review and framework. Ann. Assoc. Am. Geogr. 2006, 96, 491–507. [Google Scholar] [CrossRef]
- Brown, G.; Kyttä, M. Key issues and research priorities for public participation GIS (PPGIS): A synthesis based on empirical research. Appl. Geogr. 2014, 46, 126–136. [Google Scholar] [CrossRef]
- Brown, G.G.; Reed, P. Public participation gis: A new method for use In national forest planning. For. Sci. 2009, 55, 166–182. [Google Scholar]
- Plieninger, T.; Dijks, S.; Oteros-Rozas, E.; Bieling, C. Assessing, mapping, and quantifying cultural ecosystem services at community level. Land Use Policy 2013, 33, 118–129. [Google Scholar] [CrossRef]
- Wolf, I.D.; Wohlfart, T.; Brown, G.; Bartolomé Lasa, A. The use of public participation GIS (PPGIS) for park visitor management: A case study of mountain biking. Tour. Manag. 2015, 51, 112–130. [Google Scholar] [CrossRef]
- Fagerholm, N.; Käyhkö, N.; Ndumbaro, F.; Khamis, M. Community stakeholders’ knowledge in landscape assessments—Mapping indicators for landscape services. Ecol. Indic. 2012, 18, 421–433. [Google Scholar] [CrossRef]
- Klain, S.C.; Chan, K.M.A. Navigating coastal values: Participatory mapping of ecosystem services for spatial planning. Ecol. Econ. 2012, 82, 104–113. [Google Scholar] [CrossRef]
- Van Berkel, D.B.; Verburg, P.H. Spatial quantification and valuation of cultural ecosystem services in an agricultural landscape. Ecol. Indic. 2014, 37, 163–174. [Google Scholar] [CrossRef]
- Willemen, L.; Verburg, P.H.; Hein, L.; Van Mensvoort, M.E.F. Spatial characterization of landscape functions. Landsc. Urban Plan. 2008, 88, 34–43. [Google Scholar] [CrossRef]
- Maraja, R.; Jan, B.; Teja, T. Perceptions of cultural ecosystem services from urban green. Ecosyst. Serv. 2016, 17, 33–39. [Google Scholar]
- Church, A.; Fish, R.; Haines-Young, R.; Mourator, S.; Tratalos, J.; Stapleton, L.; Willis, C.; Coates, P.; Gibbons, S.; Leyshon, C.; et al. UK National Ecosystem Assessment Follow-on Phase. Work Package Report 5: Cultural Ecosystem Services and Indicators; UNEP-WCMC, LWEC: Swindin, UK, 2014. [Google Scholar]
- Lafortezza, R.; Davies, C.; Sanesi, G.; Konijnendijk, C.C.C. Green Infrastructure as a tool to support spatial planning in European urban regions. iFor. Biogeosci. For. 2013, 6, 102–108. [Google Scholar] [CrossRef]
- Van den Berg, A.E.; Hartig, T.; Staats, H. Preference for nature in urbanized societies: Stress, restoration, and the pursuit of sustainability. J. Soc. Issues 2007, 63, 79–96. [Google Scholar] [CrossRef]
- Hassan, R.; Scholes, R.; Ash, N. Millennium Ecosystem Assessment. In Ecosystems and Human Well-Being : Current State and Trends : Findings of the Condition and Trends Working Group; Island Press: Washinton, DC, USA, 2005. [Google Scholar]
- Chan, K.M.A.; Satterfield, T.; Goldstein, J. Rethinking ecosystem services to better address and navigate cultural values. Ecol. Econ. 2012, 74, 8–18. [Google Scholar] [CrossRef]
- Chan, K.M.A.; Guerry, A.D.; Balvanera, P.; Klain, S.; Satterfield, T.; Basurto, X.; Bostrom, A.; Chuenpagdee, R.; Gould, R.; Halpern, B.S.; et al. Where are Cultural and Social in Ecosystem Services? A Framework for Constructive Engagement. Bioscience 2012, 62, 744–756. [Google Scholar]
- Hou, Y.; Burkhard, B.; Müller, F. Uncertainties in landscape analysis and ecosystem service assessment. J. Environ. Manag. 2013, 127, S117–S131. [Google Scholar] [CrossRef] [PubMed]
- Convertino, M.; Muñoz-Carpena, R.; Chu-Agor, M.L.; Kiker, G.A.; Linkov, I. Untangling drivers of species distributions: Global sensitivity and uncertainty analyses of MaxEnt. Environ. Model. Softw. 2014, 51, 296–309. [Google Scholar] [CrossRef]
- Scolozzi, R.; Morri, E.; Santolini, R. Delphi-based change assessment in ecosystem service values to support strategic spatial planning in Italian landscapes. Ecol. Indic. 2012, 21, 134–144. [Google Scholar] [CrossRef]
- Collier, M.J.; Scott, M. Conflicting rationalities, knowledge and values in scarred landscapes. J. Rural Stud. 2009, 25, 267–277. [Google Scholar] [CrossRef]
- Bryan, B.A.; Raymond, C.M.; Crossman, N.D.; Macdonald, D.H. Targeting the management of ecosystem services based on social values: Where, what, and how? Landsc. Urban Plan. 2010, 97, 111–122. [Google Scholar] [CrossRef]
- Raudsepp-Hearne, C.; Peterson, G.D.; Bennett, E.M. Ecosystem service bundles for analyzing tradeoffs in diverse landscapes. Proc. Natl. Acad. Sci. USA 2010, 107, 5242–5247. [Google Scholar] [CrossRef] [PubMed]
- Hernández-Morcillo, M.; Plieninger, T.; Bieling, C. An empirical review of cultural ecosystem service indicators. Ecol. Indic. 2013, 29, 434–444. [Google Scholar] [CrossRef]
- Bieling, C.; Plieninger, T. Recording Manifestations of Cultural Ecosystem Services in the Landscape. Landsc. Res. 2013, 38, 649–667. [Google Scholar] [CrossRef]
- Daniel, T.C.; Muhar, A.; Arnberger, A.; Aznar, O.; Boyd, J.W.; Chan, K.M.A.; Costanza, R.; Elmqvist, T.; Flint, C.G.; Gobster, P.H.; et al. Contributions of cultural services to the ecosystem services agenda. Proc. Natl. Acad. Sci. USA 2012, 109, 8812–8819. [Google Scholar] [CrossRef] [PubMed]
- Lynam, T.; De Jong, W.; Sheil, D.; Kusumanto, T.; Evans, K. A review of tools for incorporating community knowledge, preferences, and values into decision making in natural resources management. Ecol. Soc. 2007, 12, 5. [Google Scholar] [CrossRef]
- Termorshuizen, J.W.; Opdam, P. Landscape services as a bridge between landscape ecology and sustainable development. Landsc. Ecol. 2009, 24, 1037–1052. [Google Scholar] [CrossRef]
- Martínez-Harms, M.J.; Balvanera, P. Methods for mapping Ecosystem Service supply: A review. Int. J. Biodivers. Sci. Ecosyst. Serv. Manag. 2012, 8, 17–25. [Google Scholar] [CrossRef]
- Nahuelhual, L.; Laterra, P.; Villarino, S.; Mastrángelo, M.; Carmona, A.; Jaramillo, A.; Barral, P.; Burgos, N. Mapping of ecosystem services: Missing links between purposes and procedures. Ecosyst. Serv. 2014, 13, 162–172. [Google Scholar] [CrossRef]
- Opdam, P. Using ecosystem services in community-based landscape planning: Science is not ready to deliver. In Landscape Ecology for Sustainable Environment and Culture; Springer: Dordrecht, The Netherlands, 2013; pp. 77–101. [Google Scholar]
- Hamel, P.; Bryant, B.P. Uncertainty assessment in ecosystem services analyses: Seven challenges and practical responses. Ecosyst. Serv. 2017, 24, 1–15. [Google Scholar] [CrossRef]
- Cash, D.W.; Clark, W.C.; Alcock, F.; Dickson, N.M.; Eckley, N.; Guston, D.H.; Jager, J.; Mitchell, R.B. Knowledge systems for sustainable development. Proc. Natl. Acad. Sci. USA 2003, 100, 8086–8091. [Google Scholar] [CrossRef] [PubMed]
- Cox, C.; Morse, W.C.; Anderson, C.; Marzen, L. Applying public participation geographic information systems to wildlife management. Hum. Dimens. Wildl. 2014, 19, 200–214. [Google Scholar] [CrossRef]
- Van Riper, C.J.; Kyle, G.T.; Sutton, S.G.; Barnes, M.; Sherrouse, B.C. Mapping outdoor recreationists’ perceived social values for ecosystem services at Hinchinbrook Island National Park, Australia. Appl. Geogr. 2012, 35, 164–173. [Google Scholar] [CrossRef]
- Arnberger, A.; Brandenburg, C. Past on-site experience, crowding perceptions, and use displacement of visitor groups to a peri-urban national park. Environ. Manag. 2007, 40, 34–45. [Google Scholar] [CrossRef] [PubMed]
- Gee, K.; Burkhard, B. Cultural ecosystem services in the context of offshore wind farming: A case study from the west coast of Schleswig-Holstein. Ecol. Complex. 2010, 7, 349–358. [Google Scholar] [CrossRef]
- Norton, L.R.; Inwood, H.; Crowe, A.; Baker, A. Trialling a method to quantify the “cultural services” of the English landscape using Countryside Survey data. Land Use Policy 2012, 29, 449–455. [Google Scholar] [CrossRef]
- Peschardt, K.K.; Stigsdotter, U.K. Associations between park characteristics and perceived restorativeness of small public urban green spaces. Landsc. Urban Plan. 2013, 112, 26–39. [Google Scholar] [CrossRef]
- Pleasant, M.M.; Gray, S.A.; Lepczyk, C.; Fernandes, A.; Hunter, N.; Ford, D. Managing cultural ecosystem services. Ecosyst. Serv. 2014, 8, 141–147. [Google Scholar] [CrossRef]
- Rönnbäck, P.; Kautsky, N.; Pihl, L.; Troell, M.; Söderqvist, T.; Wennhage, H. Ecosystem goods and services from Swedish coastal habitats: Identification, valuation, and implications of ecosystem shifts. Ambio 2007, 36, 534–544. [Google Scholar] [CrossRef]
- Barbier, E.B.; Hacker, S.D.; Kennedy, C.; Kock, E.W.; Stier, A.C.; Silliman, B.R. The value of estuarine and coastal ecosystem services. Ecol. Monogr. 2011, 81, 169–193. [Google Scholar] [CrossRef]
- Hauck, J.; Görg, C.; Varjopuro, R.; Ratamäki, O.; Maes, J.; Wittmer, H.; Jax, K. “Maps have an air of authority”: Potential benefits and challenges of ecosystem service maps at different levels of decision making. Ecosyst. Serv. 2013, 4, 25–32. [Google Scholar] [CrossRef]
| Cultural Benefits (CODE) | Description | Examples |
|---|---|---|
| Spiritual and religious (SP) | Sites important for spiritual or religious reasons, rituals and ceremonies; Benefits derived from specific places, features or species within a natural landscape creating sacred, religious or spiritual inspiration, feelings and values. |
|
| Cultural heritage (CULT) | Sites where to feel a connection with the past providing a sense of continuity and understanding of place; Values associated with physical objects, places, practices, traditions, or languages passed on from generation to generation, linked to landscapes, settings, places or culturally significant species. |
|
| Aesthetic (EST) | Benefits associated with the “beauty of nature” including natural, semi-natural and managed landscapes that derived from scenery, sights, sounds, smells and touch. |
|
| Inspiration, creative or artistic (ISP) | Benefits derived from nature as a source of inspiration for paintings, sculptures, poetry, music, weaving, architecture, advertising, etc. or as the basis of myths, folklore and national symbols; Inspiration characterized as enrichment, experience, solace, enlightenment, fulfillment, renewal, and reflection. |
|
| Sense of place and identity (APP) | Benefits derived from “sense of place”, a feeling “at home”, associated with environmental settings or feature of the natural environment that provides a sense of belonging, relations, or connectedness; A sense of identity achieved through interactions with nature that give a sense of who and what someone is, within family, community, universe; Interactions with nature that shape identity and vice versa. |
|
| Social relations/community benefits (REL) | Places, settings and features for social groups to gather, that facilitate positive social interactions between individuals, communities and groups; Opportunities for group hunting or collecting activities which create family or social cohesion and group sharing; Contributions to wellbeing from social interaction, fostering social capital and enhance social wellbeing. |
|
| Education and ecological knowledge (ED) | Opportunities for outdoor learning where observation, experience and experimentation leads to increased ecological knowledge and enhanced connectedness to nature; Enhanced knowledge for other disciplines through improved cognitive outcomes, increased enjoyment of education, better behavior and improved working conditions. |
|
| Health—mental and physical (SAL) | Places where people can undertake physical activity and interact with nature enabling the restoration, maintenance, and/or development of emotional, mental and physical health and well-being; Viewing or being in an environmental setting that contributes to physical, emotional and mental health and wellbeing. |
|
| Leisure, recreation and eco-tourism (RIC) | Places that attract people for visiting and that can be enriched by the experience; Benefits derived from experiencing a tour in a place, or where it is possible to make recreational activities outdoor or indoor. |
|
| Existence/bequest values (INT) | Some people value knowing that particular natural areas, wild species, or special natural feature exist irrespective of their own use, or the use of others—they just value knowing they exist and/or are protected or preserved for the enjoyment of future generations. |
|
| Age Class | Typology of House | ||
| 20–30 | 6% | apartment | 87% |
| 31–40 | 26% | house with garden | 6% |
| 41–50 | 10% | none | 6% |
| 51–60 | 35% | House Distance (Minutes) | |
| 61–70 | 23% | <15 | 65% |
| Sex | 15–30 | 23% | |
| m | 61% | 30–60 | 13% |
| f | 39% | >60 | |
| Employment | Work Close to Park | ||
| student | 6% | yes | 35% |
| retired/unemployed | 32% | no | 61% |
| part-time worker | 13% | none | 3% |
| full-time worker | 42% | Reasons for Visit | |
| other | 3% | walk | 29% |
| none | 3% | kids | 3% |
| Education | sport | 17% | |
| secondary school | 6% | dog | 4% |
| high school | 58% | meet people | 9% |
| university | 35% | read | 3% |
| Kids | park volunteer | 9% | |
| yes | 23% | others | 26% |
| no | 74% | Frequency of Visiting | |
| none | 3% | 1 time/day | 6% |
| Dog Owner | 3 times/week | 29% | |
| yes | 19% | 1 time/week | 35% |
| no | 81% | 1 time/month | 26% |
| Municipality of Residence | none | 3% | |
| Cinisello Balsamo | 35% | Time Spent per Visiting | |
| Milano | 29% | 1 h | 40% |
| Sesto San Giovanni | 16% | entire day | 3% |
| Bresso | 6% | half day | 50% |
| Milano Bicocca | 6% | none | 3% |
| none | 6% | other (it depends) | 3% |
| Code | Benefit | Score | |
|---|---|---|---|
| Mean | Std. Dev. | ||
| ED | Education and ecological knowledge | 9.42 | 0.94 |
| SAL | Health—mental and physical | 8.97 | 1.20 |
| INT | Existence/bequest values | 8.57 | 1.31 |
| EST | Aesthetic | 8.42 | 1.26 |
| CULT | Cultural heritage | 8.13 | 1.16 |
| APP | Identity and sense of place | 7.90 | 1.49 |
| RIC | Leisure, recreation and eco-tourism | 7.90 | 1.47 |
| REL | Social relations/community benefits | 7.45 | 1.68 |
| SIP | Inspiration, creative or artistic | 6.77 | 1.58 |
| SP | Spiritual and religious | 5.39 | 2.47 |
| Zone | Zone Name | SP | CULT | EST | ISP | APP | REL | ED | SAL | RIC | INT | Aggreg | Match | Mismatch | Citizens | Park | |
|---|---|---|---|---|---|---|---|---|---|---|---|---|---|---|---|---|---|
| 21 | MONTAGNETTA | P/A Park m. | 1 | 1 | 1 | 1 | 1 | 1 | 1 | 1 | 1 | 0 | 9 | x | + | + | |
| P/A Citiz | 1 | 1 | 1 | 1 | 1 | 1 | 1 | 1 | 1 | 1 | 10 | ||||||
| Marks Citiz | 4 | 13 | 8 | 5 | 2 | 4 | 1 | 6 | 4 | 12 | 59 | ||||||
| 1 | CASCINA SEDE PARCO | P/A Park m. | 1 | 1 | 1 | 1 | 1 | 1 | 1 | 1 | 1 | 0 | 9 | x | + | + | |
| P/A Citiz | 0 | 1 | 1 | 1 | 1 | 1 | 1 | 1 | 1 | 1 | 9 | ||||||
| Marks Citiz | 0 | 6 | 4 | 1 | 5 | 10 | 13 | 6 | 7 | 12 | 64 | ||||||
| 20 | LAGO MONTAGNETTA | P/A Park m. | 1 | 1 | 1 | 1 | 1 | 1 | 1 | 1 | 1 | 0 | 9 | x | + | + | |
| P/A Citiz | 0 | 1 | 1 | 1 | 1 | 1 | 1 | 1 | 1 | 1 | 9 | ||||||
| Marks Citiz | 0 | 1 | 3 | 1 | 2 | 5 | 3 | 6 | 5 | 12 | 38 | ||||||
| 4 | PRIMO LOTTO | P/A Park m. | 0 | 0 | 1 | 1 | 1 | 1 | 1 | 1 | 1 | 1 | 8 | x | + | + | |
| P/A Citiz | 0 | 1 | 1 | 1 | 1 | 1 | 1 | 1 | 1 | 1 | 9 | ||||||
| Marks Citiz | 0 | 1 | 3 | 2 | 1 | 3 | 4 | 10 | 5 | 12 | 41 | ||||||
| 30 | VILLA MANZONI | P/A Park m. | 1 | 1 | 1 | 1 | 1 | 1 | 0 | 1 | 1 | 0 | 8 | x | + | + | |
| P/A Citiz | 0 | 1 | 1 | 1 | 1 | 1 | 1 | 1 | 1 | 1 | 9 | ||||||
| Marks Citiz | 0 | 2 | 3 | 1 | 1 | 2 | 1 | 5 | 3 | 12 | 30 | ||||||
| 6 | INGRESSO CLERICI | P/A Park m. | 1 | 1 | 1 | 1 | 1 | 0 | 0 | 1 | 1 | 0 | 7 | x | + | + | |
| P/A Citiz | 0 | 1 | 1 | 1 | 1 | 1 | 1 | 1 | 1 | 1 | 9 | ||||||
| Marks Citiz | 0 | 2 | 5 | 2 | 2 | 3 | 4 | 6 | 5 | 12 | 41 | ||||||
| 2 | BOSCHI NORD CASCINA | P/A Park m. | 1 | 0 | 1 | 1 | 0 | 1 | 1 | 1 | 1 | 0 | 7 | x | + | + | |
| P/A Citiz | 0 | 1 | 1 | 1 | 1 | 1 | 1 | 1 | 1 | 1 | 9 | ||||||
| Marks Citiz | 0 | 2 | 2 | 2 | 2 | 5 | 5 | 6 | 4 | 12 | 40 | ||||||
| 19 | TORRETTA | P/A Park m. | 1 | 1 | 1 | 1 | 0 | 1 | 0 | 1 | 1 | 0 | 7 | x | + | + | |
| P/A Citiz | 0 | 1 | 1 | 0 | 1 | 1 | 1 | 1 | 1 | 1 | 8 | ||||||
| Marks Citiz | 0 | 4 | 2 | 0 | 1 | 3 | 1 | 5 | 5 | 12 | 33 | ||||||
| 28 | ADRIATICO | P/A Park m. | 1 | 0 | 1 | 0 | 1 | 1 | 1 | 1 | 1 | 0 | 7 | x | + | + | |
| P/A Citiz | 0 | 0 | 1 | 0 | 1 | 1 | 1 | 1 | 1 | 1 | 7 | ||||||
| Marks Citiz | 0 | 0 | 1 | 0 | 1 | 5 | 2 | 5 | 3 | 12 | 29 | ||||||
| 22 | VELODROMO | P/A Park m. | 0 | 1 | 1 | 1 | 0 | 0 | 1 | 1 | 1 | 0 | 6 | x | + | + | |
| P/A Citiz | 0 | 0 | 1 | 1 | 1 | 1 | 1 | 1 | 1 | 1 | 8 | ||||||
| Marks Citiz | 0 | 0 | 2 | 1 | 1 | 4 | 3 | 8 | 8 | 13 | 40 | ||||||
| 46 | CONTI BIGLIA FAITI | P/A Park m. | 0 | 1 | 1 | 1 | 1 | 0 | 0 | 1 | 1 | 0 | 6 | x | + | + | |
| P/A Citiz | 0 | 1 | 1 | 0 | 1 | 1 | 1 | 1 | 1 | 1 | 8 | ||||||
| Marks Citiz | 0 | 2 | 1 | 0 | 2 | 2 | 2 | 6 | 4 | 12 | 31 | ||||||
| 24 | BORROMEO | P/A Park m. | 0 | 0 | 1 | 1 | 1 | 1 | 0 | 1 | 1 | 0 | 6 | x | + | + | |
| P/A Citiz | 0 | 0 | 1 | 0 | 1 | 1 | 1 | 1 | 1 | 1 | 7 | ||||||
| Marks Citiz | 0 | 0 | 2 | 0 | 2 | 5 | 1 | 6 | 5 | 12 | 33 | ||||||
| 23 | LAGO BRESSO | P/A Park m. | 0 | 0 | 1 | 0 | 1 | 1 | 1 | 1 | 1 | 0 | 6 | x | + | + | |
| P/A Citiz | 0 | 0 | 0 | 1 | 0 | 1 | 1 | 1 | 1 | 1 | 6 | ||||||
| Marks Citiz | 0 | 0 | 0 | 1 | 0 | 2 | 3 | 5 | 2 | 12 | 25 | ||||||
| 42 | LAGO NIGUARDA | P/A Park m. | 0 | 0 | 1 | 1 | 1 | 0 | 0 | 1 | 1 | 0 | 5 | x | + | − | |
| P/A Citiz | 0 | 1 | 1 | 1 | 1 | 1 | 1 | 1 | 1 | 1 | 9 | ||||||
| Marks Citiz | 0 | 2 | 8 | 4 | 1 | 7 | 4 | 9 | 5 | 12 | 52 | ||||||
| 3 | LAGO CINISELLO | P/A Park m. | 0 | 1 | 1 | 0 | 0 | 0 | 0 | 1 | 1 | 1 | 5 | x | + | − | |
| P/A Citiz | 0 | 1 | 1 | 1 | 1 | 1 | 1 | 1 | 1 | 1 | 9 | ||||||
| Marks Citiz | 0 | 2 | 5 | 4 | 2 | 3 | 5 | 9 | 5 | 12 | 47 | ||||||
| 5 | SECONDO LOTTO | P/A Park m. | 0 | 0 | 1 | 0 | 0 | 0 | 1 | 1 | 1 | 1 | 5 | x | + | − | |
| P/A Citiz | 0 | 1 | 1 | 1 | 1 | 1 | 1 | 1 | 1 | 1 | 9 | ||||||
| Marks Citiz | 0 | 1 | 4 | 2 | 2 | 2 | 5 | 10 | 5 | 12 | 43 | ||||||
| 33 | LAGO BRUZZANO | P/A Park m. | 0 | 1 | 1 | 0 | 0 | 1 | 0 | 1 | 1 | 0 | 5 | x | + | − | |
| P/A Citiz | 0 | 1 | 1 | 1 | 1 | 1 | 1 | 1 | 1 | 1 | 9 | ||||||
| Marks Citiz | 0 | 2 | 6 | 3 | 2 | 1 | 6 | 6 | 3 | 12 | 41 | ||||||
| 40 | PARCO DI BRUZZANO | P/A Park m. | 0 | 1 | 1 | 0 | 0 | 1 | 0 | 1 | 1 | 0 | 5 | x | + | − | |
| P/A Citiz | 0 | 0 | 1 | 1 | 1 | 1 | 1 | 1 | 1 | 1 | 8 | ||||||
| Marks Citiz | 0 | 0 | 5 | 2 | 1 | 2 | 4 | 8 | 3 | 12 | 37 | ||||||
| 14 | CENTRO SCOLASTICO | P/A Park m. | 0 | 0 | 1 | 0 | 1 | 1 | 1 | 0 | 1 | 0 | 5 | x | + | − | |
| P/A Citiz | 0 | 1 | 0 | 1 | 1 | 1 | 1 | 1 | 1 | 1 | 8 | ||||||
| Marks Citiz | 0 | 4 | 0 | 1 | 2 | 4 | 3 | 6 | 3 | 13 | 36 | ||||||
| 44 | BISNATI INTERELLO | P/A Park m. | 1 | 0 | 0 | 0 | 1 | 1 | 0 | 1 | 1 | 0 | 5 | x | + | − | |
| P/A Citiz | 1 | 1 | 0 | 0 | 1 | 1 | 1 | 1 | 1 | 1 | 8 | ||||||
| Marks Citiz | 1 | 1 | 0 | 0 | 1 | 3 | 1 | 5 | 6 | 12 | 30 | ||||||
| 45 | BOSISIO CONTI BIGLIA | P/A Park m. | 0 | 0 | 1 | 0 | 0 | 1 | 1 | 1 | 1 | 0 | 5 | x | + | − | |
| P/A Citiz | 0 | 1 | 1 | 0 | 1 | 1 | 1 | 1 | 1 | 1 | 8 | ||||||
| Marks Citiz | 0 | 2 | 2 | 0 | 1 | 3 | 2 | 5 | 3 | 12 | 30 | ||||||
| 36 | GIARDINI DELLA SCIENZA | P/A Park m. | 0 | 1 | 0 | 1 | 1 | 0 | 0 | 1 | 1 | 0 | 5 | x | + | − | |
| P/A Citiz | 0 | 1 | 0 | 1 | 0 | 1 | 1 | 1 | 1 | 1 | 7 | ||||||
| Marks Citiz | 0 | 1 | 0 | 1 | 0 | 2 | 4 | 5 | 3 | 13 | 29 | ||||||
| 25 | AREZZO EMPOLI | P/A Park m. | 0 | 0 | 1 | 0 | 1 | 1 | 0 | 1 | 1 | 0 | 5 | x | + | − | |
| P/A Citiz | 0 | 0 | 0 | 0 | 1 | 1 | 1 | 1 | 1 | 1 | 6 | ||||||
| Marks Citiz | 0 | 0 | 0 | 0 | 1 | 5 | 1 | 5 | 3 | 12 | 27 | ||||||
| 35 | PASTA DELEDDA | P/A Park m. | 0 | 1 | 0 | 0 | 1 | 1 | 0 | 1 | 1 | 0 | 5 | x | + | − | |
| P/A Citiz | 0 | 0 | 0 | 0 | 1 | 1 | 1 | 1 | 1 | 1 | 6 | ||||||
| Marks Citiz | 0 | 0 | 0 | 0 | 1 | 2 | 1 | 6 | 5 | 12 | 27 | ||||||
| 38 | VASCA SEVESO | P/A Park m. | 0 | 1 | 1 | 0 | 0 | 0 | 1 | 1 | 1 | 0 | 5 | x | + | − | |
| P/A Citiz | 0 | 0 | 0 | 1 | 0 | 1 | 1 | 1 | 1 | 1 | 6 | ||||||
| Marks Citiz | 0 | 0 | 0 | 1 | 0 | 1 | 3 | 6 | 3 | 12 | 26 | ||||||
| 26 | DON VERCESI | P/A Park m. | 0 | 0 | 1 | 0 | 1 | 1 | 0 | 1 | 1 | 0 | 5 | x | + | − | |
| P/A Citiz | 0 | 0 | 0 | 0 | 1 | 1 | 1 | 1 | 1 | 1 | 6 | ||||||
| Marks Citiz | 0 | 0 | 0 | 0 | 1 | 1 | 2 | 7 | 2 | 12 | 25 | ||||||
| 8 | BOSCHI DELLE FAMIGLIE | P/A Park m. | 1 | 0 | 1 | 0 | 0 | 1 | 0 | 1 | 1 | 0 | 5 | x | − | ||
| P/A Citiz | 0 | 0 | 0 | 0 | 0 | 1 | 1 | 1 | 1 | 1 | 5 | ||||||
| Marks Citiz | 0 | 0 | 0 | 0 | 0 | 1 | 1 | 5 | 2 | 12 | 21 | ||||||
| 47 | EX VIVAIO | P/A Park m. | 0 | 0 | 1 | 0 | 0 | 1 | 0 | 1 | 1 | 0 | 4 | x | + | − | |
| P/A Citiz | 0 | 1 | 1 | 0 | 1 | 1 | 1 | 1 | 1 | 1 | 8 | ||||||
| Marks Citiz | 0 | 1 | 2 | 0 | 1 | 4 | 4 | 5 | 6 | 12 | 35 | ||||||
| 27 | SALTO DEL GATTO | P/A Park m. | 0 | 0 | 1 | 0 | 0 | 1 | 0 | 1 | 1 | 0 | 4 | x | + | − | |
| P/A Citiz | 0 | 0 | 1 | 0 | 1 | 1 | 1 | 1 | 1 | 1 | 7 | ||||||
| Marks Citiz | 0 | 0 | 1 | 0 | 1 | 2 | 2 | 7 | 2 | 12 | 27 | ||||||
| 15 | AEROPORTO | P/A Park m. | 1 | 1 | 1 | 0 | 0 | 0 | 0 | 0 | 1 | 0 | 4 | x | + | − | |
| P/A Citiz | 0 | 1 | 0 | 0 | 1 | 1 | 1 | 1 | 1 | 1 | 7 | ||||||
| Marks Citiz | 0 | 1 | 0 | 0 | 2 | 1 | 2 | 5 | 2 | 12 | 25 | ||||||
| 48 | MAJORANA PRONTO SOCCORSO | P/A Park m. | 0 | 0 | 1 | 1 | 0 | 0 | 0 | 1 | 1 | 0 | 4 | x | + | − | |
| P/A Citiz | 0 | 0 | 0 | 0 | 1 | 1 | 1 | 1 | 1 | 1 | 6 | ||||||
| Marks Citiz | 0 | 0 | 0 | 0 | 2 | 2 | 1 | 5 | 6 | 12 | 28 | ||||||
| 31 | BRUSUGLIO | P/A Park m. | 1 | 1 | 1 | 0 | 0 | 0 | 0 | 0 | 1 | 0 | 4 | x | + | − | |
| P/A Citiz | 1 | 0 | 0 | 0 | 0 | 1 | 1 | 1 | 1 | 1 | 6 | ||||||
| Marks Citiz | 6 | 0 | 0 | 0 | 0 | 1 | 1 | 5 | 2 | 12 | 27 | ||||||
| 43 | CESARI ORNATO | P/A Park m. | 0 | 0 | 1 | 0 | 1 | 0 | 0 | 1 | 1 | 0 | 4 | x | + | − | |
| P/A Citiz | 0 | 1 | 0 | 0 | 0 | 1 | 1 | 1 | 1 | 1 | 6 | ||||||
| Marks Citiz | 0 | 1 | 0 | 0 | 0 | 2 | 2 | 5 | 3 | 12 | 25 | ||||||
| 11 | VIALE BUFFOLI | P/A Park m. | 0 | 0 | 1 | 0 | 1 | 0 | 0 | 1 | 1 | 0 | 4 | x | - | − | |
| P/A Citiz | 0 | 0 | 0 | 0 | 0 | 1 | 1 | 1 | 1 | 1 | 5 | ||||||
| Marks Citiz | 0 | 0 | 0 | 0 | 0 | 1 | 1 | 6 | 3 | 12 | 23 | ||||||
| 7 | ROTONDA QUERCE ROSSE | P/A Park m. | 0 | 0 | 1 | 0 | 0 | 0 | 0 | 1 | 1 | 0 | 3 | x | + | − | |
| P/A Citiz | 0 | 1 | 1 | 1 | 1 | 1 | 1 | 1 | 1 | 1 | 9 | ||||||
| Marks Citiz | 0 | 1 | 3 | 2 | 3 | 4 | 2 | 7 | 4 | 12 | 38 | ||||||
| 49 | FERMI MORESCHI | P/A Park m. | 0 | 0 | 1 | 0 | 0 | 0 | 0 | 1 | 1 | 0 | 3 | x | + | − | |
| P/A Citiz | 0 | 1 | 1 | 0 | 1 | 1 | 1 | 1 | 1 | 1 | 8 | ||||||
| Marks Citiz | 0 | 1 | 1 | 0 | 2 | 2 | 2 | 5 | 6 | 12 | 31 | ||||||
| 9 | VIA TUROLDO | P/A Park m. | 0 | 0 | 1 | 0 | 0 | 0 | 0 | 1 | 1 | 0 | 3 | x | + | − | |
| P/A Citiz | 0 | 0 | 0 | 0 | 1 | 1 | 1 | 1 | 1 | 1 | 6 | ||||||
| Marks Citiz | 0 | 0 | 0 | 0 | 1 | 1 | 1 | 5 | 2 | 12 | 22 | ||||||
| 29 | SEVESO CUSANO | P/A Park m. | 0 | 1 | 1 | 0 | 0 | 0 | 0 | 0 | 1 | 0 | 3 | x | - | − | |
| P/A Citiz | 0 | 0 | 0 | 0 | 0 | 1 | 1 | 1 | 1 | 1 | 5 | ||||||
| Marks Citiz | 0 | 0 | 0 | 0 | 0 | 1 | 2 | 5 | 2 | 12 | 22 | ||||||
| 10 | VIA PER BRESSO | P/A Park m. | 0 | 0 | 0 | 0 | 0 | 1 | 0 | 1 | 1 | 0 | 3 | x | - | − | |
| P/A Citiz | 0 | 0 | 0 | 0 | 0 | 1 | 1 | 1 | 1 | 1 | 5 | ||||||
| Marks Citiz | 0 | 0 | 0 | 0 | 0 | 1 | 1 | 5 | 2 | 12 | 21 | ||||||
| 13 | TRANVIA GORKY | P/A Park m. | 0 | 0 | 1 | 0 | 0 | 0 | 0 | 1 | 1 | 0 | 3 | x | - | − | |
| P/A Citiz | 0 | 0 | 0 | 0 | 0 | 1 | 1 | 1 | 1 | 1 | 5 | ||||||
| Marks Citiz | 0 | 0 | 0 | 0 | 0 | 1 | 1 | 5 | 2 | 12 | 21 | ||||||
| 16 | BUNKER | P/A Park m. | 0 | 0 | 1 | 0 | 0 | 0 | 0 | 1 | 1 | 0 | 3 | x | - | − | |
| P/A Citiz | 0 | 0 | 0 | 0 | 0 | 1 | 1 | 1 | 1 | 1 | 5 | ||||||
| Marks Citiz | 0 | 0 | 0 | 0 | 0 | 1 | 1 | 5 | 2 | 12 | 21 | ||||||
| 18 | CONDOMINIO CLERICI | P/A Park m. | 0 | 1 | 1 | 0 | 0 | 0 | 0 | 0 | 1 | 0 | 3 | x | - | − | |
| P/A Citiz | 0 | 0 | 0 | 0 | 0 | 1 | 1 | 1 | 1 | 1 | 5 | ||||||
| Marks Citiz | 0 | 0 | 0 | 0 | 0 | 1 | 1 | 5 | 2 | 12 | 21 | ||||||
| 32 | FERROVIE NORD | P/A Park m. | 0 | 0 | 1 | 0 | 0 | 1 | 0 | 0 | 1 | 0 | 3 | x | - | − | |
| P/A Citiz | 0 | 0 | 0 | 0 | 0 | 1 | 1 | 1 | 1 | 1 | 5 | ||||||
| Marks Citiz | 0 | 0 | 0 | 0 | 0 | 1 | 1 | 5 | 2 | 12 | 21 | ||||||
| 12 | OSPEDALE BASSINI | P/A Park m. | 0 | 0 | 0 | 0 | 0 | 0 | 0 | 1 | 1 | 0 | 2 | x | + | − | |
| P/A Citiz | 0 | 1 | 0 | 1 | 1 | 1 | 1 | 1 | 1 | 1 | 8 | ||||||
| Marks Citiz | 0 | 2 | 0 | 1 | 1 | 3 | 1 | 6 | 3 | 13 | 30 | ||||||
| 37 | CIMITERO BRUZZANO | P/A Park m. | 1 | 0 | 0 | 0 | 0 | 0 | 0 | 0 | 1 | 0 | 2 | x | + | − | |
| P/A Citiz | 1 | 0 | 0 | 0 | 1 | 1 | 1 | 1 | 1 | 1 | 7 | ||||||
| Marks Citiz | 8 | 0 | 0 | 0 | 1 | 3 | 1 | 5 | 2 | 12 | 32 | ||||||
| 41 | PASTA NIGUARDA | P/A Park m. | 0 | 0 | 0 | 0 | 0 | 0 | 0 | 1 | 1 | 0 | 2 | x | + | − | |
| P/A Citiz | 0 | 1 | 0 | 0 | 0 | 1 | 1 | 1 | 1 | 1 | 6 | ||||||
| Marks Citiz | 0 | 1 | 0 | 0 | 0 | 1 | 2 | 5 | 3 | 12 | 24 | ||||||
| 34 | INGRESSO MARTINAZZOLI | P/A Park m. | 0 | 0 | 1 | 0 | 0 | 0 | 0 | 0 | 1 | 0 | 2 | x | - | − | |
| P/A Citiz | 0 | 0 | 0 | 0 | 0 | 1 | 1 | 1 | 1 | 1 | 5 | ||||||
| Marks Citiz | 0 | 0 | 0 | 0 | 0 | 1 | 1 | 5 | 2 | 12 | 21 | ||||||
| 39 | VIA COMBONI | P/A Park m. | 0 | 0 | 1 | 0 | 0 | 0 | 0 | 0 | 1 | 0 | 2 | x | - | − | |
| P/A Citiz | 0 | 0 | 0 | 0 | 0 | 1 | 1 | 1 | 1 | 1 | 5 | ||||||
| Marks Citiz | 0 | 0 | 0 | 0 | 0 | 1 | 1 | 5 | 2 | 12 | 21 | ||||||
| 17 | CRI ELISOCCORSO | P/A Park m. | 0 | 0 | 0 | 0 | 0 | 0 | 0 | 0 | 1 | 0 | 1 | x | - | − | |
| P/A Citiz | 0 | 0 | 0 | 0 | 0 | 1 | 1 | 1 | 1 | 1 | 5 | ||||||
| Marks Citiz | 0 | 0 | 0 | 0 | 0 | 1 | 1 | 5 | 2 | 12 | 21 |
© 2017 by the authors. Licensee MDPI, Basel, Switzerland. This article is an open access article distributed under the terms and conditions of the Creative Commons Attribution (CC BY) license (http://creativecommons.org/licenses/by/4.0/).
Share and Cite
Canedoli, C.; Bullock, C.; Collier, M.J.; Joyce, D.; Padoa-Schioppa, E. Public Participatory Mapping of Cultural Ecosystem Services: Citizen Perception and Park Management in the Parco Nord of Milan (Italy). Sustainability 2017, 9, 891. https://doi.org/10.3390/su9060891
Canedoli C, Bullock C, Collier MJ, Joyce D, Padoa-Schioppa E. Public Participatory Mapping of Cultural Ecosystem Services: Citizen Perception and Park Management in the Parco Nord of Milan (Italy). Sustainability. 2017; 9(6):891. https://doi.org/10.3390/su9060891
Chicago/Turabian StyleCanedoli, Claudia, Craig Bullock, Marcus J. Collier, Deirdre Joyce, and Emilio Padoa-Schioppa. 2017. "Public Participatory Mapping of Cultural Ecosystem Services: Citizen Perception and Park Management in the Parco Nord of Milan (Italy)" Sustainability 9, no. 6: 891. https://doi.org/10.3390/su9060891