Article

An Empirical Analysis of the Impact of Agricultural Product Price Fluctuations on China’s Grain Yield

1
Institute of Ecological Civilization, Jiangxi University of Finance and Economics, Nanchang 330013, China
2
Co-Innovation Center of Institutional Construction for Jiangxi Eco-Civilization, Jiangxi University of Finance and Economics, Nanchang 330013, China
3
School of Economics, Jiangxi University of Finance and Economics, Nanchang 330032, China
*
Author to whom correspondence should be addressed.
Sustainability 2017, 9(6), 906; https://doi.org/10.3390/su9060906
Submission received: 24 April 2017 / Revised: 20 May 2017 / Accepted: 23 May 2017 / Published: 29 May 2017

Abstract

:
In recent years, food security, especially supply, has been an important issue in China’s agricultural production. The stability of grain prices is related to the stability and development of the grain market. Based on agricultural production data from 1970 to 2015, this paper explores the influence of agricultural product price fluctuation on grain production by using the cobweb theory and vector error correction (VEC) model. The results show that changes in grain production in China are affected by fluctuations in agricultural product prices, that the production change lags behind the price change, and that there is a long-term equilibrium relationship between grain yield and agricultural product price. A Granger causality test shows that the change in agricultural product price is the Granger cause of grain yield change.

1. Introduction

The most important problem in Chinese agriculture is the well-being of farmers, and farmers’ most important protection comes from food production. Since the economic reforms and policies of opening up beginning in the late 1970s, China’s agricultural prices have shown a trend of frequent fluctuations, which has had a very negative impact on farmers’ grain production and China’s agricultural economy [1]. Frequent fluctuations in food prices are not conducive to farmers forming stable food price expectations; thus, farmers cannot use food prices to make a reasonable grain production plan for the next year. In addition, a rise in food prices causes other commodity prices to rise, which leads to inflation and is not conducive to China’s economic stability [2]. When the price of agricultural products rises, the stabilization of prices will become a key concern of the government. The government will often take measures to suppress this process. However, when the prices of agricultural products fall, the lack of policy assistance measures will often come at the expense of the interests of farmers, seriously damaging the enthusiasm of farmers [3]. Once farmers’ production incentives are diminished, the effective supply of food is difficult to protect. The pricing of agricultural products is an important part of China’s macro-control policies for economic development, and the implementation of such policies has a very important role in the supply and demand of agricultural products in China. Food pricing also has a crucial impact on China’s economic development and the welfare of farmers. Frequent fluctuations in food prices will make it difficult for the government to implement effective macro-control measures for the grain market. Thus, the fluctuation of the price of agricultural products is closely related to China’s grain production and food security. The goal of this paper is to explore how the volatility of agricultural prices affects grain production.
The empirical study of the price fluctuation of agricultural products began in the early 20th century. The economist Henry L. Moore described the concept of “business cycles” in 1914 and “cotton income and price forecasts” in 1917. These studies were pioneering works on price fluctuations of agricultural products. Moore’s work also directly promoted the development of agricultural product prices and the academic content related to supply and demand. CSC Sekhar analyzed the characteristics of agricultural product price fluctuations based on monthly data from 1970 to 2001. The results showed that the international agricultural product price cycle is longer than the domestic agricultural product price cycle [4]. Lu showed that food demand is constantly increasing, while the food supply is decreasing due to rising food costs; thus, the resulting imbalance in food supply and demand is the main cause of food price volatility [5]. Gilbert argued that the impact of climate factors on major grain-producing areas can lead to unpredictable food production [6]. Abbott agreed with this view [7]. In addition, Xie and He think that ecological land changes [8] and cultivated land use intensity [9] (including the multiple cropping index [10]) will also make production forecasting complex. Xie and Wang’s paper shows that the variables associated with the agricultural products yield are significantly correlated with farmland abandonment [11]. Rayner and Reed found that a series of policies adopted by the government, such as trade intervention policies and price support policies, helped to improve food price volatility [12]. This is also recognized by Denver Colorado [13], Hennessy [14] and John Baffes’s [15] articles. Zhang and Chen show that grain indices did not significantly respond to the expected volatility in oil prices, in contrast to the petrochemicals and oil fats indices [16]. Ceballos used the GARCH model to study the transmission mechanism of international grain prices on the domestic food price [17]. Shuqin also used this method to discuss transmission relationships of price volatility relationships between the international and domestic prices of three grains in 24 developing countries [18]. Lee’s results suggest that the volatility of oil and grain markets are very persistent since the common factor generating the stochastic volatilities of oil and commodity markets is highly persistent [19].
Since the reform and opening up, although the overall trend of China’s grain production has exhibited rapid growth, in the short term, there have been large price fluctuations that have led to food production declines [20]. The National Bureau of Statistics published the article “China’s food supply and demand and the ‘thirteen five’ trend forecast,” which noted that during the period 1999–2003, grain production continued to decline, and in the past few years, there was not only a large reduction in grain-sown area, but yield levels were also reduced. In 2003, the national grain output was only 430.7 million tons, down 15.9% from 1998 and down 3.4% annually, to the lowest level since 1990. Jiang using a local adjustment model, concluded that China’s grain price elasticity is relatively low, and an excessive supply of labor is one of the reasons why China’s grain production reflects the weakening of prices [21]. Liao and Li using the main rice-producing areas in central China as the research object, found that the use of fine varieties and fertilizers is an effective way to improve food production [22]; Sun and Yu used the Granger causality test to analyze the intrinsic relationship between grain yield and price and found that the impact of grain purchase price on grain production is greater than the impact of retail prices on grain production [23]. Wen and Wang showed that China’s grain prices are not only affected by traditional factors such as inflation, grain production, labor price and exchange rates but also by national financial and other agricultural policies [24]. Tokgoz believes that the rise in crude oil prices will also affect food prices to a certain extent [25]. Zhan and Feng used the C-D function to analyze the relationship between grain price and sown area in China and concluded that an increase in the grain price will cause farmers to increase the planting area to increase the input of grain production [26]. Luo using the Nerlove model of China’s food supply response to conduct an empirical analysis, showed that China’s grain supply elasticity is not high in the short- or long-term, indicating that China’s grain production is difficult to change quickly according to the sown area [27]. Wei and Wang based on a VEC model study, found that in the short term, the previous period of food prices, farmer income and the previous period of grain yield have negative effects on the current grain yield; the negative effects of grain production in the previous period are the greatest, but in the long run, grain prices have positive effects on grain production [28]. Han and Wei based on the cobweb model, showed that food prices with market supply and demand changes gradually deviated from the equilibrium point, and this fluctuation cannot be resolved based on market regulation [29]. Wu and Li used the univariate EGARCH model and the VAR model to study the asymmetry of China’s single grain market price and the asymmetry between different grain markets based on the weekly data of wheat, maize and soybean grain market prices. The results show that only corn market prices are asymmetric; the asymmetric price of different food market prices showed that the price increase in the wheat market would trigger a rise in corn and soybean market prices, whereas increased corn and soybean prices would not trigger an increase in wheat prices [30]. Wu and Huo used the VAR model to analyze the characteristics and fluctuation relationship between the two-track system and the marketed grain price fluctuation. They found that the price volatility of the wheat market and the corn market under the market was significantly less than the price volatility of the two-track system [31]. In the face of food price volatility and food security instability, safeguarding food security is very important [32]. Fraser and Legwegoh believe that national policies are needed to ensure adequate food storage [33]. Paul [34] and Sckokm [35] also thinks so.
The study of food prices and food production is of great practical value to the maintenance of food security and the promotion of food market development. Through the review of these documents, we can find that most scholars use the supply and demand point of view to research food production problems. These researchers use the supply reaction model to study the relationship between grain prices and yield, and some research is based on the price of a single grain variety, but there is a lack of empirical research on agricultural prices for food production. Therefore, based on the data of agricultural product prices and grain yield in the past 30 years, this paper conducts an empirical analysis of the relationship between agricultural product price and grain yield by using a VAR model and Granger causality test on the basis of descriptive analysis of agricultural product price and grain yield. Based on the relevant results, the paper presents policy advice to reduce the frequent fluctuations in China’s agricultural price situation.

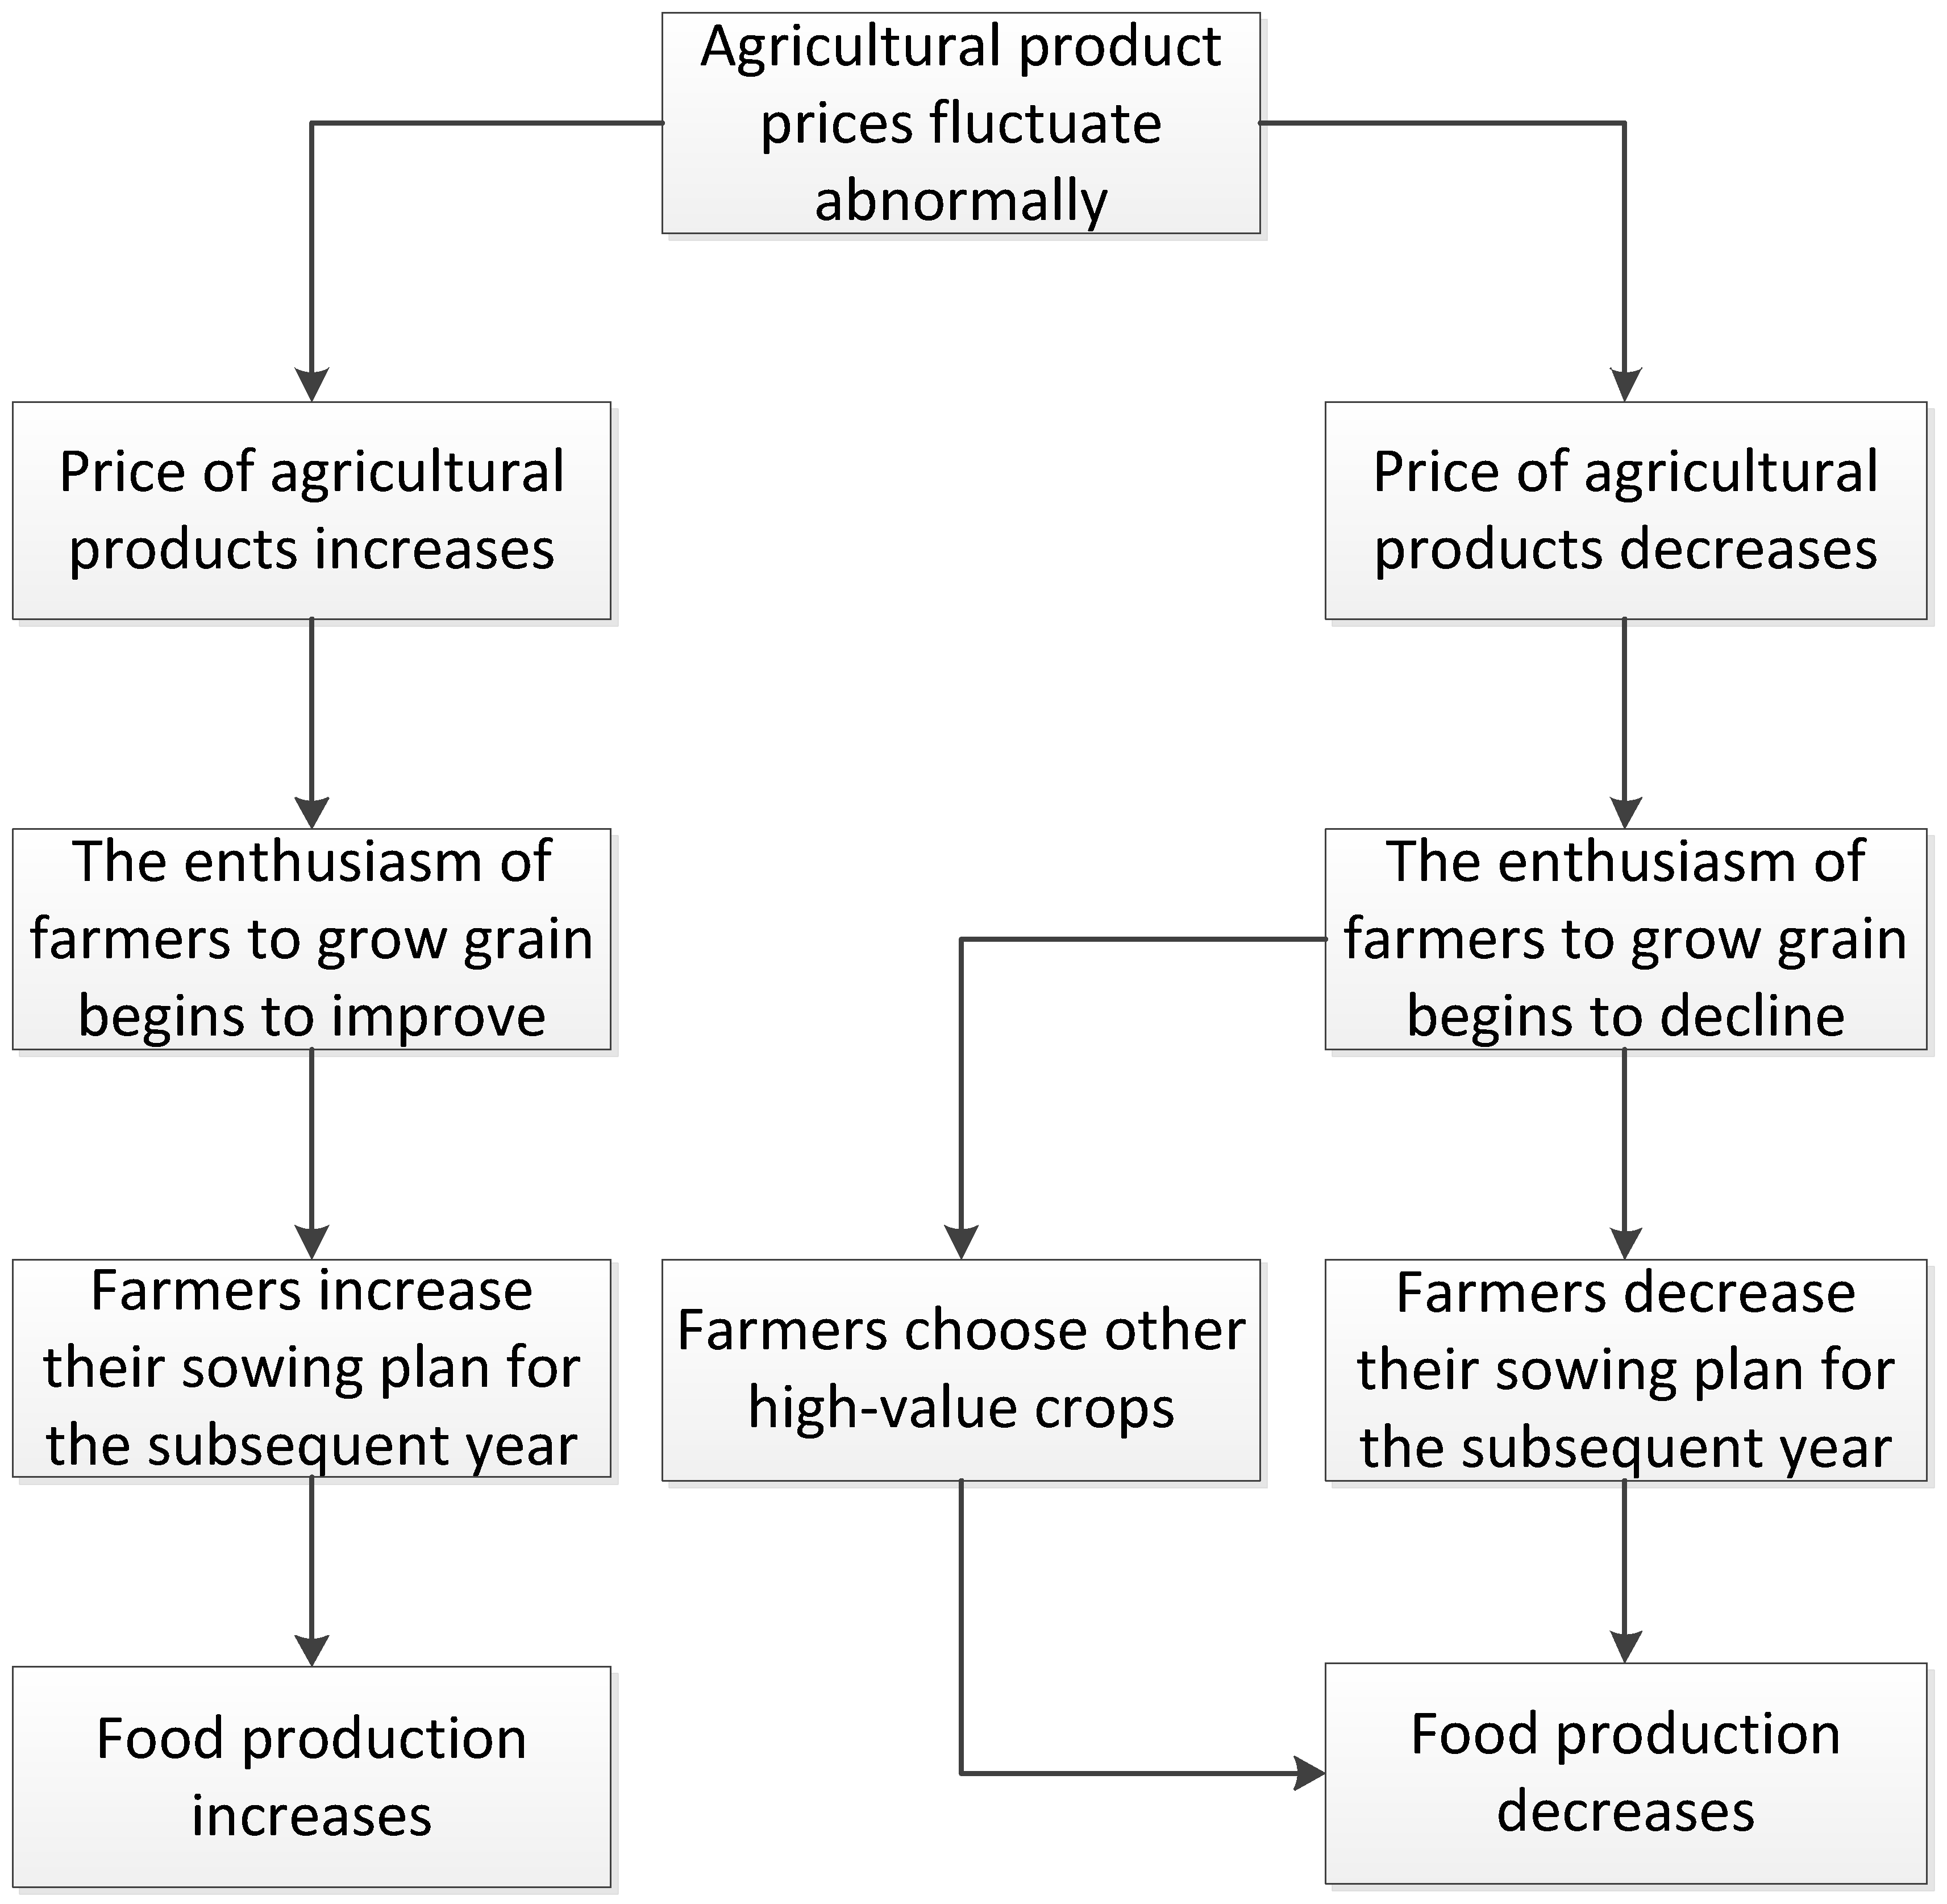
2. The Transmission Mechanism of Agricultural Products’ Price Fluctuations and Grain Production

The cobweb theory is a dynamic analysis theory that uses the elasticity principle to explain the different fluctuations in some commodities with long production periods when they lose balance [36]. The basic assumption of the cobweb theory is that the current production of the commodity is determined by the price in the previous period. According to the assumptions of the cobweb model, farmers will determine the current grain-sown area according to the price of the previous period before the grain production is carried out. Then, the current grain price will have determined the grain yield of the next period to a certain extent. Thus, in the food supply and demand model, the impact of price changes on the supply of food will be substantial. The higher the price of agricultural products, the stronger the enthusiasm of farmers, and the food production will increase. In contrast, lower prices of agricultural products will dampen the enthusiasm of farmers to increase grain production so that farmers will reduce the next year’s planting plan, which will lead to a reduction of that year’s grain production.
Based on the cobweb theory, the price transmission mechanism of agricultural products takes the price as the link. When the price of an agricultural product fluctuates abnormally, the farmers will spontaneously adjust the agricultural planting structure in the next period. If the prices of agricultural products continue to fall, the farmers will choose other crops with a high economic value, and this will ultimately affect the supply of grain production in China. Figure 1 shows the transmission of agricultural product price fluctuations in food production. Through the analysis of the price transmission mechanism of agricultural products, we can find the interaction effect and transmission effect of each link in the industrial chain, adjust the reasonable distribution of the stakeholders of each link, maintain the income level of the agricultural producers and the living standard of the consumers, stabilize the agricultural market price, and achieve a smooth transition in China’s socio-economic transformation. As the most effective means of agricultural market regulation mechanism, the price of agricultural products plays an important role in regulating production and consumption.

3. Data Sources and Research Methods

3.1. Index Selection and Data Sources

In this paper, the time series data of grain yield, planted area and agricultural price index from 1970 to 2015 were used as samples to analyze how the price changes of agricultural products affected food production.
To study the relationship between agricultural prices and food production, we regard grain production as a representative indicator of food production. Analysis based on economic theory shows that food production and agricultural prices are closely related. In this paper, we set the basis as 1985 (1985 = 100). The agricultural production price chain index was found according to the “China Statistical Yearbook [37]”. We can derive the agricultural production price fixed index by the calculation and conversion, denoted as P. Grain production is denoted as Qi, and grain sown area is denoted as Si, where i = 1, 2, 3, .... The data are from the “China Statistical Yearbook” (1970–2015) [37].

3.2. Model Building

Based on the VEC model, this paper examines the relationship between agricultural product price fluctuation, grain yield and sown area. The mathematical expression of the VEC model is as follows:
Δ y t = a 0 V E C M t 1 + α 1   Δ y t 1 + + α p Δ y t p + β Δ x t 1 + ε
In the equation, y t is the endogenous variable column vector, x t is the exogenous variable column vector, and p is the lag order. V E C M t 1 is the error correction term.

4. An Empirical Analysis of the Impact of Agricultural Product Price Changes on Grain Yield

4.1. Descriptive Analysis of Food Price Volatility

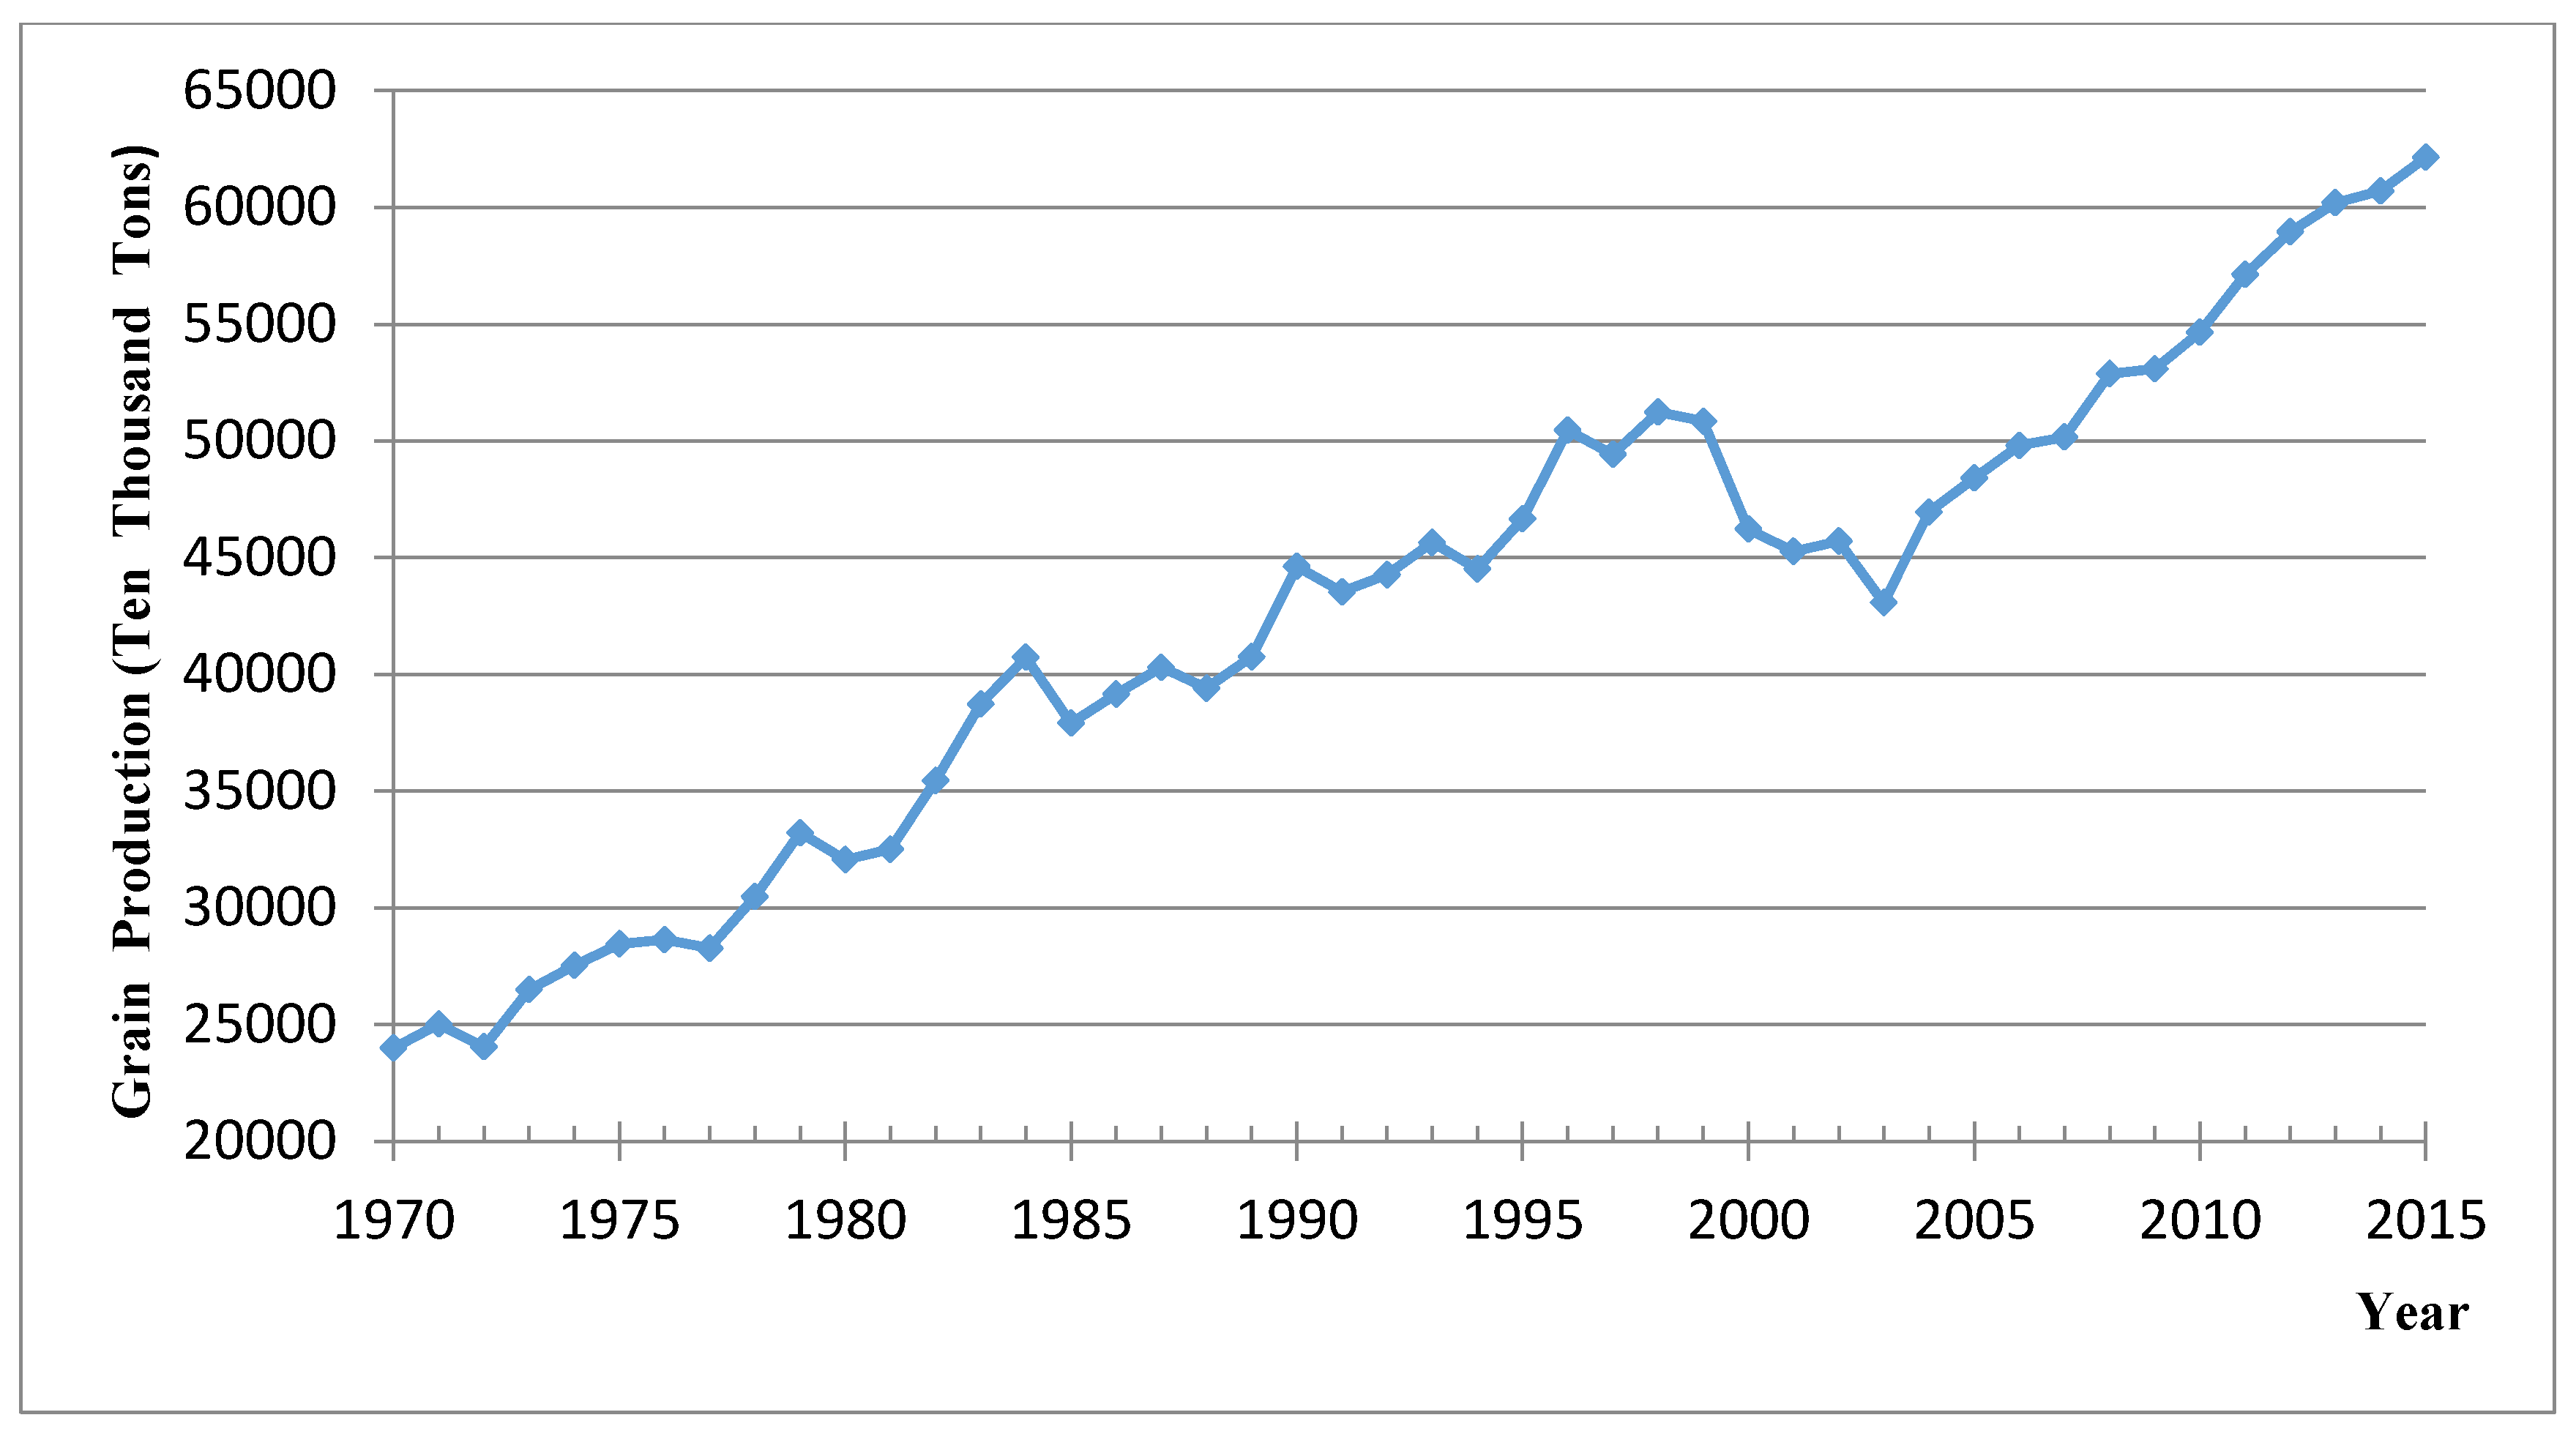
4.1.1. China’s Basic Trends in Food Production over the Past 45 Years

In general, China’s grain production includes corn, wheat and rice. Before the reform and opening up (1978), China’s grain production growth rate was extremely slow, and the yield was always below 300 million tons. After the reform and opening up, China’s grain output soared to over 300 million tons, but the volatility was also greater than before, and the range also became larger. In 1997, China’s total grain output exceeded 500 million tons for the first time, reaching 504.53 million tons, an increase of 8.13% over the previous year. However, in 1999, grain output began a continuous reduction for several years, with the production dropping to 430.69 million tons, and people worried about this. Beginning in 2004, China’s grain production increased for 10 consecutive years. In 2013, food production reached 601.938 million tons. Since the reform and opening up, grain yield has been the most concerning problem in China’s agricultural sector. China’s gradual reform and purchasing system of unified marketing reduced the number of orders to improve the purchase price of grain. These measures caused food production to rapidly grow. To study the problem, the grain yield data for 1985 to 2015 were selected, and the grain yield trend chart was drawn from the sample data. It can be seen from Figure 2 that China’s grain production has been very unstable, showing cyclical fluctuations in its characteristics. The food production in China can be divided into the following five stages: the first stage is from 1970 to 1977,when grain production was growing slowly in volatility, the second stage is from 1978 to 1984,when food production began to grow rapidly, the third stage is from 1985 to 1998, when grain production fluctuated within a small range; the fourth stage is from 1998 to 2003, when grain production fell for five consecutive years after reaching its highest point in 1998 and reached its lowest point in 2003, resulting in food problems, appeals to the government and concern among policy-makers. Food production continued to decline until 2004. The fifth stage is from 2005 to the present, when, with the efforts of government and the majority of farmers, food production began to rise. In 2005 and 2006, the production continued to increase. Since then, grain production has been steadily rising. In the case of such a cyclical fluctuation of grain production, the study of fluctuating characteristics and its relationship with the price of agricultural products is of great importance to national food security and the operation of the agricultural products market.

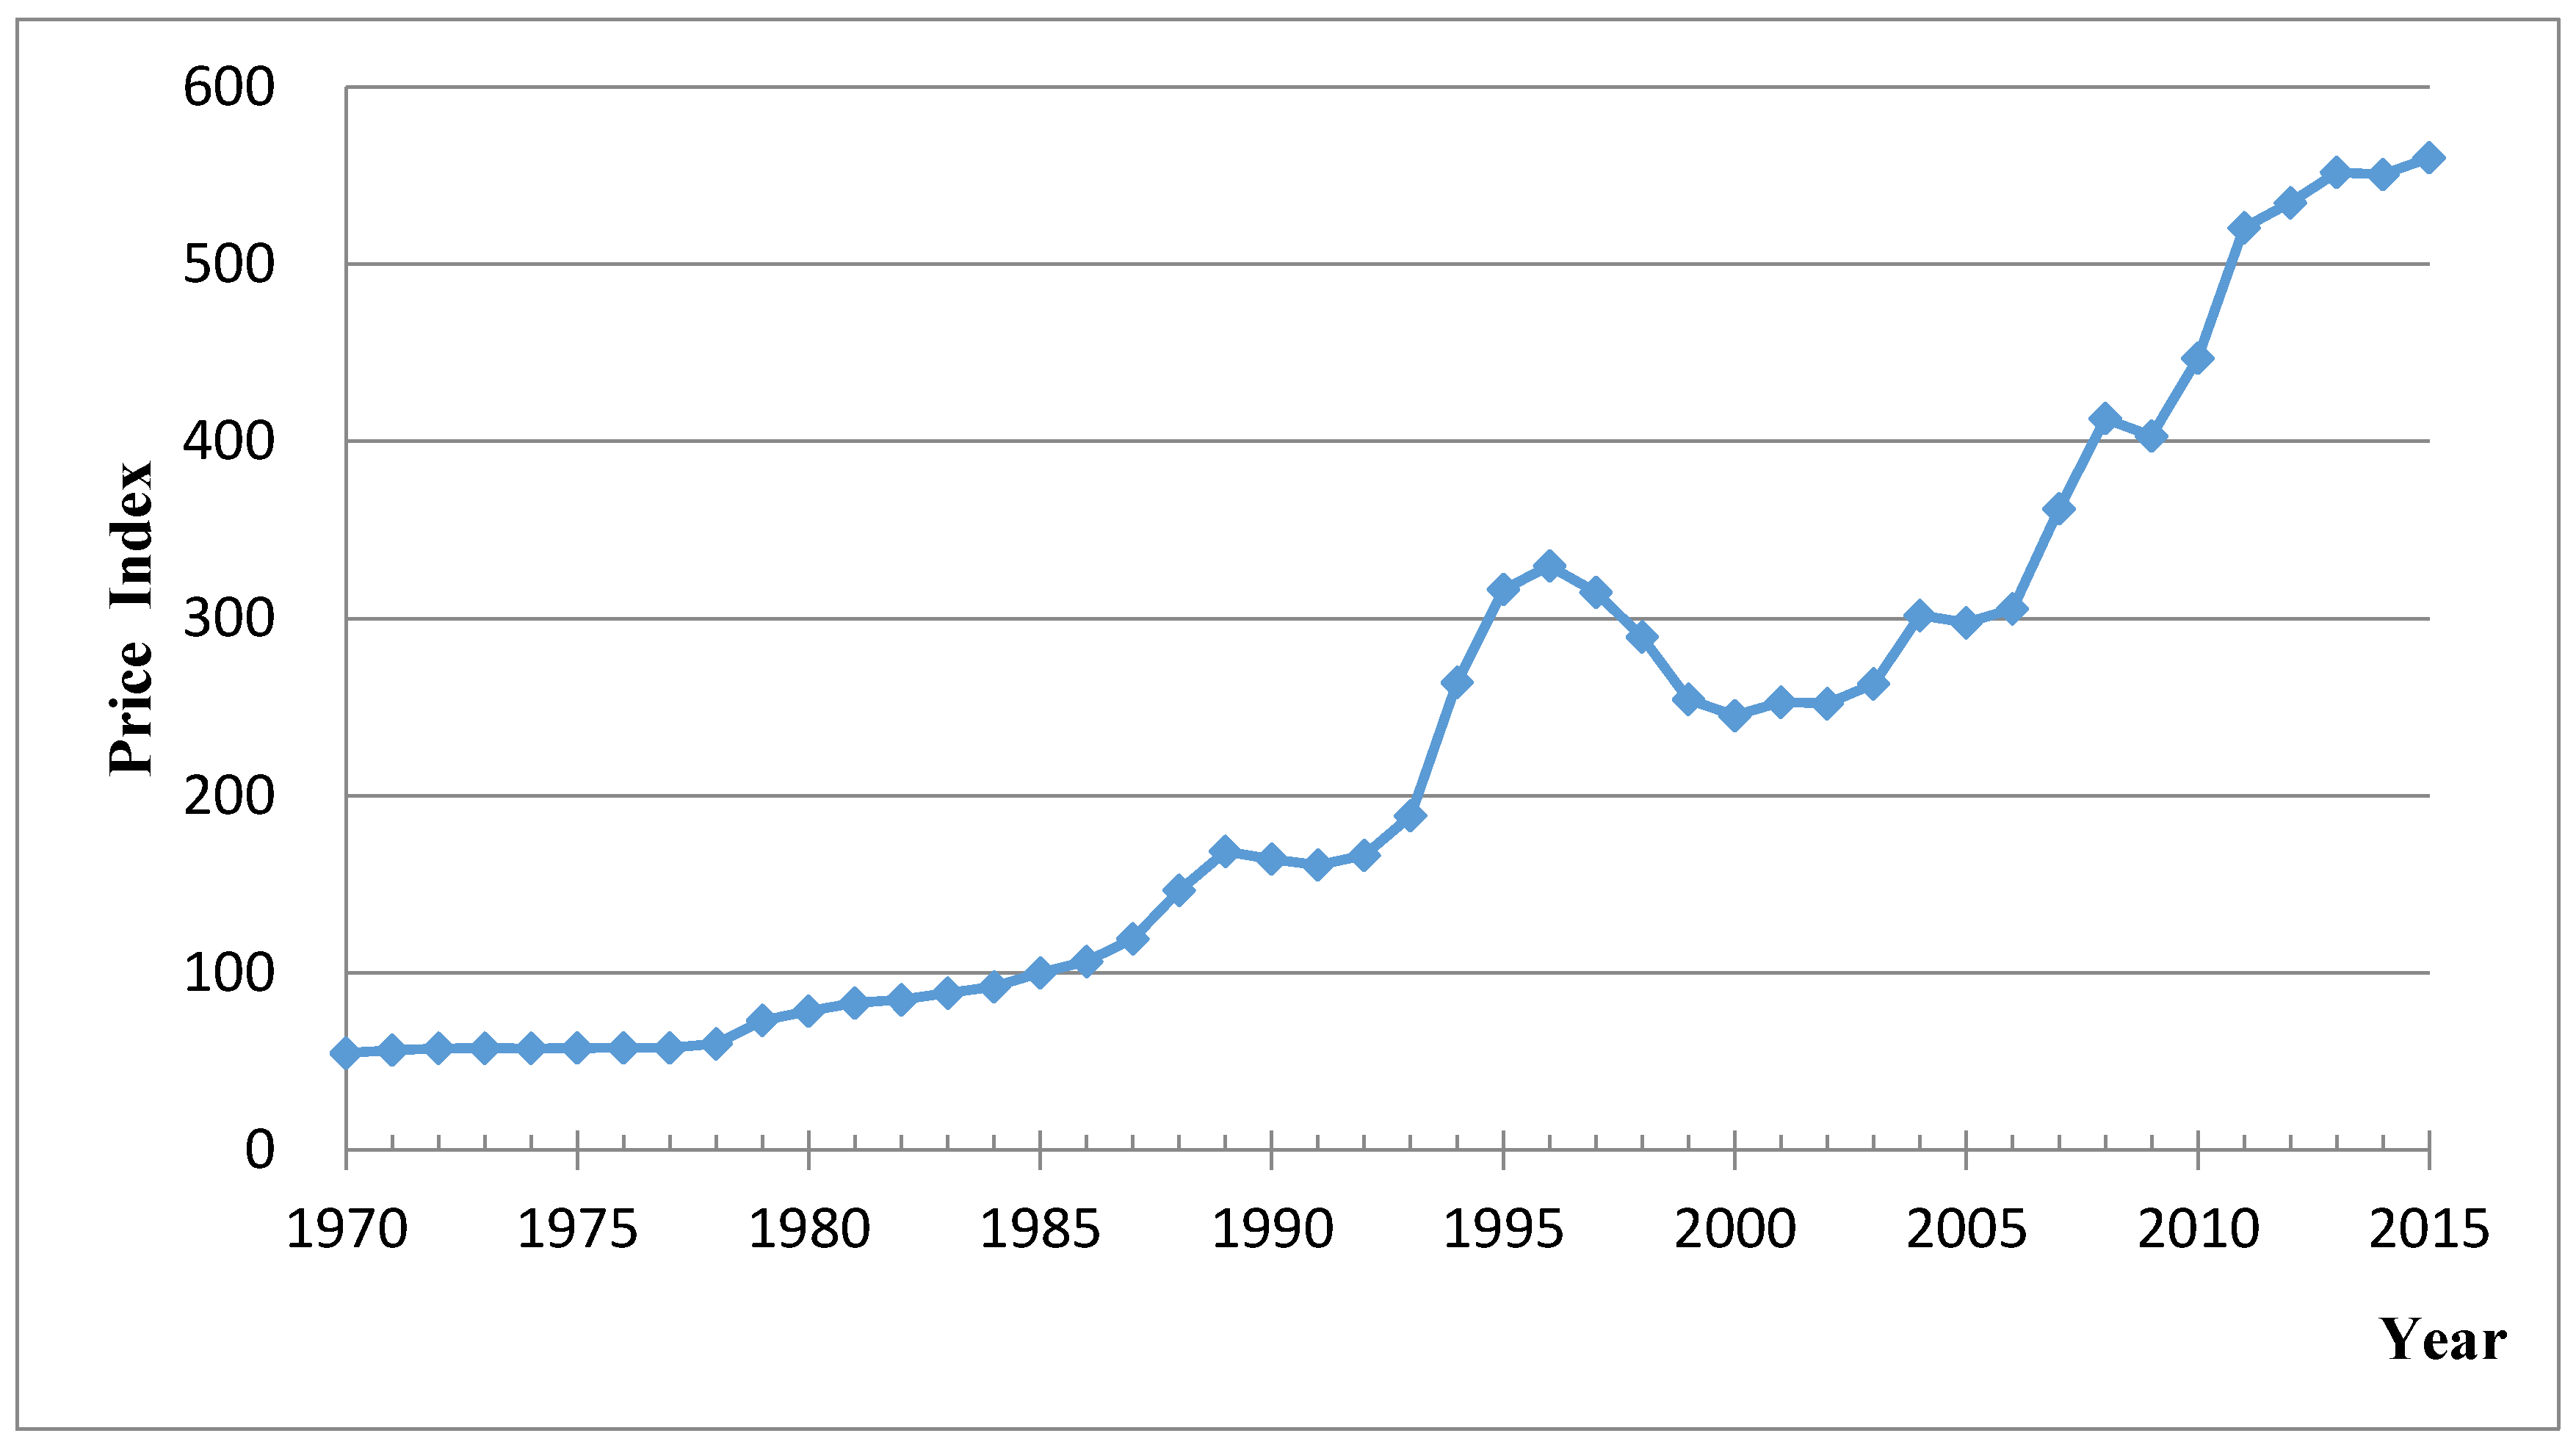
4.1.2. Analysis of Food Price Volatility from 1970 to 2015 (Data Are Derived from “China Statistical Yearbook” [37])

The fluctuation of grain prices is affected by government regulation and market supply and demand changes. This section selects the grain relative price index from 1970 to 2015 as a measure of food price volatility; the food price before 2000 is the grain purchase price index. After 2000, due to the end of the preparation of the purchase price index, the data denote the grain production price index. Figure 3 shows that the fluctuation trajectory of grain prices has obvious stages.
According to the “trough-trough” division method, China’s grain price fluctuation trajectory can be roughly divided into three stages:
The first stage is from 1970 to 1991. In this stage, food prices rose steadily, reaching their highest point in 1989. This was mainly because in 1985, the central government carried out a major reform of the long-term policy of grain purchase and marketing, which was changed to contract orders. The price of the grain ordered by the contract is the “three or seven” price (that is, 0.3 as the original purchase weight, 0.7 as the overweight order), and additional food could be sold freely by farmers following the market price [38]. When the market grain prices were lower than the original purchase price, the government purchased at the original purchase price. Although the grain purchase price index rose 1.8%, the contract purchase price fell more than 10% below the purchase price, which, to a certain extent, inhibited grain production, creating a hidden risk for a sharp rise in food prices. At the same time, the system of contract acquisition combined with market acquisition was formally established. That is, the quantity, manner and price of a portion of the total amount of food commodities were determined by the government. Another aspect of the acquisition quantity, channel and price was determined by the market supply and demand, which made the market regulation and food price volatility increase.
The second stage was from 1992 to 1999. In this stage, food prices rose sharply and then declined significantly. Specifically, food prices continued to rise, reaching their peak in 1996. In the face of a substantial increase in food prices, the State Council stipulated that other units and individuals were not allowed to procure food directly in rural areas, except for departments that were responsible for the national grain purchase tasks and food wholesale enterprises that were qualified and approved. In October 1994, the state established the China Agricultural Development Bank and began to close the management of grain purchase funds. Since then, the government has summarized a series of management experiences on food price volatility and adopted a series of macroeconomic management and control measures to curb food prices. The protection of the price of open access to food at the core of the control method is seen as the most essential measure. After these measures, food prices began to fall in 1996, reaching their lowest point in 1999.
The third stage is from 2000 to the present. Between 2000 and 2004, food prices rose in recovery, food prices fell slightly from 2004 to 2005, and since that time, food prices have risen constantly. The reason the food prices continue to rise, from the perspective of supply and demand, is that China’s grain production has been steadily increasing for many years. The living standard of residents is also steadily improving, and the demand for food is also increasing, which is the basis for the gradual increase on food prices in China. Furthermore, as people’s lives improve, the national economic level increases, and the price of agricultural means of production is also increasing. In addition, due to the gradual increase in migrant workers caused by the transfer of labor, rural labor costs have increased, which has indirectly caused food prices to rise year after year.

4.2. Empirical Test on the Impact of Agricultural Product Price Changes on Grain Yield

In this paper, the covariance test method is used to study the correlation between the variables. Cointegration theory involves the correlation between non-stationary time series, proposed by Engel and Grange in 1987, and consummated later by Johansen. However, before the cointegration test, the required time series data must be stationary; otherwise, they may produce a pseudo-regression situation. To ensure the smoothness of the time series data, it is necessary to carry out the unit root test to avoid the occurrence of pseudo-regression.

4.2.1. Unit Root Inspection (ADF)

In this paper, the unit root test of the stationary sequence of time series is carried out by using ADF test method. The results show that lnP ~ I (2); lnQ ~ I (2); and lnS ~ I (2); the specific test results are shown in the following Table 1. Thus, each variable can be cointegrated.

4.2.2. Johansen Co-Integration Test

Co-integration tests can be used to determine the cointegration relationship between variables. To determine the optimal lag order of the model before the cointegration test, we use the AIC information criterion and the SC information criterion to select the lag order. Based on the parallel independent distribution of the residuals, the AIC reaches the minimum value of −10.65700 and the SC is −10.09518 when the maximum hysteresis is 2; the optimal lagged order is the second order, and the established VAR model is denoted as VAR (2).
After the Johansen test method, there is a long-term cointegration relationship between agricultural product price fluctuation, grain yield and sown area. From the Table 2 below, we reject the original hypothesis that there is no cointegration relationship. The Johansen cointegration test proves that there is a cointegration relationship between the variables.

4.2.3. Granger Causality Test

The Granger causality test is used to describe which sequence of fluctuations in the time series can cause another sequence of fluctuations. The test was initiated by Clive W. J. Granger, winner of the 2003 Nobel prize in economics, and was used to analyze the Granger causality between economic variables. In the case of time series, the Granger causality relationship between the two economic variables X and Y is defined as if the prediction effect of the variable Y under the condition that the past information of the variables X and Y is included is better than the condition that the past information of only Y is included, that is, the variable X can help explain the future variation of the variable Y; then, the variable X is the Granger cause that causes the variable Y. Using Eviews v8.0 (Quantitative Micro Software Co.: Irvine, CA, USA) to test the relationship between the price of agricultural products, grain yield and sown area by Granger causality, the results are the following Table 3:
According to the results of the Granger causality test, there is a one-way Granger relationship between agricultural product price fluctuation and grain yield, and the price fluctuation of agricultural products is the Granger cause of grain production change. The relationship between price fluctuation and sown area of agricultural products is a one-way Grainger relation, and the fluctuation of agricultural products is the Granger cause of the change in the area. In other words, changes in agricultural prices have a significant impact on changes in grain production and acreage, but the impact of changes in grain production and acreage on prices is not obvious.

4.2.4. The Establishment of VEC Model

On the basis of cointegration test, we obtain the cointegration relationship among the variables. In order to further analyze the long-term dynamic equilibrium relationship among the variables, we need to establish the vector error correction model. The VEC model is estimated from the Johansen cointegration test. Then we use the estimated error correction term to construct the cointegration relation and estimate the VAR model of the second order difference form including the error correction term as the regression variable, that is VEC model.
The VEC model estimates the results as follows:
[ Δ d d l n P Δ d d l n Q Δ d d l n S ] = [ 0.0042 0.0047 0.0006 ] + [ 0.4835 1.2277 2.0842 0.0963 0.8073 1.4578 0.0211 0.1272 0.9316 ] [ Δ d d l n P t 1 Δ d d l n Q t 1 Δ d d l n S t 1 ]     + [ 0.4679 0.6639 0.9612 0.0697 0.2144 0.9869 0.0329 0.0436 0.6881 ] [ Δ d d l n P t 2 Δ d d l n Q t 2 Δ d d l n S t 2 ]     + [ 0.0786 0.1233 0.0105 ] V E C M t 1 + ε
Among them, V E C M t 1 = d d l n P t + 21.1077 d d l n Q t 21.4203 d d l n S t .

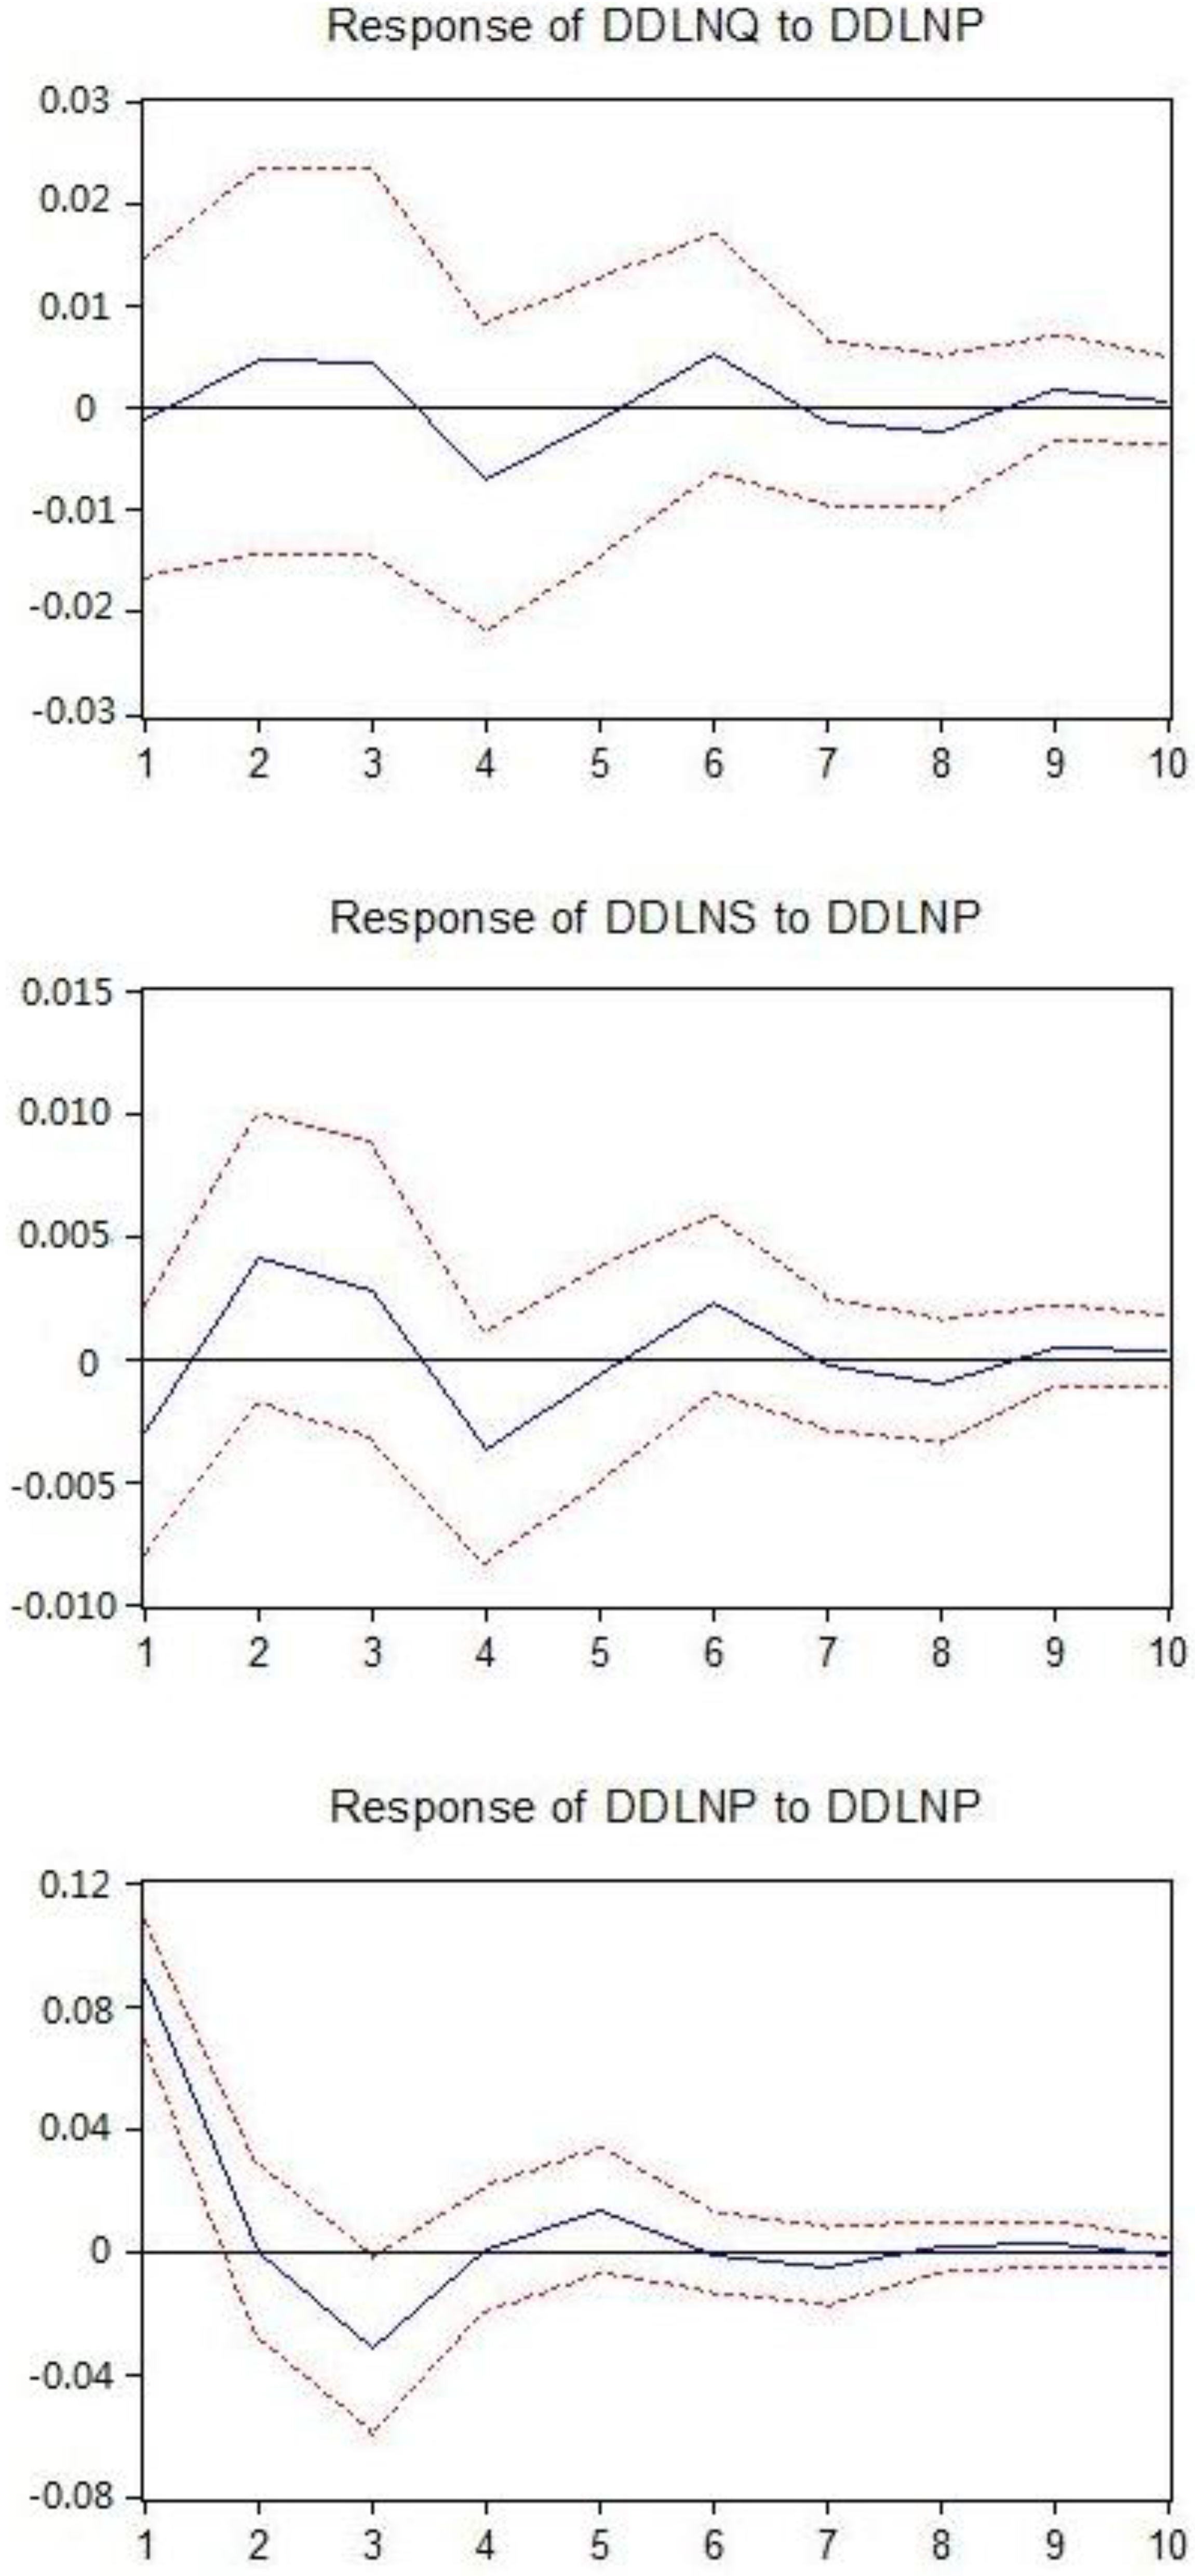
4.2.5. Impulse Response Function

The VAR (VEC) model is a non-theoretical model. When we analyze the VAR (VEC) model, we do not directly analyze the impact of a variable on another variable. However, by analyzing when the error term of the VAR (VEC) model changes, we can see the dynamic impact of this change on the system. In this paper, this dynamic effect is analyzed by means of the impulse response function.
The horizontal axis in Figure 4 represents the number of periods, the vertical axis represents the impulse response function, and the red dotted line indicates the confidence interval. As can be seen from Figure 4, the price for their own standard deviation impact immediately made a response. In the first period, the price of this response is about 8.5, after the impact of such a disturbance on the price slowly reduced. In addition, the sown area immediately responds to price disturbances, the first phase response is about −2.5, and reaches the positive maximum (about 3.0) in the second period, then the response of the sown area to the price disturbance decreases. It can also be seen from the figure that the yield of the disturbance for the price in the first phase is not obvious, in the fourth period reached the negative maximum. In general, however, in the impulse response diagram, since 0 is within the confidence interval, the impulse response is not significantly different from zero.

4.2.6. Results and Analysis

Through the above empirical analysis, we know that the time series data of agricultural product price fluctuation, grain security and grain sowing area belong to second-order single products, and there is a long-term equilibrium co-integration relationship between them. In addition, there is a one-way Granger relationship between agricultural product price fluctuation and grain yield, and the price fluctuation of agricultural products is the Granger cause of grain production change. The relationship between price fluctuation and sown area of agricultural products is a one-way Granger relation. Second, the VEC model estimates that the price fluctuation of agricultural products will affect the sown area and its yield, that the degree of influence in different lag periods is diverse. Nevertheless, the impact of agricultural prices on food production has the following problems:
First, after China’s grain reform, agricultural prices accelerated, the market supply and demand intensified, and many food policies were not implemented well for farmers and thus did not provide farmers with any benefits. However, by 2008, most of the farmers had received the loss of economic interests because of the impact of sharp decreases in global agricultural and food prices. China’s agricultural market information is not perfect. Whether in the planned economy era or food reform period, macro-control measures are not infallible; thus, the food market price mechanism is not mature. This information asymmetry situation makes the farmers slow to respond to the price information in the case of difficulty selling grain; therefore, the price mechanism has trouble fulfilling its function.
Second, in recent years, in order to protect the interests of farmers, the state has repeatedly adopted a minimum price support policy to improve the purchase price of grain, making food prices rise year after year. This condition also makes the food market stakeholders raise their expectations for food price increases. Some speculators have increased their reserves after grain harvests, creating food supply and demand tensions and thus exacerbating the rise in food prices. This process is not conducive to the stability of the price mechanism.

5. Conclusions and Policy Recommendations

From the previous empirical data and research, we can see that fluctuations in agricultural prices have a certain impact on food production, and food production changes should significantly lag behind the changes in agricultural prices. Domestic grain is the main body of the grain supply in China, and if the country’s market is not sound, the food production fluctuations will cause greater fluctuations in agricultural prices, and fluctuations in agricultural prices will, in turn cause fluctuations in production. This phenomenon is revealing a “divergent cobweb” state, causing production to move away from the equilibrium point. The main reasons for the frequent fluctuations in agricultural prices are summarized as follows:
First, the information dissemination channels are not smooth. Although there is a relatively complete agricultural price information network and information on agricultural prices is released in a timely fashion, the limited knowledge of farmers, as well as the inability of farmers in some poor areas to receive timely agricultural price signals, prevents them from using price information to develop a reasonable grain production plan. Second, China’s planned economy has a policy of unified purchases and marketing; that is, when the government decides to increase prices, the central bank will issue equal money to regulate this, and inflation caused by the rise in agricultural prices leads to an increase in the amount of currency. Currently, the currency circulation is based on foreign exchange investments and other factors; too high of a currency issuance will cause agricultural prices to increase. Third, the economic cycle is also an important factor in the volatility of agricultural products. In an economic boom, the demand for agricultural products is greater than the supply. This will lead to a “cobweb effect”: where demand exceeds supply by 1%, agricultural prices will rise by 1%. Fourth, there is the impact of international agricultural price fluctuations. Since the implementation of reform and opening up in China to all aspects of international standards, the agricultural products market is affected, and all aspects are in line with international standards. The volatility of agricultural prices in the international market also have a natural impact on the price of agricultural products in China. In addition, climate factors such as natural disasters impact the fluctuations of agricultural prices to a certain extent.
Therefore, to ensure the safe and stable operation of agricultural products and the food market, it is necessary for China’s government to adopt a series of measures to improve the enthusiasm of farmers for producing grain to maintain the stability of agricultural products. Specific measures that can be taken are as follows:
First, reform the food subsidy policy. Extensive experience has shown that increasing farmers’ food subsidies is one of the most effective ways to mobilize the enthusiasm of farmers and improve the efficiency of agricultural production [39]. The policy of the minimum purchase price of grain and the temporary storage of important agricultural products is the main agricultural product price support policy. This approach is to protect the interests of farmers when the food market price is below the minimum purchase price. The drawback of this approach is that it will impact the formation of market prices and will not help the market to play a role. In addition, government procurement of grain will cause extensive reserve pressure and will, therefore, entail a very large financial expenditure. There is an urgent need for reform of this situation in China. Specifically, we need to establish a counter-cyclical food subsidy policy with the target price as the core. The key to this policy is that the government establishes the target price in accordance with the relevant laws and regulations. Unlike the existing minimum purchase price, when the grain market price is lower than the grain target price, the government subsidizes the farmers according to differences between the market price and the target price. The advantage of this design is that by making the food market mechanism really play a role, we can reduce the large amount of financial expenditure arising from the storage of food. The most important measure is to streamline the grain market mechanism, which can alleviate the abnormal fluctuations in food prices caused by human factors.
Second, reduce the cost of grain to protect the interests of farmers. In recent years, the price of major agricultural means of production generally rose, such as fertilizer and pesticide prices rising 30% to 40%over the previous year. Continued price increases for agricultural production will lead to an increase in the costs of farming and thus will eliminate the enthusiasm of farmers to plant grain and decrease food production. A sharp reduction in food supplies will lead to rising food prices, and food price volatility will break the long-term stability of the food market, thus affecting food production. In this regard, the relevant government departments should play a role in supervision and control, taking measures to stabilize the market prices of a series of agricultural production materials, such as fertilizer and pesticides, and preventing agricultural production prices from fluctuating in order to avoid disrupting the market order. At the same time, this will ensure the quality of the production materials to protect the vital interests of farmers.
Third, strengthen the protection of arable land on an agricultural scale. There is a close relationship between the stability of agricultural products and the area of cultivated land. Cultivated land resources in food production have an irreplaceable role. Strengthening the protection of arable land and stabilizing grain-sown area can help ensure grain production and price stability. Presently, the situation with cultivated land is that the cultivation is small and the degree of commercialization is not high. This has become an important factor affecting the efficiency of grain and farmers. The household contract responsibility system ensures that farmers share average land, but this also affects the scale of land cultivation. Rural farmers’ farming technology and mechanization are relatively low, and production costs are relatively high. For these scattered farmers, grain is mainly grown for subsistence; thus, the food commodity rate is low. In recent years, with the acceleration of industrialization and urbanization, the area of cultivated land in China has gradually decreased. Pollution problems have led to a serious decline in the quality of some cultivated land, which has a serious impact on food production and the stability of agricultural prices [40]. Therefore, it is urgent to make full use of the limited cultivated land area, strengthen farmland protection, and use science and technology to improve farmland efficiency. This is also an effective way to stabilize the market price and increase grain yield.
Fourth, strengthen the agricultural market information channel construction and complete the collection of agricultural product prices for analysis and release. Due to the low level of farmers’ own information and the low coverage of some rural networks, they lack a convenient way to obtain agricultural product prices and cannot make next year’s grain plan based on the prices of previous agricultural products. This shortcoming, that information is difficult to obtain, is also one of the reasons that prices fluctuate. To prevent price fluctuations caused by the inability to reasonably know how much grain to plant because of the difficulty in determining the price, the government should promptly publish information on agricultural prices for farmers and establish a channel to facilitate the rapid access to price information for farmers, to strengthen the regulation of market conditions, and improve the farmers’ market economy awareness so that farmers can easily adjust the price of agricultural products for the subsequent year’s grain plan.

Acknowledgments

This study was supported by the Key projects of the National Social Science Fund of China, No.15AZD075; the National Natural Science Foundation of China, No.41561040; the Key projects of the Social Science Fund of Jiangxi Province, No.17ZD03; the Natural Science Foundation of Jiangxi Province, No.20143ACB21023; the Technology Foundation of Jiangxi Education Department of China, No.KJLD14033 andNo.GJJ160431; and the Fok Ying-Tung Fund, No.141084.

Author Contributions

Hualin Xie had the original idea for the study. Bohao Wang was responsible for data collecting. Hualin Xie and Bohao Wang carried out the analyses. All the authors drafted the manuscript, and approved the final one.

Conflicts of Interest

The authors declare no conflict of interest.

References

  1. Liu, X.X.; Li, S.Y. Chinese food market 60 years development process and changing characteristics. J. Beijing Technol. Bus. Univ. (Soc. Sci. Ed.) 2010, 2, 1–5. (In Chinese) [Google Scholar]
  2. Munir, J.; Esteban, T.Z. Pass-through of international food prices to domestic inflation during and after the great recession: Evidence from a set of Latin American economies. Rev. Desarro. Y Soc. 2011, 67, 135–179. [Google Scholar]
  3. Ivanova, N.; Peneva, M. Agricultural policy impact on major farm products prices development in bulgaria up to 2020. Econ. Manag. 2011, 7, 39–53. [Google Scholar]
  4. Sekhar, C.S.C. Volatility of Agricultural Prices-An Analysis of Major International and Domestic Markets; Working Paper, No.103; Research on International Economic Relations: New Delhi, India, 2003. [Google Scholar]
  5. Lu, F. Three Grain Surpluses-Evolution of China’s Grain Price and Marketing Policies (1978–1999); Symposium on China’s Agricultural Trade and Policy: Beijing, China, 1999; pp. 251–268. [Google Scholar]
  6. Gilbert, C.L. How to understand high food prices. J. Agric. Econ. 2010, 61, 398–425. [Google Scholar] [CrossRef]
  7. Abbott, P.; Hurt, C.; Tyner, E. What’s Driving Food Prices in 2011; Farm Foundation: Oak Brook, IL, USA, 2011. [Google Scholar]
  8. Xie, H.L.; He, Y.F.; Xie, X. Exploring the factors influencing ecological land change for China’s Beijing-Tianjin-Hebei Region using big data. J. Clean. Prod. 2017, 142, 677–687. [Google Scholar] [CrossRef]
  9. Xie, H.L.; He, Y.F.; Zou, J.L.; Wu, Q. Spatio-temporal difference analysis of cultivated land use intensity based on emergy in the Poyang Lake Eco-economic Zone of China. J. Geogr. Sci. 2016, 26, 1412–1430. [Google Scholar] [CrossRef]
  10. Xie, H.L.; Liu, G.Y. Spatiotemporal differences and influencing factors of multiple cropping index in China during 1998–2012. J. Geogr. Sci. 2015, 25, 1283–1297. [Google Scholar] [CrossRef]
  11. Xie, H.L.; Wang, P.; Yao, G.R. Exploring the dynamic mechanisms of farmland abandonment based on a spatially explicit economic model for environmental sustainability: A case study in Jiangxi province, China. Sustainability 2014, 6, 1260–1282. [Google Scholar] [CrossRef]
  12. Rayner, A.J.; Reed, G.V. British potato stabilisation policy in a European context. J. Agric. Econ. 1988, 39, 43–60. [Google Scholar]
  13. Serra, T.; Ziberman, D.; Goodwin, B.K.; Hyvonen, K. Replacement of Price support measures by direct payments in agricultural policies does this benefit the environment. Am. Agric. Econ. Assoc. Annu. Meet. 2004, 7, 1–4. [Google Scholar]
  14. Hennessy, D.A. The production effects of agricultural income support policies under uncertainty. Am. J. Agric. Econ. 1998, 2, 21–25. [Google Scholar] [CrossRef]
  15. Baffes, J.; Meerman, J. From prices to incomes: Agricultural subsidization without protection. World Bank 1997, 6, 13–17. [Google Scholar]
  16. Zhang, C.; Chen, X. The impact of global oil price shocks on China’s bulk commodity markets and fundamental industries. Energy Policy 2014, 66, 32–41. [Google Scholar] [CrossRef]
  17. Ceballos, F.; Hernandez, M.A.; Minot, N.; Robles, M. Grain Price and Volatility Transmission from International to Domestic Markets in Developing Countries. World Dev. 2017, 94, 305–320. [Google Scholar] [CrossRef]
  18. Yan, S.; Kameyama, H.; Isoda, H.; Qian, J.; Shoichi, I. Effects of international grain prices on volatility of domestic grain prices in 24 developing countries. J. Faculty Agric. 2016, 61, 225–232. [Google Scholar]
  19. Lee, E.; Han, D.B.; Nayga, R.M. A common factor of stochastic volatilities between oil and commodity prices. Appl. Econ. 2017, 49, 2203–2215. [Google Scholar] [CrossRef]
  20. Gu, L.L. Study on the fluctuation of grain output in china’s major grain-producing areas. Anhui Agric. Sci. 2011, 20, 12458–12461. (In Chinese) [Google Scholar]
  21. Jiang, N.H. China’s Grain Production and Price Volatility. Ph.D. Thesis, Nanjing Agricultural University, Nanjing, China, 1998. (In Chinese). [Google Scholar]
  22. Liao, H.Y.; Li, X.Y. An empirical study on the impact of grain price on farmers’ grain production—A case study of Ningxiang and Hanshou counties in Hunan province. China Rural Econ. 1995, 9, 29–34. (In Chinese) [Google Scholar]
  23. Sun, Y.F.; Yu, H.P. Analysis on the causal relationship and influence degree of China’s grain production. J. Agrotech. Econ. 1999, 2, 37–39. (In Chinese) [Google Scholar]
  24. Wen, T.; Wang, X.H.; Yang, D.; Zhu, J. The behavioral characteristics, benefit mechanism and decision effect of farmers’ participation in cooperative economic organization under the new situation. Manag. World 2015, 7, 82–97. (In Chinese) [Google Scholar]
  25. Tokgoz, S. The Impact of Energy Markets on the EU Agricultural Sector; Center for Agricultural and Rural Development, Iowa State University: Ames, IA, USA, 2009; pp. 113–134. [Google Scholar]
  26. Zhan, S.W.; Feng, Z.C.; Xiao, W. Analysis on the influence of grain price change on grain sowing area. J. Inn. Mong. Univ. (Philos. Soc. Sci.) 2008, 5, 54–58. (In Chinese) [Google Scholar]
  27. Luo, F. A study of the supply response for grain in China with the Nerlove model. J. Fo Shan Univ. (Soc. Sci. Ed.) 2009, 5, 35–38. (In Chinese) [Google Scholar]
  28. Wei, H.; Wang, L. Analysis on the effect of grain price and farmers’ income on grain yield-based on VEC model. J. Agrotech. Econ. 2011, 6, 76–80. (In Chinese) [Google Scholar]
  29. Han, X.L.; Wei, D.Z.; Yu, Q.C.J. Grain price decision mechanism: An empirical analysis based on the cobweb model. Price Theory Pract. 2007, 9, 39–40. (In Chinese) [Google Scholar]
  30. Wu, H.X.; Li, P. The asymmetry of price fluctuation in China’s grain market: An empirical study based on fourier season exogenous VAR model. Technol. Econ. 2015, 1, 101–108. (In Chinese) [Google Scholar]
  31. Wu, H.X.; Huo, X.X. Study on dynamic correlation of crude oil, corn and fuel ethanol market. J. Agrotech. Econ. 2014, 3, 89–96. (In Chinese) [Google Scholar]
  32. Timmer, C.P.; Roe, T.L. The macro dimensions of food security: Economic growth, equitable distribution, and food price stability. Food Policy 2000, 25, 283–295. [Google Scholar] [CrossRef]
  33. Fraser, E.D.G.; Legwegoh, A.; Krishna, K.C. Food stocks and grain reserves: Evaluating whether storing food creates resilient food systems. J. Environ. Stud. Sci. 2015, 5, 445–458. [Google Scholar] [CrossRef]
  34. Dorosh, P.A. Price stabilization, international trade and national cereal stocks: World price shocks and policy response in South. Asia Grain Secur. 2009, 1, 137–149. [Google Scholar] [CrossRef]
  35. Sckokm, P.; Moro, D. Modeling the reforms of the common agricultural policy for arable crops under uncertainty. Am. J. Agric. Econ. 2006, 88, 43–56. [Google Scholar] [CrossRef]
  36. Zhan, S.W.; Feng, Z.C. Analysis of the influence of grain price changes on the acreage of grain. J. Inn. Mong. Univ. 2008, 5, 54–58. [Google Scholar]
  37. China Statistical Yearbook (1970–2015). Available online: http://www.stats.gov.cn/tjsj/ndsj/2015/indexeh.htm (accessed on 26 May 2017).
  38. House, C.; Pherb, L.; Shapiro, M.D. Temporary investment tax incentives: Theory with evidence from bonus depreciation. Am. Econ. Rev. 2008, 98, 737–768. [Google Scholar] [CrossRef]
  39. RalPh, C., Jr.; Shahidur, R.; Ashok, G. Grain price stabilization experiences in Asia: What have we learned? Grain Policy 2006, 31, 302–312. [Google Scholar]
  40. Xie, H.L.; Yao, G.R.; Liu, G.Y. Spatial evaluation of ecological importance based on GIS for environmental management: A case study in Xingguo County of China. Ecol. Indic. 2015, 51, 3–12. [Google Scholar] [CrossRef]
Figure 1. The transmission mechanism of agricultural product price to grain yield.
Sustainability 09 00906 g001
Figure 2. China’s basic trend of grain production during the period 1970–2015.
Sustainability 09 00906 g002
Figure 3. Grain production price fixed index for 1970–2015.
Sustainability 09 00906 g003
Figure 4. The impulse response function diagram of yield and sowing area on the price.
Sustainability 09 00906 g004
Table 1. Unit Root Test Results.
VariablesADF ValueCritical ValueConclusion
1%5%10%
lnP−0.436979−3.592462−2.931404−2.603944non-stationary
ddlnP−6.539919−3.596616−2.933158−2.604867stationary
lnQ−1.409086−3.584743−2.928142−2.602225non-stationary
ddlnQ−9.786633−3.596616−2.933158−2.604867stationary
lnS−1.973158−3.588509−2.929734−2.603064non-stationary
ddlnS−8.441276−3.596616−2.933158−2.604867stationary
Table 2. Johansen cointegration test results.
Hypothesized No.of CE(s)EigenvalueTrace Statistic0.05 Critical ValueProb. **
None *0.53099665.1718929.797070.0000
At most 10.41534234.1289615.494710.0000
At most 20.25597912.121303.8414660.0005
* denotes rejection of the hypothesis at the 0.05 level; ** MacKinnon-Haug-Michelis (1999) p-values.
Table 3. Granger causality test results.
The Original Hypothesis H0F-statisticsProb.Conclusion
Sowing area is not the Granger cause of the change in production0.358040.5530Accept H0
Yield is not the Granger cause of the change in the area of the plant0.166620.6853Accept H0
Price is not the Granger cause of the change in production1.055860.0103Reject H0
Production is not the Granger cause of price changes0.795970.3776Accept H0
Price is not the Granger cause of the change in the area of the crop3.399150.0726Reject H0
Sowing area is not the Granger cause of price changes2.425020.1273Accept H0

