Article

Rewetting Decreases Carbon Emissions from the Zoige Alpine Peatland on the Tibetan Plateau

1
Beijing Key Laboratory of Wetland Services and Restoration, Institute of Wetland Research, Chinese Academy of Forestry, Beijing 100091, China
2
Sichuan Zoige Wetland Ecosystem Research Station, Tibetan Autonomous Prefecture of Aba 624500, China
3
University of Chinese Academy of Sciences, Beijing 100049, China
4
Department of Forest Ecology and Management, Swedish University of Agricultural Sciences, 90183 Umeå, Sweden
*
Authors to whom correspondence should be addressed.
These authors contributed equally to this work.
Sustainability 2017, 9(6), 948; https://doi.org/10.3390/su9060948
Submission received: 18 April 2017 / Revised: 29 May 2017 / Accepted: 1 June 2017 / Published: 4 June 2017

Abstract

:
Peatlands play an important role in the global carbon cycle and potentially have a significant impact on regional climate change. Restoring and rewetting the degraded peatlands is an urgent task. However, effects of rewetting on the carbon emissions of peatlands remain poorly understood. In this study, the process of rewetting a piece of the degraded Zoige alpine peatland was experimentally simulated and the derived results were compared with those of natural rewetting by monitoring CO2 and CH4 fluxes and other environmental factors before and after rewetting. The natural rewetting results showed that rewetting decreased ecosystem respiration (ER) by about 60%. Furthermore, rewetting increased CH4 emissions by 127%, decreased total carbon emissions (TCE) from 270 to 157 mg CO2 m−2 h−1, and decreased TCE from the entire ecosystem by 42%. The results of the controlled experiment showed that ER decreased gradually as the degree of rewetting was increased, and CH4 fluxes and changes in water level were significantly and positively correlated: CH4 fluxes increased from 0.3 (water level −20 cm) to 2.17 mg CH4 m−2 h−1 (water level 20 cm). After rewetting, the TCE of the whole ecosystem were significantly decreased. Regional observations showed that CO2 fluxes were significantly and negatively correlated to the water level; and the corresponding CO2 equivalent was significantly and positively correlated to the water level, while TCE were significantly and negatively correlated to the water level. Our findings indicate that rewetting can decrease carbon emissions and thus contribute in mitigating the adverse effects of climate change in alpine peatland.

1. Introduction

Peatlands cover 3% of the world’s land surface and store approximately 15–30% of the global soil carbon (C) [1,2,3,4], potentially inducing significant impacts on the local climate [5,6,7,8,9]. The Intergovernmental Panel on Climate Change (IPCC) states that intense human activities have contributed to global and regional climate change by warming and changing precipitation patterns [10,11,12,13], and that peatland C balances are significantly related to climate variation and are also exceedingly sensitive to climate change [8]. Undisturbed peatlands are presently a sink of carbon dioxide (CO2) [5,14] and a significant source of methane (CH4), comprising approximately 10% of the global CH4 reservoir [4,14]. Therefore, the C cycle in peatlands plays a pivotal role in the global C budgets that, in turn, influences global climate and also has the potential to slow down global warming [15,16,17,18]. Recently, peatlands in China are being severely degraded [19,20]. Moreover, the degradation is converting the peatlands from anaerobic to aerobic zones, resulting in faster decomposition of soil organic matter and thus greater emissions of carbon into the atmosphere, thereby exacerbating the greenhouse effect [10,21]. Therefore, rewetting and restoring the degraded peatlands is an urgent task.
The Zoige alpine peatland is situated on the eastern edge of the Qinghai-Tibetan Plateau and is the largest alpine peat distribution area in the world, weighing as much as 2.9 Pg (dry weight) with peat deposits 0.3–8.8 m deep [4,22,23]. Because of its high altitude, this peatland is highly sensitive to climate change [7,19,24,25]. Long-term climate change at this site is characterized by a warming and drying trend [5,8]. This fact may increase evapotranspiration and decrease soil moisture, consequently leading to phenology alteration, peatland shrinkage, and potentially more CO2 efflux to the atmosphere [5]. Moreover, in recent years, due to human activities (overgrazing, artificial drainage, peat mining, etc.), the water level in the Zoige peatland has been reduced. The peatland itself is shrinking and being degraded [26], and the rate of this degradation continues to increase [4,19]. As a result, the severe degradation of the Zoige alpine peatland is nowadays one of the most important problems for those who seek not only to protect but also restore peatland ecosystems in China.
Recent efforts to protect and restore the Zoige peatland have proved encouraging [27,28]. The water level in Zoige is managed by constructing a regulation dam along with rewetting by filling ditches, limiting grazing, controlling sand, and eliminating rats. Other actions aimed at protecting the peatland environment around the Huahu Lake in Zoige include fencing and controlling desertification [28]. These measures resulted in the restoration of 6070 hectares of peatland. Among the aforementioned measures, rewetting is particularly important for the protection and restoration of peatlands [29]. The conversion of the aerobic environment of the peatland into an anaerobic one profoundly affects the C cycle of the peatland by influencing the decomposition of carbon and its emissions from the ecosystem [6,7,8,9]. However, few studies have attempted to quantify the effects of rewetting and restoration of peatland ecosystems on the emissions of greenhouse gases from those systems [30,31,32].
The present study was therefore focused on comparing natural rewetting and simulated rewetting—by controlling the water level—of a degraded peatland in terms of C effluxes as well as other environmental factors. In detail, the C fluxes under different regional water levels and the impacts of water level on C emissions from the Zoige alpine peatland ecosystem were examined.

2. Materials and Methods

2.1. Overview of the Study Area

The study area (33°47’ N, 102°57’ E; 3430 m above sea level) is located in the eastern edge of the Qinghai–Tibetan Plateau and is part of Zoige County, Aba Autonomous Prefecture, of Sichuan province, China (Figure 1). The climate is cold and wet. The long-term mean average precipitation levels range from 700 mm to 750 mm, of which about 90% is received between April and September. The annual mean temperature was 2.8 and 2.7 °C in 2014 and 2015, respectively. The annual precipitation was 717.7 and 539.9 mm in 2014 and 2015, respectively (Figure 2). The lush swamp vegetation and slow decomposition of foliage and roots allow organic matter to accumulate in the soil and to form thick layers of peat. The dominant vegetation in the hummocks consisted of Kobresia tibetica, Cremanthodium pleurocaule, and Potentilla, accounting for approximately 45% of the study sites. Two dominant plant species, Carex muliensis (CM) and Eleocharis valleculosa (EV), scatter in the hollow areas and overlap 90% of the remaining water surface [5,8]. The soil from the peat swamps has a 2–5 m thick layer of peat and a pH of 6.8–7.2 [10,21,23,27,28].

2.2. Experiment Design

The study area included two sites: a natural wetland area and an area where the water level was controlled. The two areas were located about 200 m from each other and are both part of the experimental area of the Zoige Wetland Ecosystem Research Station (Figure 1). The natural wetland area was a piece of degraded peatland used for grazing, and rewetting was accomplished by water flowing from nearby ditches into it. The controlled experimental area was inside a platform, of which the climate and water level could be monitored. Water levels were simulated in homemade steel boxes (60 cm × 60 cm × 60 cm) (Figure 1), and observation ports set at the right angles of the boxes permitted inspection of the water level. Before the start of the experiment, soil blocks of nearly the same size (about 60 cm × 60 cm × 50 cm) with the surface vegetation intact were removed from a typical degraded C. muliensis—rich peat swamp and placed in the simulation boxes, which were buried in the soil such that the surface of the soil inside the box was at the same level with the surrounding soil to minimize any differences in soil temperature.
The water levels in the boxes were set as follows to reflect different degrees of rewetting: −20, –10, 0, 10, and 20 cm. Each water level was replicated three times. Each simulation box had a stainless steel base (50 cm × 50 cm × 20 cm) inserted 10 cm deep into the soil, with 10 cm extending aboveground. The soil outside the box was compacted in order to make the sample box a closed system. There was a 5-cm deep groove in the top of the base, which was filled with water before measuring the concentrations of the greenhouse gases to ensure that the box was fully sealed (Figure 1). The water levels were set in July and August of 2014, which was the peak growth period for the plants, followed by C flux monitoring one month later. The observation frequency of carbon fluxes and other environment factors was about 15 days.
At the same time, 11 sites showing distinct water levels were chosen in the Zoige alpine peatland for monitoring water levels and CO2 and CH4 fluxes with the intention to explore the relationship between water levels and C emissions (Figure 1). The results of both the natural and controlled rewetting were compared to determine their effects of on C emissions.

2.3. Measurements of Carbon Fluxes and Environmental Factors

Fluxes of CO2 and CH4 were monitored using a transparent chamber and a laser-based fast greenhouse gas analyzer (FGGA; DLT-100, Los Gatos Research, San Jose, CA, USA) and the data acquisition frequency was 1 Hz. The transparent chamber (50 cm × 50 cm × 50 cm) was connected to the analyzer by means of two holes (each with a diameter of 2 cm) on top of the chamber leading to a 20-m long rubber pipe inside the chamber. The gas from the analyzer returned to the chamber through another 20-m long exit pipe. The center of the chamber’s ceiling had two fans, each 10 cm in diameter, to ensure that the gas concentrations inside the chamber were uniform. For each sampling, the concentrations inside the chamber were monitored for 2 min followed by another round of measurements after the chamber was kept open for 2–5 min. The instruments and the fans were powered by a 12 V battery. The gas fluxes were calculated by plotting the gas concentration as a function of time. At the same time, changes in air and soil temperature were measured by a monitoring system (TZS-5X, Hangzhou Tuopu Instrument Manufacturing Inc., Hangzhou, China), and soil water content (SWC) of the 5 cm, 10 cm, and 20 cm soil depth was observed with the measurement of greenhouse gases using Time Domain Reflectrometry (TDR 300, Spectrum Technologies, Inc., CST, Aurora, IL, USA).

2.4. Data Processing

The C fluxes were calculated from the linear slope indicating the changes in gas concentration with time, as shown below [33]:
F c = d c d t × M V 0 × P P 0 × T 0 T × H
where Fc is the CO2/CH4 flux (mg/(m²·h)); dc/dt is the slope indicating changes in gas concentration as a function of time (ppm/h); M is the molar mass of the measured gas (g/mol); P is the atmospheric pressure at the sampling plot (Pa); V0, P0, and T0 represent the standard molar volume (22.41 m³/mol), standard atmospheric pressure (101,325 Pa), and absolute temperature (K) under the standard atmospheric pressure, respectively; T is the absolute temperature inside the chamber (K); and H is the effective height of the chamber (m).
The CO2 fluxes as measured inside the transparent chamber represented ecosystem respiration (ER) and the CH4 fluxes represented the emissions of CH4 from the ecosystem. The total carbon emissions (TCE) included the emissions of CO2 and CH4. Different greenhouse gases have distinctly different impacts on global warming: CO2 and CH4 accounts for approximately 63% and 18% of total global warming, respectively. To assess the overall greenhouse effect, we considered CO2 equivalence as the basic unit. The global warming potential (GWP) of CH4 is 25 times that of CO2, meaning that 1 tonne of CH4 is equivalent to 25 tonnes of CO2.

2.5. Statistics

In this study, we used repeated measures ANOVA to test for the impacts of rewetting and different water level treatments on the CO2 and CH4 emission fluxes, total C emissions fluxes and soil water content. The normality of error terms and homoscedasticity were evaluated using the Shapiro-Wilk test and the Levene test. The relationship between CO2, CH4, TCE fluxes and water levels was analyzed using linear and nonlinear regressions. The data were processed and analyzed by using SPSS (ver. 20.0, SPSS Inc., Chicago, IL, USA) and the graphs were generated mainly by using Origin (ver. 8.5, OriginLab Corporation, Northampton, MA, USA). The level of significance for all statistical tests was set at α = 0.05.

3. Results

3.1. Natural Rewetting

Rewetting significantly affected the CO2 and CH4 emission fluxes significantly. Before rewetting, the water level was on average −12 cm. After rewetting, the water level increased from +9 cm in August 2014 to +11.3 cm in August 2015. Before rewetting, the ER and CH4 emission flux of the degraded peatland in July 2014 were 242.7 mg CO2 m−2 h−1 and 1.1 mg CH4 m−2 h−1, respectively; in contrast, after rewetting, the ER and CH4 emission flux of the peatland were 94.6 mg CO2 m−2 h−1 and 2.5 mg CH4 m−2 h−1 in August 2014, 106.76 mg CO2 m−2 h−1 and 2.08 mg CH4 m−2 h−1 in July 2015, and 127.52 mg CO2 m−2 h−1 and 2.14 mg CH4 m−2 h−1 in August 2015, respectively (Figure 3). Overall, natural rewetting decreased ER by about 55% (109.63 mg CO2 m−2 h−1) and increased CH4 flux by about 100% (2.24 mg CH4 m−2 h−1).
Rewetting of the peatland also significantly affected the balance of total C emissions (TCE). Rewetting increased the SWC in the 5 cm, 10 cm, and 20 cm soil layers by 57.9%, 46%, and 31.9%, respectively. The CO2 equivalent of CH4 increased by 132.3%, increasing the proportion of the CO2 equivalent of CH4 in ER from 11.1% to 66.1% (Table 1), but the effect of CH4 emissions was smaller than that of CO2 emissions. Although rewetting rapidly increased the CH4 emissions flux, it decreased TCE from 269.6 to 157.0 mg CO2 m−2 h−1 because ER decreased by 61.0% after rewetting. Furthermore, TCE from the ecosystem were reduced by 41.8%.

3.2. Controlled Rewetting

Both in 2014 and in 2015, ER was significantly and negatively correlated with water level (r = −0.99, p < 0.002) (Figure 4). Emissions of CO2 decreased by 83.4% (from 753.30 mg CO2 m−2 h−1 at a water level of –20 cm to 125.33 mg CO2 m−2 h−1 at a water level of 20 cm) and 73.2% (from 1000.97 mg CO2 m−2 h−1 at a water level of –20 cm to 268.61 mg CO2 m−2 h−1 at a water level of 20 cm) in 2014 and 2015, respectively. In contrast, CH4 emissions and the CO2 equivalent were significantly and positively correlated with the water level both in 2014 and in 2015 (r = 0.97, p < 0.01) (Figure 4). In 2014, the emissions of CH4 increased from 0.30 mg CH4 m−2 h−1 at a water level of –20 cm to 2.17 mg CH4 m−2 h−1 at a water level of 20 cm (Figure 4b). In 2015, the change in CH4 flux with increasing water level was larger, increasing from 0.06 mg CH4 m−2 h−1 at a water level of –20 cm to 6.99 mg CH4 m−2 h−1 at a water level of 20 cm (Figure 4d). We found a significant and negative correlation between water level and total carbon emissions (p < 0.001) and significant and positive correlations between water level and CH4 and between water level and the ratio of CH4/ER (p < 0.001) (Figure 5).

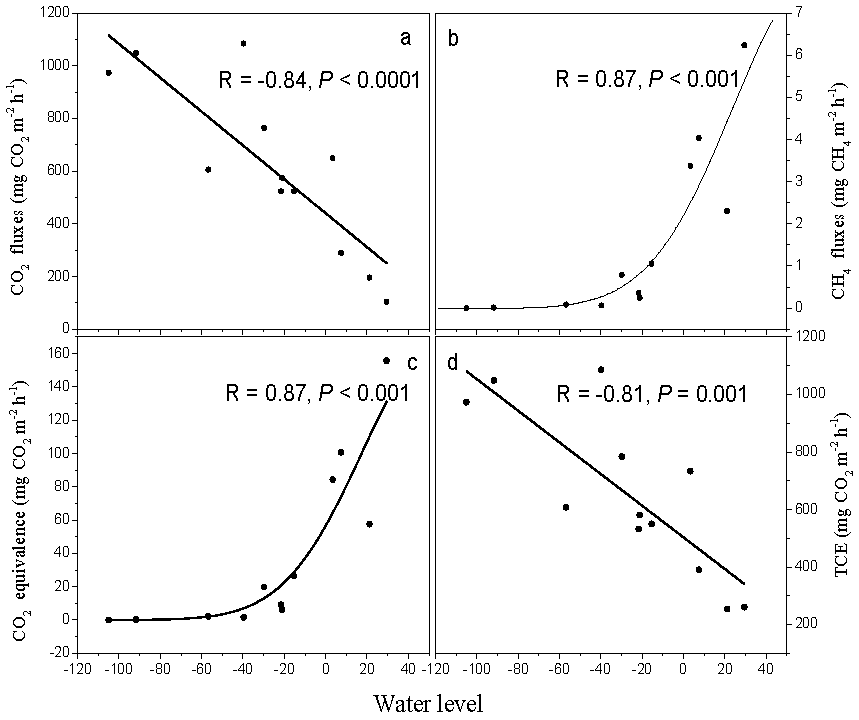
3.3. Temporal and Spatial Relationships between Carbon Emissions and Water Levels

On the regional scale, water level was significantly and negatively correlated to CO2 emissions and significantly and positively correlated to both CH4 emissions and the CO2 equivalent (Figure 6a–c). With increasing water level, CO2 emissions gradually decreased while CH4 emissions increased continuously (Figure 6). Moreover, TCE and the water level were significantly and negatively correlated (Figure 6d). This indicated that as the water levels increased, the degraded peatland began to recover and the rate of carbon emissions from the ecosystem gradually decreased. These findings are consistent with the results obtained in the controlled experiment.

4. Discussion

Whether rewetting of degraded peatland ecosystems could convert these systems from carbon sources into carbon sinks remains uncertain. The present study attempted to uncover as much information as possible by quantifying the effects of rewetting on carbon emissions from a typical Zoige peatland ecosystem by comparing natural rewetting, controlled rewetting, and regional observation in different water levels as well as by monitoring CO2/CH4 fluxes and other environmental factors before and after rewetting.
Rewetting can strongly influence the total carbon emissions from alpine peatlands, as was shown in the present study. Both natural and controlled rewetting increased average CH4 emissions and decreased average CO2 emissions, and decreased total carbon emission by more than 40% (Figure 5). The anaerobic environment after rewetting inhibits the decomposition of litter and soil organic matter, leading to long-term accumulation of soil organic matter and the formation of a layer of partially decomposed organic matter (i.e., peat layer), which is the carbon sink that, by sequestering carbon, contributes in lowering the emissions of CO2 into the atmosphere [19,34]. On the other hand, CH4 emissions are determined by the difference between the CH4 production by methanogens in the anaerobic peatland soils and the CH4 oxidation by methane-oxidizing bacteria (methanotrophs) in the plant rhizosphere [35,36]. As a result, the increase in CH4 emissions may be attributed to less atmospheric oxygen input into the soils via hollow plant stems that form an anaerobic environment for soil microorganisms, resulting in higher CH4 production and lower CH4 oxidation rates in peatland soils [34,37,38].
Water level can influence physicochemical soil properties, including hydrothermal conditions, which can explain at least part of the variation in the emissions of greenhouse gases under different water levels [19,39]. Changes in water level can influence the physiological parameters of plants such as light utilization efficiency, photosynthesis, and respiration, and thus plant growth [19]. In line with our findings, two studies regarding the primary swamps from the Sanjiang plain in China showed that water level was negatively correlated to CO2 emissions but positively correlated to CH4 emissions [40,41]. As the water level rose from −50 cm to 0 cm, CH4 emissions increased significantly [42], a finding that is consistent with the field results of the present study. Furthermore, observations at 11 different water levels also showed that, on a regional scale, water level was negatively correlated to CO2 emissions and positively correlated to CH4 emissions, as was also observed by Chen and co-workers in their landscape-scale study of the Zoige peatlands, in which they found that CH4 flux greatly correlated to the standing water depth [10]. Conversely, Whalen and Reeburgh pointed out that the correlation coefficient between CH4 flux and water level was very low [43].
Several other environmental factors—for example, soil temperature, microbial activity, and the physiological parameters of vegetation—also mediate the effect of rewetting on carbon emissions from alpine peatlands. Soil temperature is positively correlated to emissions of CO2 and CH4 [41,44], in a greater extent for CO2 than CH4 [40]. Microbial activity can influence the carbon fluxes of peatland. Rewetting degraded peatlands raises the water level, turning the peatland environment from aerobic to anaerobic, which, in turn, lowers the activity of aerobic soil microbes, thereby slowing down the decomposition of organic matter and, ultimately, decreasing CO2 emissions and increasing CH4 emissions [19]. Plant physiological changes can also affect the dynamics of CO2 and CH4 emissions [5]. Vascular plants can be used as conduits for saturated soil gas emissions, and most soils release CO2 and CH4 through plants rather than through diffusion or ebullition [36,45,46]. After rewetting, higher water levels reduced CO2 transportation through wetland plant shoots, resulting in lower CO2 effluxes [46]. Also, plants emit CH4 through the aerenchyma to supply their roots with oxygen, which may lead to the oxidation of CH4. Moreover, the plant density, biomass, and root structure also affect the production, transmission, and oxidation of CH4 in the ecosystem [47].
In conclusion, both field and regional study showed that rewetting can decrease carbon emissions and thus help in mitigating the adverse effects of climate change in alpine peatland. However, the present study focused only on the influence of rewetting on carbon emissions, and the mechanisms of degraded peatland rewetting that influence its capacity to sequester carbon remains largely unknown. Hence, future research should focus on three questions: Will rewetting and recovery of peatlands increase their capacity to sequester more carbon? What is the relationship between the water level and the net carbon exchange from an ecosystem? Is it possible to maximize the capacity of an ecosystem to sequester carbon and reduce carbon emissions by optimizing the water level? In the meantime, we will continue our long-term monitoring of peatlands and optimization of the degree and duration of rewetting based on a combination of controlled experiments and modelling. This work will provide a significant background, based on quantitative data, for the protection and reconstruction of the wetlands of China and will promote degraded peatland restoration and rewetting as part of climate change adaptation and mitigation strategies.

Acknowledgments

This work was supported by the National Nonprofit Institute Research Grant (CAFINT2014K06), the National Key Research and Development Program of China (Grant No. 2016YFC0501804), the National Nonprofit Institute Research Grant (CAFYBB2017QB009), and Sichuan Province Youth Scientific and technological innovation research team (Grant No. 2015TD0026).

Author Contributions

Lijuan Cui, Xiaoming Kang and Yanbin Hao conceived and designed the experiments; Yuan Zhang, Jian Zhou, Liang Yan and Wei Li performed the experiments; Xiaoming Kang and Yuan Zhang analyzed the data; Jinzhi Wang, Xiaodong Zhang and Manyin Zhang contributed reagents/materials/analysis tools; Lijuan Cui and Xiaoming Kang wrote the paper; Xiaoming Kang and Paul Kardol revised the manuscript.

Conflicts of Interest

The authors declare no conflict of interest.

References

  1. Gorham, E. Northern peatlands: Role in the carbon cycle and probable responses to climatic warming. Ecol. Appl. 1991, 1, 182–195. [Google Scholar] [CrossRef] [PubMed]
  2. Turunen, J.; Tomppo, E.; Tolonen, K.; Reinikainen, A. Estimating carbon accumulation rates of undrained mires in Finland—Application to boreal and subarctic regions. Holocene 2002, 12, 69–80. [Google Scholar] [CrossRef]
  3. Limpens, J.; Berendse, F.; Blodau, C.; Canadell, J.G.; Freeman, C.; Holden, J.; Roulet, N.; Rydin, H.; Schaepman-Strub, G. Peatlands and the carbon cycle: From local processes to global implications—A synthesis. Biogeosci. Discuss. 2008, 5, 1379–1419. [Google Scholar] [CrossRef]
  4. Chen, H.; Yang, G.; Peng, C.H.; Zhang, Y.; Zhu, D.; Zhu, Q.A.; Hu, J.; Wang, M.; Zhan, W.; Zhu, E.X.; Bai, Z.Z.; Li, W.; Wu, N. The carbon stock of alpine peatlands on the QinghaieTibetan Plateau during the Holocene and their future fate. Quat. Sci. Rev. 2014, 95, 151–158. [Google Scholar] [CrossRef]
  5. Hao, Y.B.; Cui, X.Y.; Wang, Y.F.; Mei, X.R.; Kang, X.M.; Wu, N.; Luo, P.; Zhu, D. Predominance of precipitation and temperature controls on ecosystem CO2 exchange in Zoige alpine wetlands of Southwest China. Wetlands 2011, 31, 413–422. [Google Scholar] [CrossRef]
  6. Johnson, W.C.; Werner, B.; Guntenspergen, G.R. Non-linear responses of glaciated prairie wetlands to climate warming. Clim. Chang. 2016, 134, 209–223. [Google Scholar] [CrossRef]
  7. Kang, X.M.; Wang, Y.F.; Chen, H.; Tian, J.Q.; Cui, X.Y.; Rui, Y.C.; Zhong, L.; Kardol, P.; Hao, Y.B.; Xiao, X.M. Modeling carbon fluxes using multi-temporal MODIS imagery and CO2 eddy flux tower data in Zoige Alpine Wetland, South-West China. Wetlands 2014, 34, 603–618. [Google Scholar] [CrossRef]
  8. Kang, X.M.; Hao, Y.B.; Cui, X.Y.; Chen, H.; Huang, S.X.; Du, Y.G.; Li, W.; Kardol, P.; Xiao, X.M.; Cui, L.J. Variability and changes in climate, phenology, and gross primary production of an Alpine wetland ecosystem. Remote Sens. 2016, 8, 391. [Google Scholar] [CrossRef]
  9. Corrigan, E.; Nieuwenhuis, M. Using Goal-Programming to Model the Effect of Stakeholder Determined Policy and Industry Changes on the Future Management of and Ecosystem Services Provision by Ireland’s Western Peatland Forests. Sustainability 2017, 9, 11. [Google Scholar] [CrossRef]
  10. Chen, H.; Wu, N.; Wang, Y.; Gao, Y.H.; Peng, C.H. Methane fluxes from alpine wetlands of Zoige Plateau in relation to water regime and vegetation under two scales. Water Air Soil Poll. 2011, 217, 173–183. [Google Scholar] [CrossRef]
  11. Cui, M.; Ma, A.; Qi, H.; Zhuang, X.; Zhuang, G.; Zhao, G. Warmer temperature accelerates methane emissions from the Zoige wetland on the Tibetan Plateau without changing methanogenic community composition. Sci. Rep. 2015, 5, 11616. [Google Scholar] [CrossRef] [PubMed]
  12. IPCC. Climate Change 2007: The Physical Science Basis. Contribution of Working Group I to the Fourth Assessment Report of the Intergovernmental Panel on Climate Change; Cambridge University Press: Cambridge, UK; New York, NY, USA, 2007. [Google Scholar]
  13. IPCC. Climate Change 2013: The Physical Science Basis—Contribution of Working Group I to the Fifth Assessment Report of the Intergovernmental Panel on Climate Change; Cambridge University Press: Cambridge, UK; New York, NY, USA, 2013. [Google Scholar]
  14. Roulet, N. Peatlands, carbon storage, greenhouse gases, and the Kyoto protocol: Prospects and significance for Canada. Wetlands 2000, 20, 605–615. [Google Scholar] [CrossRef]
  15. Chen, H.; Wu, N.; Wang, Y.; Zhu, D.; Yang, G.; Gao, Y.; Fang, X.; Wang, X.; Peng, C. Inter-Annual variations of methane emission from an open fen on the Qinghai-Tibetan Plateau: A three-year Study. PLoS ONE 2013, 8, e53878. [Google Scholar] [CrossRef] [PubMed]
  16. Artigas, F.; Jin, Y.S.; Hobble, C.; Marti-Donati, A.; Schäfer, K.V.R.; Pechmann, I. Long term carbon storage potential and CO2, sink strength of a restored salt marsh in New Jersey. Agric. For. Meteorol. 2015, 200, 313–321. [Google Scholar] [CrossRef]
  17. Fleischer, E.; Khashimov, I.; Hölzel, N.; Klemm, O. Carbon exchange fluxes over peatlands in Western Siberia: Possible feedback between land-use change and climate change. Sci. Total Environ. 2016, 545, 424–433. [Google Scholar] [CrossRef] [PubMed]
  18. Walker, T.N.; Garnett, M.H.; Ward, S.E.; Oakley, S.; Bardgett, R.D.; Ostle, N.J. Vascular plants promote ancient peatland carbon loss with climate warming. Glob. Chang. Biol. 2016, 22, 1880–1889. [Google Scholar] [CrossRef] [PubMed]
  19. Zhang, X.D.; Kang, X.M.; Li, C.Y.; Cui, L.J.; Wang, X.W. Comparison of the drainage effects on ecological characteristics in Sanjiang Plain and Zoige Plateau. Chin. J. Ecol. 2015, 34, 2030–2040. [Google Scholar]
  20. Zhang, X.; Liu, H.; Baker, C.; Graham, S. Restoration approaches used for degraded peatlands in Ruoergai (Zoige), Tibetan Plateau, China, for sustainable land management. Ecol. Eng. 2012, 38, 86–92. [Google Scholar] [CrossRef]
  21. Chen, H.; Wu, N.; Gao, Y.H.; Wang, Y.F.; Luo, P.; Tian, J.Q. Spatial variations on methane emissions from Zoige alpine wetlands of Southwest China. Sci. Total Environ. 2009, 407, 1097–1104. [Google Scholar] [CrossRef] [PubMed]
  22. Yu, H.Y.; Luedeling, E.; Xu, J.C. Winter and spring warming result in delayed spring phenology on the Tibetan Plateau. Proc. Natl. Acad. Sci. USA 2010, 107, 22151–22156. [Google Scholar] [CrossRef] [PubMed]
  23. Chen, H.; Yao, S.P.; Wu, N.; Wang, Y.F.; Luo, P.; Tian, J.Q.; Gao, Y.H. Determinants influencing seasonal variations of methane emissions from alpine wetlands in Zoige Plateau and their implications. J. Geophys. Res. 2008, 113, D12303. [Google Scholar] [CrossRef]
  24. Wang, M.; Yang, G.; Gao, Y.H.; Chen, H.; Wu, N.; Peng, C.H.; Zhu, Q.A.; Zhu, D.; Wu, J.H.; He, Y.X.; Tian, J.Q. Higher recent peat C accumulation than that during the Holocene on the Zoige Plateau. Quat. Sci. Rev. 2015, 114, 116–125. [Google Scholar] [CrossRef]
  25. Zheng, D.; Li, B.Y. Progress in studies on geographical environments of the Qinghai-Xizang plateau. Sci. Geogr. Sin. 1999, 19, 295–302. [Google Scholar]
  26. Yang, Y.X. Ecological environment deterioration, mire degeneration and their formation mechanism in the Zoige Plateau. J. Mt. Sci. 1999, 17, 318–323. [Google Scholar]
  27. Tian, Y.B.; Xiong, M.B.; Song, G.Y. Study on change of soil organic matter in the process of wetland ecological restoration in Ruoergai Plateau. Wetl. Sci. 2004, 2, 88–93. [Google Scholar]
  28. Zhou, W.C.; Suolang, D.E.J.; Cui, L.J.; Wang, Y.F.; Li, W. Effects of Fencing and Grazing on the Emissions of CO2 and CH4 in Zoige Peatland, East Qinghai-Tibetan Plateau. Ecol. Environ. Sci. 2015, 24, 183–189. [Google Scholar]
  29. Kaisermann, A.; Roguet, A.; Nunan, N.; Maron, P.A.; Ostle, N.; Lata, J.C. Agricultural management affects the response of soil bacterial community structure and respiration to water-stress. Soil Biol. Biochem. 2013, 66, 69–77. [Google Scholar] [CrossRef]
  30. Cabezas, A.; Gelbrecht, J.; Zak, D. The effect of rewetting drained fens with nitrate-polluted water on dissolved organic carbon and phosphorus release. Ecol. Eng. 2013, 53, 79–88. [Google Scholar] [CrossRef]
  31. Daou, L.; Périssol, C.; Luglia, M.; Calvert, V.; Criquet, S. Effects of drying–rewetting or freezing–thawing cycles on enzymatic activities of different Mediterranean soils. Soil Biol. Biochem. 2016, 93, 142–149. [Google Scholar] [CrossRef]
  32. Estop-Aragonés, C.; Zając, K.; Blodau, C. Effects of extreme experimental drought and rewetting on CO2 and CH4 exchange in mesocosms of 14 European peatlands with different nitrogen and sulfur deposition. Glob. Chang. Biol. 2016, 22, 2285. [Google Scholar] [CrossRef] [PubMed]
  33. Mastepanov, M.; Sigsgaard, C.; Dlugokencky, E.J.; Houweling, S.; Ström, L.; Tamstorf, M.P.; Christensen, T.R. Large tundra methane burst during onset of freezing. Nature 2008, 456, 628–630. [Google Scholar] [CrossRef] [PubMed]
  34. Kim, D.G.; Vargas, R.; Bondlamberty, B.; Turetsky, M.R. Effects of soil rewetting and thawing on soil gas fluxes: A review of current literature and suggestions for future research. Biogeosciences 2012, 9, 2459–2483. [Google Scholar] [CrossRef]
  35. Wang, Z.P.; Zeng, D.; Patrick, W.H., Jr. Characteristics of methane oxidation in a flooded rice soil profile. Nutr. Cycl. Agroecosyst. 1997, 49, 97–103. [Google Scholar] [CrossRef]
  36. Yang, J.; Liu, J.; Hu, X.; Li, X.; Wang, Y.; Li, H. Effect of water table level on CO2, CH4, and N2O emissions in a freshwater marsh of Northeast China. Soil Biol. Biochem. 2013, 61, 52–60. [Google Scholar] [CrossRef]
  37. Lombardi, J.E.; Epp, M.A.; Chanton, J.P. Investigation of the methyl fluoride technique for etermining rhizospheric methane oxidation. Biogeochemistry 1997, 36, 153–172. [Google Scholar] [CrossRef]
  38. Strack, M.; Waddington, J.M.; Tuittila, E.S. Effect of water table drawdown on northern peatland methane dynamics: Implications for climate change. Glob. Biogeochem. Cycl. 2004, 18, 286–289. [Google Scholar] [CrossRef]
  39. Freeman, C.; Lock, M.A.; Reynolds, B. Flux of CO2, CH4 and N2O from a Welsh peatland following simulation of water table drawdown: Potential feedback to climate change. Biogeochemistry 1993, 19, 51–56. [Google Scholar] [CrossRef]
  40. Song, C.C.; Wang, L.L.; Tian, H.Q.; Liu, D.Y.; Lu, C.Q.; Xu, X.F.; Zhang, L.H.; Yang, G.S.; Wan, Z.M. Effect of continued nitrogen enrichment on greenhouse gas emissions from a wetland ecosystem in the Sanjiang Plain, Northeast China: A 5 year nitrogen addition experiment. J. Geophys. Res. 2013, 118, 741–751. [Google Scholar] [CrossRef]
  41. Yang, J.S.; Liu, J.S.; Wang, J.D.; Yu, J.B.; Sun, Z.G.; Li, X.H. Emissions of CH4 and N2O from a wetland in the Sanjiang plain. Chin. J. Plant Ecol. 2006, 30, 432–440. [Google Scholar]
  42. Yang, G.; Chen, H.; Wu, N.; Tian, J.Q.; Peng, C.H.; Zhu, Q.A.; Zhu, D.; He, Y.X.; Zheng, Q.Y.; Zhang, C.B. Effects of soil warming, rainfall reduction and water table level on CH4 emissions from the Zoige peatland in China. Soil Biol. Biochem. 2014, 78, 83–89. [Google Scholar] [CrossRef]
  43. Whalen, S.C.; Reeburgh, W.S. Interannual variations in tundra methane flux: A 4-year time series at fixed sites. Glob. Biogeochem. Cycl. 1992, 6, 139–160. [Google Scholar] [CrossRef]
  44. Zhu, X.; Song, C.; Guo, Y.; Sun, X.; Zhang, X.; Miao, Y. Methane emissions from temperate herbaceous peatland in the Sanjiang Plain of Northeast China. Atmos. Environ. 2014, 92, 478–483. [Google Scholar] [CrossRef]
  45. Verville, J.H.; Hobbie, S.E.; Champin III, F.S.; Hooper, D.U. Response of tundra CH4 and CO2 flux to manipulation of temperature and vegetation. Biogeochemistry 1998, 41, 215–235. [Google Scholar] [CrossRef]
  46. Keller, J.; White, J.R.; Bridghamz, S.D.; Pasto, R.J. Climate change effects on carbon and nitrogen mineralization in peatlands through changes in soil quality. Glob. Chang. Biol. 2004, 10, 1053–1064. [Google Scholar] [CrossRef]
  47. Hirota, M.; Tang, Y.H.; Hu, Q.W.; Hirata, S.; Kato, T.; Mo, W.H.; Cao, G.M.; Mariko, S. Methane emissions from different vegetation zones in a Qinghai-Tibetan Plateau wetland. Soil Biol. Biochem. 2004, 36, 737–748. [Google Scholar] [CrossRef]
Figure 1. The Location of (a) the study area, (b) sampling sites, (c) controlled experimental area and (d) natural rewetting area in the Zoige alpine peatland.
Sustainability 09 00948 g001
Figure 2. The dynamics of daily air temperature and precipitation in 2014 and 2015.
Sustainability 09 00948 g002
Figure 3. Effects of natural rewetting on (a) CO2 and CH4 emissions and (b) water table from the Zoige alpine peatland.
Sustainability 09 00948 g003
Figure 4. Effects of controlled changes in water level on CO2 fluxes (ecosystem respiration, ER) and CH4 fluxes and CO2 equivalence at different water levels in 2014 (a,b) and 2015 (c,d) in the Zoige alpine peatland.
Sustainability 09 00948 g004
Figure 5. Effects of controlled changes in water level on total carbon emissions (TCE) and CH4/ER (ecosystem respiration) of the Zoige alpine peatland in (a) 2014 and (b) 2015.
Sustainability 09 00948 g005
Figure 6. Correlations between (a) CO2 fluxes, (b) CH4 fluxes, (c) CO2 equivalence, (d) total carbon emissions (TCE) and water level in the Zoige alpine peatland.
Sustainability 09 00948 g006
Table 1. Soil water content (SWC), CO2 equivalence of CH4 (CH4(CO2)), CH4(CO2)/ecosystem respiration (ER), and total carbon emissions (TCE) from a piece of Zoige alpine peatland before and after rewetting (the rewetting was accomplished by adjusting the water level to different depths) in 2014.
TreatmentSWC (%) at Three Depths of WaterCH4 (CO2) 1SDCH4 (CO2) /ER (%)SDTCE (CH4 + ER) 1SD
5 cmSD10 cmSD20 cmSD
Before rewetting66.2±7.558.2±5.953.9±4.726.9±2.611.1±0.9269.6±17.3
After rewetting104.5±12.185.0±8.771.1±5.662.5±4.366.1±6.3157.0±12.8
Difference between the above two treatments38.3±4.626.8±2.817.2±0.735.6±1.755±5.4–112.6±4.5
1 Unit: mg CO2 m−2 h−1.

