
The Economic Benefits of the Dokdo Seals Restoration Project in Korea: A Contingent Valuation Study


Department of Energy Policy, Graduate School of Energy & Environment, Seoul National University of Science & Technology, Seoul 01811, Korea
*
Author to whom correspondence should be addressed.
Sustainability 2017, 9(6), 968; https://doi.org/10.3390/su9060968
Submission received: 7 February 2017
/
Revised: 30 May 2017
/
Accepted: 31 May 2017
/
Published: 6 June 2017
(This article belongs to the Special Issue Environment, Tourism and Sustainable Development)
Abstract
:Northern fur seals (Callorhinus ursinus), especially those that live in Dokdo, Korea, represent an endangered species in Korea. Thus, the government is considering the implementation of the Dokdo Seals (DS) restoration project. This article looks at the economic benefits for implementing the project, which includes making habitats for the DS, such as an artificial sea ranch, and training DS rescued from fishing nets and wounded in the wild to adapt to the wild so that they can be released into the Dokdo Sea. To this end, we looked at the willingness to pay (WTP) for the implementation of the project by conducting a contingent valuation (CV) survey of 1000 Korean households. We employed a one-and-one-half-bounded dichotomous choice question format. Furthermore, we used a spike model to model the WTP responses with zero observations. The mean yearly WTP for the project implementation was computed to be KRW 4923 (USD 4.86) for next ten years per household, which is statistically significant at the 1% level. The national annual value amounts to KRW 90.9 billion (USD 89.8 million). This value can be taken as an indication of the economic benefits of restoring the endangered species.
1. Introduction
Public interest in endangered species and biodiversity conservation has been increasing all over the world [1,2,3]. Many developed countries have tried to protect endangered species and conserve biodiversity through legislation. For example, the United States manages about 2000 endangered and threatened animal and plant species under the Endangered Species Act. The Korea Ministry of Environment has also designated 246 species as endangered and has sought to preserve them. However, the main focus has been on land wildlife and less attention has been paid to marine endangered species. As a result, the Korea Ministry of Oceans and Fisheries (MOF) has recently promulgated legislation and taken measures to conserve marine endangered species.
It is known that there are about 1.3 million northern fur seals (Callorhinus ursinus) in the world. However, they are under the risk of extinction and thus included in the Red List of Threatened Species by International Union for Conservation of Nature and Natural Resources [4]. A number of countries including Korea have put northern fur seals on the list of marine endangered species and protected them by law [5,6]. In particular, northern fur seals were commonly found in Dokdo island of Korea in the early 1900s. According to some biologists, over 20,000 sea lions resided near Dokdo at that time. However, while Korea was under Japanese colonial rule (1910–1945), Japanese fishermen caught the wildlife in large quantities. Due to this, the Dokdo Seals (DS), one of the marine mammals, became nearly extinct in Korea.
Therefore, the MOF, on behalf of the Korean central government, planned to implement the DS restoration project. The MOF is searching for methods of bring back DS to Dokdo. One method is to build habitats, like sea ranches, to supply abundant food to the sea. Other ideas are to rescue seals from fishermen’s nets, bring them to the center for treatment and apply technology to increase seal breeding, and then release them back into the wild. In summary, the project includes making habitats for the DS, such as and artificial sea ranches, training DS rescued from fishing nets and that were wounded in the wild to adapt to life in the wild again, and releasing them into the Dokdo Sea. Our nationwide survey of 1000 Korean households indicates that about eighty percent of the respondents strongly agree that the existence of this species is necessary in Korea.
If the DS restoration project is implemented, the public will absorb the costs that will be paid for its implementation by national taxes. Current and future generations will enjoy the benefits of the project. When economic efficiency is employed as the sole decision criterion, we should perform a conventional cost-benefit analysis and determine whether to implement the project or not. The costs required for the implementation of the project can be easily measured compared to the benefits. However, assessing the economic benefits arising from the project is quite complicated work [7,8,9]. Therefore, this paper attempts to assess the public’s willingness to pay (WTP), so as to obtain quantitative information about the economic benefits arising from the project and provide policy-makers with it.
To this end, we use the contingent valuation (CV) technique. As will be discussed in the next section, it has been most widely employed in the context of empirical work measuring the WTP for endangered species [10,11,12]. The CV method usually asks randomly selected respondents questions about whether they are willing to pay a specified amount for obtaining a good through a national survey. In particular, we use the one-and-one-half-bound (OOHB) dichotomous choice (DC) question format given in Cooper et al. [13] to elicit the willingness to pay (WTP) responses. This is because the OOHB DC question format can enhance the statistical efficiency by decreasing some bias.
A large number of respondents indicated an unwillingness to pay for implementing the project in the CV survey, as will be explained below. In other words, we obtained WTP data with observations of zero. To reflect the property of the data in the analysis, we utilize a spike model. Therefore, the purposes of this paper are two-fold. The first is to measure the economic benefits ensuing from implementing the DS restoration project using the CV method. The second purpose is to develop a combination of the OOHB DC CV model and a spike model and examine the empirical practicality of the combination in order to obtain a representative welfare value of the mean WTP. As far as the authors are aware, this is the first analysis in the literature that considers this combination. The remainder of the paper is structured as follows. A brief review of the literature is outlined in Section 2. The methodology adopted in the paper is explained in Section 3. The WTP model used here is described in Section 4. The results and discussion are presented in Section 5. The paper is concluded in the final section.
2. A Brief Review of the Literature
Endangered species usually do not create direct use value, such as revenues or value-added goods or services. However, a person may place a high value on the protection of endangered species, or on preventing them from going extinct, which means taking steps to achieve these goals can increase her/his utility. This value is often called a non-use or existence value by economists [11,14,15,16]. In this regard, the economic value of various endangered species has been examined in numerous studies during the past two decades. The overall finding in the literature is that the public is willing to pay a significant amount to preserve endangered species. Table 1 presents a summary of some previous studies dealing with the economic benefits of protecting endangered species.
Giraud et al. [17] reported that the average of the conservation benefit of the Steller sea lion (Eumetopias jubatus) in the United States was USD 61.13 per household per year. The economic value of Steller sea lions was a maximum of USD 204 per household per year [18]. The mean willingness of US households to pay for improving only the status of the Hawaiian monk seal (Monachus schauinslandi) from endangered to recovered was USD 68.12 per year [11]. Boxall et al. [19] estimated the economic values of marine mammal species, such as beluga whales (Delphinapterus leucas), harbor seals (Phoca vitulina), and blue whale (Balaenoptera musculus) found in the St. Lawrence Estuary in Canada, and found that they ranged from USD 77 to 229 per household per year. A study of Stithou and Scarpa [20] in Greece put the values of EUR 12.40 and EUR 12.04 on turtle and seal conservation as a visitor’s landing fee, respectively. Kontogianni et al. [21] used the CV method and discovered that the people in Greece could pay an additional EUR 87.1 with their water bill in order to conserve the Mediterranean monk seal (Monachus monachus). Kim et al. [5] applied a CV method in order to find that South Koreans were willing to pay an amount to protect the spotted seal (Phocalargha) located in the area of Baengnyeong Island. Bosetti and Pearce [6] carried out a CV survey to estimate WTP for recreational use of seals and found that the mean WTP estimates for seeing seals recovered from an accident in a specialized sanctuary and seeing seals in the wild are GBP 8 and 9 per person, respectively. The mean annual WTP values for recovering humpback whale (Megaptera novaeangliae) and southern resident killer whale (Orcinus orca) in the United States were estimated to be USD 60.98 and 84.38 per household per year, respectively [22].
Interestingly, most of the studies shown in Table 1 utilized the CV method. This is because it is known to be able to effectively capture the non-use value of endangered species. It is a kind of stated preference method for estimating the non-market economic values of conserving certain environmental goods. It is meant to express citizens’ interests and establish the value they place on environmental concerns with no formal market, given the type of good in question [23]. Thus, we can conclude that our strategy of using CV to identify the value of the DS restoration project is consistent with the practices of earlier related studies.
Even though a common stated preference model for valuing non-market goods is the CV method, the choice experiment (CE) approach seems to be very flexible in terms of modeling complex trade-offs between attributes in comparison to the CV method. One conceptual difference between them is that the price of the good in the CE method is treated as simply another component attribute of the good. The CE method is a more natural choice than the CV method when a good to be evaluated is multi-dimensional, and the trade-offs between them are of particular interest. The CE method represents a useful methodological complement to the conventional CV method of evaluating a good. It is utility-theoretic in quite a literal way. Viewed as an extension of CV, it offers excellent information efficiency via a question format that respondents find plausible and easy to understand. The econometric estimation procedures of CV and CE are very similar to that of the discrete choice model typically dealt with in econometrics textbooks. The only difference is that further designs and surveys of a hypothetical product not required in a conventional discrete choice model are demanded in CV and CE.
From an empirical standpoint, respondents may be generally more comfortable in providing a choice of one alternative among several alternatives with attribute bundles which include prices, rather than dollar valuations of the same bundles without prices, which is usually demanded in CV studies. In view of methodological issues with CV and CE, there have some advantages and disadvantages between them. In summary, CE is not panacea for the problems debated regarding CV, CE questions appear to share many of the advantages and disadvantages with CV questions, and CE presents a problem that is not necessarily encountered with traditional CV methods. For example, the respondent’s cognitive burden required in the CE is much bigger than that in the CV. In addition, several attributes of the goods to be valued should be well defined in order to apply the CE method. However, the attributes of the DS restoration project are not well defined. These are the main reasons why we decided to use the CV approach rather than the CE approach in this study.
3. Methodology
3.1. Method for Measuring Economic Benefits of Implementing the DS Restoration Project: The CV Approach
The economic benefits for implementing the DS restoration project should be understood as a case of a non-market good which include environmental goods. The people’s WTP for a non-market good constitutes the underpinning rule for the benefits of the associated policy [24], and can be gauged using certain preference techniques, a representative one of which is the CV technique. Arrow et al. [25] concluded that the CV method is able to generate credible information that can be applied in relation to decisions regarding administration and jurisdiction. The CV approach is theoretically based on microeconomics [26,27,28,29,30].
3.2. Survey Method, Sampling, and CV Survey Instrument
In the CV survey, the respondents were asked to make a responsible decision about payment. To satisfy this condition, a professional survey firm selected and interviewed heads of households or home-keepers; the respondents’ ages ranged from 20 to 65. We chose to use face-to-face interviews so that the respondents were provided with sufficient information on the goods to be valued. In particular, several facts explained in the Introduction section were explicitly conveyed to the respondents in the CV survey for aiding their value judgments.
The survey company implemented a random sampling and field CV survey during June 2014. According to Statistics Korea, there were 18,457,628 households in Korea. In order to draw a random sample of this population, a stratified random sampling was conducted by the polling firm. We made fifteen strata. Our sample was allocated to the strata in proportion to each stratum’s population characteristics, such as age, income, and gender, resulting in 22 to 230 households being assigned to each stratum. For example, the numbers of surveys allocated to households in Seoul, Busan, Daegu, Incheon Gwangju, Daejeon, Ulsan, Gyunggi, Gangwon, Chungbuk, Chungnam, Jeounbuk, Jeounnam, Gyungbuk, and Gyungnaum were 197, 71, 50, 55, 30, 32, 22, 230, 33, 33, 45, 38, 39, 58, and 67, respectively. A random sampling was implemented within each stratum. The trained interviewers carried out 1000 personal interviews at the interviewees’ homes.
We conducted a pre-test on the survey questionnaire with a focus group (30 people) to examine whether the questionnaire could be properly understood and to obtain the distribution of the WTP values. The pre-test results helped us to rectify the errors in the questionnaire and to refine the bids to be presented to the respondents. The final questionnaire consisted of (a) explanations of the general background and purpose of the survey, (b) a question on the issue of the yearly WTP for implementing the DS restoration project, and (c) questions regarding household characteristics. Based on the interviewers’ comments, the interviewees gave their WTP responses without any particular difficulty.
3.3. Method of WTP Elicitation and Bid Amounts
In accordance with the guidance of the NOAA (National Oceanic and Atmospheric Administration) on the CV approach [25] and the recommendations of several recent studies [31,32,33], we adopted a dichotomous choice (DC) question format. Open-ended questions are not encouraged, as they will generate an overestimated WTP. Generally, interviewees are asked questions that have ‘yes’ or ‘no’ answers that indicate the interviewees’ willingness to pay a concrete amount for a non-market good; in this study, the questions specifically addressed the DS restoration project.
The number of questions identifies the DC question form—a single-bounded (SB) or a double-bounded (DB) DC format. A SB DC question asks the respondent one question, but a DB DC question offers him or her two bids. As the additional question obviously gives a greater range for the WTP, DB questions are likely to be more efficient than SB questions [34]. However, many studies in the literature claim that some response bias is captured when moving from an SB to a DB question [35,36,37,38]. This is because there is evidence that some of the responses to the second bid are inconsistent with the responses to the first bid. In other words, the distribution of underlying preferences implied by answers to the first question may not be the same as that implied by the responses to the first and second questions. For example, Cameron and Quiggin [35] found that while values implied by the first and second responses are highly correlated and may be drawn from the same distribution, they are definitely not identical. McFadden [36] concluded that the DB elicitation method is internally inconsistent in that the hypothesis that the first and second responses in the DB DC experiment are drawn from the same distribution can be rejected at the 1% level. Carson and Grove [37] suggested that, in general, WTP estimates from a DB DC format are smaller than those from a SB DC format, and that the desirability of using the DB DC format rests on the analyst’s tradeoff between a downward bias and a tighter confidence interval. Bateman et al. [38] considered a variety of potential causes of such inconsistencies and tested both the effects caused by moving from one bound to another and those caused when respondents follow either the bid-increasing path generated by a positive response at a given bid amount, or the bid-decreasing path generated by negative responses. They found that both bound and path effects are significant and generate a pattern corresponding to certain causes of inconsistencies.
In summary, the SB and DB formats may, respectively, suffer from statistical inefficiency and response bias. In the OOHB DC format, the interviewer randomly chooses between lower and upper bids as an initial value at which to elicit the respondent’s WTP. The OOHB DC question format, used to reduce the potential for response bias in a multiple-bound format such as SB DC and DB DC while maintaining much of the efficiency, was successful in eliciting WTP values for project implementation. To overcome these complications, a one-and-one-half-bounded (OOHB) DC question method is suggested by Cooper et al. [13]. The merits of using an OOHB DC question, as employed in our study, are presented in Cooper et al. [13].
3.4. Payment Vehicle
The interviewees could easily reveal their true WTP using the medium, called the payment vehicle, that may be a tax, a fund, a donation, or an expenditure through which the amount would be paid. The respondents should be familiar with the payment vehicle, and the goods to be valued should have a clear connection with it. For this reason, the payment vehicle used for this study was income tax. This is appropriate for our analysis and is also familiar to the respondents. Furthermore, among several types of national taxes, income tax is the one that is most familiar to the respondents [37,39,40]. Therefore, income tax is employed in this study as the payment vehicle. Originally, the annual income tax takes the form of an increasing block rate in Korea to allow for income redistribution. However, asking the respondent a WTP question reflecting the tax rate structure in the CV survey was not a feasible option because it places a cognitive burden on the respondents. Thus, a lump sum annual income tax was assumed in the CV survey. The WTP question as described in Appendix A was posed in the following manner: “Is your household willing to pay additional income tax in the form of a given amount per year for the next ten years for implementing the Dokdo seals restoration project in Korea, supposing that the project is certain to succeed?”.
4. Modeling of WTP: OOHB DC Spike Model
The basic modeling of WTP using DC CV data is usually based on the work of Hanemann et al. [34], Cameron and James [41], and Cameron [42]. In particular, OOHB DC CV data can be analyzed following Cooper et al. [13]. There are respondents. Several sets of two bids are determined before the CV survey is carried out and a set is randomly presented to the respondent. Any set offered to respondent is made up of two bids, a lower bid () and an upper bid (). About half of the interviewees are offered as the first bid. If the answer is “yes”, a follow-up question is asked concerning . If the answer to this is “no”, no further question is needed. is presented to the other half of the respondents as the first bid. If the response is “yes”, no further question is required. If the response is “no”, a subsequent question regarding is asked.
There are six possible outcomes to this process: “yes–yes” (), “yes–no” (), and “no” (), from the first case, and “no–yes” (), “no–no” (), and “yes” () from the second case. Therefore, we can set up six binary-valued indicator variables, , , , , , and . For example, is one if the interviewee’s answer is “yes–yes” and zero if otherwise.
When a considerable proportion of interviewees give zero WTP answers, because of their indifference towards the object to be valued, researchers need to pay particular attention to these zero WTP observations. We utilized a spike model to analyze our OOHB DC CV data with a number of zero observations. The spike model was originally proposed for SB DC CV data by Kriström [43], was adjusted for DB DC CV data by Yoo and Kwak [44], and is sometimes applied to OOHB DC CV data (e.g., [45,46]). Let the random variable for the WTP be and the cumulative distribution function of the WTP be .
The spike model originally suggested by Kriström [43] is based on logistic distribution. There are many other continuous distributions such as normal, lognormal, Weibull, gamma, etc. The logistic distribution adopted here is defined on a real number. However, lognormal, Weibull, and gamma distributions are defined on a positive real number. Moreover, when using a normal distribution, the spike cannot be specified as a closed form. Thus, following the practice of the former studies [43,44,45,46], we consider here the logistic distribution only. In our OOHB DC spike model, has the functional form:
where is a bid amount, and and are the parameters to be estimated. The spike, defined as the probability of the respondent having zero WTP, is computed as . The probability of the respondent’s WTP being negative is assumed to be zero. The last condition does imply that negative WTP is not allowed. Of course, the negative WTP may exist in the form of a subsidy. However, in actuality, any subsidy for the respondents with negative WTP cannot occur in the situation of Korea. Thus, placing zero probability on negative WTP does not seem to be unreasonable.
Those interviewees who answered “no” when presented with as the first bid, or “no–no” when presented with as the first bid, were asked an extra question, “Do you have zero willingness to pay?”. This is because they were separated into two groups: those who have a true zero WTP, and those who have a positive WTP that is less than .
Consequently, we can define two more binary-valued indicator variables:
Using Equations (1) and (2), we can derive the log-likelihood function of the OOHB DC spike model as:
The spike is defined as the probability of the respondent’s WTP being zero and is computed as . Moreover, we can obtain the estimates for and by applying the maximum likelihood estimation method to Equation (3) [7,9,12,16,17,39,44,45,46]. Using these, the well-known formula for the mean WTP can be calculated as:
5. Estimation Results
5.1. Data
We collected 1000 observations from the CV survey of randomly chosen households over the entire nation. We used seven sets of WTP values, detected through a pre-test, as mentioned before: (1000, 3000); (2000, 4000); (3000, 6000); (4000, 8000); (6000, 10,000); (8000, 12,000); (10,000, 15,000) as illustrated in Table A1. The figures given are in Korean won, and the first and the second elements of each set are, respectively, the lower and the higher bids. At the time of the questionnaire, the exchange rate was USD 1.0 to approximately KRW 1012.
5.2. Estimation Results of the OOHB DC Spike Model
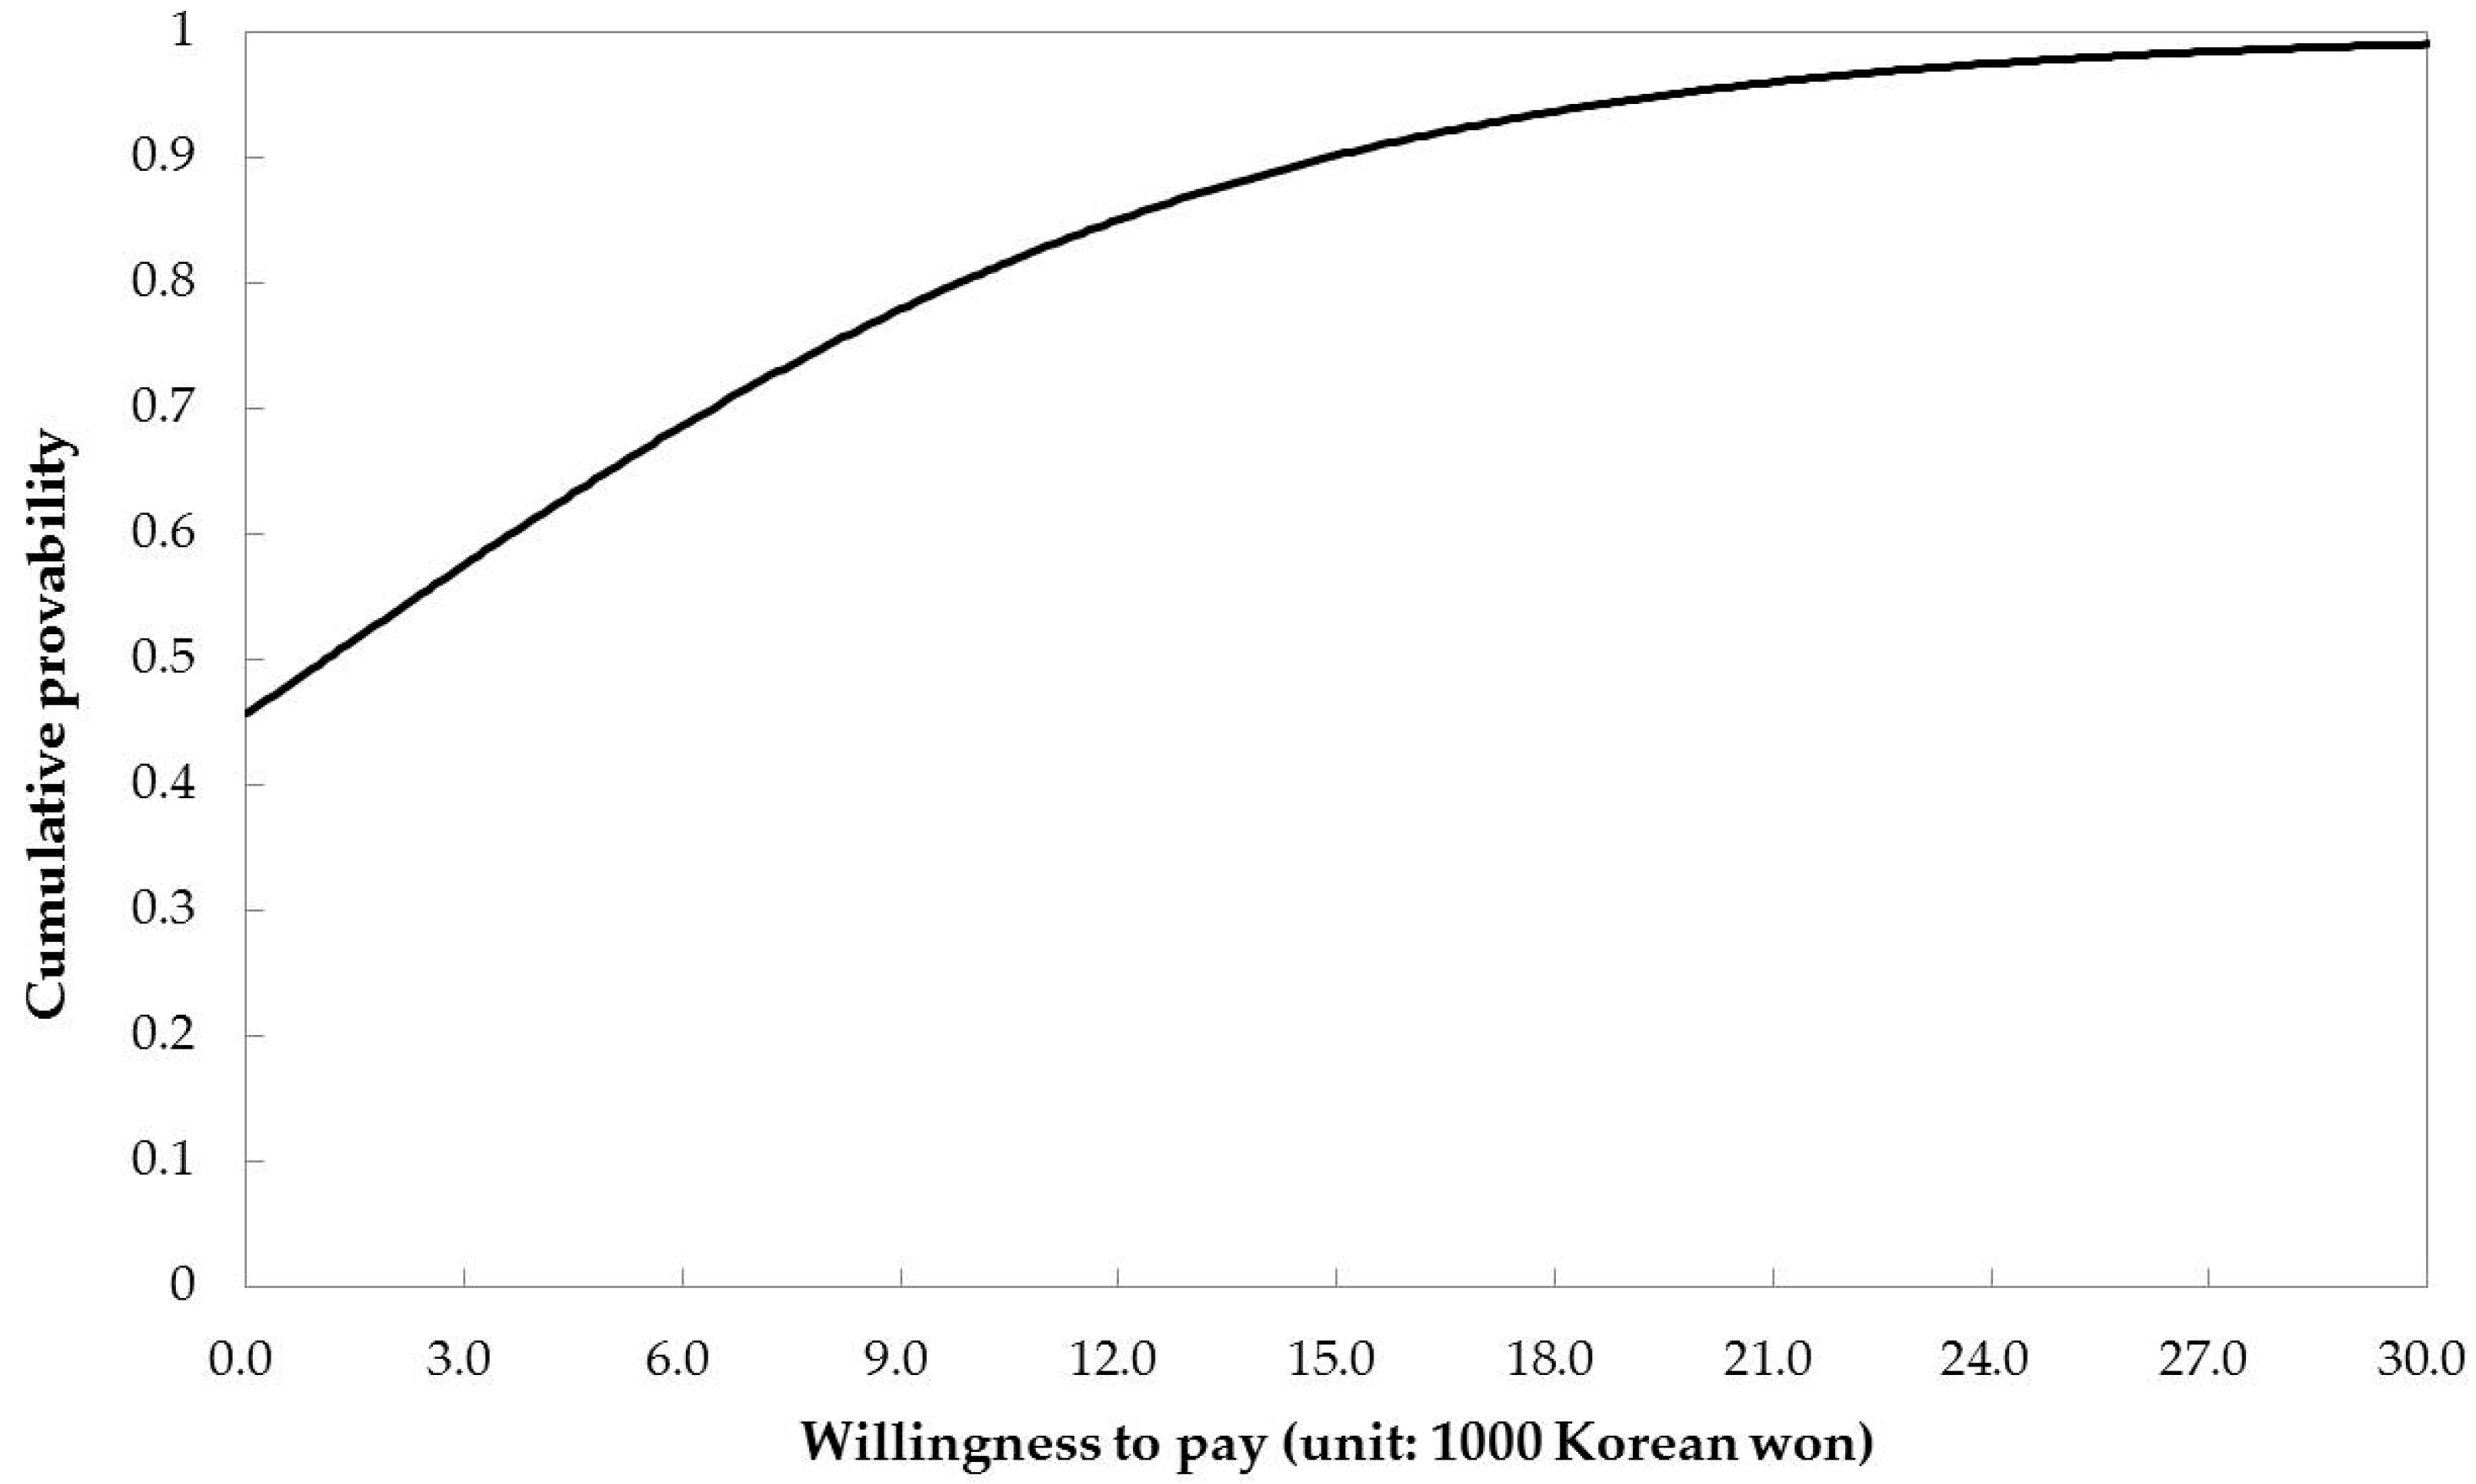
The second column of Table 2 reports the estimation results of the OOHB DC spike model. Judging from the t-values and the Wald statistic, we can reject both the null hypothesis that each parameter estimate is zero and the null hypothesis that all the parameter estimates are zero at the 1% level. The estimate for the bid level is negative, which indicates that a higher bid amount makes a “yes” response unwilling. The estimate for the spike is 0.4562, which is the same as the percentage of the sample having zero WTP responses (450 households). This demonstrates that the spike model applied here depicts the sample well. The estimated distribution function of the WTP is described in Figure 1. We found that the mean additional WTP is KRW 4923 (USD 4.86) per household, and that this is statistically significant at the 1% level. For the purpose of accounting for the uncertainties pertaining to the computation of the estimates, we also report a 95% and 99% confidence intervals, calculated using the parametric bootstrapping method with 5000 replications [47].
Moreover, we also estimated the SB DC spike model using only the responses to the first question and ignoring the responses to the second question. The results are presented in the third column of Table 2. All the parameter estimates and the mean WTP value are statistically significant at the 1% level. It seems that there is no significant difference between the estimation results of the OOHB DC and SB DC spike models. However, the mean WTP estimates are significantly different as the 95% confidence intervals of the mean WTP estimates from the two models do not overlap. Therefore, the OOHB DC model gives us an estimate of mean WTP that is significantly different from the SB DC model in our data.
For comparison, the Kaplan-Meier-Turnbull non-parametric estimate of mean WTP, , can be estimated as:
where is an empirical probability of saying “yes” to a given jth bid, , and is the number bids. can be computed as where and are the number of “yes” votes to and the number of respondents who were presented with , respectively.
is a lower bound estimate of mean WTP. should be monotonically decreasing. This condition means that should be non-negative. If this condition is not satisfied, can be replaced with which is usually called an adjusted probability. The procedures for obtaining are presented in Table 3. is estimated to be KRW 4809 (USD 4.75). The non-parametric estimator does give a similar estimate compared to the parametric estimate (KRW 4923).
5.3. Estimation Results with Covariates
To examine the impact of a respondent’s socio-economic characteristics on the probability of him or her answering “yes” to a given bid, it is necessary to consider the model with covariates. At this point, in Equation (4) is easily changed to , where and are the covariate vector and the parameter to be estimated, respectively. The socioeconomic variables and the sample statistics used for the covariates are described in Table 4. The mean monthly household income was KRW 4.15 million (USD 4101), and mean education level of the participants were 13.98 years. Before estimating the model with covariates, any existence of multi-collinearity should be checked. Table 5 shows the correlation matrix of the four variables in Table 4. The highest correlation coefficient is 0.283 between Knowledge and Income variables and less than 0.5. Thus, it does not appear that our data suffer from any multi-collinearity problem.
Table 6 demonstrates the estimation results considering the covariates. In the model with covariates, the spike can be estimated as where and are the vector of the mean of the variables and the vector of the estimated coefficients, respectively. It was estimated to be 0.4691, which is not significantly different from the value obtained in the model without covariates (0.4562). The mean WTP estimate from the model with covariates is KRW 4180 per household per year, which is somewhat different from that from the model without covariates (KRW 4923). The estimated coefficients for the Knowledge, Need, and Income variables were statistically significant at the 5% level, and the estimated coefficient for the Education variable was not significant at the 5% level. The respondents with prior information about marine endangered species had a tendency to give a “no” response to a given bid, while thinking that programs for protecting the endangered species are needed increased the probability of responding “yes” to a WTP question. Respondents with higher incomes tended to accept a higher proposed bid level, as the increased cost would impose less of a burden. This finding implies that a sound national economy can positively affect the implementation of the DS restoration project.
5.4. Discussion of the Results
As a last step, it is necessary to extend our findings for the sample to obtain information applicable to the whole population. In performing this extension, the most important point to be considered is whether or not the sample represents the population. As stated above, the sampling was carried out by a professional survey company to ensure that the characteristics of the sample were consistent with the characteristics of the whole population, and that the sample was random.
We need to check that our sample is representative of the Korean population. The sample values for three variables can be compared with their population values. The population values for gender, the size of household, and household’s monthly income are available from Statistics Korea. According to Statistics Korea, the ratio of male people, the average household income, and the average household size are 50.3%, KRW 4.30 million, and 3.2 persons, respectively, at the time of survey. These values are quite close to the sample means (49.7%, KRW 4.15 million, and 3.4 persons).
The actual survey was conducted as follows. First, a random sample of households was drawn from a stratum, reflecting with reasonable accuracy the characteristics of the general population. Second, trained interviewers visited the sampled households and, before asking the face-to-face interview questions, asked respondents whether or not they would participate in the interview concerning evaluation of the proposed project. If they agreed, the interviewers initiated the main interview. If they did not agree, the interview was stopped. These procedures were able to gather socioeconomic information on every interviewed household in addition to WTP information from all the households that participated in face-to-face interviews. Thus, the response rate of the interviewed households was one hundred percent.
The setting of the covariates may influence the mean WTP value, so we use the mean WTP estimate from the model without covariates. The 2014 data from Statistics Korea [48] show that there are a total of 18,457,628 households in Korea. As such, the value of implementing the DS restoration project is KRW 90.9 billion (USD 89.8 million) per year. To examine the economic feasibility of the project, we can compare this value with the cost involved in implementing the project.
The results of our estimations have various potential uses. They can be incorporated into calculations of the total economic benefits of implementing the DS restoration project. The mean yearly WTP was computed to be KRW 4923 (USD 4.86) per household. This can be interpreted as the economic benefit of implementing the DS restoration project. If the additional cost of the project is less than the economic benefit, then the project can be successfully performed. However, if it is not, further action is needed to ensure that the implementation of the DS restoration project is successful. For example, this might involve assigning marine endangered species to a conservation and restoration program.
6. Conclusions and Policy Implications
Korea has achieved economic development at the expense of degrading its marine environment. However, the public currently has a great interest in the preservation of marine endangered species and marine biodiversity. For example, the Korean government officially went back to square one with a public utility’s plan for building the Garolim Bay tidal power plant in 2014, due to several reasons. The most important of the reasons was the public objections to the construction of the plant, which risked rendering extinct the spotted seal, a protected species. Since then, the MOF has made a list of protected marine species and devoted special attention to preserving them.
As a response to the attention, the Korean government planned to implement the DS restoration project and asked for quantitative information on the economic benefits of the project. Thus, this study applies the CV technique to give a value to the economic benefits of implementing the DS restoration project, employing data gathered from a CV survey. To mitigate the response bias in eliciting WTP and to increase the statistical efficiency of the analysis of the WTP data, we used an OOHB DC question format.
In addition, we utilized a spike model to manage the considerable number of zero WTP responses. This approach was successful, in that all the parameter estimates from the model without covariates were statistically meaningful at the 1% level. The mean WTP for the policy was calculated to be KRW 4923 (USD 4.86) per household per year. As such, the national value of the DS restoration project implementation amounted to KRW 90.9 billion (USD 89.8 million) per year for the next ten years. We can conclude that Korean households have revealed that they are willing to accept a share of the financial burden of implementing the DS restoration project.
These values obviously signal the economic benefits arising from implementing the DS restoration project. Thus, they can be compared with the costs involved in implementing the project to decide whether the project implementation is socially desirable or not. Moreover, the framework of this study can provide a good reference in designing the programs for protecting other endangered marine species in Korea. For example, the MOF is constructing programs to protect and restore certain endangered species, such as sea turtles and spotted seals.
Acknowledgments
This research was a part of the project titled ‘Marine ecosystem-based analysis and decision-making support system development for marine spatial planning’, funded by the Ministry of Oceans and Fisheries, Korea (grant number 20170325).
Author Contributions
All the authors contributed immensely. Seul-Ye Lim designed the ideas and analyzed the data; Se-Jun Jin wrote the majority of the manuscript; and Seung-Hoon Yoo contributed the main idea and various scientific insights and helped to edit the manuscript.
Conflicts of Interest
The authors declare no conflict of interest.
Appendix A
The main part of the survey questionnaire employed in the study is as follows.
Appendix A.1. Proposed Bid Amount
The respondents were randomly assigned to seven subgroups and each subgroup was asked to respond to a different bid amount as follows:

Table A1.
List of bid amount presented to the respondents.
| Subgroups | Bid Amount (Korean won) | |
|---|---|---|
| Lower Bid Amount | Upper Bid Amount | |
| Group 1 | 1000 | 3000 |
| Group 2 | 2000 | 4000 |
| Group 3 | 3000 | 6000 |
| Group 4 | 4000 | 8000 |
| Group 5 | 6000 | 10,000 |
| Group 6 | 8000 | 12,000 |
| Group 7 | 10,000 | 15,000 |
Appendix A.2. Questions about Willingness to Pay for Implementing the Dokdo Seals Restoration Project in Korea
Type A. Q1. Is your household willing to pay additional income tax of 1000 Korean won (lower bid amount) per year for the next ten years for implementing the Dokdo Seals restoration project in Korea, supposing that the project is certain to succeed?
- Yes—go to Type A. Q2.
- No—go to Q3.
Type A. Q2. Is your household willing to pay additional income tax of 3000 Korean won (upper bid amount) per year for the next ten years for implementing the Dokdo Seals restoration project in Korea, supposing that the project is certain to succeed?
- Yes—Finish this survey
- No—Finish this survey
Type B. Q1. Is your household willing to pay additional income tax of 3000 Korean won (upper bid amount) per year for the next years for implementing the Dokdo Seals restoration project in Korea, supposing that the project is certain to succeed?
- Yes—Finish this survey
- No—go to Type B. Q2.
Type B. Q2. Is your household willing to pay additional income tax of 1000 Korean won (lower bid amount) per year for the next ten years for implementing the Dokdo Seals restoration project in Korea, supposing that the project is certain to succeed?
- Yes—Finish this survey
- No—go to Q3.
Q3. Then, is your household willing to pay anything for implementing the Dokdo Seals restoration project in Korea?
- Yes, our household is willing to pay something less than 1000 Korean won.
- No, our household is not willing to pay anything. In other words, our household’s willingness to pay is zero.
References
- Czech, B.; Krausman, P.R. Public opinion on endangered species conservation and policy. Soc. Nat. Resour. 2010, 12, 469–479. [Google Scholar]
- Clements, C.F. Public interest in the extinction of a species may lead to an increase in donations to a large conservation charity. Biodivers. Conserv. 2013, 22, 2695–2699. [Google Scholar] [CrossRef]
- Cochrane, K. Use and misuse of CITES as a management tool for commercially-exploited aquatic species. Mar. Policy 2015, 59, 16–31. [Google Scholar] [CrossRef]
- The IUCN Red List of Threatened Species. Available online: http://www.iucnredlist.org (accessed on 8 May 2017).
- Kim, J.Y.; Mjelde, J.W.; Kim, T.K.; Lee, C.K.; Ahn, K.M. Comparing willingness-to-pay between residents and non-residents when correcting hypothetical bias: Case of endangered spotted seal in South Korea. Ecol. Econ. 2012, 78, 123–131. [Google Scholar] [CrossRef]
- Bosetti, V.; Pearce, D.W. A study of environmental conflict: The economic value of Grey Seals in southwest England. Biodivers. Conserv. 2003, 12, 2361–2392. [Google Scholar] [CrossRef]
- Ramajo-Hernández, J.; Saz-Salazar, S. Estimating the non-market benefits of water quality improvement for a case study in Spain: A contingent valuation approach. Environ. Sci. Policy 2012, 22, 44–59. [Google Scholar] [CrossRef]
- Börger, T.; Beaumont, N.J.; Pendleton, L.; Boyle, K.; Cooper, P.; Fletcher, S.; Haab, T.; Hanemann, M.; Hooper, T.L.; Hussain, S.S.; et al. Incorporating ecosystem services in marine planning: The role of valuation. Mar. Policy 2014, 46, 161–170. [Google Scholar] [CrossRef]
- Lim, S.Y.; Kim, H.Y.; Yoo, S.H. Public willingness to pay for transforming Jogyesa Buddhist Temple in Seoul, Korea into a cultural tourism resource. Sustainability 2016, 8, 900. [Google Scholar] [CrossRef]
- Becker, N.; Choresh, Y.; Inbar, M.; Bahat, O. Biodiversity Economics; Cambridge University Press: Cambridge, UK, 2007; pp. 313–342. [Google Scholar]
- Wallmo, K.; Lew, D.K. Valuing improvements to threatened and endangered marine species: An application of stated preference choice experiments. J. Environ. Manag. 2011, 92, 1793–1801. [Google Scholar] [CrossRef] [PubMed]
- Saz-Salazar, S.; Guaita-Pradas, I. On the value of drovers’ routes as environmental assets: A contingent valuation approach. Land Use Policy 2013, 32, 78–88. [Google Scholar] [CrossRef]
- Cooper, J.C.; Hanemann, M.; Signorello, G. One and one-half bound dichotomous choice contingent valuation. Rev. Econ. Stat. 2002, 84, 742–750. [Google Scholar] [CrossRef]
- Randall, A. Total economic value as a basis for policy. Trans. Am. Fish. 1987, 116, 325–335. [Google Scholar] [CrossRef]
- Perman, R.; Ma, Y.; McGilvray, J. Natural Resources and Environmental Economics; Longman: London, UK; New York, NY, USA, 1996. [Google Scholar]
- Saz-Salazar, S.; García-Menéndez, L.; Feo-Valero, M. Meeting the environmental challenge of port growth: A critical appraisal of the contingent valuation method and an application to Valencia Port, Spain. Ocean Coast. Manag. 2012, 59, 31–39. [Google Scholar] [CrossRef]
- Giraud, K.; Turcin, B.; Loomis, J.; Cooper, J. Economic benefit of the protection program for the Steller sea lion. Mar. Policy 2002, 26, 451–458. [Google Scholar] [CrossRef]
- Lew, D.K.; Layton, D.F.; Rowe, R.D. Valuing enhancements to endangered species protection under alternative baseline futures: The case of the steller sea lion. Mar Resour. Econ. 2010, 25, 133–154. [Google Scholar] [CrossRef]
- Boxall, P.C.; Adamowicz, W.L.; Olar, M.; West, G.E.; Cantin, G. Analysis of the economic benefits associated with the recovery of threatened marine mammal species in the Canadian St. Lawrence Estuary. Mar. Policy 2012, 36, 189–197. [Google Scholar] [CrossRef]
- Stithou, M.; Scarpa, R. Collective versus voluntary payment in contingent valuation for the conservation of marine biodiversity: An exploratory study from Zakynthos, Greece. Ocean Coast. Manag. 2012, 56, 1–9. [Google Scholar] [CrossRef]
- Kontogianni, A.; Tourkolias, C.; Machleras, A.; Skourtos, M. Service providing units, existence values and the valuation of endangered species: A methodological test. Ecol. Econ. 2012, 79, 97–104. [Google Scholar] [CrossRef]
- Wallmo, K.; Lew, D.K. A comparison of regional and national values for recovering threatened and endangered marine species in the United States. J. Environ. Manag. 2016, 179, 38–46. [Google Scholar] [CrossRef] [PubMed]
- Jakobsson, K.M.; Dragun, A.K. Contingent Valuation and Endangered Species: Methodological Issues and Applications; Edward Elgar: Cheltenham, UK, 1996. [Google Scholar]
- Brent, R.J. Applied Cost-Benefit Analysis, 2nd ed.; Edward Elgar: Cheltenham, UK, 2006. [Google Scholar]
- Arrow, K.; Solow, R.; Portney, P.R.; Leamer, E.E.; Radner, R.; Schuman, H. Report of the NOAA panel on contingent valuation. Fed. Regist. 1993, 58, 4601–4614. [Google Scholar]
- Salen, M.E.; Mercer, D.E. The economic value of mangroves: A meta-analysis. Sustainability 2012, 4, 359–383. [Google Scholar] [CrossRef]
- Kong, F.; Xiong, K.; Zhang, N. Determinants of farmers’ willingness to pay and its level for ecological compensation of Poyang lake wetland, China: A household-level survey. Sustainability 2014, 6, 6714–6728. [Google Scholar] [CrossRef]
- Huang, C.H.; Wang, C.H. Estimating the total economic value of cultivated flower land in Taiwan. Sustainability 2015, 7, 4764–4782. [Google Scholar] [CrossRef]
- Mazzocchi, C.; Sali, G. Sustainability and competitiveness of agriculture in mountain areas: A willingness to pay (WTP) approach. Sustainability 2016, 8, 343. [Google Scholar] [CrossRef]
- Mitchell, R.C.; Carson, R.T. Using Surveys to Value Public Goods: The Contingent Valuation Method; Resources for the Futur: Washington, DC, USA, 1989. [Google Scholar]
- Bateman, I.J.; Carson, R.T.; Day, B.; Haneman, M.; Hanley, N.; Hett, T.; Jones-Lee, M.; Loomes, G.; Mourato, S.; Ozdemiroglu, E.; et al. Economic Valuation with Stated Preference Techniques: A Manual; Edward Elgar: Northampton, MA, USA, 2002. [Google Scholar]
- Champ, P.A.; Boyle, K.J.; Brown, T.C. A Primer on Nonmarket Valuation; Kluwer Academic Publishers: Dordrecht, The Netherlands, 2004. [Google Scholar]
- Johnston, R.J.; Boyle, K.J.; Adamowicz, W.; Bennett, J.; Brouwer, R.; Cameron, T.A.; Hanemann, W.M.; Hanley, N.; Ryan, M.; Scarpa, R.; et al. Contemporary guidance for stated preference studies. J. Assoc. Environ. Resour. Econ. 2017, 4, 319–405. [Google Scholar] [CrossRef]
- Hanemann, W.M.; Loomis, J.; Kanninen, B.J. Statistical efficiency of double-bounded dichotomous choice contingent valuation. Am. J. Agric. Econ. 1991, 73, 1255–1263. [Google Scholar] [CrossRef]
- Cameron, T.A.; Quiggin, J. Estimation using contingent valuation data from a dichotomous choice with follow-up questionnaire. J. Environ. Econ. Manag. 1994, 27, 218–234. [Google Scholar] [CrossRef]
- McFadden, D. Contingent valuation and social choice. Am. J. Agric. Econ. 1994, 76, 689–708. [Google Scholar] [CrossRef]
- Carson, R.T.; Groves, T. Incentive and informational properties of preference questions. Environ. Resour. Econ. 2007, 37, 181–210. [Google Scholar] [CrossRef]
- Bateman, I.J.; Langford, L.H.; Jones, P.; Kerr, G.N. Bound and path effects in double and triple bounded dichotomous choice contingent valuation. Resour. Energy Econ. 2001, 23, 191–213. [Google Scholar] [CrossRef]
- Park, S.-Y.; Lim, S.-Y.; Yoo, S.-H. The economic value of the national meteorological service in the Korean household sector: A contingent valuation study. Sustainability 2016, 8, 834. [Google Scholar] [CrossRef]
- Park, S.-Y.; Yoo, S.-H.; Kwak, S.-J. The conservation value of Shinan Tidal Flat in Korea: A contingent valuation study. Int. J. Sustain. Dev. World Ecol. 2013, 20, 54–62. [Google Scholar] [CrossRef]
- Cameron, T.A.; James, M.D. Efficient estimation methods for ‘closed-ended’ contingent valuation surveys. Rev. Econ. Stat. 1987, 69, 269–276. [Google Scholar] [CrossRef]
- Cameron, T.A. A new paradigm for valuing non-market goods using referendum data: Maximum likelihood estimation by censored logistic regression. J. Environ. Manag. 1988, 15, 355–379. [Google Scholar] [CrossRef]
- Kriström, B. Spike models in contingent valuation. Am. J. Agric. Econ. 1997, 79, 1013–1023. [Google Scholar] [CrossRef]
- Yoo, S.-H.; Kwak, S.-Y. Willingness to pay for green electricity in Korea. Energy Policy 2009, 37, 5408–5416. [Google Scholar] [CrossRef]
- Kim, H.-Y.; Park, S.-Y.; Yoo, S.-H. Public acceptability of introducing a biogas mandate in Korea: A contingent valuation study. Sustainability 2016, 8, 1087. [Google Scholar] [CrossRef]
- Kwak, S.-Y.; Yoo, S.-H. The public’s value for developing ocean energy technology in the Republic of Korea: A contingent valuation study. Renew. Sustain. Energy Rev. 2015, 43, 432–439. [Google Scholar] [CrossRef]
- Krinsky, I.; Robb, A.L. On approximating the statistical properties of elasticities. Rev. Econ. Stat. 1986, 68, 715–719. [Google Scholar] [CrossRef]
- Statistics Korea. Available online: http://kosis.kr (accessed on 1 October 2015).
Figure 1.
Distribution function of the willingness to pay.

Table 1.
A summary of some previous studies dealing with the economic benefits of protecting endangered species using the stated preference method.
Table 1.
A summary of some previous studies dealing with the economic benefits of protecting endangered species using the stated preference method.
| Countries | Sources | Objects to Be Valued | Method a | Mean WTP Estimates |
|---|---|---|---|---|
| United States | Giraud et al. [17] | Steller sea lion | CV | - USD 61.13 per household per year for protection program |
| United States | Lew et al. [18] | Steller sea lions | CE | - USD 204 per household per year is the finite limit amount for additional Steller sea lion protection |
| United States | Wallmo and Lew [11] | Hawaiian monk seal | CE | - USD 68.12 per household per year for improving from endangered to recovered status |
| Canada | Boxall et al. [19] | Beluga whale, Harbor seal, Blue whale | CV + CE | - USD 77 to 229 per year per household for marine mammal recovery programs in St. Lawrence Estuary |
| Greece | Stithou and Scarpa [20] | Seal | CV | - EUR 20.94 for marine biodiversity under landing fee |
| Greece | Kontogianni et al. [21] | Monk seal | CV | - EUR 87.1 per household with water bill |
| South Korea | Kim et al. [5] | Spotted seal | CV | - KRW 25,692 under donation in the general population sample - KRW 47,680 under donation in the sample residents |
| England | Bosetti and Pearce [6] | Cornish grey seal | CV | - GBP 8 to 9 per person for recreational use of seals |
| United States | Wallmo and Lew [22] | Humpback whale and Southern resident killer whale | CE | - USD 60.98 per household per year for recovering Humpback whale - USD 84.38 per household per year for recovering southern resident killer whale |
Note: a CV and CE are denoted as contingent valuation and choice experiment, respectively.
Table 2.
Estimation results of the spike models.
| Variables | Coefficient Estimates from One-and-One-Half-Bounded Model d | Coefficient Estimates from Single-Bounded Model |
|---|---|---|
| Constant | 0.1756 (0.0638) ** | 0.1814 (0.0639) ** |
| Bid amount a | −0.1594 (0.0078) ** | −0.1273 (0.0080) ** |
| Spike | 0.4562 (0.0158) ** | 0.4548 (0.0159) ** |
| Household mean WTPs per year | KRW 4923 (USD 4.86) ** | KRW 6188 (USD 6.11) ** |
| Standard errors | 255 | 389 |
| 95% confidence intervals b | KRW 4447 to 5450 (USD 4.39 to 5.39) | KRW 5503 to 7055 (USD 5.44 to 6.97) |
| 99% confidence intervals b | KRW 4316 to 5635 (USD 4.26 to 5.57) | KRW 5324 to 7385 (USD 5.26 to 7.30) |
| Number of observations | 1000 | 1000 |
| Log-likelihoods | −1290.46 | −1033.29 |
| Wald statistics c (p-values) | 450.18 (0.000) ** | 262.13 (0.000) ** |
Notes: a The unit is Korean won; At the time of the survey, USD 1.0 was approximately equal to KRW 1012; b The confidence intervals are calculated by the use of the Monte Carlo simulation technique of Krinsky and Robb [47] with 5000 replications; c The null hypothesis is that all the parameters are jointly zero, and the corresponding p-value is reported in the parentheses beside the statistic; d The numbers in parentheses beside the coefficient estimates are standard errors; The symbols ** indicates statistical significance at the 1% level.
Table 3.
Kaplan-Meier-Turnbull non-parametric estimate of mean willingness to pay (WTP).
| Bid () a | Sample Size () | “Yes” Votes () | “Yes” Probability () | Adjusted “Yes” Probability | a |
|---|---|---|---|---|---|
| 1000 | 72 | 46 | 0.6389 | 0.6389 | 174 |
| 2000 | 71 | 33 | 0.4648 | 0.4648 | 56 |
| 3000 | 142 | 62 | 0.4366 | 0.4366 | 156 |
| 4000 | 144 | 48 | 0.3333 | 0.3846 | 112 |
| 6000 | 143 | 51 | 0.3566 | 0.3566 | 407 |
| 8000 | 142 | 41 | 0.2887 | 0.2887 | 184 |
| 10,000 | 143 | 38 | 0.2657 | 0.2657 | 263 |
| 12,000 | 71 | 17 | 0.2394 | 0.2394 | 540 |
| 15,000 | 72 | 14 | 0.1944 | 0.1944 | 2917 |
| Totals | 1000 | 350 | 4809 |
Notes: a The unit is Korean won; At the time of the survey, USD 1.0 was approximately equal to KRW 1012.
Table 4.
Definitions and sample statistics of the variables.
| Variables | Definitions | Mean | Standard Deviation |
|---|---|---|---|
| Knowledge | Dummy for prior recognition of information about marine endangered species before the survey (0 = do not know; 1 = know well) | 0.54 | 0.50 |
| Need | Dummy for the respondent thinking that programs for protecting the endangered species are needed (0 = disagree; 1 = agree) | 0.80 | 0.40 |
| Income | Monthly household income before taxes (unit: KRW 1 million = USD 988) | 4.15 | 2.01 |
| Education | The respondent’s education level in years | 13.98 | 2.31 |
Table 5.
Correlation matrix of the variables.
| Knowledge | Need | Income | Education | |
|---|---|---|---|---|
| Knowledge | 1.000 | |||
| Need | 0.283 | 1.000 | ||
| Income | 0.006 | 0.067 | 1.000 | |
| Education | −0.002 | 0.051 | 0.245 | 1.000 |
Table 6.
Estimation results of the spike model with covariates.
| Variables a | Coefficient Estimates | Standard Errors |
|---|---|---|
| Constant | −2.2211 ** | 0.4259 |
| Bid amount b | −0.1811 ** | 0.0089 |
| Knowledge | −0.2561 * | 0.1287 |
| Need | 2.5061 ** | 0.2256 |
| Income | 0.1273 ** | 0.0313 |
| Education | −0.0028 | 0.0277 |
| Spike | 0.4691 | 0.0177 |
| Household mean WTPs per year | 4180 ** | 235 |
| Number of observations | 1000 | |
| Log-likelihood | −1183.14 | |
| Wald statistic c (p-value) | 466.40 (0.000) ** | |
Notes: a The variables are defined in Table 4; b The unit is Korean won; At the time of the survey, USD 1.0 was approximately equal to KRW 1012; c The null hypothesis is that all the parameter estimates are jointly zero and the corresponding p-value is reported in the parentheses beside the statistic; The symbols * and ** indicate statistical significance at the 5%, and 1% levels, respectively.
© 2017 by the authors. Licensee MDPI, Basel, Switzerland. This article is an open access article distributed under the terms and conditions of the Creative Commons Attribution (CC BY) license (http://creativecommons.org/licenses/by/4.0/).
Share and Cite
MDPI and ACS Style
Lim, S.-Y.; Jin, S.-J.; Yoo, S.-H. The Economic Benefits of the Dokdo Seals Restoration Project in Korea: A Contingent Valuation Study. Sustainability 2017, 9, 968. https://doi.org/10.3390/su9060968
AMA Style
Lim S-Y, Jin S-J, Yoo S-H. The Economic Benefits of the Dokdo Seals Restoration Project in Korea: A Contingent Valuation Study. Sustainability. 2017; 9(6):968. https://doi.org/10.3390/su9060968
Chicago/Turabian StyleLim, Seul-Ye, Se-Jun Jin, and Seung-Hoon Yoo. 2017. "The Economic Benefits of the Dokdo Seals Restoration Project in Korea: A Contingent Valuation Study" Sustainability 9, no. 6: 968. https://doi.org/10.3390/su9060968
Note that from the first issue of 2016, this journal uses article numbers instead of page numbers. See further details here.