Article

A Novel Study of Waveguide Propagation Rules of Coal Rock AE Signal: Effects of Waveguide Size and Installation Method on the Propagation Rules of Coal Rock AE Signal

1
School of Energy Engineering, Xi’an University of Science and Technology, Xi’an 710054, China
2
Key Laboratory of Western Mine Exploitation and Hazard Prevention of the Ministry of Education, Xi’an 710054, China
3
China Coal Technology Engineering Group Chongqing Research Institute, Chongqing 400037, China
4
National Key Laboratory of Gas Disaster Monitoring, Preventing and Emergency Controlling, Chongqing 400037, China
*
Author to whom correspondence should be addressed.
Sustainability 2017, 9(7), 1209; https://doi.org/10.3390/su9071209
Submission received: 13 June 2017 / Revised: 26 June 2017 / Accepted: 29 June 2017 / Published: 10 July 2017
(This article belongs to the Special Issue Energy Security and Sustainability)

Abstract

:
The propagation of acoustic emission (AE) signal in waveguide is quite important for AE-based prediction of dynamic disasters in coal rocks. In this study, based on some relevant theories in wave mechanics, the elastic mechanical model of one-dimensional (1D) waveguide was firstly established, and the relationship between AE source signal and the signal at the waveguide’s receiving end was derived. On the basis of theoretical analysis, numerical simulation and laboratory test schemes were designed; additionally, using the standard vibration source method, AE response in different sizes of waveguides were investigated, the effects of waveguide size of waveguide were concluded, and the application conditions of the established theoretical model were clarified. Numerical simulation results fit well with the laboratory test results. Meanwhile, the effects of the sensor’s installation method on the propagation rules of AE signal were examined and appropriate installation method was determined.

1. Introduction

Acoustic emission (AE) techniques began at the beginning of the 20th century. Currently, the AE technique from coal rocks gradually serve as an effective forecasting and early warning method in various countries all over the world for ensuring safety in underground engineering and mining production. In the 1920s, Polish researchers applied the AE signal to monitor dynamic disasters in mines; in 1936, Zuoshan, a Japanese scholar, proposed using acoustic emission to forecast gas outbursts and rockbursts; in the 1940s, the United States Bureau of Mines began to forecast rockbursts in mines using the AE method; in the 1970s, Australian researchers started to apply the AE technique in monitoring mine dynamic disasters; meanwhile, South African researches used the AE technique for monitoring rockbursts in metal mines [1,2,3,4,5].
Chinese scholars have used the AE technique for the prediction and early warning of gas dynamic disasters in coal rocks for more than three decades, and have made great progress in monitoring devices, monitoring technology and disaster identification method. China’s main related research units, including Coal Science Research Institute [6,7,8,9,10,11,12,13], Chongqing Institute [14,15,16,17,18,19,20,21,22,23,24,25], Mine Tremor or Microseismic Monitoring Research Center, University of Science and Technology of Beijing [26,27,28,29,30,31], China University of Mining and Technology [32,33,34,35,36,37,38], Dalian University of Technology and Northeastern University [39,40,41,42,43] have conducted a great deal of research on the AE signal’s generation mechanism, propagation rules, de-noising methods, the sensor’s implementation technology and the identification of disaster evolution processes, and have gained fruitful achievements. However, the size of waveguide devices and the related installation technology have been poorly investigated. Previous studies have laid the emphasis on early warning technology and the related instruments and equipment, and the laboratory studies have mainly focused on the AE characteristics of coal rocks under uniaxial loading. Thus, the waveguide devices were generally designed and implemented by experience, which directly affected the receiving effects of AE signals and the reliability of AE signal retrieval and hindered the large-scale population of AE-based forecasting technique. In this study, based on the related theories in wave mechanics, the elastic theory model of one-dimensional (1D) waveguide was established, and the variations of AE signal’s displacement, velocity and acceleration with propagation distance were concluded; further, on the basis of the established model, the effects of the size and implementation technology of waveguide on the propagation of AE signal were elaborated on by means of laboratory test, numerical simulations and field investigation.

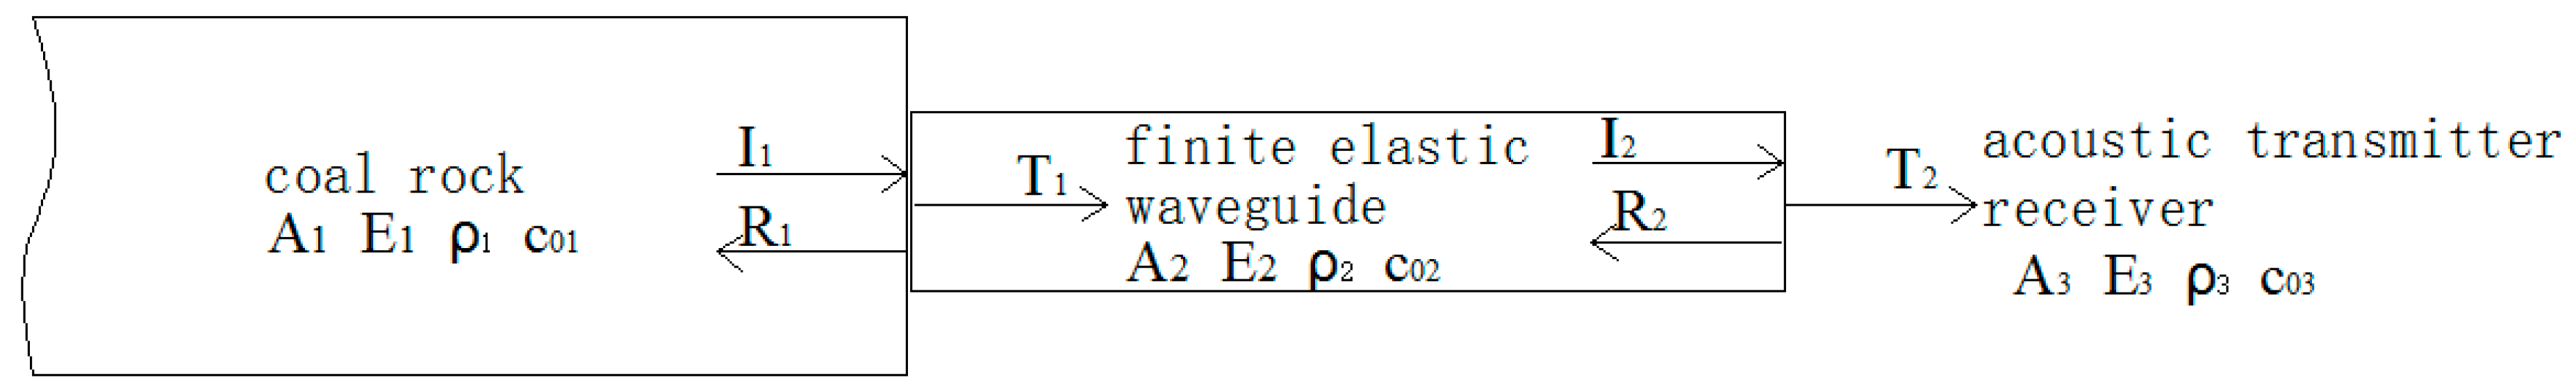
2. Theoretical Basis of AE Propagation of 1D Elastic Waveguide

According to the field implementation of waveguide device in AE system and the wavelength of the AE signal, some assumptions were made based on the relevant theories in wave mechanics [44,45] and thus, a simplified mechanical model of 1D waveguide was derived, as shown in Figure 1.
The following assumptions were then made: (1) the waveguide is an 1D elastic device; (2) the waveguide’s plane section, which had been selected before deformation, was always a plane during the deformation; (3) except the axial stress σ that is uniformly distributed along the cross section, the other components of stress equal to zero; (4) the propagation direction of the stress wave is parallel to the axial direction and perpendicular to the interface during the propagation from self-infinite waveguide to finite waveguide; (5) the waveguide’s body force is not taken into account.
The dynamic equilibrium equation of the 1D waveguide can be written as:
σ ( x , t ) x + X = ρ 2 u t 2
where X denotes the waveguide’s along the axial direction, u denotes the waveguide’s axial displacement and ρ denotes the waveguide material’s density.
According to Hooke’s Law, the following expression can be acquired:
σ = E ε = E u x
where E denotes the material’s Young’s modulus and ε denotes the waveguide’s axial strain.
Based on Equations (1) and (2), we can derive that:
c o 2 2 u ( x , t ) x 2 = 2 u t 2 1 ρ X   ( c o = E ρ )
where C 0 is generally referred to as the waveguide’s wave velocity. When the waveguide’s body force is not taken into account, Equation (3) can then be rewritten as:
c o 2 2 u ( x , t ) x 2 = 2 u t 2
Equation (4) is applicable to the waves with long wavelengths, i.e., the wavelengths exceed the waveguide’s diameter. The waves with long wavelengths apply to the waveguide devices with arbitrary shapes of cross-sections. Similarly, the wave’s strain, stress and velocity can also be written in the form of Equation (4).
The initial-value problems of infinite waveguide can be described as:
c o 2 2 u ( x , t ) x 2 = 2 u t 2 u ( x , 0 ) = φ ( x ) u ( x , 0 ) t = φ 1 ( x ) } ( < x < t 0 )
The solution is:
u = F ( x c 0 t ) + G ( x + c 0 t )
where F and G are determined by the initial conditions and can be written as:
F ( x ) = 1 2 φ ( x ) 1 2 c 0 a x φ 1 ( ξ ) d ξ G ( x ) = 1 2 φ ( x ) + 1 2 c 0 a x φ 1 ( ξ ) d ξ }
where a denotes arbitrary a constant. By substituting Equation (7) into Equation (6), the following expression can be acquired:
u ( x , t ) = 1 2 { φ ( x c 0 t ) + φ ( x + c 0 t ) } + 1 2 c 0 x c 0 t x + c 0 t φ 1 ( ξ ) d ξ
By taking the reflection and transmission at the waveguide’s interface into account, the continuity condition at the interface can be written as:
Displacement:
u 1 = u 2 , u I + u R = u T
Velocity:
v 1 = v 2 , v I + v R = v T
Axial force:
N 1 = N 2 , N I + N R = N T
where N denotes the axial force in the waveguide.
If the incident right traveling wave can be written as:
u I = F I ( x c 0 t ) = F I ( ξ )
where c 01 = E 1 ρ 1 and ξ = x c 01 t . Then, we take the partial derivatives of u I with respect to x and t :
u I x = d F I d ξ u I t = c 01 d F I d ξ }
According to Equation (13), the following expression can be derived:
u I t = c 01 u I x
Similarly, for reflection wave and transmitted wave, the following expressions can be acquired:
u R t = c 01 u R x
u T t = c 02 u T x
By substituting Equations (14)–(16) into the velocity continuity condition Equation (10), the following expression can be acquired ( v = u t ):
c 01 u I x + c 01 u R x = c 02 u T x
Since u x = ε = σ E = N A E , Equation (17) can be rewritten as:
c 01 N I A 1 E 1 + c 01 N R A 1 E 1 = c 02 N T A 2 E 2
According to Equation (18), the following expression can be acquired:
N T = α ( N I N R )
where α = c 01 A 2 E 2 c 02 A 1 E 1 = c 02 A 2 ρ 2 c 01 A 1 ρ 1 .
According to Equations (11) and (19), the following expression (i.e., the stress’ reflection coefficient and transmission coefficient) can be acquired:
N R N I = α 1 α + 1 N T N I = 2 α α + 1 }
Based on the expressions of displacement, strain and stress, the displacement’s reflection coefficient and transmission coefficient can be written as:
λ R = u R u I = α 1 α + 1 λ T = u T u I = 2 α + 1 }
According to Equation (21), the stress wave’s displacement at the interface between coal rock and finite elastic waveguide can be written as: u T 1 = λ T 1 u I 1 , and the stress wave’s displacement at the signal receiving end can be written as: u I 2 = u T 1 . The finite waveguide’s signal receiving end can be regarded as the free end; accordingly, at the receiving end, A 3 E 3 c 03 < < A 2 E 2 c 02 , which corresponds to the condition when a 0 . According to Equation (21), λ R 2 = 1 , λ T 2 = 2 , and the following expressions can be derived:
u r = 2 λ T 1 u s v r = u r t = 2 λ T 1 v s a r = 2 u r t 2 = 2 λ T 1 a s }
where u r , v r , a r denotes the signal’s displacement, velocity and acceleration at the AE waveguide’s receiving end, respectively; u s , v s , a s enotes the AE signal’s displacement, velocity and acceleration at the AE waveguide’s source end, respectively; λ T 1 denotes the AE signal’s transmission coefficient in coal rock.
Equation (22) describes the displacement, velocity and acceleration of the stress wave that firstly arrived at the finite waveguide’s receiving end; then, multiple transmissions and reflections would lead to the attenuation of AE stress wave; finally, the sensor would receive no stress signal. According to 1D elastic waveguide’s mechanism model, the relationships of displacement, velocity and acceleration between AE signal’s receiving end and source end were derived, as shown in Equation (22). Equation (22) is applicable to the condition with no attenuation in the propagation of AE signal; actually, AE signal undergoes attenuation during the propagation in the waveguide. Next, the waveguide’s appropriate size was determined through numerical simulation and laboratory test, i.e., the application condition of Equation (22).

3. Numerical Simulations on the Effects of the Waveguide’s Size on AE Signal’s Propagation

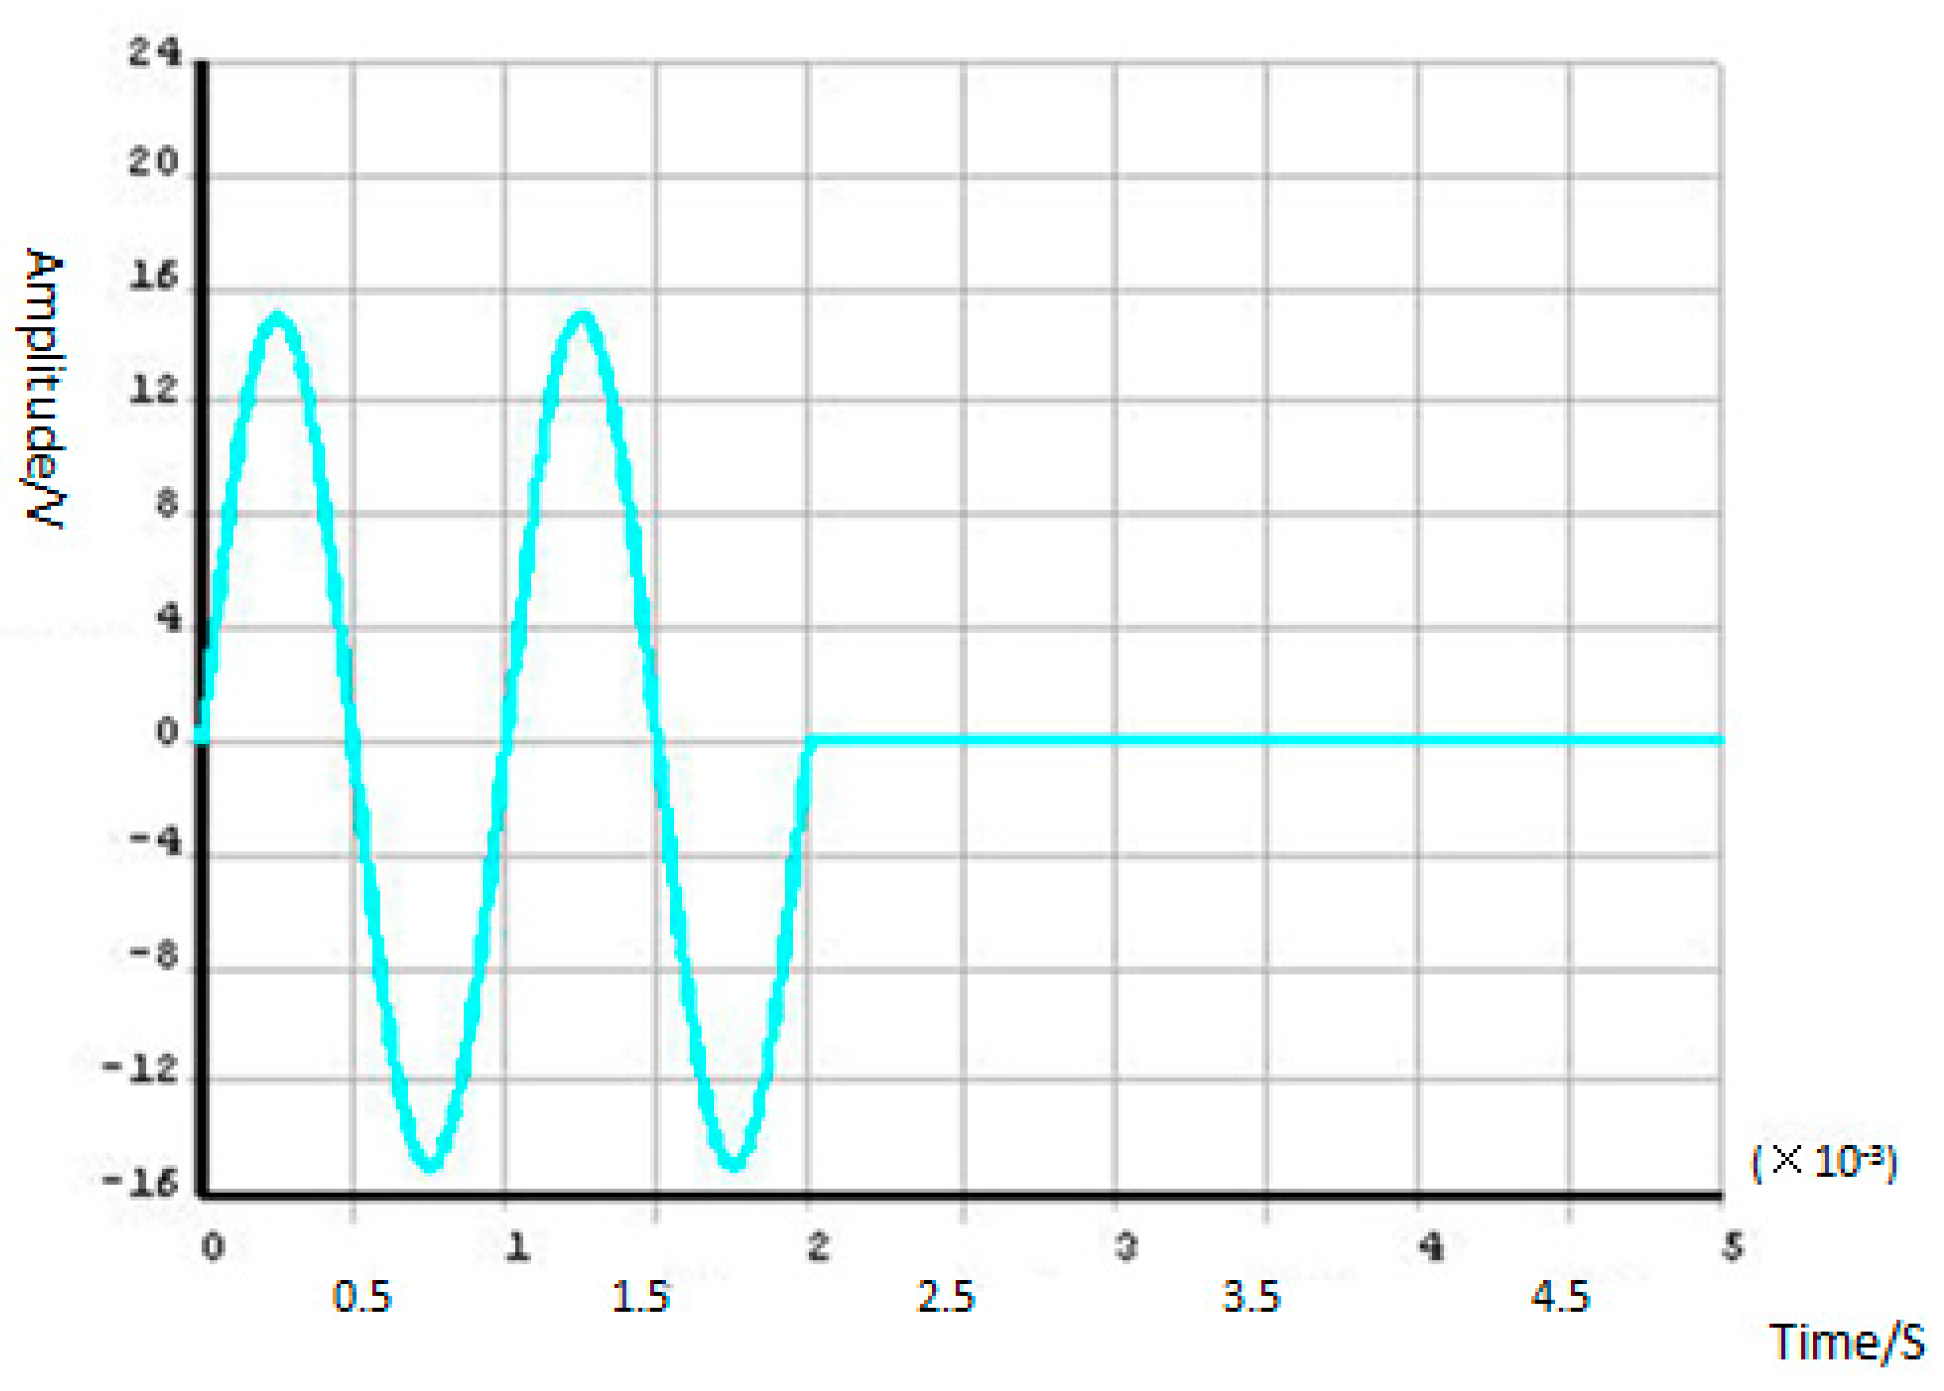
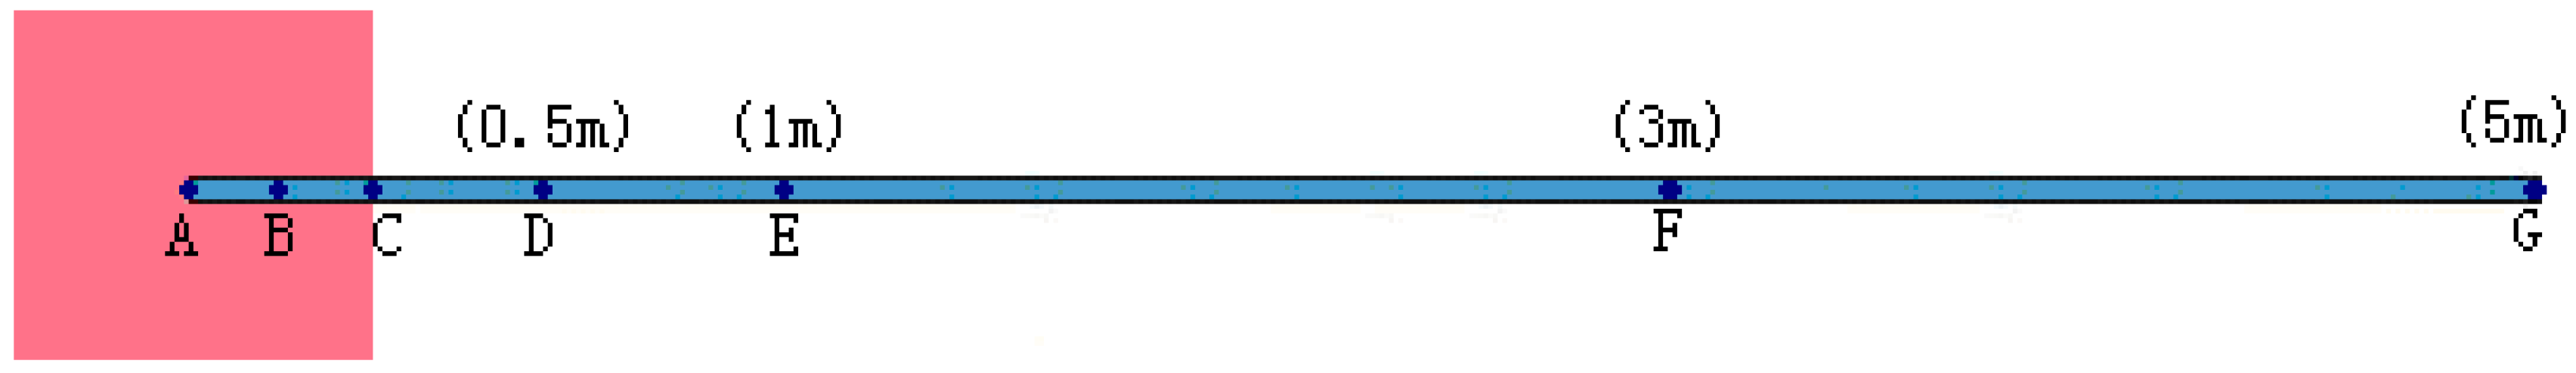
3.1. Establishment of Numerical Model and the Setting of Mechanical Parameters

In this study, the propagation rules of AE signals in the waveguide was simulated using large-scale dynamic finite element software ANSYS/LS-DYNA. AE signals were sine acceleration waves, as shown in Figure 2.
Figure 3 shows the established model, from which we can observe that the end of the waveguide was fixed at 25 cm away from the left boundary of the rock and the other end was free. Linear elastic model was used, and the material parameters are listed in Table 1.
In order to examine the effects of the waveguide’s diameter and length on the AE signal’s propagation in the waveguide, the following two simulation schemes were used. According to the actual coal mining situation at the scene, the numerical test schemes are determined.
Scheme 1: Coal rock size: 60 cm × 60 cm × 60 cm; the waveguide’s length (L) was fixed at 0.3 m, while the waveguide’s diameter was set as 5 mm, 10 mm, 20 mm and 40 mm, respectively.
Scheme 2: Coal rock size: 60 cm × 60 cm × 60 cm; the waveguide’s diameter was fixed at 5 mm, while the waveguide’s length (L) was set as 0.5 m, 1 m, 3 m and 5 m, respectively.
Under these two conditions, the acceleration amplitude at each node on the waveguide was simulated.

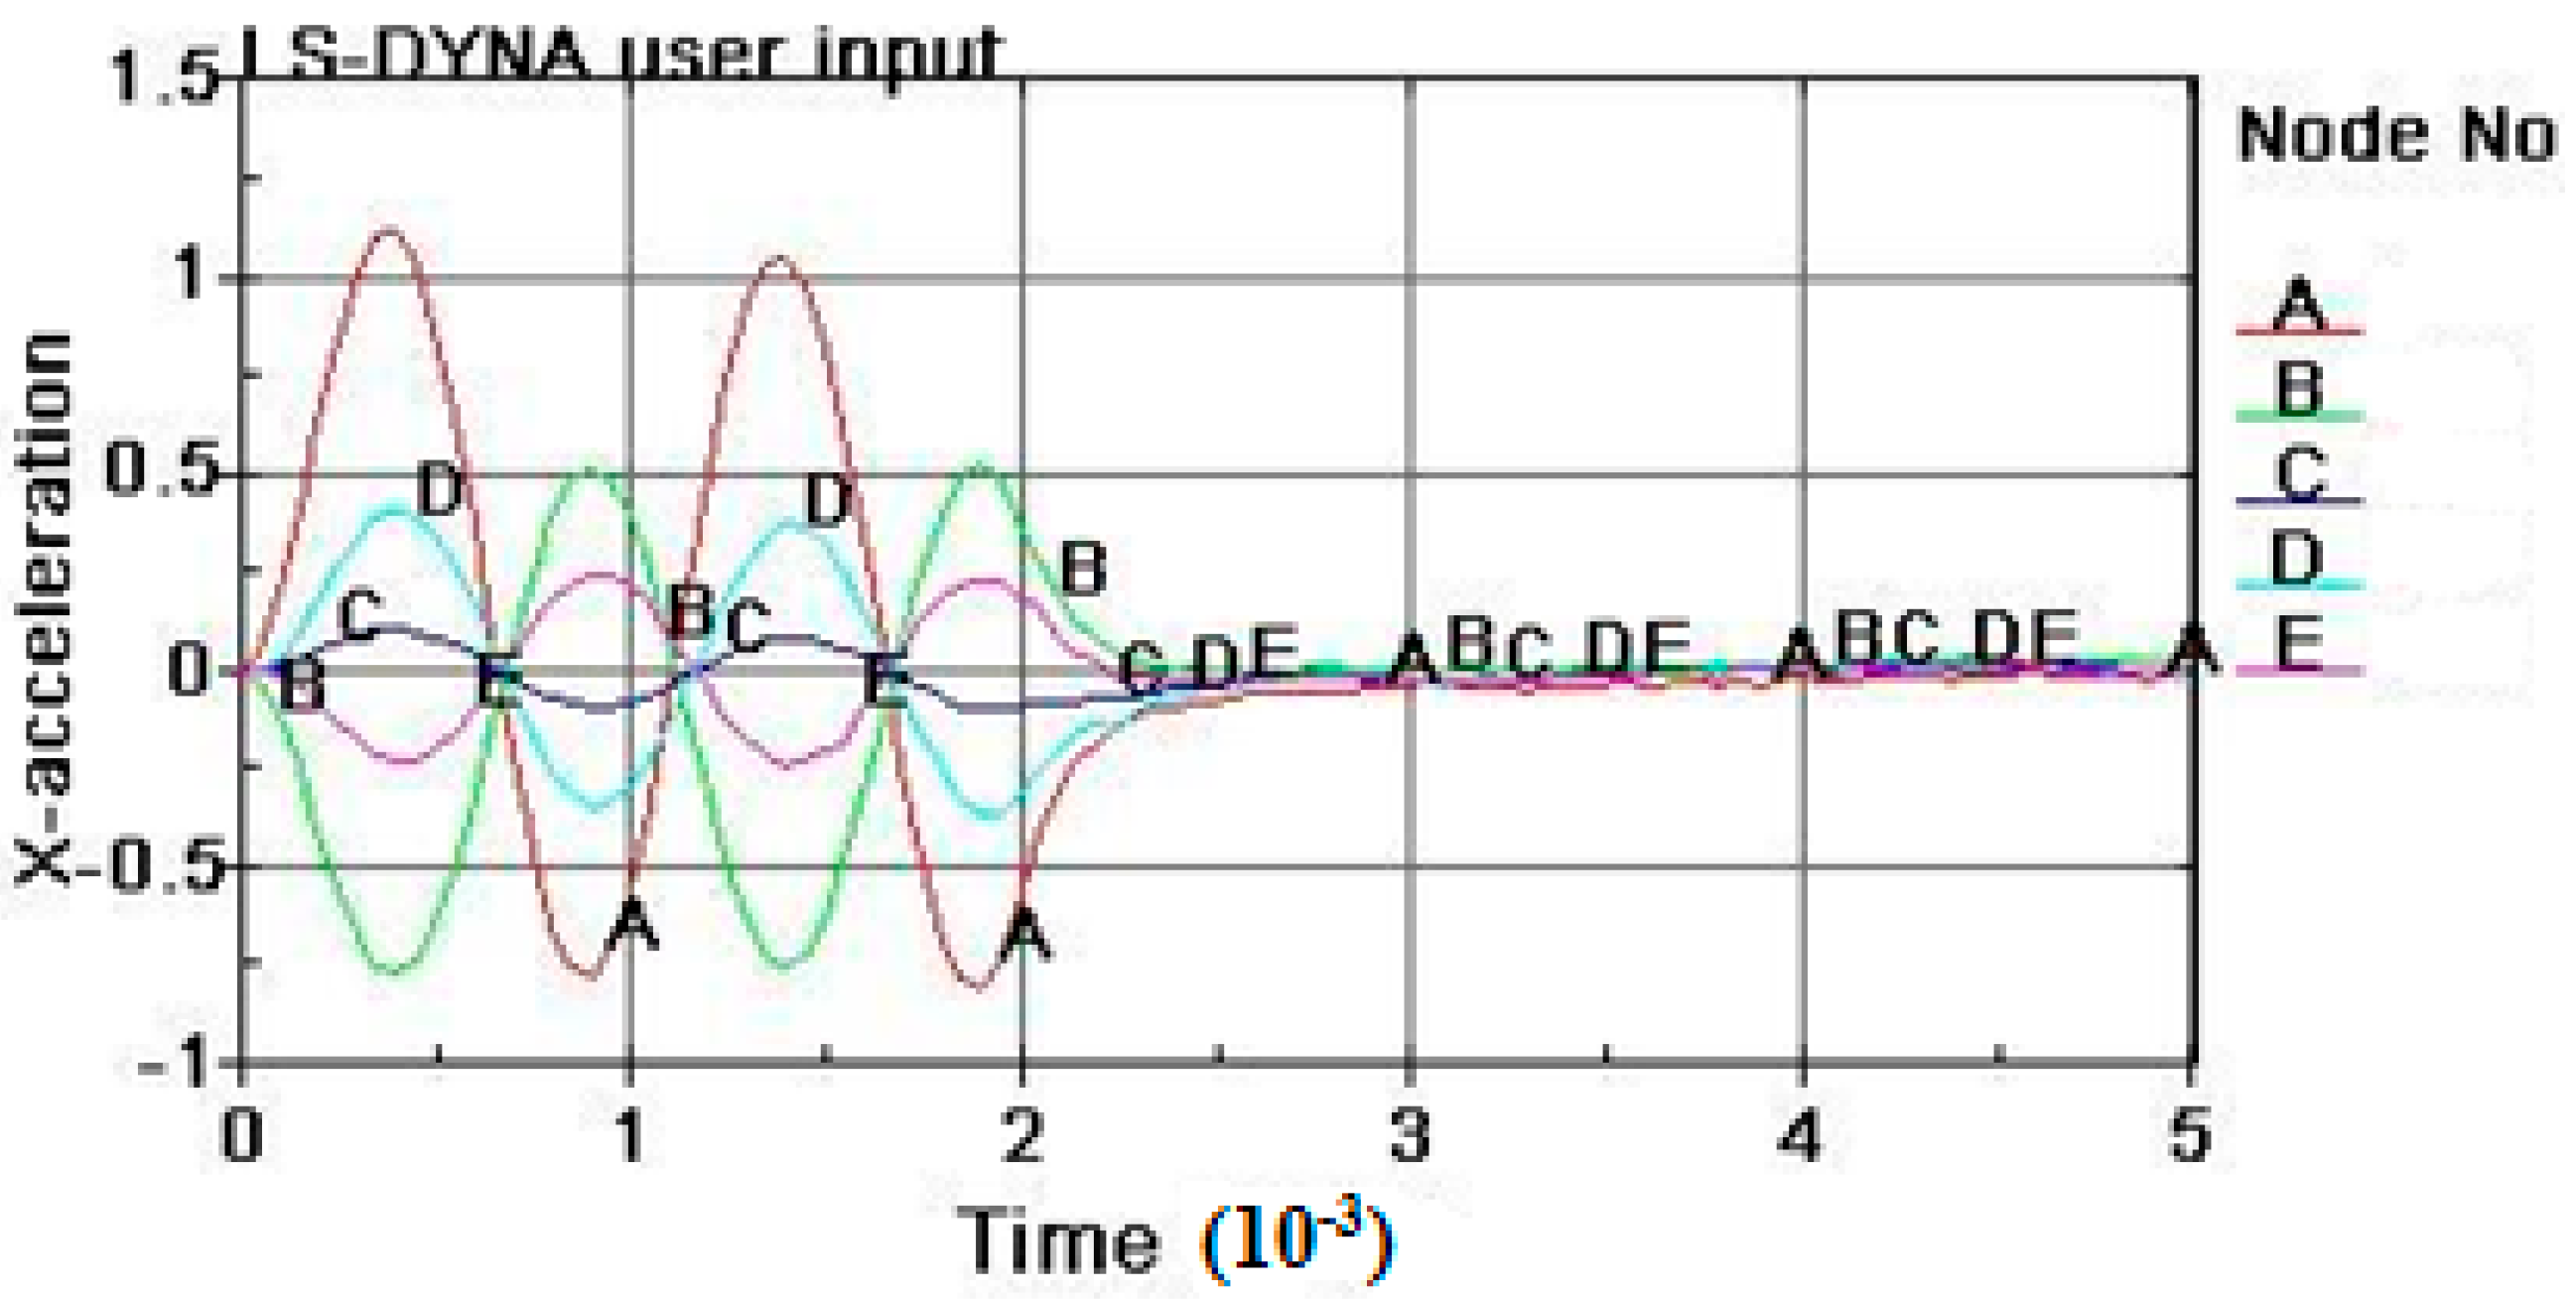
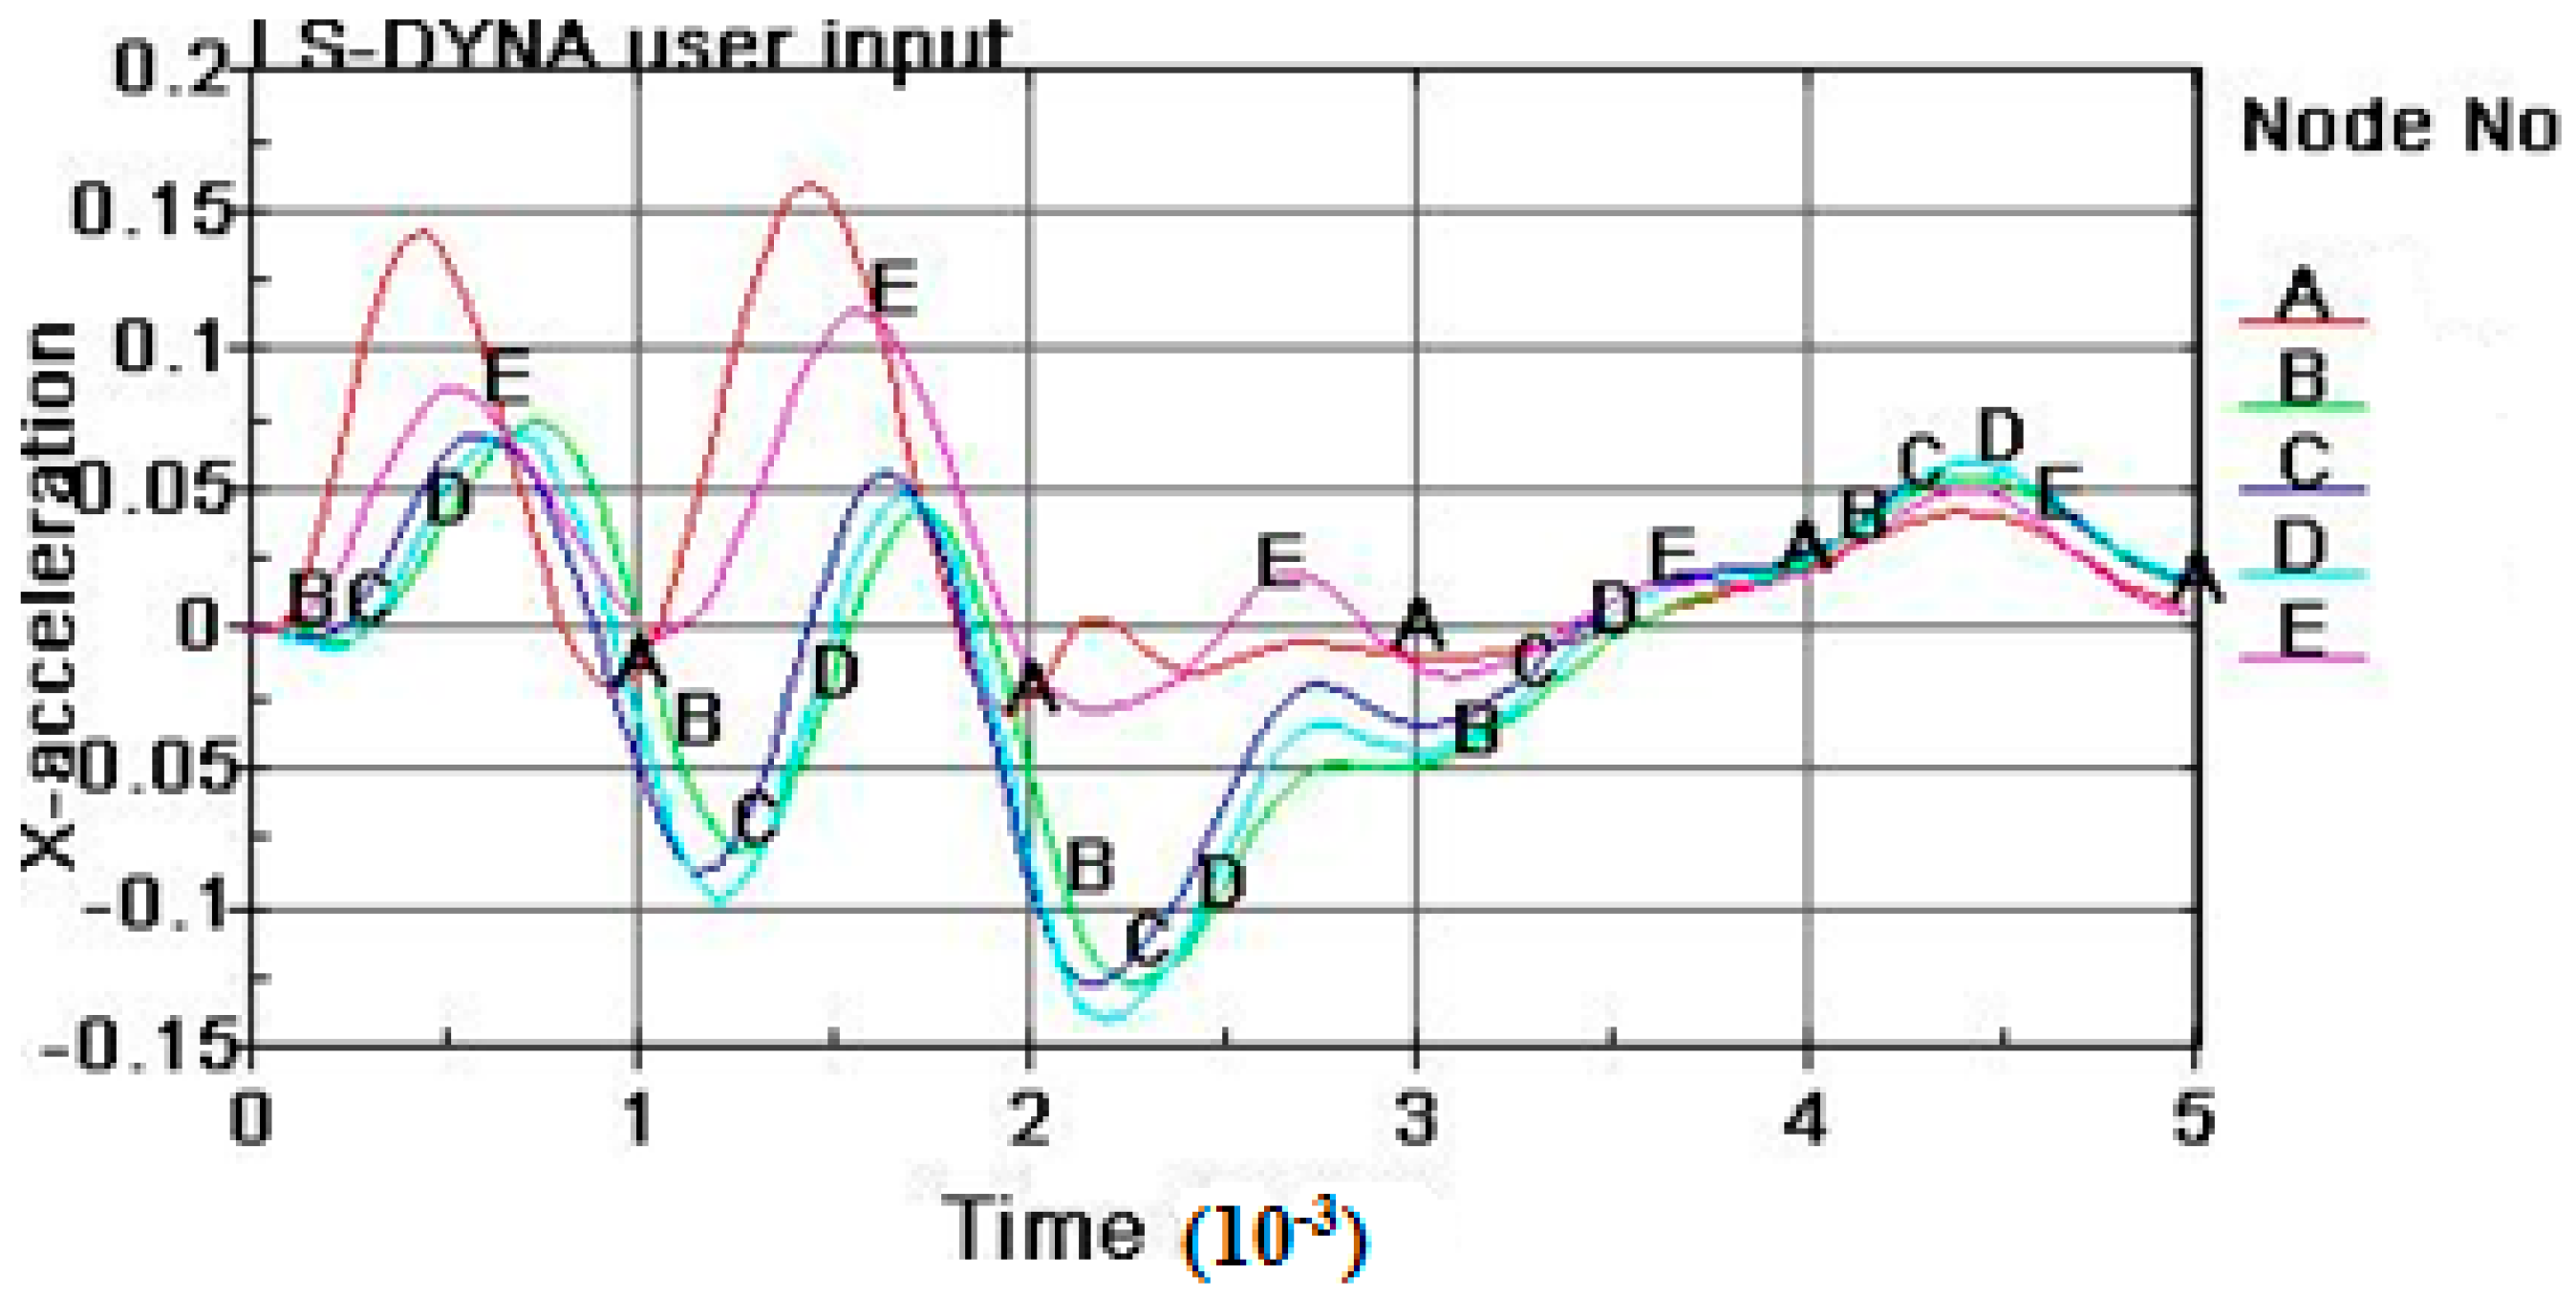
3.2. Analysis of the Results Using the First Simulation Scheme

Since the stress wave (the sine curve) was loaded along the waveguide’s axial direction, the variation of stress wave was greatest along the axial direction and somewhat smaller along the other directions. Thus, only the variation of the AE stress wave along the waveguide’s axial direction was taken into account in this study.
When L was fixed as 0.3 m and diameter was set as 5 mm, 10 mm, 20 mm and 40 mm, respectively, the acceleration data at five nodes (specifically, Node A, Node B, Node C and Node D, along the waveguide’s axial direction, and Node E, at the waveguide’s free end) were simulated, as shown in Figure 3.
Figure 4 shows the acceleration-time curves of different nodes when diameter = 5 mm. Due to only considering the source node (A) and the receiving node (E, waveguide acceleration sensor installation location), without considering the process nodes (B, C, D), therefore, only source node (A) and the receiving node (E) were compared. Figure 4 shows that the receiving node (E) acoustic emission signal acceleration amplitude (0.1122) attenuates approximately 90% relative to the source node (A) signal amplitude (1.1231). This is due to coal rock propagation loss when the diameter = 5 mm, and source node (A) has a relatively large response to the sine acceleration waves due to the smaller diameter waveguide. However, the receiving node (E) signal acceleration amplitude is close to that of the other diameter waveguide.
Figure 5 shows the acceleration–time curves of different nodes when diameter = 10 mm. Due to only considering the source node (A) and the receiving node (E, waveguide acceleration sensor installation location), without considering the process nodes (B, C, D), therefore, only source node (A) and the receiving node (E) were compared. Figure 5 shows that the receiving node (E) acoustic emission signal acceleration amplitude (0.1121) attenuates approximately 74% relative to source node (A) signal amplitude (0.4308). This is due to coal rock propagation loss when diameter = 10 mm, and source node (A) has a small response to the sine acceleration waves due to the larger diameter waveguide, but the receiving node (E) signal acceleration amplitude is close to that of the other diameter waveguide.
Figure 6 shows the acceleration–time curves of different nodes when diameter = 20 mm. Due to only considering the source node (A) and the receiving node (E, waveguide acceleration sensor installation location), without considering the process nodes (B, C, D), therefore, only source node (A) and the receiving node (E) were compared. Figure 6 shows that the receiving node (E) acoustic emission signal acceleration amplitude (0.1310) attenuates approximately 48% relative to the source node (A) signal amplitude (0.2507), which is due to coal rock propagation loss when diameter = 20 mm, and the source node (A) has a small response to the sine acceleration waves due to the larger diameter waveguide, but the receiving node (E) signal acceleration amplitude is close to that of the other diameter waveguide.
Figure 7 shows the acceleration–time curves of different nodes when diameter = 40 mm. Due to only considering the source node (A) and the receiving node (E, waveguide acceleration sensor installation location), without considering the process nodes (B, C, D), therefore, only source node (A) and the receiving node (E) were compared. Figure 7 shows that receiving node (E) acoustic emission signal acceleration amplitude (0.1113) attenuates approximately 40% relative to source node (A) signal amplitude (0.1855), due to coal rock propagation loss when diameter = 40 mm. Source node (A) has a smaller response to the sine acceleration waves due to the larger diameter waveguide, but the receiving node (E) signal acceleration amplitude is close to that of the other diameter waveguide.
Table 2 lists the maxima of the absolute values of the acceleration amplitudes at A, B, C, D and E when diameter was set as different values, which were then imported to EXCEL for data process, and are shown in Figure 8.
Figure 8 shows the variations of the maximum of the absolute values of the acceleration amplitudes at A, B, C, D and E when D was set as different values. It can be observed that, when the waveguide’s diameter remained unchanged and the smaller the waveguide’s diameter, the greater the maximum of the absolute value of the acceleration amplitude at Node A; the variations of the maximum of the absolute value of the acceleration amplitude at C, D and E were insensitive to the variation of the waveguide’s diameter. Accordingly, it can be concluded that the waveguide diameter imposed only a slight effect on the propagation of the AE signal within the range of 5~40 mm.

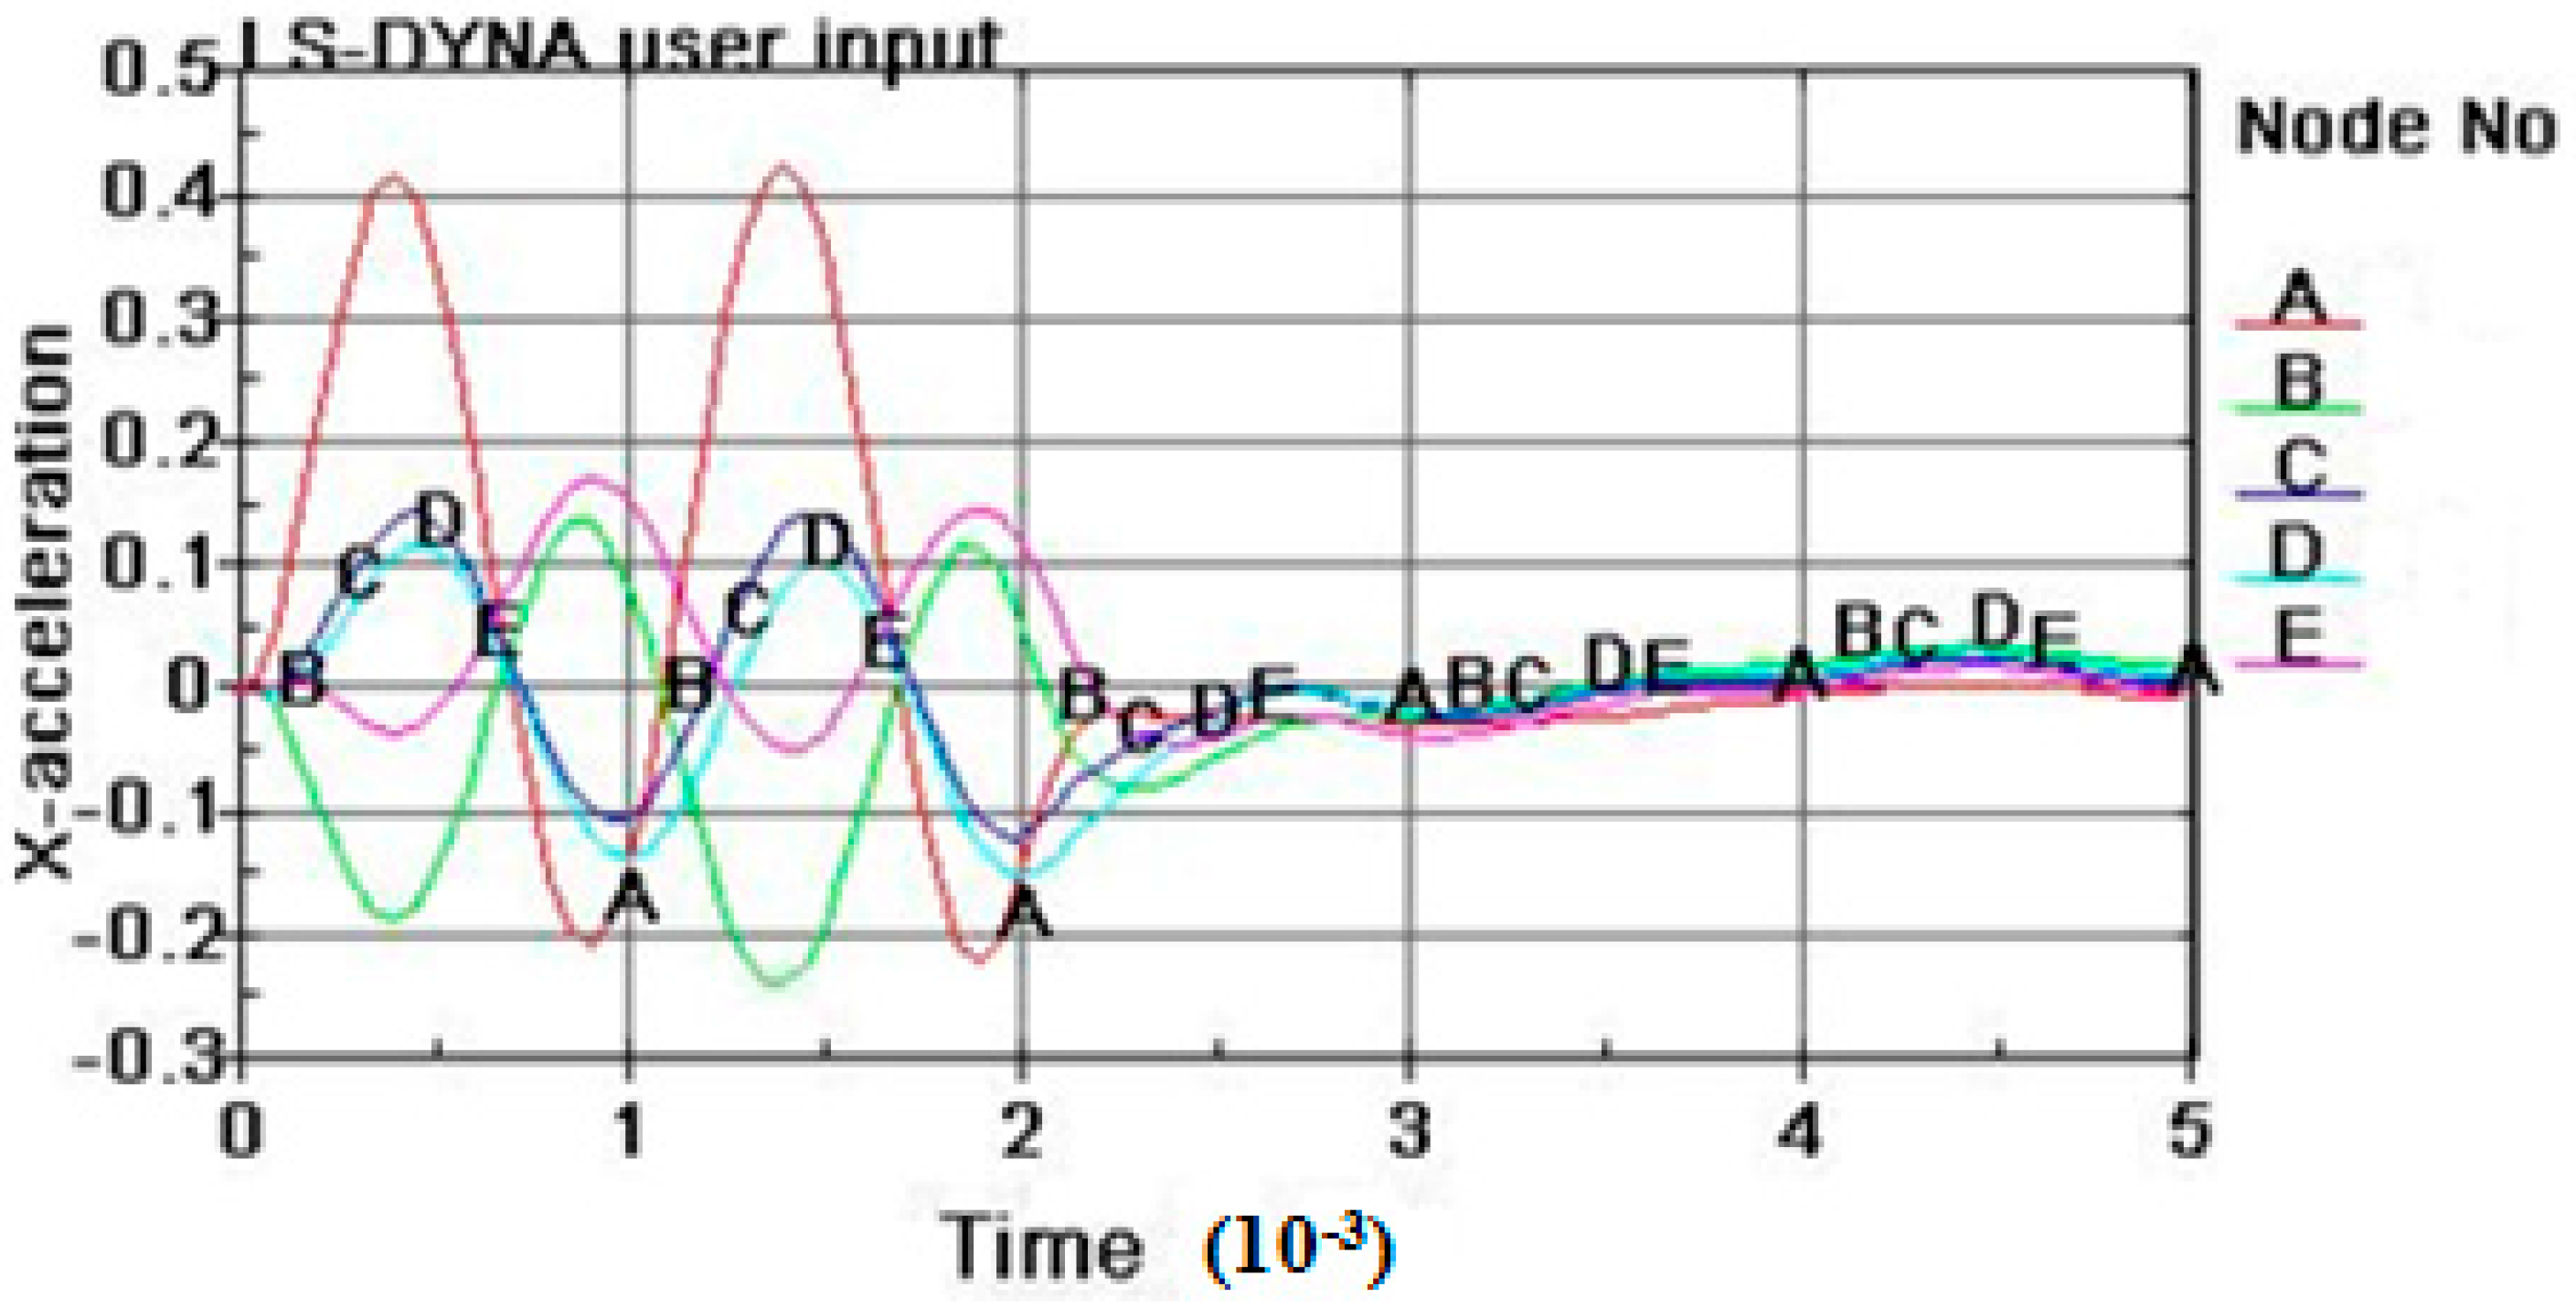
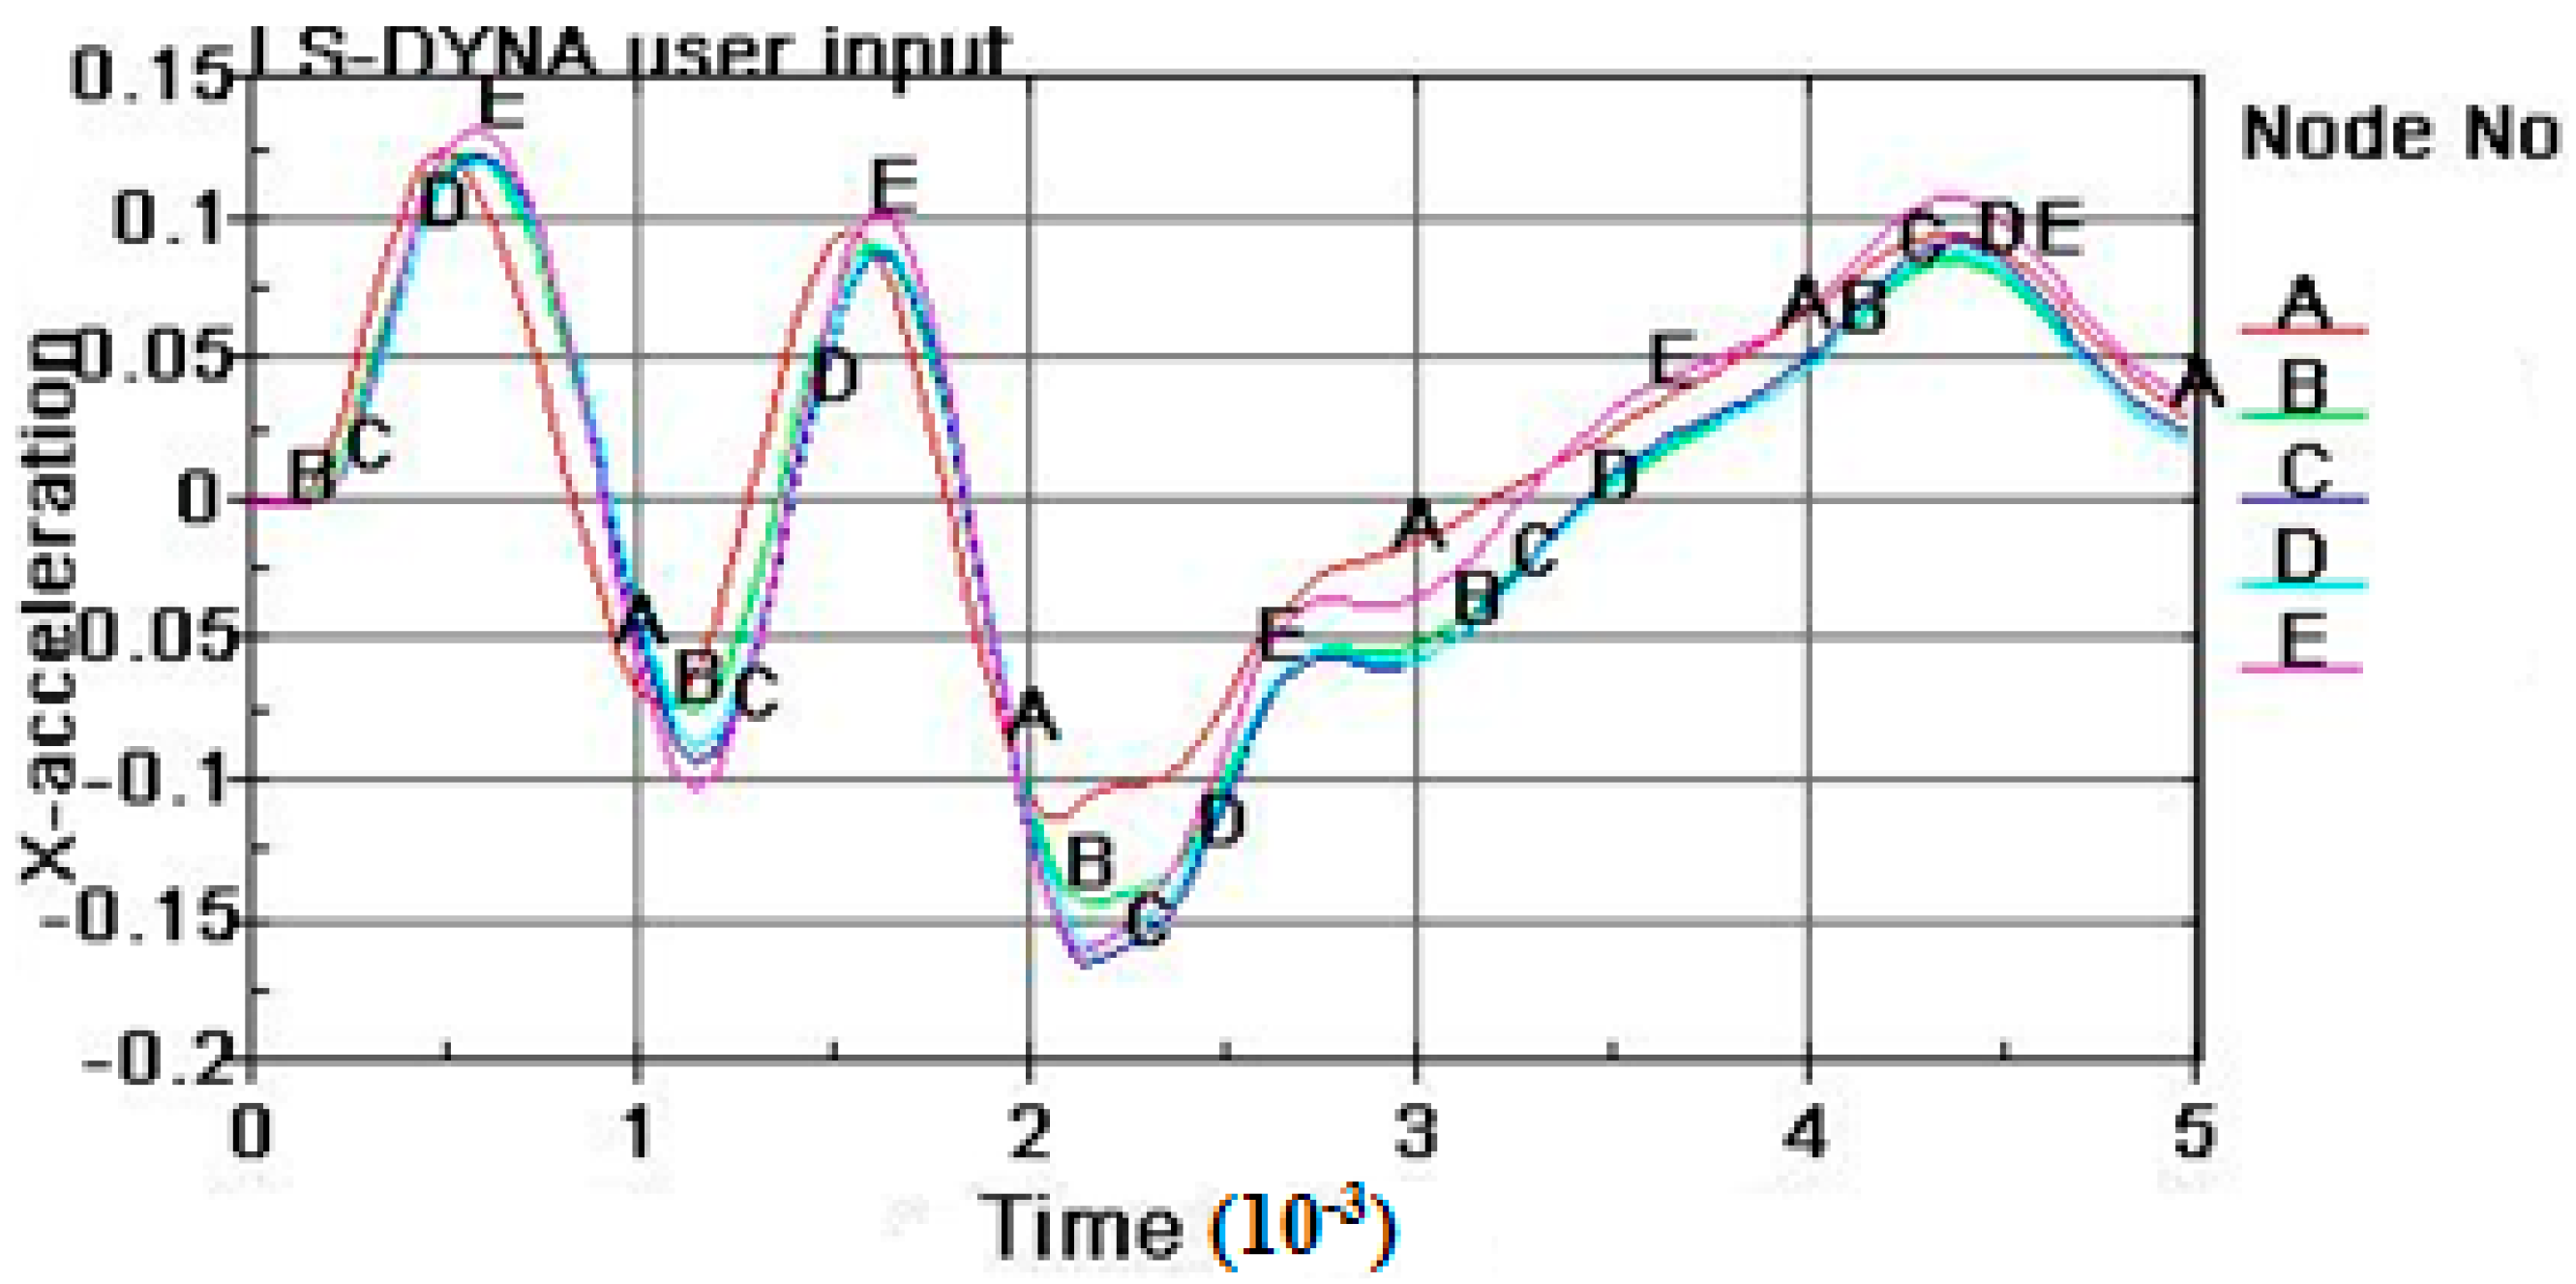
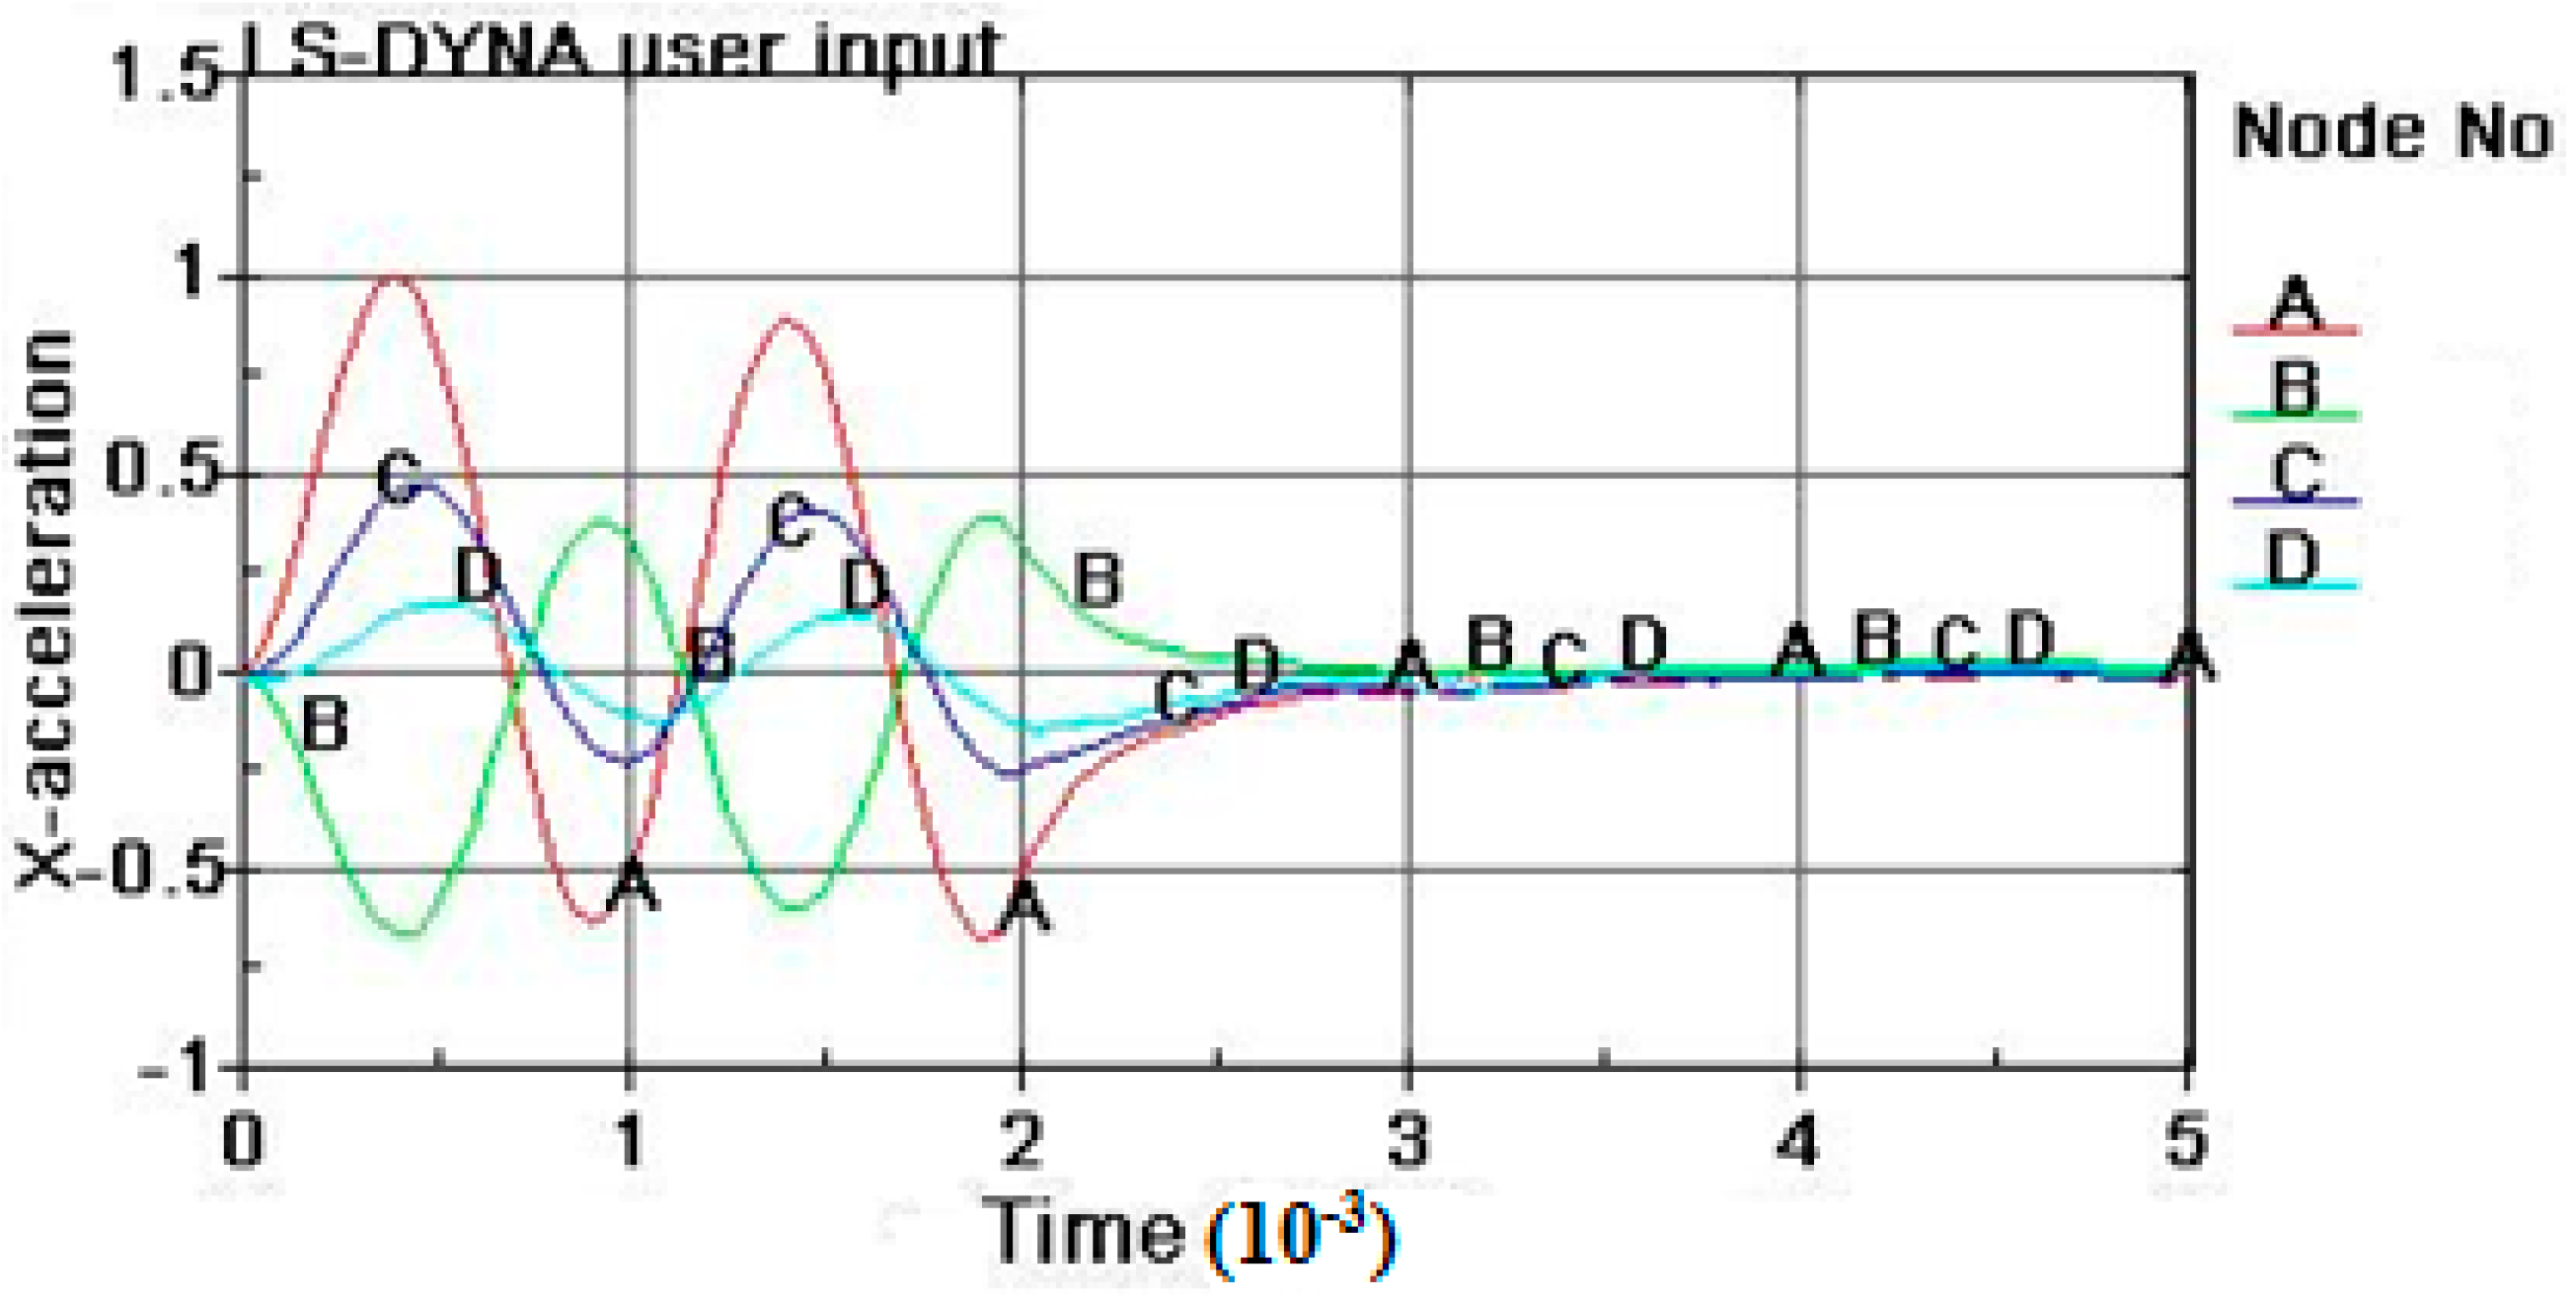
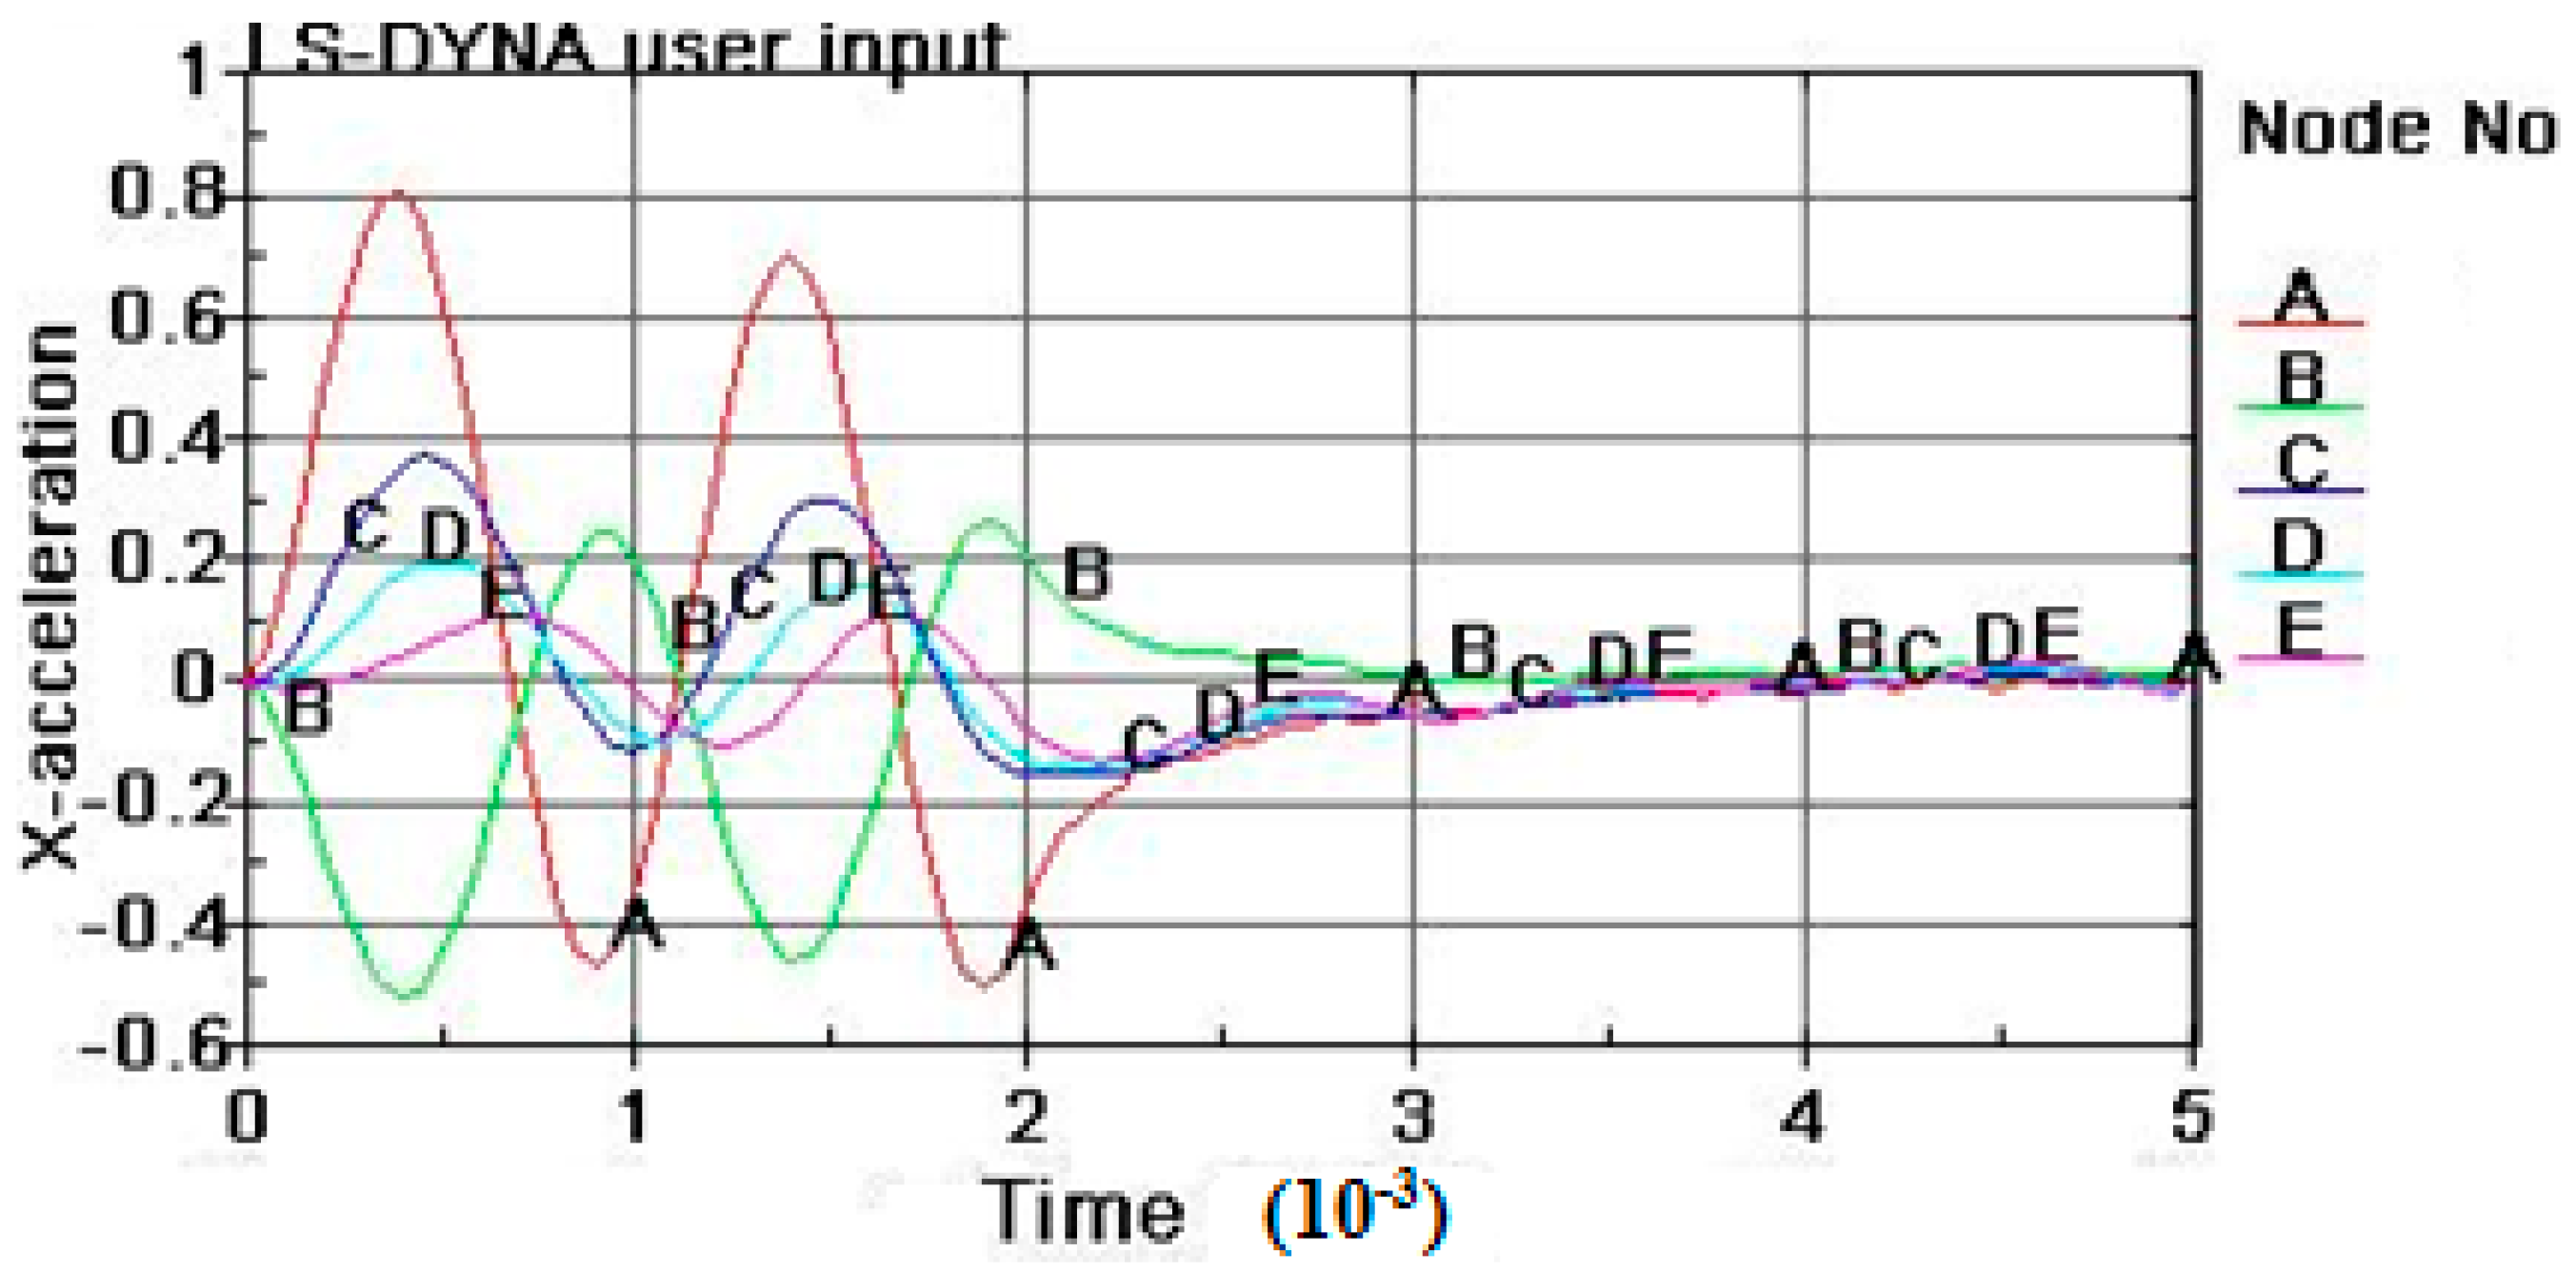
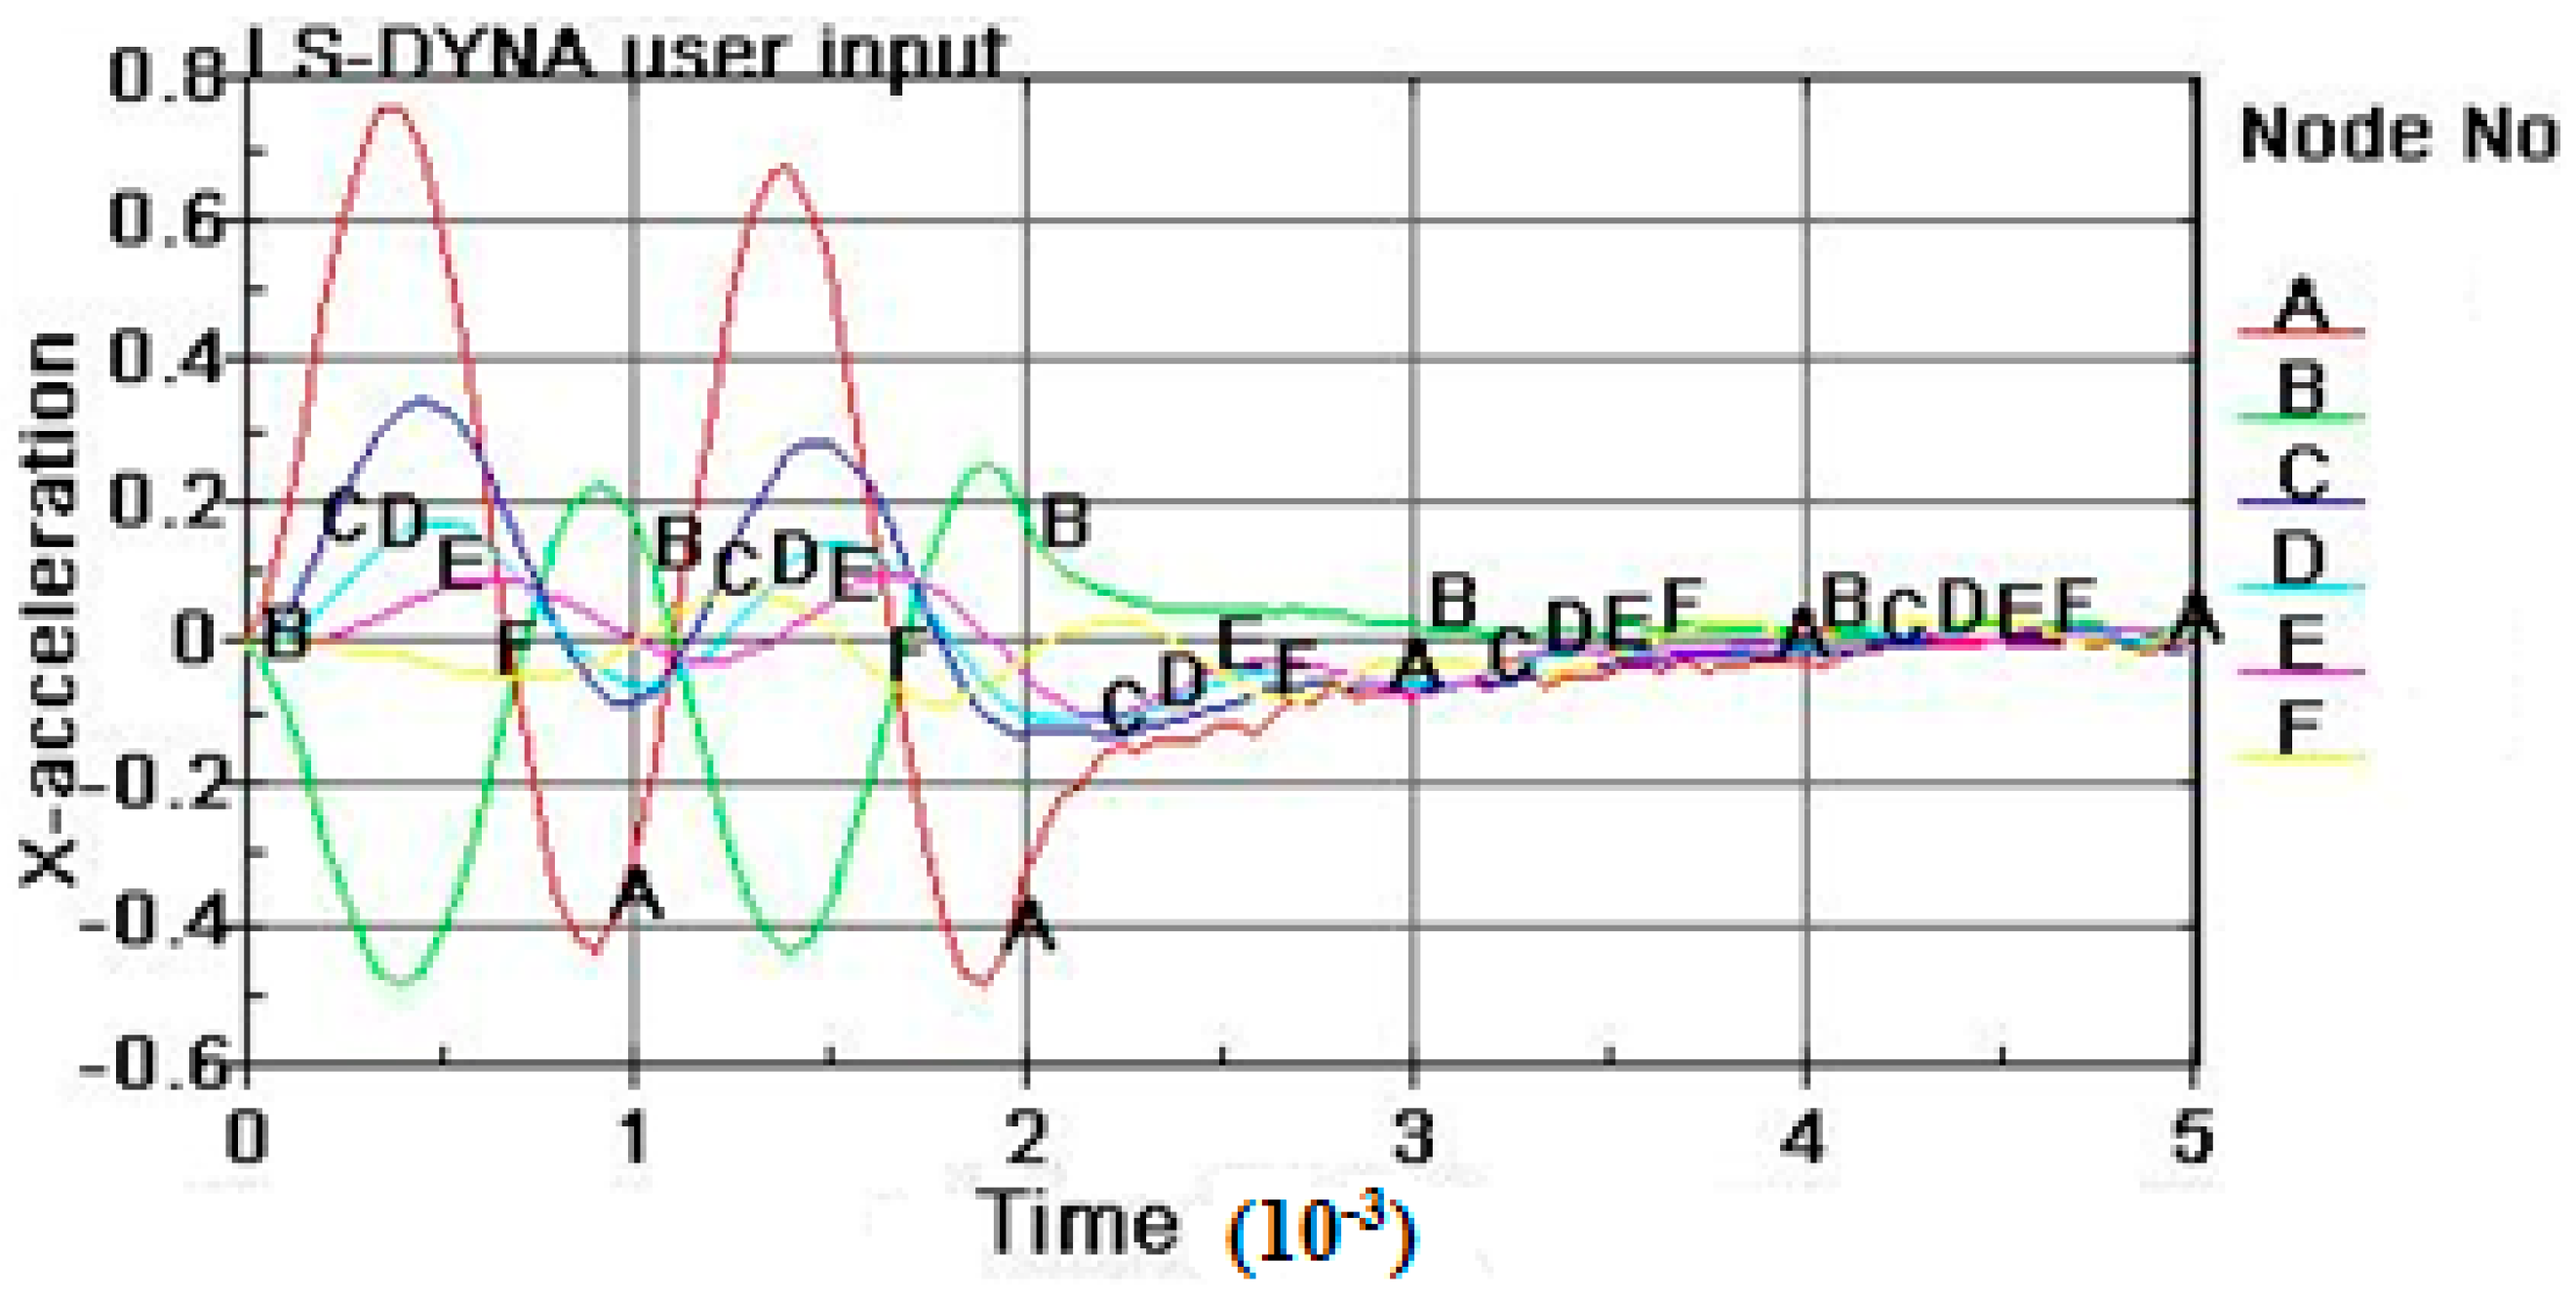
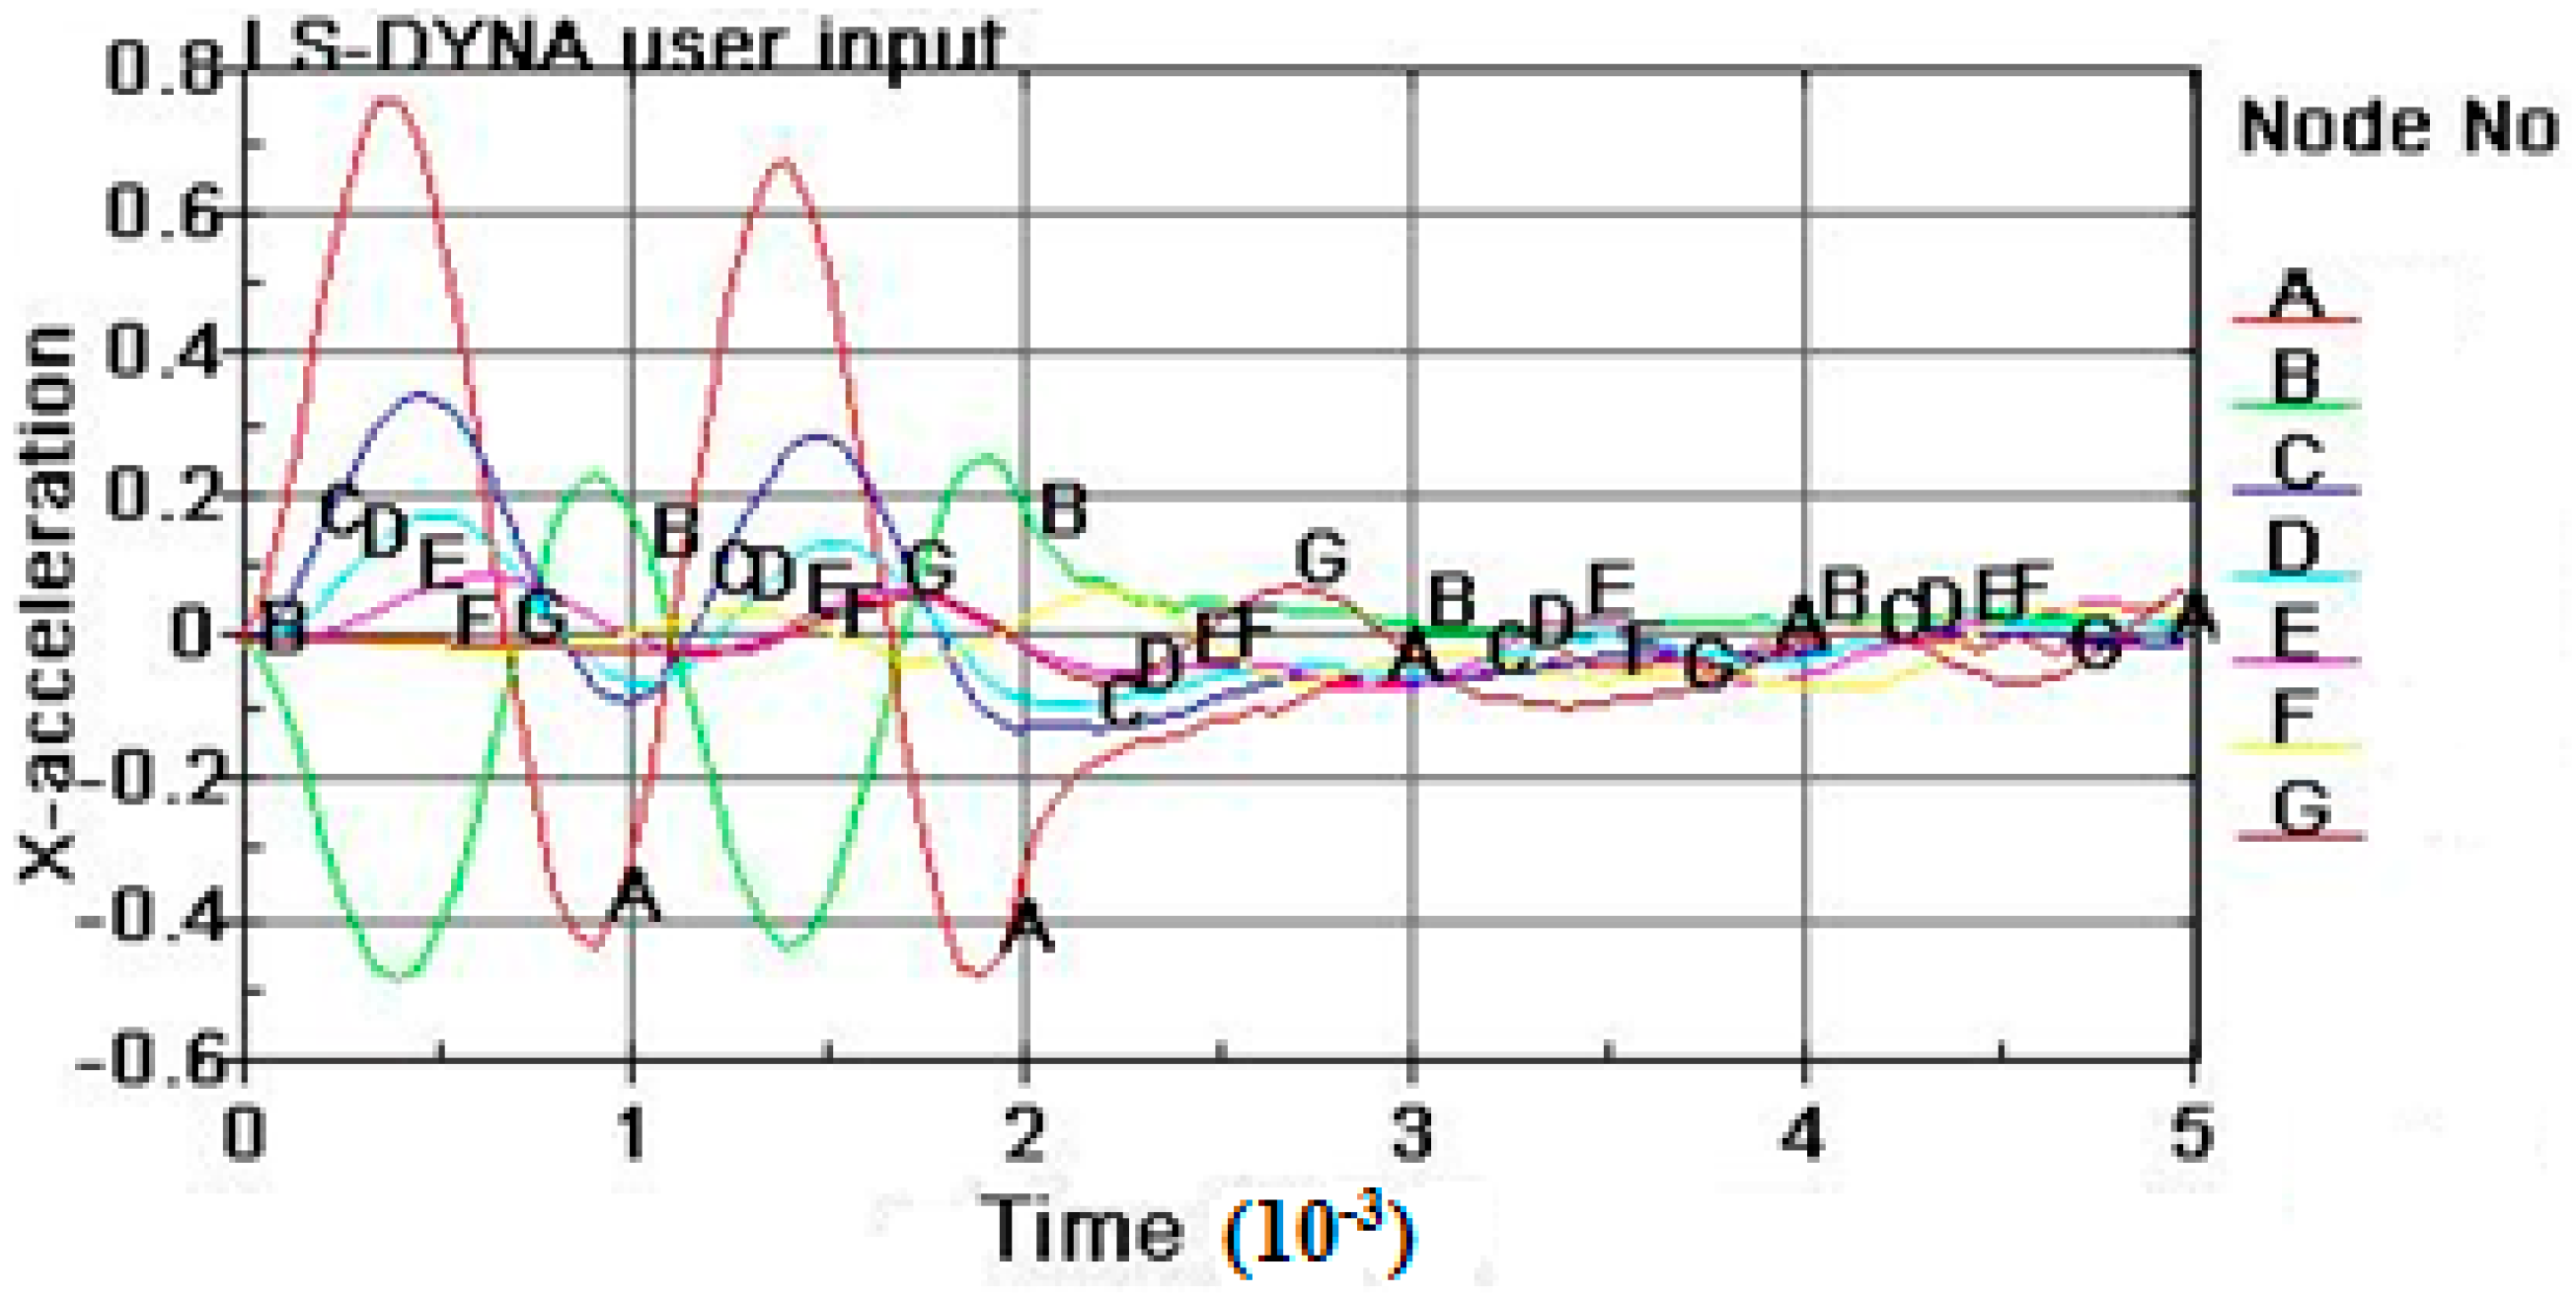
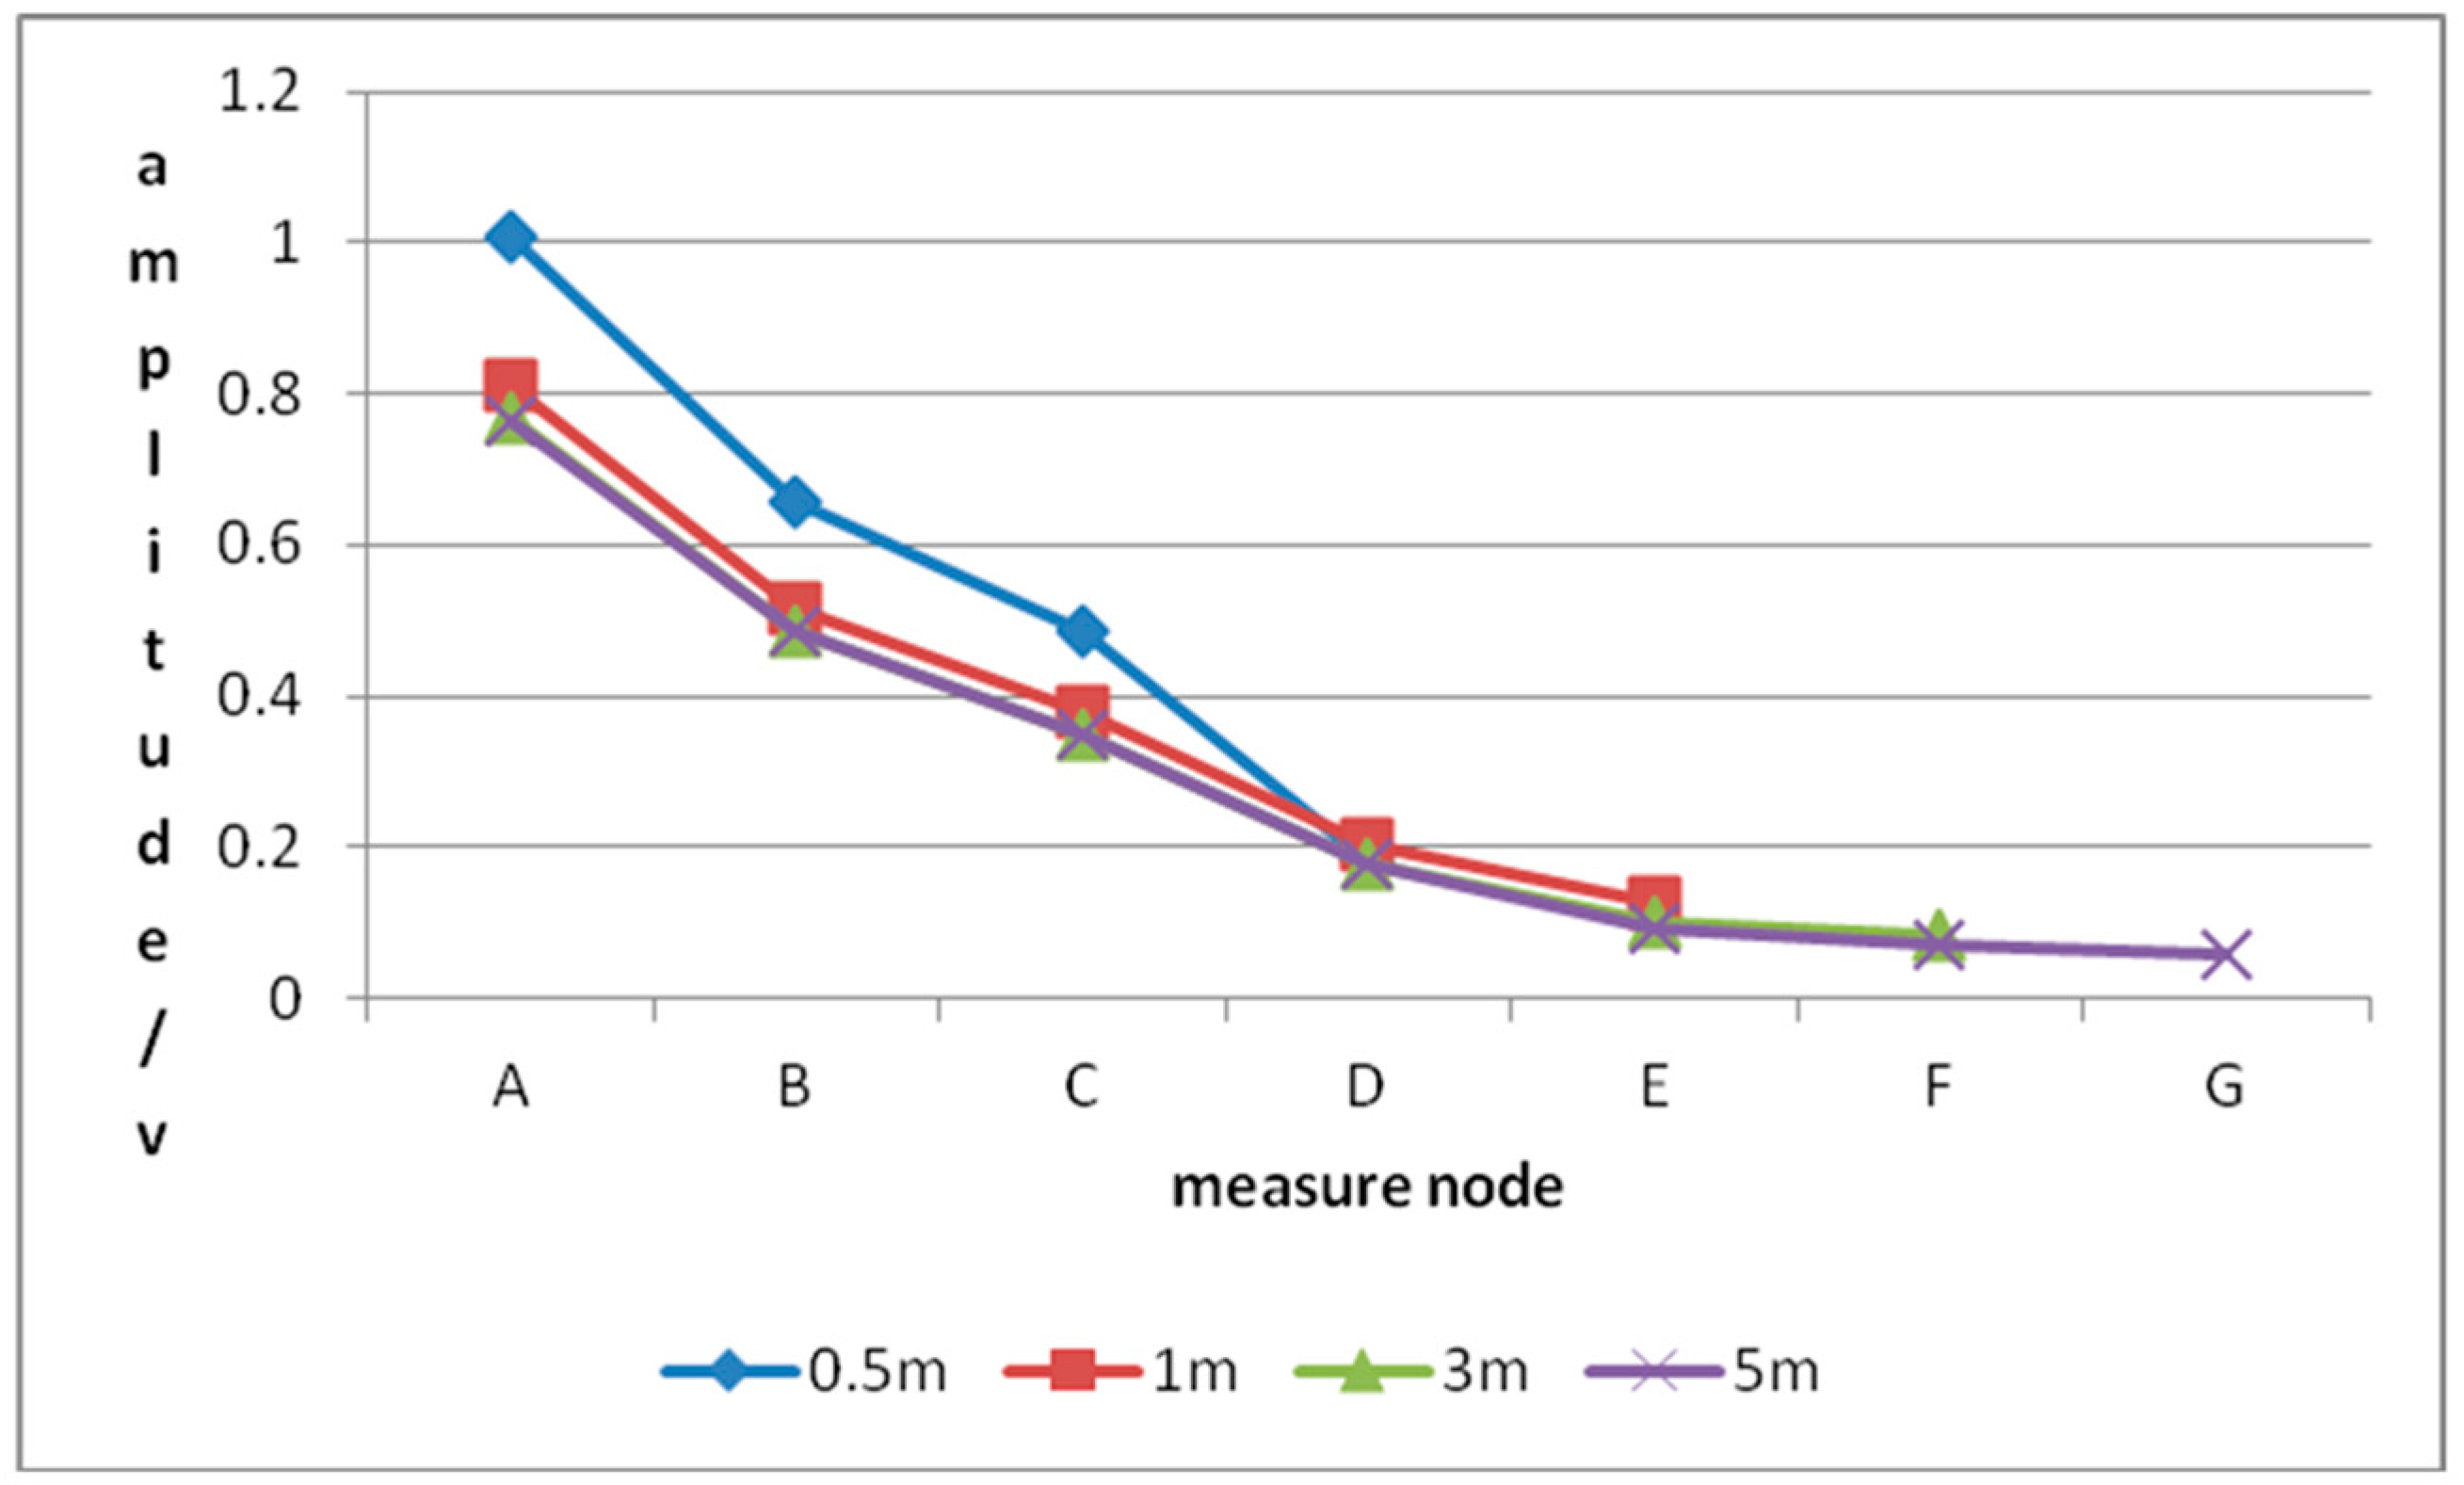
3.3. Analysis of the Results Using the Second Simulation Scheme

When D was fixed at 5 mm and L was set as 0.5 m, 1 m, 3 m and 5 m, respectively, the acceleration data at seven nodes (specifically, Node A, Node B, Node C, Node D, Node E, Node F and Node G, as listed in Figure 9) were simulated, as shown in Figure 3.
Figure 10 shows the acceleration–time curves of different nodes when L = 0.5 m. Due to only considering the source node (A) and the receiving node (D, waveguide acceleration sensor installation location), without considering the process nodes (B, C), therefore, only source node (A) and the receiving node (D) were compared. Figure 10 shows that receiving node (D) acoustic emission signal acceleration amplitude (0.18361) attenuates approximately 82% relative to the source node (A) signal amplitude (1.0062), which is due to the vibration loss when L = 0.5 m. Source node (A) has a small response to the sine acceleration waves due to coal rock propagation loss, but the receiving node (D) signal acceleration amplitude is a slightly larger than that of the other length waveguide due to the shorter length.
Figure 11 shows the acceleration–time curves of different nodes when L = 1 m. Due to only considering the source node (A) and the receiving node (E, waveguide acceleration sensor installation location), without considering the process nodes (B, C, D), therefore, only source node (A) and the receiving node (E) were compared. Figure 11 shows that receiving node (E) acoustic emission signal acceleration amplitude (0.12437) attenuates approximately 85% relative to source node (A) signal amplitude (0.81294), which is due to the vibration loss when L = 1 m. Source node (A) has a small response to the sine acceleration waves due to coal rock propagation loss, and the receiving node (E) signal acceleration amplitude gets smaller due to the larger length.
Figure 12 shows the acceleration–time curves of different nodes when L = 3 m. Due to only considering the source node (A) and the receiving node (F, waveguide acceleration sensor installation location), without considering the process nodes (B, C, D, E), therefore, only source node (A) and the receiving node (F) were compared. Figure 12 shows that receiving node (F) acoustic emission signal acceleration amplitude (0.081358) attenuates approximately 89% relative to the source node (A) signal amplitude (0.76692), which is due to the vibration loss when L = 3 m. Source node (A) has a small response to the sine acceleration waves due to coal rock propagation loss, and the receiving node (F) signal acceleration amplitude gets smaller due to the larger length.
Figure 13 shows the acceleration–time curves of different nodes when L = 5 m. Due to only considering the source node (A) and the receiving node (G, waveguide acceleration sensor installation location), without considering the process nodes (B, C, D, E, F), therefore, only source node (A) and the receiving node (G) were compared. Figure 13 shows that receiving node (G) acoustic emission signal acceleration amplitude (0.057397) attenuates approximately 93% relative to the source node (A) signal amplitude (0.76563), which is due to the vibration loss when L = 5 m. Source node (A) has a small response to the sine acceleration waves due to coal rock propagation loss, and the receiving node (G) signal acceleration amplitude gets smaller due to the larger length.
Table 3 lists the maxima of the absolute values of the acceleration amplitudes at A, B, C, D, E, F and G when L was set as different values, which were then imported to EXCEL for data process, as the results shown in Figure 14.
Figure 14 shows the variations of the maximum of the absolute values of the acceleration amplitudes at A, B, C, D, E, F and G when L was set as different values.
It can be observed that, when the waveguide’s diameter remained unchanged and the smaller the waveguide’s length, the greater the maximum of the absolute value of the acceleration amplitude at Node A; the variations of the maximum of the absolute value of the acceleration amplitude at D, E, F and G were insensitive to the variation of the waveguide’s length. According to the numerical simulation results, waveguide length imposed only a slight effect on the propagation of the AE signal within the range of 0.5~5 m.

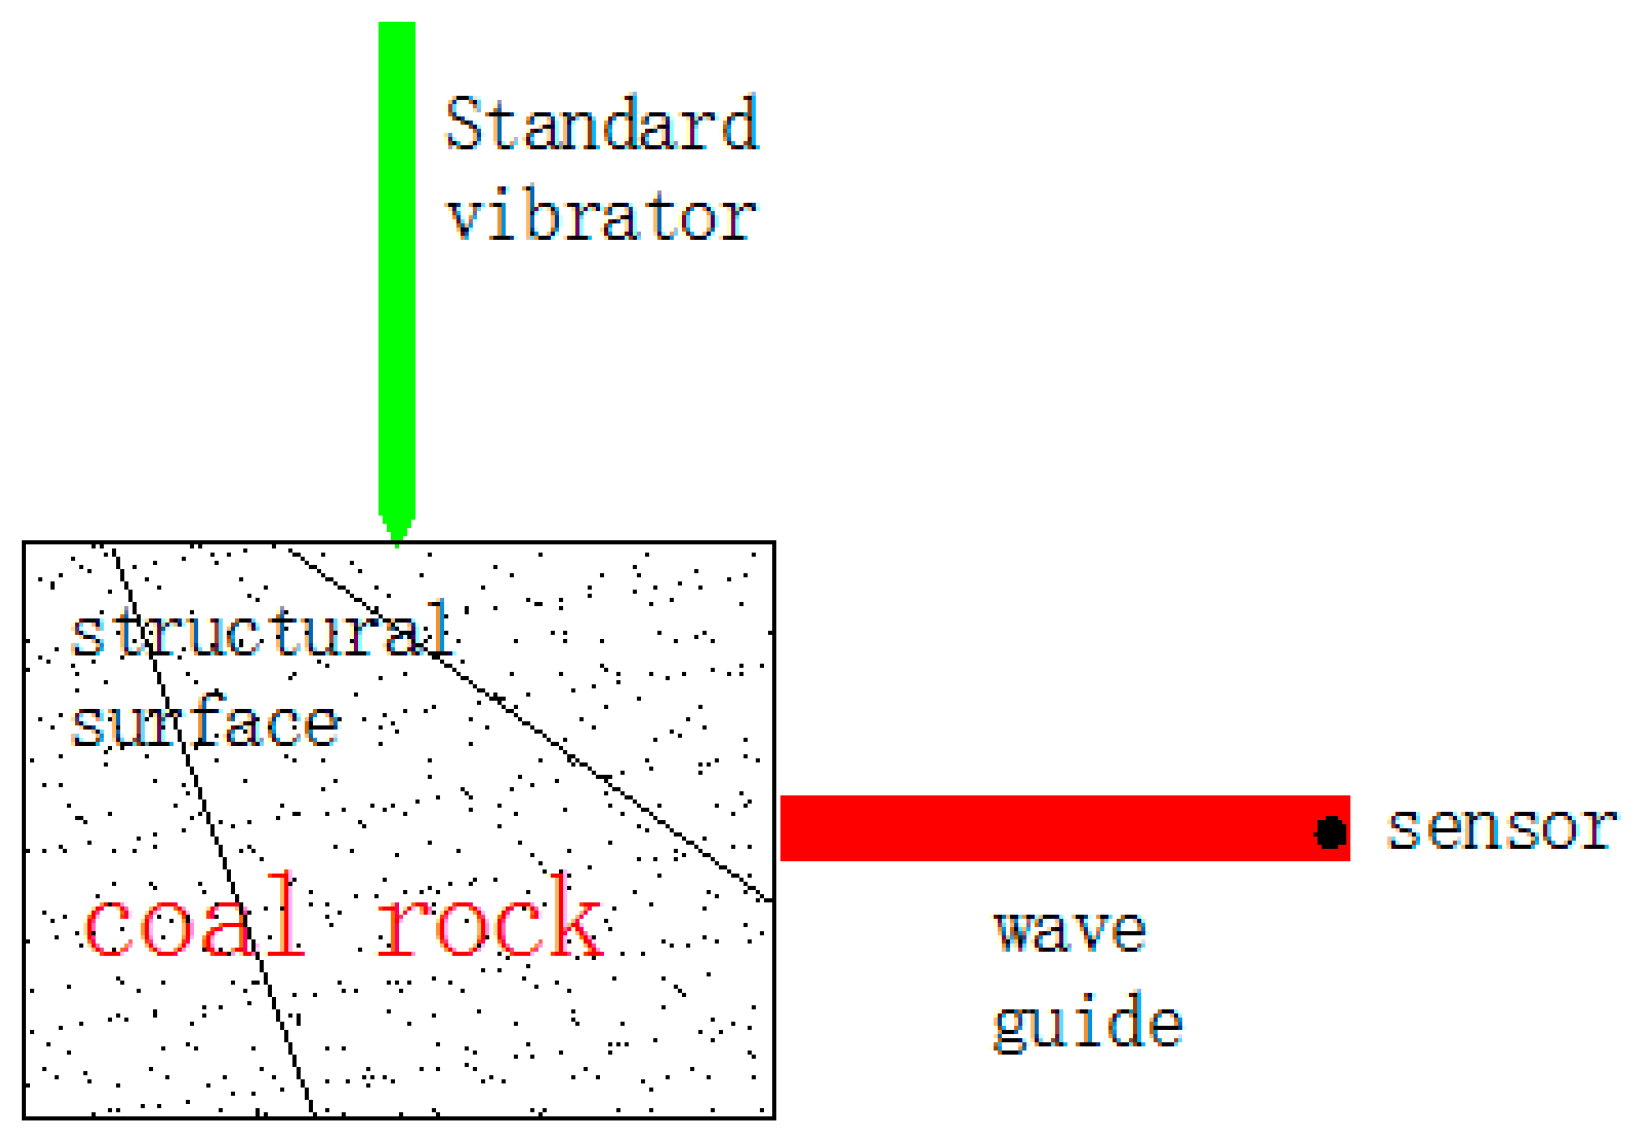
4. Laboratory Tests on the Effects of the Waveguide’s Size on AE Signal’s Propagation

Based on AE propagation rules, we conducted excitation tests on coal rock for investigating the effects of the waveguide’s size on the AE signal’s propagation, during which standard vibrator source (artificially made) and virtual instrument system were used.

4.1. Test Scheme and Parameter Settings

According to the actual coal mining situation at the scene, the laboratory test schemes were determined. Figure 15 illustrates the test scheme. The laboratory test scheme and the related parameter settings were the same as those in the numerical model.

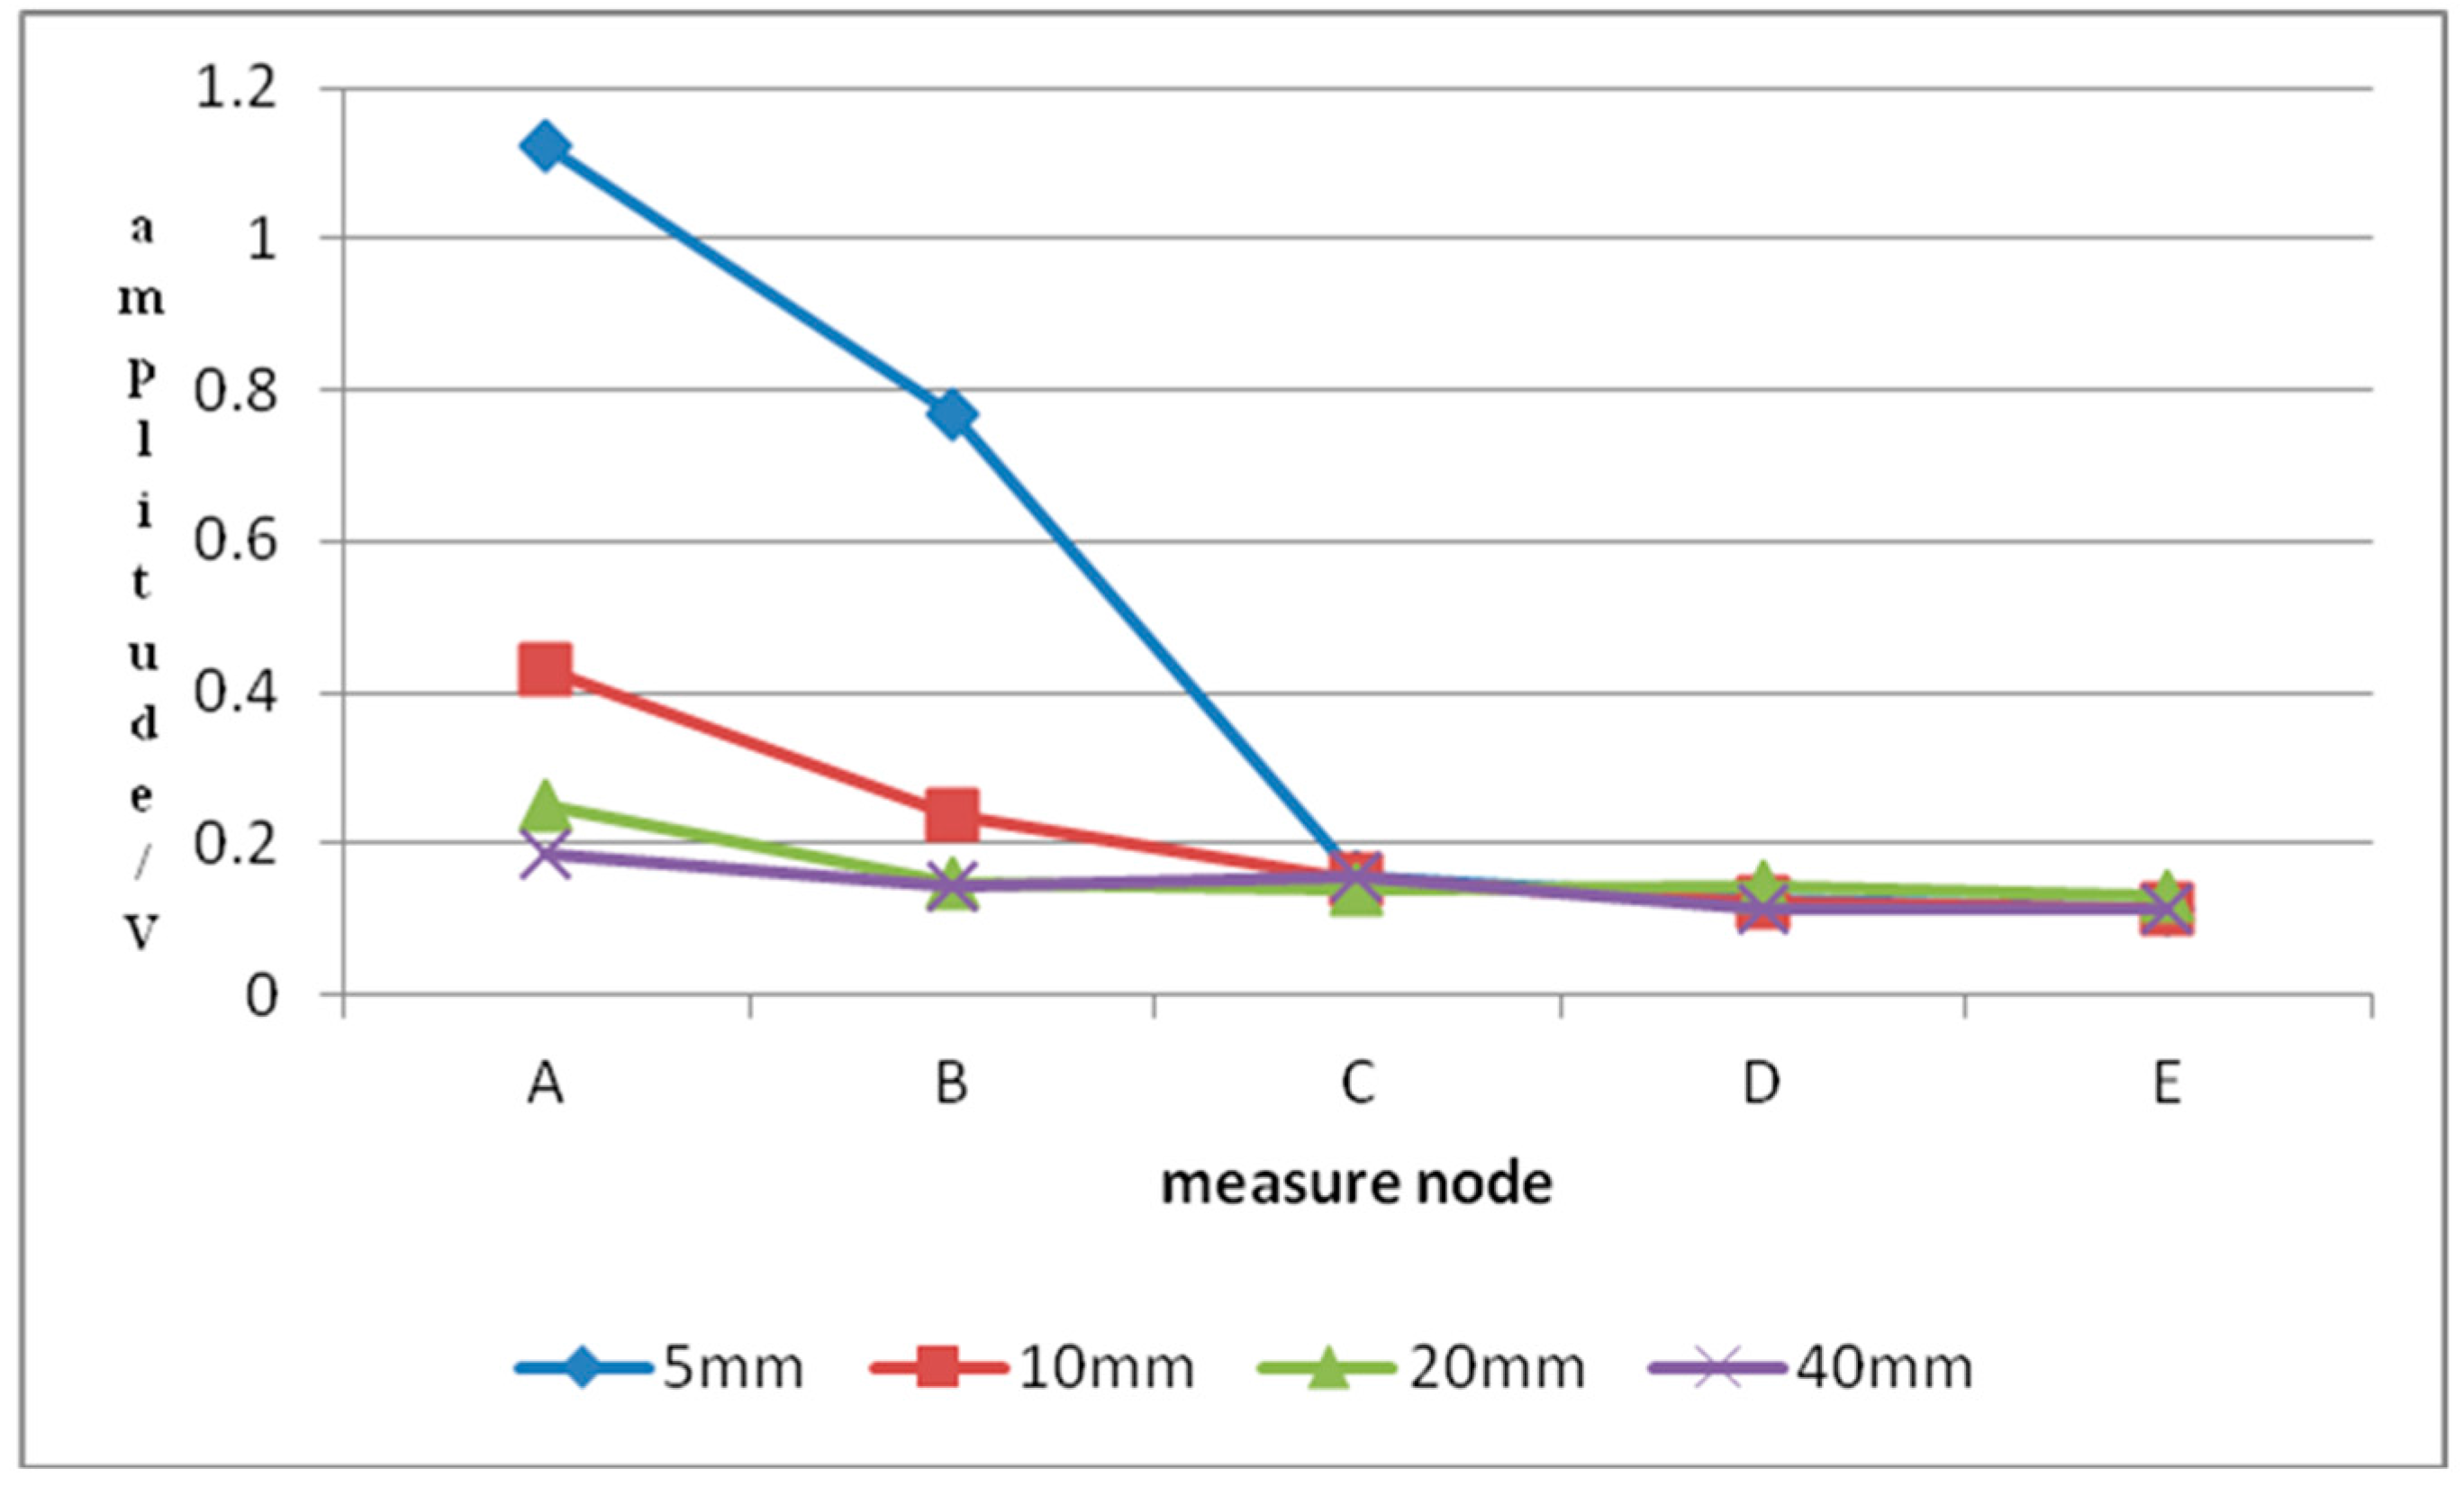
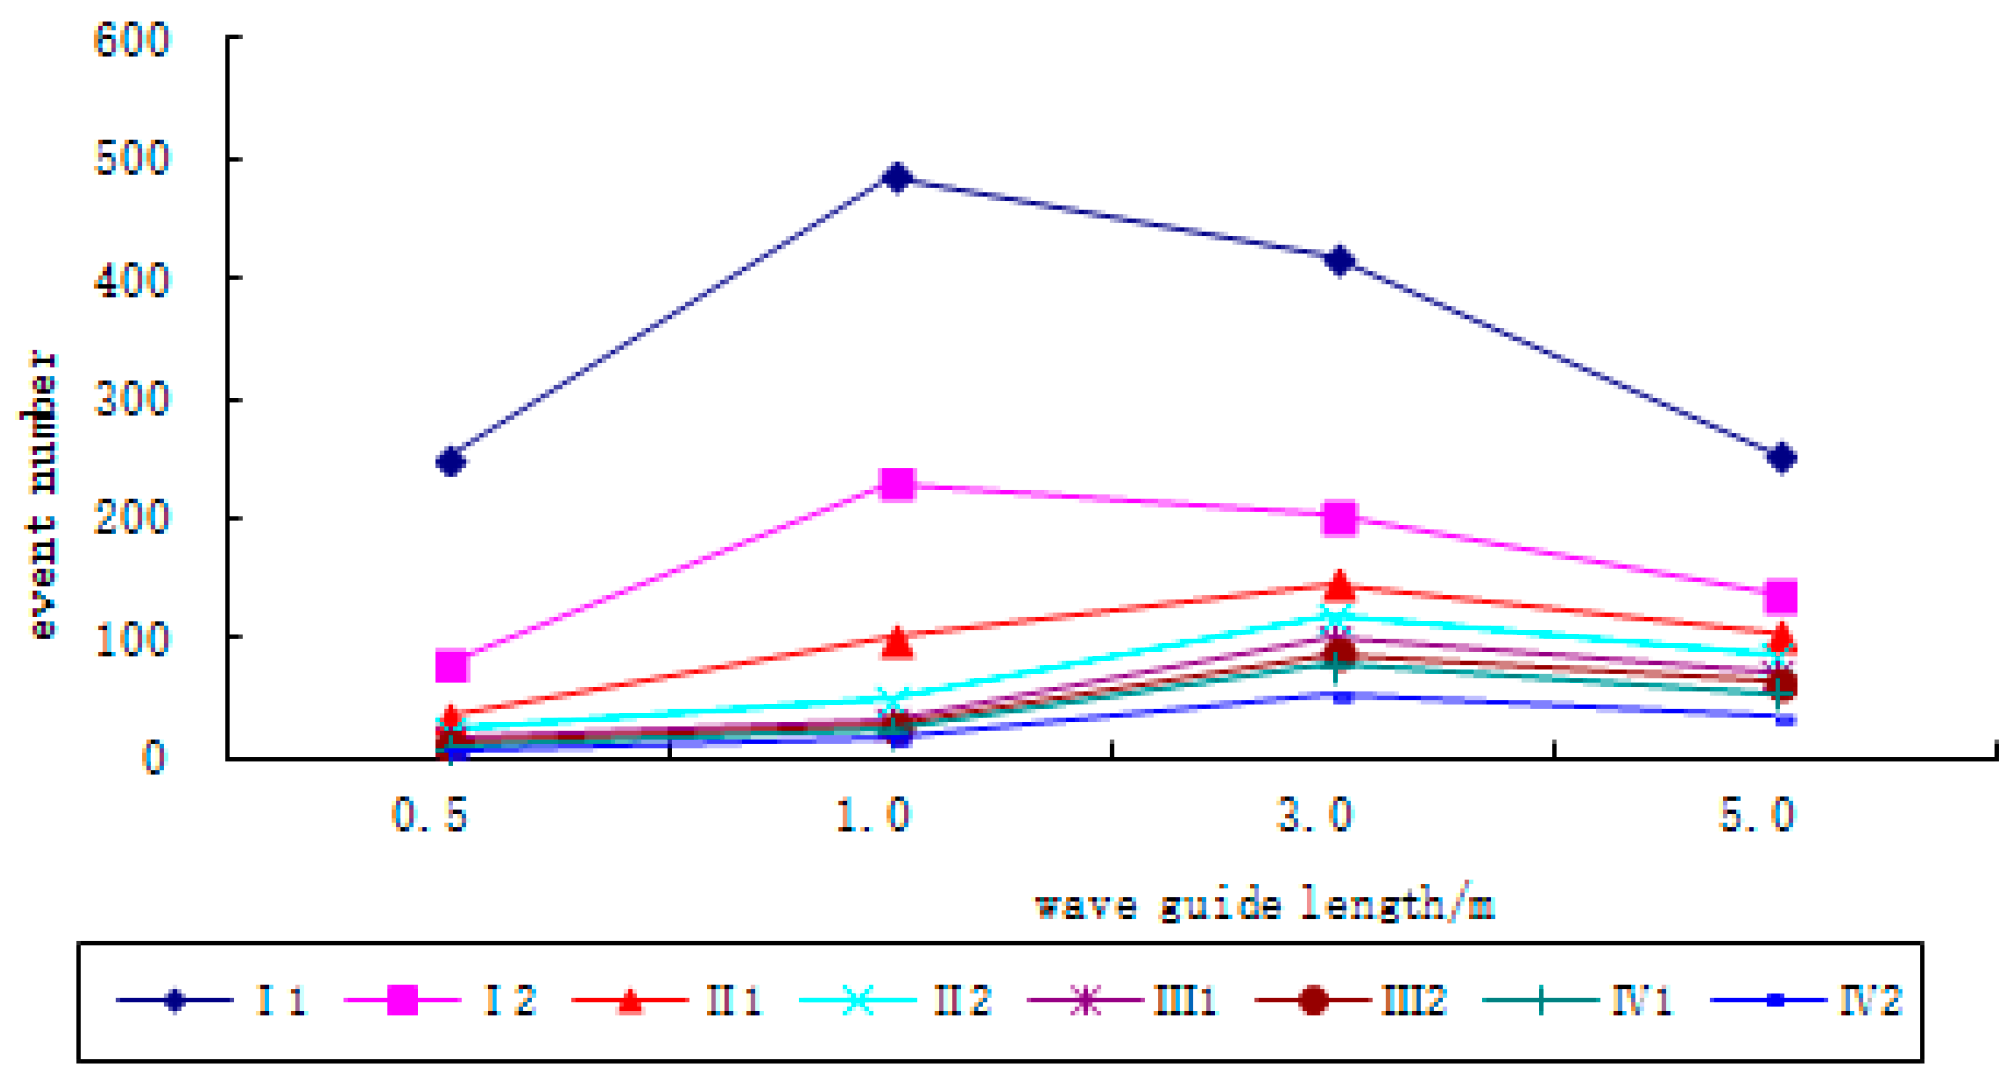
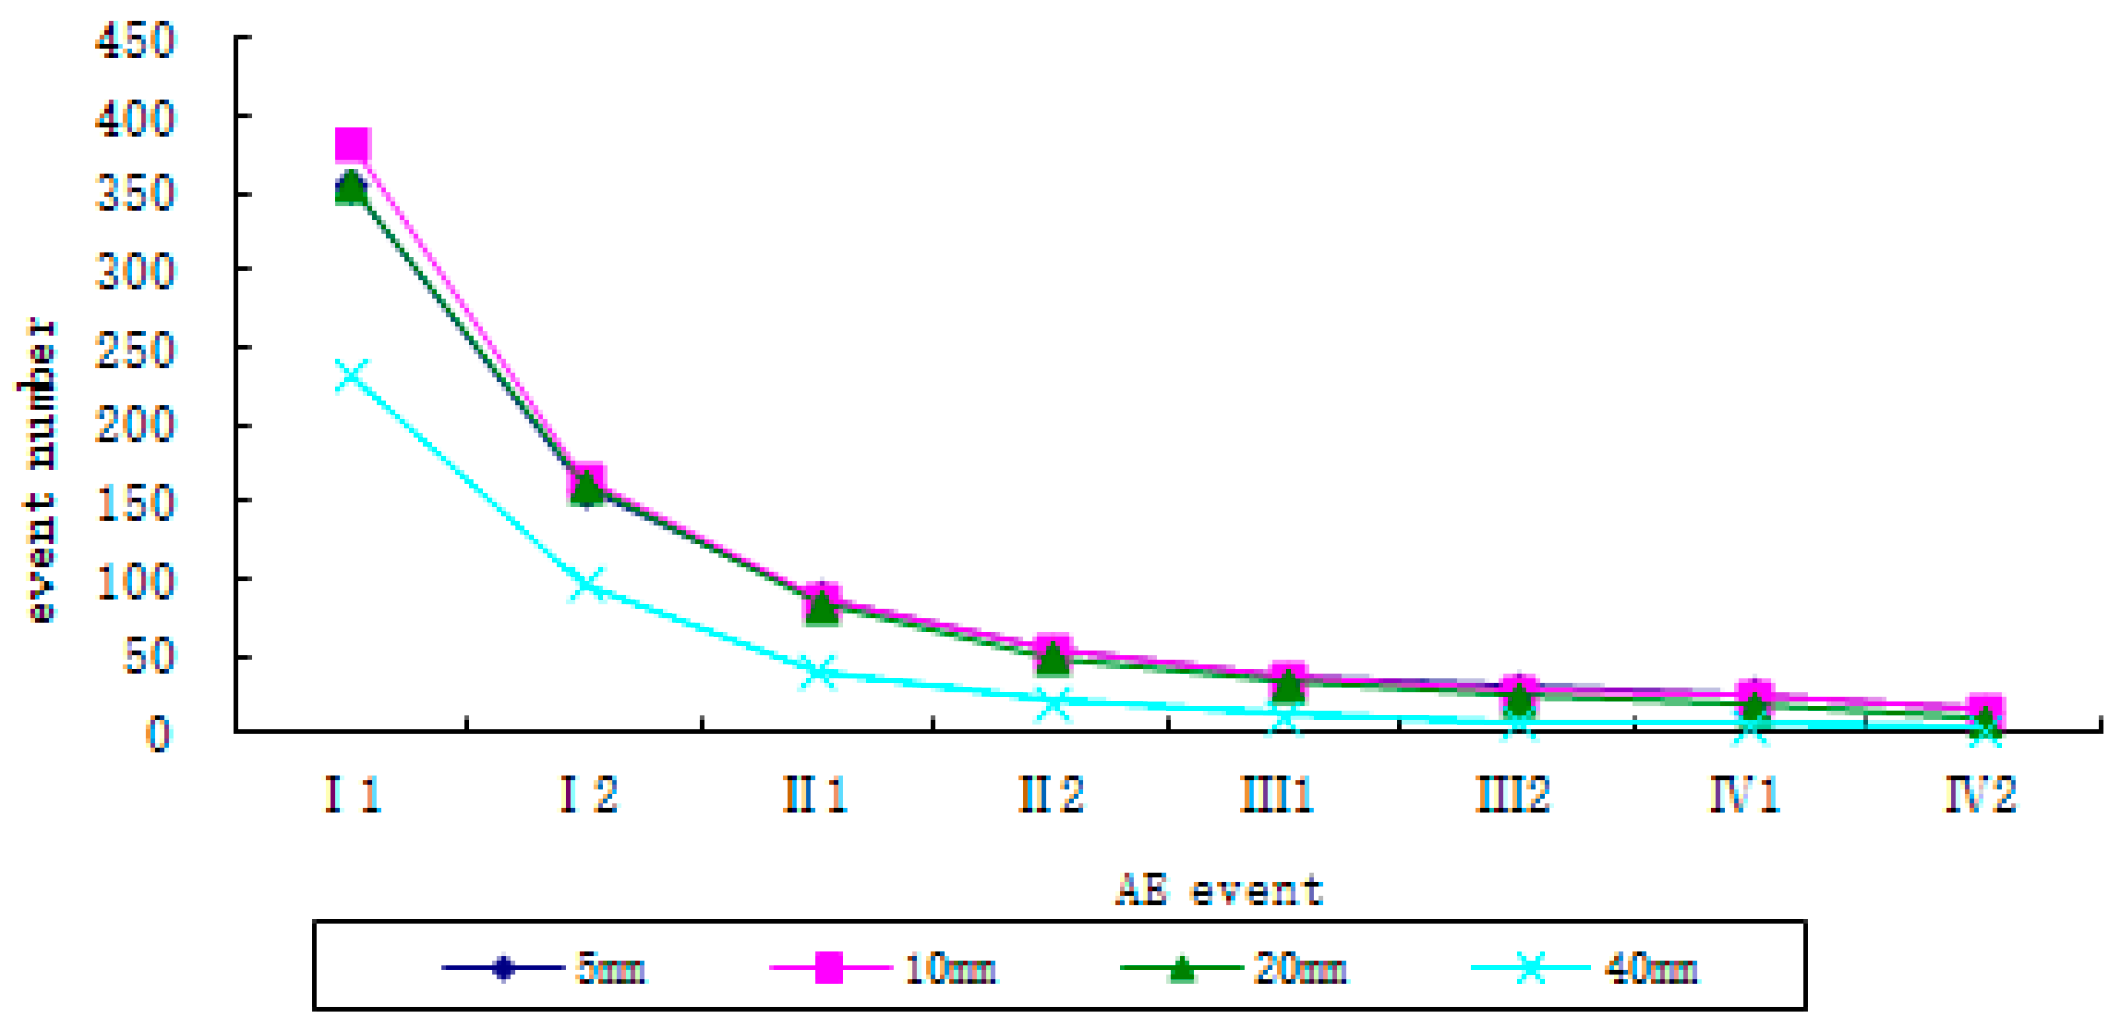
4.2. Test Results and Analysis

According to the threshold value, the AE signal event can be classified into micro-event, small-event, medium-event and great event, respectively, which were dented as I, II, III and IV. Further, each level of event includes two sub-levels (i.e., I1, I2, II1, II2, III1, III2, IV1 and IV2, respectively).
(1) Variation of Event Number with Waveguide Length
As shown in Figure 16, according to the different threshold value, the receiving node (waveguide acceleration sensor installation location) acoustic emission signals AE event numbers of (AE III1, III2, IV1, IV2 events are 4, 9, 13, 17, respectively when waveguide L = 0.5 m; AE III1, III2, IV1, IV2 events are 15, 23, 26, 33, respectively when waveguide L = 1 m; AE III1, III2, IV1, IV2 events are 52, 78, 87, 101, respectively when waveguide L = 3 m; AE III1, III2, IV1, IV2 events are 34, 55, 63, 73, respectively when waveguide L = 5 m) and change from 76(100 − 4 ÷ 52 × 100)% to 93(100 − 17 ÷ 101 × 100)% except for AE I1, I2, II1, II2 events, as the waveguide’s length increased from 0.5 m to 5 m. Basically, as the wave length increases, the AE events numbers slightly increase due to the waveguide vibration increasing. However, the variation range of the AE events numbers show only a slight effect. Laboratory results are consistent with the numerical simulation.
(2) Variation of Event Number with Waveguide Diameter
As shown in Figure 17, according to the different threshold value, the receiving node (waveguide acceleration sensor installation location)acoustic emission signals correspond to the number of AE events (AE III1, III2, IV1, IV2 events are 16, 26, 31, 38, respectively when waveguide diameter = 5 mm; AE III1, III2, IV1, IV2 events are 15, 25, 30, 38, respectively when waveguide diameter = 10 mm; AE III1, III2, IV1, IV2 events are 11, 19, 24, 33, respectively when waveguide diameter = 20 mm; AE III1, III2, IV1, IV2 events are 4, 6, 9, 12, respectively when waveguide diameter = 40 mm) and change from 68(100 − 12 ÷ 38 × 100)% to 77(100 − 6 ÷ 26 × 100)%, except for the AE I1, I2, II1, II2 events, as the waveguide’s diameter increased from 5 mm to 40 mm. Basically, as the wave diameter increases, the AE events numbers slightly decrease due to the waveguide vibration decreasing. However, the variation range of the AE events numbers show only a slight effect. Laboratory results are consistent with the numerical simulation.

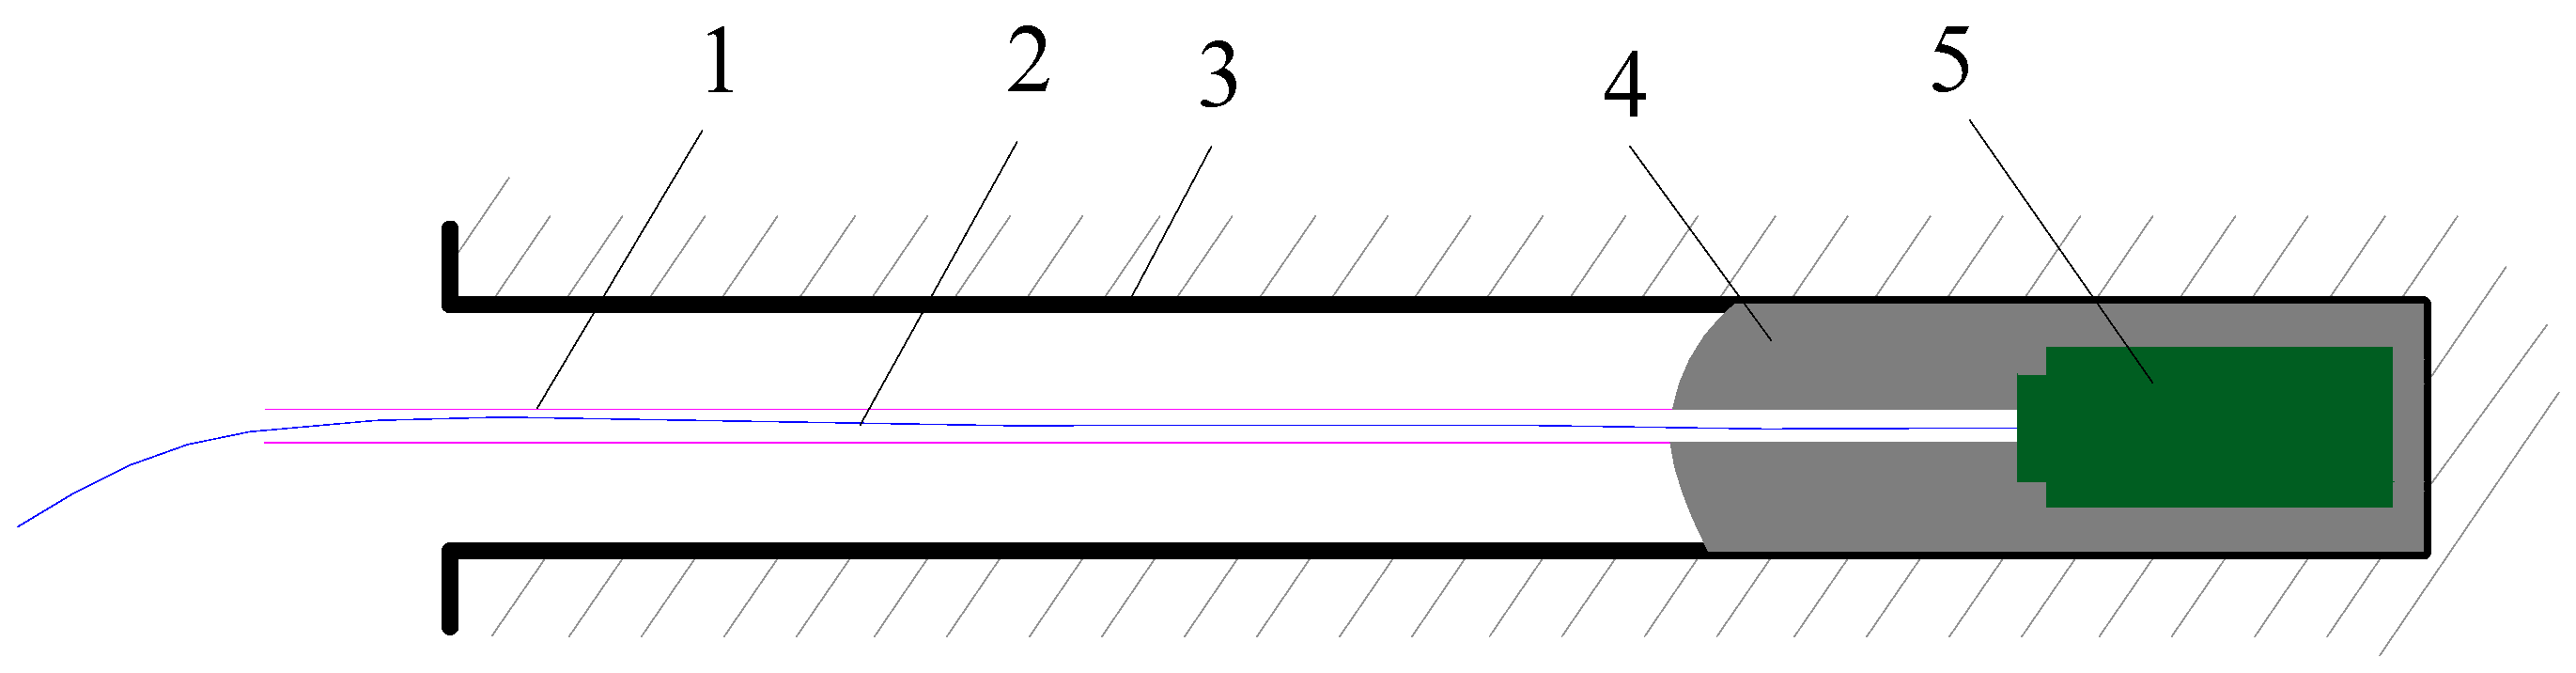
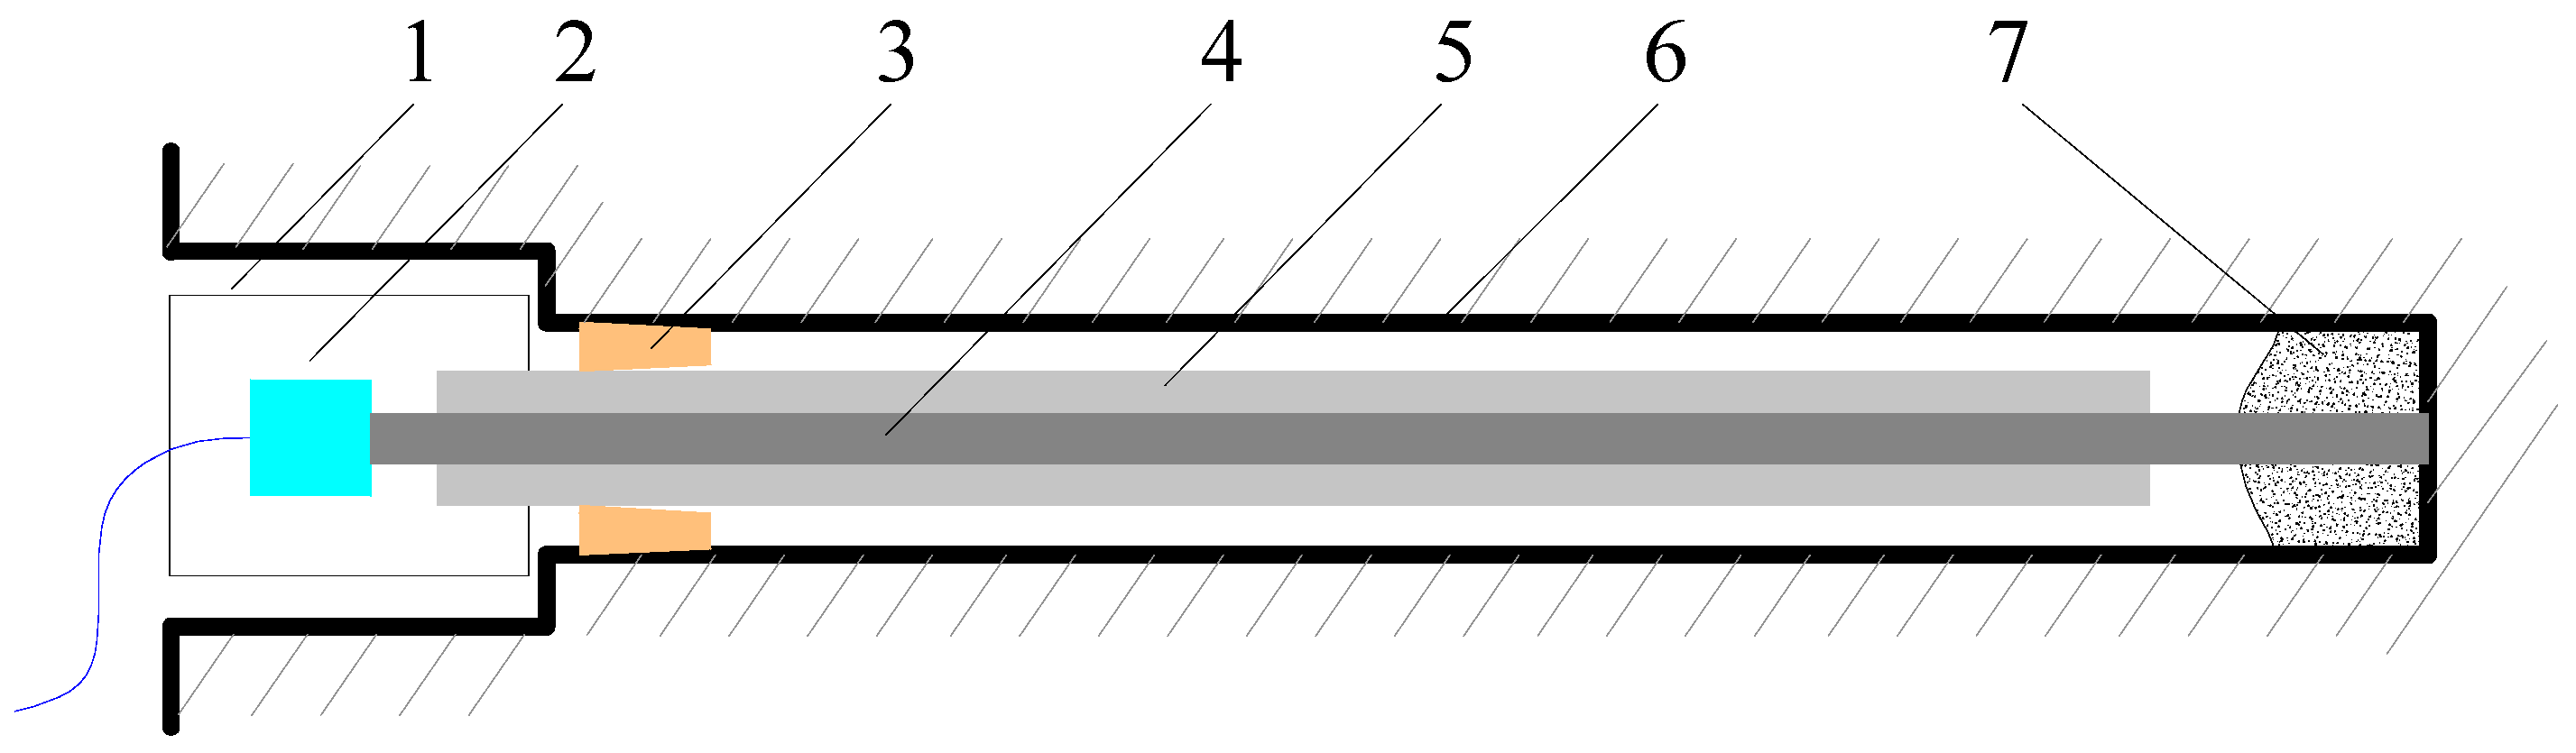
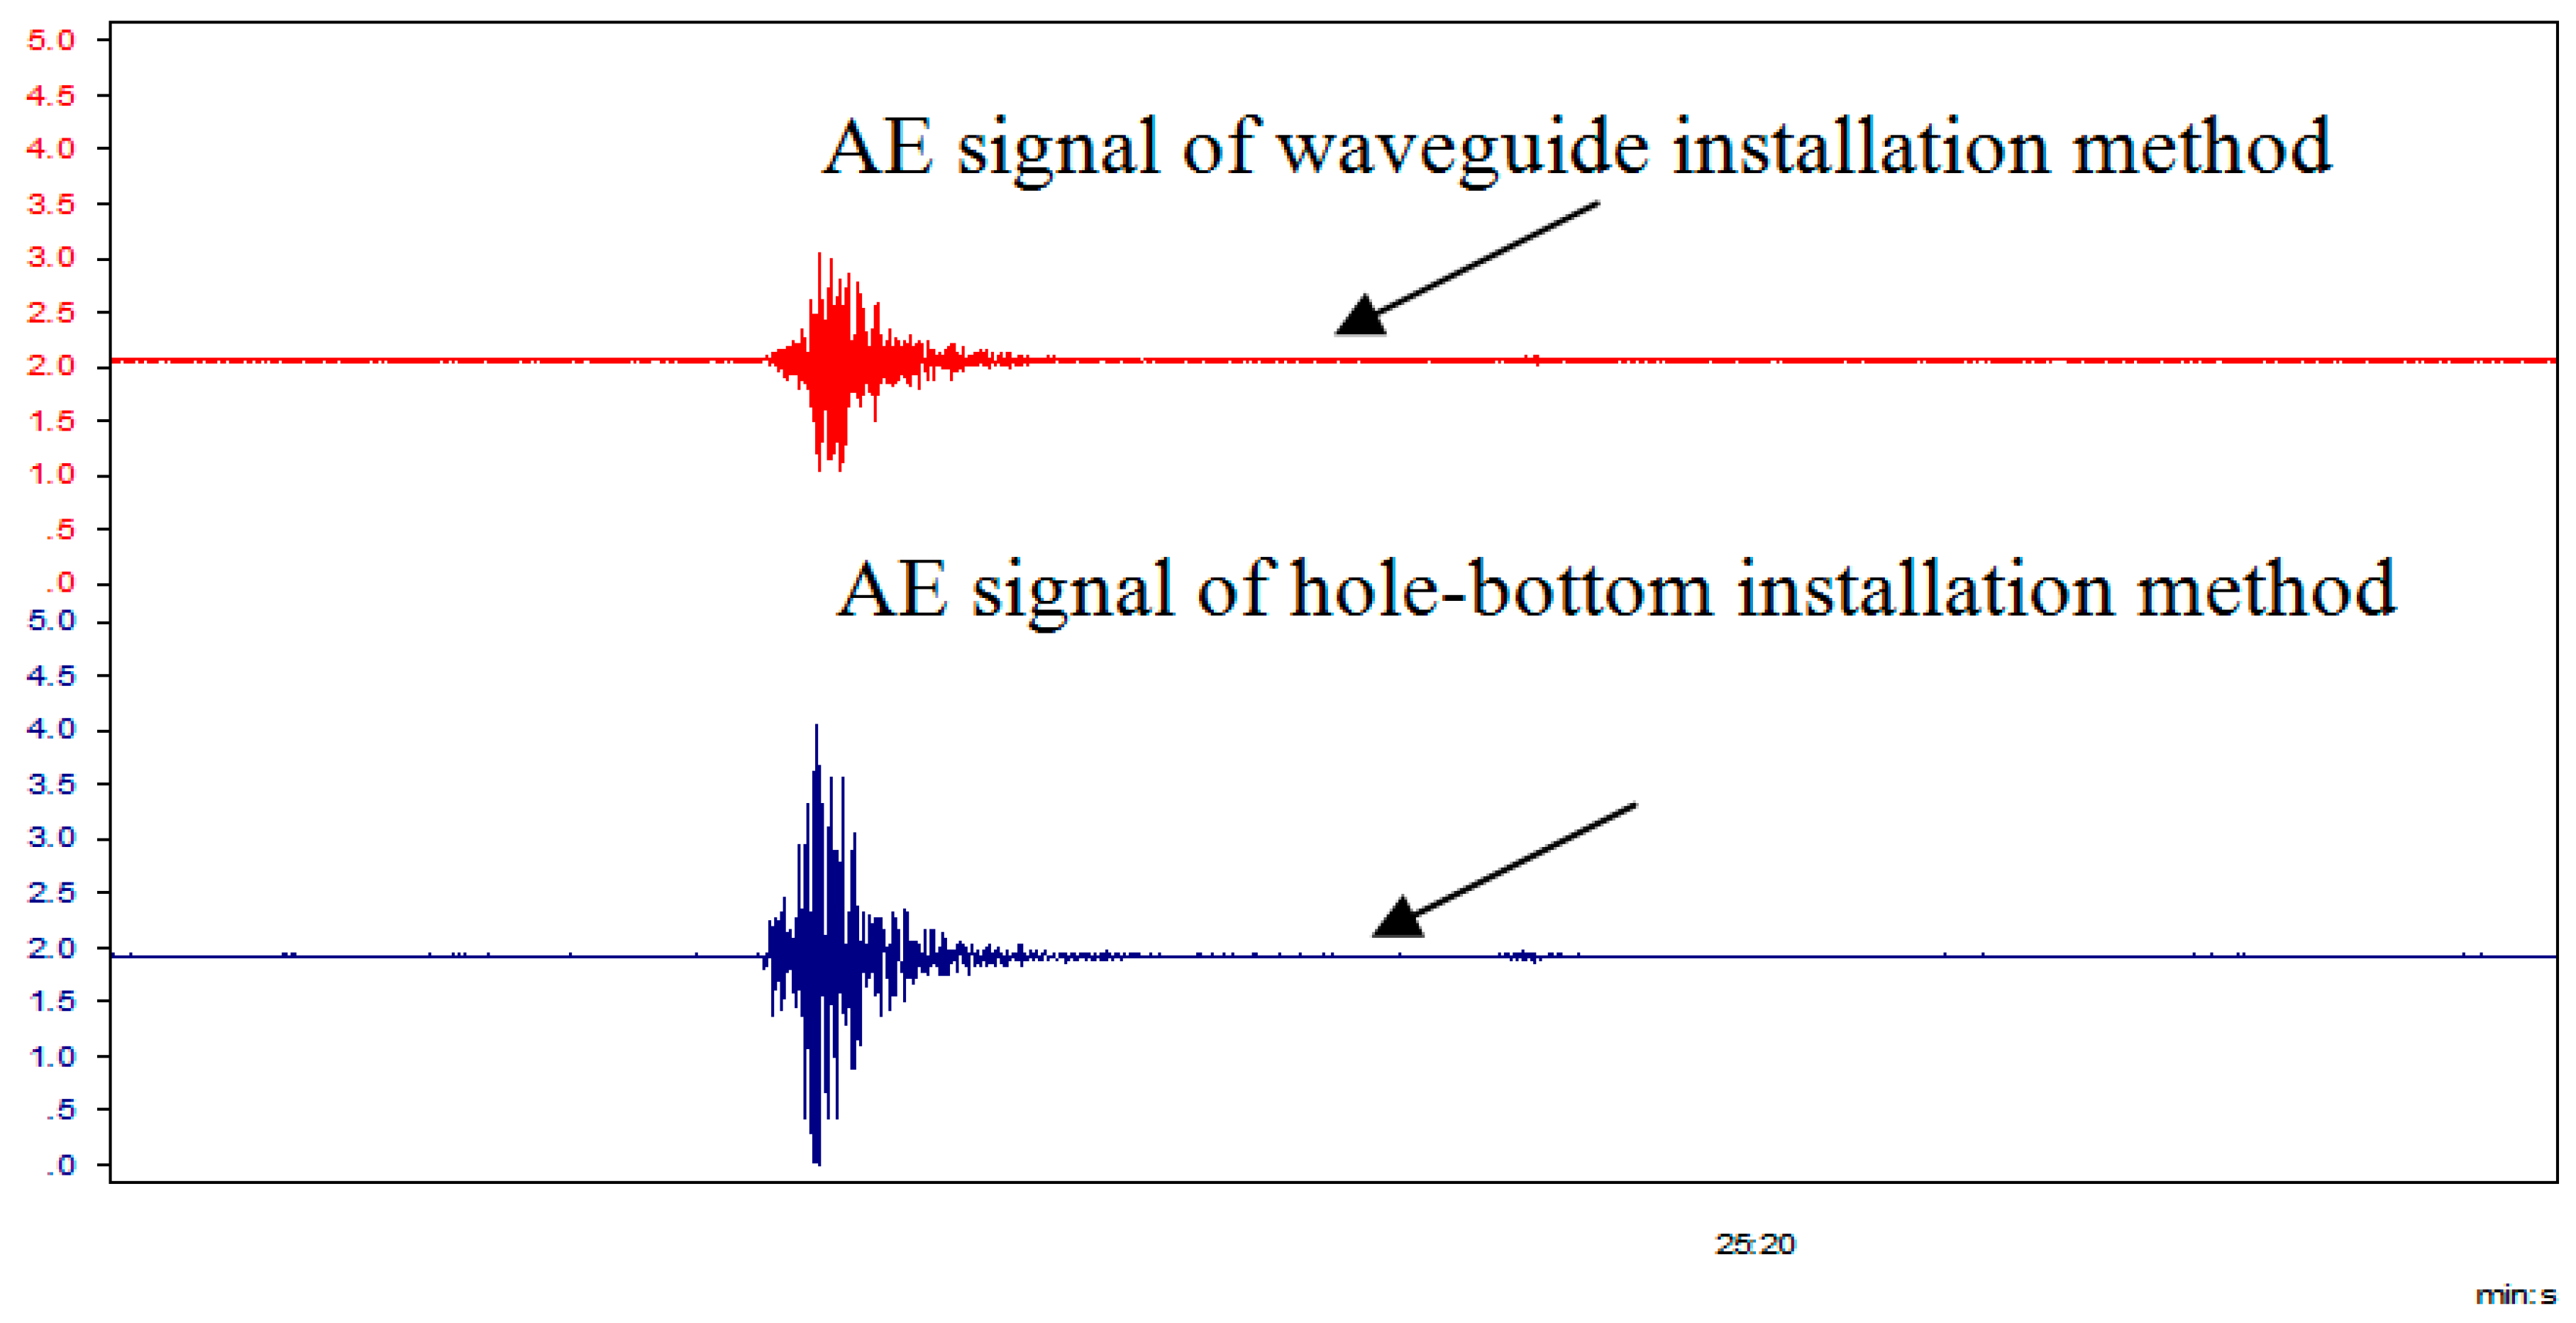
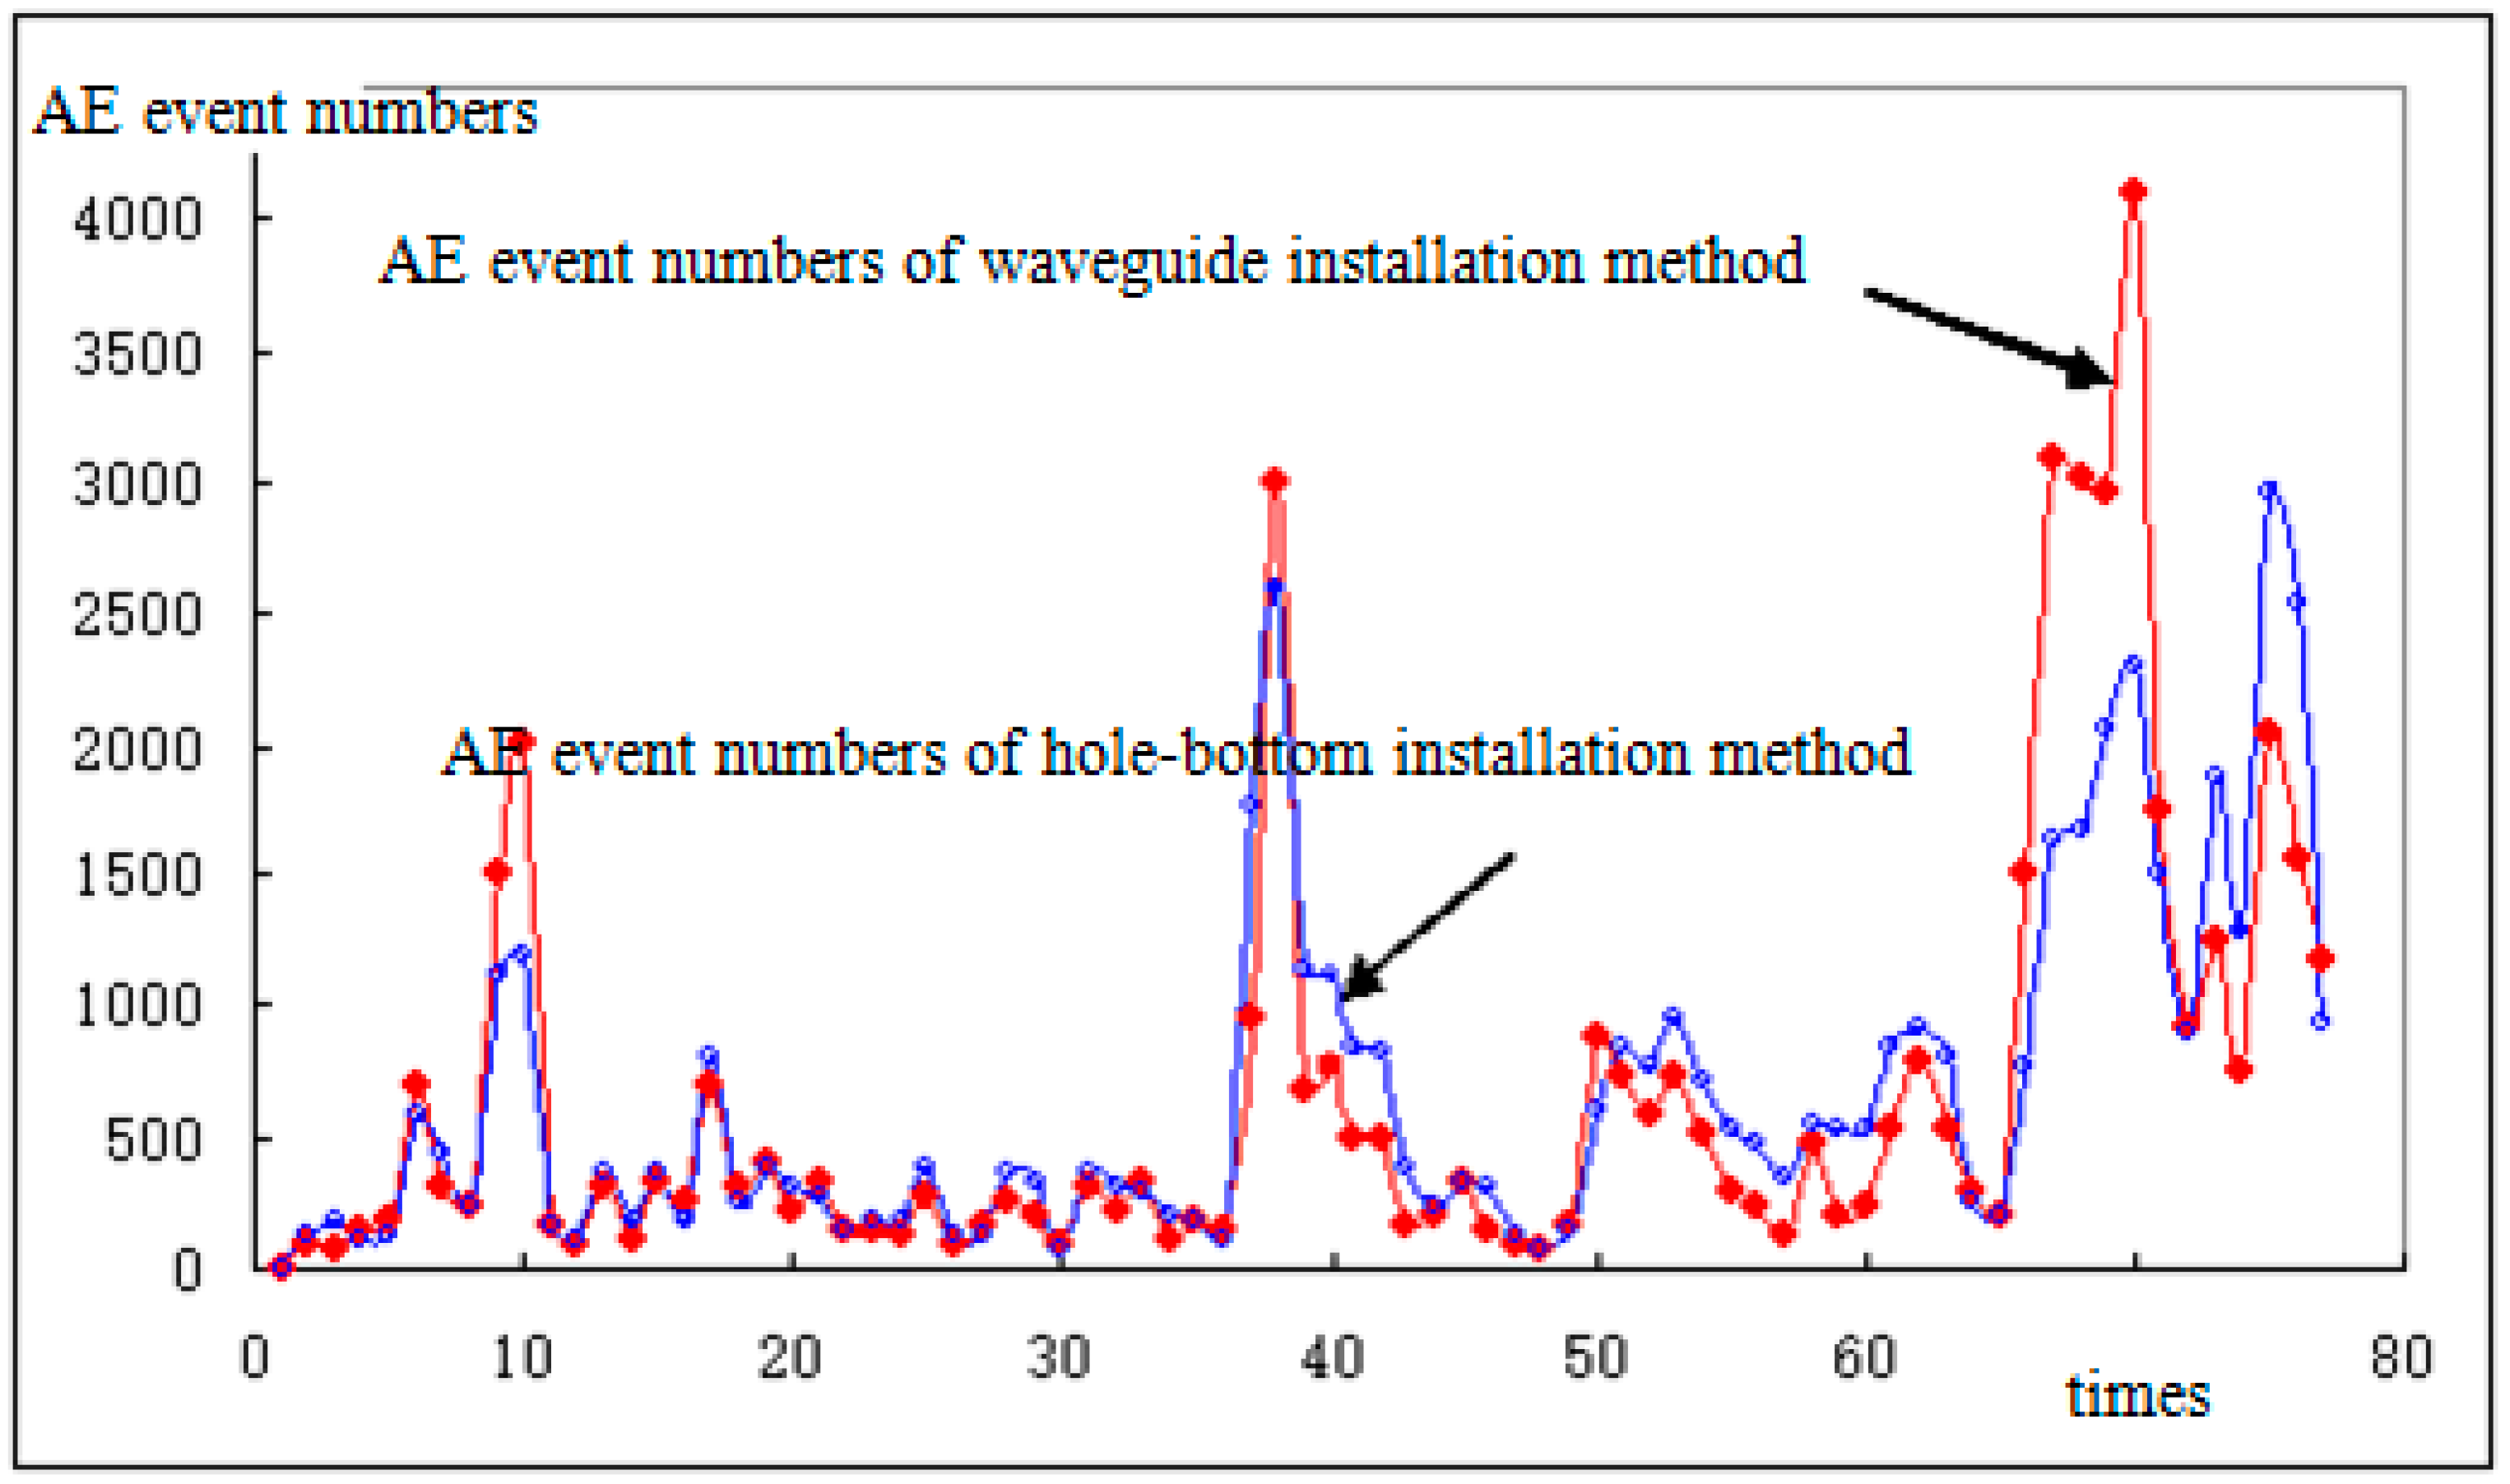
5. Effects of the Waveguide’s Installation Method on AE Proportion Rules

The installation of the AE sensor mainly includes three methods: coal surface installation, hole-bottom installation and waveguide installation. Among these three installation methods, hole-bottom installation is best in signal receiving, while the other installation methods are easy to use and the sensor is recyclable. However, for the sensor that was installed on the coal surface, the received AE signals would undergo strong attenuation due to the existence of a loose circle in the tunnel, which would seriously affect the receiving of effective signals. Thus, only hole–bottom installation and waveguide installation will be detailed below.
(1) Hole-Bottom Installation
Using this method, the sensors were generally installed in deep coals; they exhibited high sensitivity and a great effective distance of signal receiving. Figure 18 illustrates this installation method. A hole (φ42 mm) was drilled in the coal rib of the coalface, and the signal line was coated with the rubber hose (φ10 mm) for preventing coals from crushing the signal line after the hole collapses. Firstly, a small amount of yellow mud was added to the cement mortar, and the hole bottom was sealed by 0.5 m using the prepared cement mortar; then, the sensor was pressed in the cement mortar at the bottom of the hole and finally sealed by approximately 1m. The sensor was gradually compacted by the coals in a short period of time, which was then in solid contact with coals. Using this installation method, after the compaction of drilled holes, the sensor was slightly affected by the noise from external environment. The shortcoming of this method lies in the high cost. If the acquired safety benefit far exceeded the invested cost during the service period, then hole-bottom installation method would be regarded as the preferred method.
Practices have proven the following advantages and disadvantages of this installation method: great effective distance in signal receiving, high sensitivity, strong capability of disturbance resistance, easy for installation and implementation, but also, a difficulty in disassembly and the high cost.
(2) Wave-Installation
Figure 19 illustrates this hole-bottom installation method. Wave-installation can be regarded as a kind of orifice installation. In order to improve the AE signal’s receiving effects, favorable coupling between sensor and coal rock must be guaranteed, which can be realized through a waveguide. The one end of the waveguide is fixed with coals at the bottom of the hole, using some cohesive materials, and then, the signal is transmitted to the sensor via the waveguide. Due to the metal’s homogeneity, continuity, great elastic modulus and high stiffness, the signal was weakly attenuated and the waveguide showed favorable wave guiding function.
In order to reduce random noise and the noise caused by human activities around the sensor, the waveguide was penetrated through soft materials, such as the scrapped hose; meanwhile, the sensor was also coated with the hose for protection, so that the effects caused by the dropping of coals and water in the coal seam injection can be avoided. Additionally, soft materials exhibited remarkable noise insulation performances.
According to the practices, the waveguide installation method shows the following advantages and disadvantages: great effective distance in signal receiving, strong capability of disturbance resistance, being simple and quick in installation and implementation; simple processing technology and easy for disassembly for the sensor; but also, the angle should not be too large for inclined-hole installation, because otherwise, the fixation will be difficult.
Figure 20 and Figure 21 compare the AE signal temporal spectrum amplitude (AE signal amplitude are 3.0, 4.0, respectively when acceleration sensor was installed using waveguide installation and hole-bottom installation) and the AE event numbers between these two different installation methods, from which we can easily see that the AE signal receiving effects through the waveguide installation method are close to that of the hole-bottom installation. In other words, waveguide installation method can replace hole-bottom installation method (acceptable deviation value based on field experience).

6. Conclusions

The propagation of acoustic emission (AE) signal in waveguide is quite important for AE-based prediction of dynamic disasters in coal rocks. In this study, based on some relevant theories in wave mechanics, the elastic mechanical model of one-dimensional (1D) waveguide was first established, and the relationship between the AE source signal and the signal at the waveguide’s receiving end was derived. On the basis of theoretical analysis, numerical simulation and laboratory test schemes were designed; additionally, using the standard vibration source method, the AE response in different sizes of waveguides were investigated, the effects of waveguide size of waveguide were concluded, and the application conditions of the established theoretical model were clarified. Numerical simulation results fit well with the laboratory test results. Additionally, the effects of the sensor’s waveguide installation method and hole-bottom installation method were compared and appropriate installation method was determined.
(1)
This study firstly established the theory model of 1D elastic waveguide based on wave mechanics and then made some relevant assumptions. According to numerical simulation results, this elastic theory model is applicable to waveguides with a length smaller than 5 m and a diameter smaller than 40 mm.
(2)
According to numerical simulation and laboratory test results, the waveguide’s diameter imposed only a slight effect on the acceleration amplitude and the AE event number at the waveguide’s receiving end within a range of 5~40 mm.
(3)
According to numerical simulation and laboratory test results, the waveguide’s length imposed only a slight effect on the acceleration amplitude and the AE event number at the waveguide’s receiving end within a range of 0.5~5 m.
(4)
AE signal receiving effects through waveguide installation method are close to that of the hole-bottom installation, based on the AE signal temporal spectrum amplitude and AE event numbers. Therefore, the waveguide installation method can completely replace the hole-bottom installation method.

Acknowledgments

This work was financially supported by the National Key Research and Development Program of China (Grant No.: 2016YFC0801402), National Science and Technology Major Project of the Ministry of Science and Technology of China in the 13th Five-Year Period (Grant No.: 2016ZX05045-004), One Hundred Youth Talents Project of Shaanxi Province of China ,National Natural Science Foundation of China (Grant No.: 51404190) and Shaanxi Province Natural Science Foundation(Grant No.: 2017JM5115).

Author Contributions

Dong, G. and Zou, Y. conceived and designed the experiments; Dong, G. performed the experiments; Dong, G. and Zou, Y. analyzed the data; Dong, G. wrote the paper.

Conflicts of Interest

The authors declare no conflict of interest.

References

  1. Zou, Y.H. Monitoring of Coal and Gas Outbursts Using AE Technique; China Coal Technology Engineering Group Chongqing Research Institute: Chongqing, China, 2003. [Google Scholar]
  2. Yang, M.W. Acoustic Emission Detection; China Machine Press: Beijing, China, 2004; pp. 9–34. [Google Scholar]
  3. Katsuyama, K. Application of Acoustic Emission (AE) Technique; Metallurgical Industry Press: Beijing, China, 1996; pp. 12–48. [Google Scholar]
  4. Peng, X.M.; Sun, Y.H.; Li, A.N. Application Present of the Rock Acoustic Emission Technique. World Geol. 2000, 19, 303–306. [Google Scholar]
  5. Yuan, Z.M.; Ma, Y.K. Introduction of Acoustic Emission Technique and the Applications; China Machine Press: Beijing, China, 1985; pp. 5–27. [Google Scholar]
  6. Jiang, F.X.; Ye, G.X.; Wang, C.W.; Zhang, D.Y.; Guan, Y.Q. Application of High-precision Microseismic Monitoring Technique to Water Inrush Monitoring in Coal Mine. Chin. J. Rock Mech. Eng. 2008, 27, 1932–1938. [Google Scholar]
  7. Song, Y.L.; Wang, C.P.; Deng, Z.G.; Wang, Y.J. Study on Spreading Route of Micro-Seismic Initial Arrival Wave in Rock Strata. Coal Sci. Technol. 2012, 6, 15–18. [Google Scholar]
  8. Wang, Y.J.; Deng, Z.G.; Wang, C.P. Research on Improving the Precision of Seismic Event Location for Deep Well Mining. China Coal 2011, 12, 60–63+81. [Google Scholar]
  9. Xia, Y.X.; Kang, L.J.; Qi, Q.X.; Mao, D.B.; Ren, Y.; Lan, H.; Pan, J.F. Five Indexes of Microseismic and their Application in Rock Burst Forecasting. J. China Coal Soc. 2010, 35, 2011–2016. [Google Scholar]
  10. Xia, Y.X.; Lan, H.; Wei, X.Z. Study on Comprehensive Evaluation Technology for Rock Burst Hazard Based on Microseismic and Underground Sound Monitoring. J. China Coal Soc. 2011, 36, 358–364. [Google Scholar]
  11. Xia, Y.X.; Pan, J.F.; Wang, Y.J.; Zhang, Y. Study of Rule of Surrounding Rock Failure and Stress Distribution Based on High-precision Microseismic Monitoring. J. China Coal Soc. 2011, 36, 239–243. [Google Scholar]
  12. Xu, H.J.; Xia, Y.X.; Lan, H.; Liu, Z.P.; Liu, H. Application of Micro-seismic Activity Rule in Coal Mining. Coal Min. Technol. 2012, 17, 93–95+16. [Google Scholar]
  13. Zhang, Z.W.; Wang, Y.J.; Zhao, C.L.; Deng, Z.G.; Wang, C.P. Application of Micro Seismic and Ground Acoustic Emission Comprehensive Monitoring and Measuring to Prevention and Control of Mine Strata Pressure Bumping. Coal Sci. Technol. 2011, 39, 44–47. [Google Scholar]
  14. Zou, Y.H. A Study on Coal or Rock Acoustic Emission Mechanism and Relevant Experiments. J. Xiangtan Min. Inst. 2003, 3, 18–21. [Google Scholar]
  15. Zou, Y.H. Preliminary Study on Coal and Rock Acoustic Emission Mechanism and Relevant Experiments. Min. Saf. Environ. Prot. 2004, 31, 31–34. [Google Scholar]
  16. Zou, Y.H.; Wen, G.C.; Hu, Q.T.; Xu, J.P. Theory Analysis and Experimental Study of the Spread and Attenuation of Acoustic Emission in Rock Body. J. China Coal Soc. 2004, 29, 663–667. [Google Scholar]
  17. Zou, Y.H.; Zhao, X.S.; Liu, S. Research on Sound Transmitted Continued Prediction Technology for Coal and Gas Outburst. Coal Sci. Technol. 2005, 33, 61–65. [Google Scholar]
  18. Zhao, X.S. Noise Processing Method for Underground Dynamic Disaster with Sound Transmitting Monitoring and Measuring. Coal Sci. Technol. 2005, 33, 51–55. [Google Scholar]
  19. Zou, Y.H.; Dong, G.W.; Zhang, Q.H. Study on Propagation Law of Acoustic Emission Signal in Wave Guider. Min. Saf. Environ. Prot. 2007, 34, 13–15. [Google Scholar]
  20. Zou, Y.H.; Dong, G.W.; Zhang, Q.H.; Cheng, G.Q.; Lv, G.C.; Yang, H.M. One-dimensional Viscoelastic Wave Guide Theory Model in Acoustic Emission (AE) System. J. China Coal Ind. 2007, 32, 799–803. [Google Scholar]
  21. Zou, Y.H. Study of AE Signal Propagation Mechanism of Rock and Coal. Ph.D. Thesis, Shandong University of Science and Technology, Qingdao, China, June 2007. [Google Scholar]
  22. Zou, Y.H.; Dong, G.W.; Li, J.G.; Lv, G.C. Acoustic Emission (AE) Propagation Attenuation Theory and Rule in Wave Guide. J. China Coal Soc. 2008, 33, 648–651. [Google Scholar]
  23. Wen, G.C.; Yang, H.M.; Zou, Y.H. Theoretical Research on Propagation Law of Acoustic Emission Wave in Coal Seam Containing Gas. J. China Coal Soc. 2008, 33, 295–298. [Google Scholar]
  24. Lv, G.C.; Zou, Y.H.; Kang, J.N. Research on Technology of Acoustic Emission in Monitoring Coal Mine Disaster. Chin. J. Undergr. Space Eng. 2010, S2, 1720–1725. [Google Scholar]
  25. Wen, G.C.; Li, J.G.; Ju, Y.H.; Lv, G.C. Preliminary Study on the Application Conditions of Acoustic Emission Monitoring Dynamic Disasters in Coal and Rock. J. China Coal Soc. 2011, 36, 278–282. [Google Scholar]
  26. Li, H.Y. Study on the Location of Microseismic Earthquake and the Applications. Ph.D. Thesis, University of Science and Technology Beijing, Beijing, China, June 2006. [Google Scholar]
  27. Wang, C.W. Prediction and Prevention of Rockbursts Based on Microseismic Monitoring and Overlying Multi-Strata Spatial Structural Theory. Ph.D. Thesis, University of Science and Technology Beijing, Beijing, China, June 2008. [Google Scholar]
  28. Wang, C.W.; Jiang, F.X.; Wang, P.; Zhang, M. Microseismic Events Distribution Characteristics and Mechanical Mechanisms of Rock Bursting Induced by a Coal Pillar. J. China Coal Soc. 2009, 34, 1169–1173. [Google Scholar]
  29. Ye, G.X.; Jiang, F.X.; Guo, Y.H.; Wang, C.W. Experimental Research on Seismic Wave Attenuation by Field Microseismic Monitoring in a Deep Coal Mine. Chin. J. Rock Mech. Eng. 2007, 27, 1053–1058. [Google Scholar]
  30. Lv, J.G.; Pan, L. Microseismic Prediction of Coal Bump by Time Series Method. J. China Coal Soc. 2010, 35, 2002–2005. [Google Scholar]
  31. Liu, W.D.; Ding, E.J.; Tong, M.M. Sensor Array Position in Acoustic Emission Monitoring of Mining. Nondestruct. Test. 2010, 32, 338–341. [Google Scholar]
  32. Cao, A.Y.; Dou, L.M.; Qin, Y.H.; Li, Z.H.; Gong, S.Y.; Wang, Y.G. Characteristic of Microseismic Monitoring Signal in High Stressed Zone. J. Min. Saf. Eng. 2007, 2, 146–149+154. [Google Scholar]
  33. Gao, M.S.; Dou, L.M.; Zhang, N.; Mu, Z.L.; Wang, K.; Yang, B.S. Experimental Study on Earthquake Tremor for Transmitting Law of Rockburst in Geomaterials. Chin. J. Rock Mech. Eng. 2007, 26, 1365–1371. [Google Scholar]
  34. Gong, S.Y.; Dou, L.M.; Ma, X.P.; Mu, Z.L.; Lu, C.P. Optimization Algorithm of Network Configuration for Improving Location Accuracy of Microseism in Coal Mine. Chin. J. Rock Mech. Eng. 2012, 31, 8–17. [Google Scholar]
  35. Li, C.W.; Liu, J.K.; Wang, C.X.; Zhang, H.; Wang, T.T. Research on Spectrum Characteristics of Microseismic Signals Transmitted between Bedding in the Process of Coal Rock Outburst. Miner. Eng. Res. 2010, 4, 36–39. [Google Scholar]
  36. Liu, H.; Lu, C.P.; Dou, L.M.; Liu, B.; Du, B.B.; Wang, Y. Application of Microseismometry in Coal and Gas Outburst Monitoring and Forecasting. Saf. Coal Mines 2012, 4, 82–85. [Google Scholar]
  37. Lu, C.P.; Dou, L.M.; Wu, X.R.; Mou, Z.L.; Chen, G.X. Experimental and Empirical Research on Frequency-Spectrum Evolvement Rule of Rockburst Precursory Microseismic Signals of Coal-Rock. Chin. J. Rock Mechan. Eng. 2008, 27, 519–525. [Google Scholar]
  38. Tang, C.A.; Xu, X.H. Evolution and Propagation of Material Defects and Kaiser Effect Function. J. Seismol. Res. 1990, 13, 203–213. [Google Scholar]
  39. Sun, J.Z.; Zhou, J.; Tang, C.A. Factors Affecting Acoustic Emission of Rock. Crustal Deform. Earthq. 1997, 2, 3–7. [Google Scholar]
  40. Chen, Z.H.; Tang, C.A.; Xu, X.H.; Li, C.L. Theoretical and Experimental Studies for Kaiser Effect in Rock. Chin. J. Nonferrous Met. 1997, 2, 3–7. [Google Scholar]
  41. Liu, C.; Tang, C.A.; Zhang, S.J.; Li, G. Application of Microseismic Monitoring System for Mine Dynamic Disaster Relief. J. Liaoning Tech. Univ. 2009, 6, 929–932. [Google Scholar]
  42. Liu, C. Research on Hazard Mechanism and Microseismic Warning Method for Gas Dynamic Disasters of Mining Coal-Rock. Ph.D. Thesis, Dalian University of Technology, Dalian, China, June 2011. [Google Scholar]
  43. Duan, D. Analysis of Influencing Factors of Coal and Gas Outburst and Microseism Precursor. Ph.D. Thesis, Northeastern University, Boston, MA, UAS, June 2009. [Google Scholar]
  44. Yang, G.T. Elastokinetics; China Railway Publishing House: Beijing, China, 1995. [Google Scholar]
  45. Achenbach, J.D. Wave Propagation in Elastic Solids; Tongji University Press: Shanghai, China, 1992. [Google Scholar]
Figure 1. Mechanical model of one-dimensional (1D) elastic waveguide, in which A1, E1, P1 and C01 denote the coal rock’s cross sectional area, elastic modulus, density and stress wave velocity, respectively; A2, E2, P2 and C02 denote the finite elastic waveguide’s cross sectional area, elastic modulus, density and stress wave velocity, respectively; A3, E3, P3 and C03 denote the material’s cross sectional area, elastic modulus, density and stress wave velocity, respectively; I1, R1 and T1 denote the coal rock’s incident wave, reflected wave and transmitted wave, respectively; I2, R2 and T2 denote the wave guide’s incident wave, reflected wave and transmitted wave, respectively.
Sustainability 09 01209 g001
Figure 2. Source of sine wave.
Sustainability 09 01209 g002
Figure 3. Arrangement of measuring nodes in the simulations when diameter was set as different values.
Sustainability 09 01209 g003
Figure 4. Acceleration–time curves of different nodes when diameter = 5 mm.
Sustainability 09 01209 g004
Figure 5. Acceleration-time curves of different nodes when diameter = 10 mm.
Sustainability 09 01209 g005
Figure 6. Acceleration-time curves of different nodes when diameter = 20 mm.
Sustainability 09 01209 g006
Figure 7. Acceleration–time curves of different nodes when diameter = 40 mm.
Sustainability 09 01209 g007
Figure 8. Maxima of the absolute values of the acceleration amplitudes at different nodes when diameter = 5 mm, 10 mm, 20 mm and 40 mm, respectively.
Sustainability 09 01209 g008
Figure 9. Arrangement of measuring nodes in the simulations when L was set as different values.
Sustainability 09 01209 g009
Figure 10. Acceleration–time curves of different nodes when L = 0.5 m.
Sustainability 09 01209 g010
Figure 11. Acceleration–time curves of different nodes when L = 1 m.
Sustainability 09 01209 g011
Figure 12. Acceleration–time curves of different nodes when L = 3 m.
Sustainability 09 01209 g012
Figure 13. Acceleration–time curves of different nodes when L = 5 m.
Sustainability 09 01209 g013
Figure 14. Maxima of the absolute values of the acceleration amplitudes at different nodes when L = 0.5 m, 1 m, 3 m and 5 m, respectively.
Sustainability 09 01209 g014
Figure 15. Illustration of the laboratory tests on the acoustic emission (AE) propagation rules in waveguide.
Sustainability 09 01209 g015
Figure 16. Variation of AE event number with the waveguide’s length.
Sustainability 09 01209 g016
Figure 17. Variation of AE event number with the waveguide’s diameter.
Sustainability 09 01209 g017
Figure 18. Illustration of hole-bottom installation of sensor, in which 1,2,3,4 and 5 denote Rubber hose, Signal line, Drilled hole, Cement mortar and Hole-bottom sensor, respectively.
Sustainability 09 01209 g018
Figure 19. Illustration of hole-bottom installation of sensor, in which 1, 2, 3, 4 and 5 denote Sensor sleeve, Sensor, Drilled hole, Cement mortar and Hole-bottom sensor, respectively.
Sustainability 09 01209 g019
Figure 20. Comparison of the AE signal temporal spectrum between waveguide installation and hole-bottom installation.
Sustainability 09 01209 g020
Figure 21. Comparison of the AE event number between waveguide installation and hole-bottom installation.
Sustainability 09 01209 g021
Table 1. Material parameters in the model.
MaterialElastic Modulus (E/Gpa)Poisson’s RatioDensity (kg/m3)
Coal rock100.252500
Waveguide2000.27800
Table 2. Maxima of the absolute values of the acceleration amplitudes at different nodes when diameter = 5 mm, 10 mm, 20 mm and 40 mm, respectively.
Diameter of Waveguide (mm)ABCDE
51.12310.77020.15770.12770.1122
100.43080.23920.15280.12020.1121
200.25070.14660.14020.14280.1310
400.18550.14250.15770.11470.1113
Table 3. Maxima of the absolute values of the acceleration amplitudes at different nodes when L = 0.5 m, 1 m, 3 m and 5 m, respectively.
Maximum of the Absolute Value of the Acceleration Amplitude (m/s2)
Length of Waveguide (m)ABCDEFG
0.51.00620.656960.484680.18361
10.812940.514260.37770.203480.12437
30.766920.484120.350480.178870.0985590.081358
50.765630.485090.350050.178250.0921240.0695850.057397

