Methods for Converting Monthly Total Irradiance Data into Hourly Data to Estimate Electric Power Production from Photovoltaic Systems: A Comparative Study


1
Energy Resources Institute, Pukyong National University, Busan 608-737, Korea
2
Department of Energy Resources Engineering, Pukyong National University, Busan 608-737, Korea
*
Author to whom correspondence should be addressed.
Sustainability 2017, 9(7), 1234; https://doi.org/10.3390/su9071234
Submission received: 15 June 2017
/
Revised: 4 July 2017
/
Accepted: 11 July 2017
/
Published: 15 July 2017
(This article belongs to the Section Energy Sustainability)
Abstract
:Hourly irradiance values are essential data to reasonably estimate the electric power production (EPP) from a photovoltaic (PV) system. Worldwide monthly irradiance data are available from meteorological observation satellites; however, adequate hourly data are not widely available in developing countries or rural areas where PV systems are needed most. Aiming to supply such data, this study compared three different methods (i.e., sunshine hours mean, the SOLPOS algorithm, and the Duffie and Beckman algorithm) to convert the monthly accumulated irradiance data into hourly irradiance data. The monthly accumulated irradiance data at 11 sites in the United States and Korea, acquired from the National Renewable Energy Laboratory, were converted into hourly irradiance data by employing the three methods. The converted hourly data were entered into the System Advisor Model to estimate the monthly total EPP values (henceforth, EPPs) from the PV systems. Each estimated EPP value was compared with those analyzed from the measured hourly data (regarded as the reference values in this study). After considering the errors between the EPPs estimated from the converted hourly irradiance data and measured using the hourly irradiance data, the simulation results with identical PV capacities indicated that the SOLPOS algorithm was the most appropriate conversion method.
1. Introduction
An accurate estimation of electric power production (EPP) from a photovoltaic (PV) system, taking into account in-situ conditions, is an essential first step toward the design of a PV project. Various researchers have developed models and software that can be utilized to estimate EPP from a PV system [1,2,3,4,5,6,7,8,9]. These models and software are classified into two groups according to the type of input data used (i.e., monthly irradiance or hourly irradiance). PV*SOL [10], Polysun [11], INSEL [12], and RETScreen [13] software employ monthly irradiance values as input data to simulate EPP, whereas the System Advisor Model (SAM) [14], PVWatts [15], and PVsyst [16] software employ hourly irradiance data. Using hourly data is generally preferred for estimating the PV-based EPP, even when both monthly and hourly irradiance data are available in the region of interest. This is because the EPP results estimated from hourly data are generally more accurate and reliable than are those estimated from the monthly data [17]. In addition, using hourly irradiance data enables the estimation of hourly EPPs from the PV system and the consideration of the system load, a factor that could change by the hour in the economic evaluation process of a PV project [18].
The EnergyPlus website [19], operated by the United States (US) National Renewable Energy Laboratory (NREL) and supported by the US Department of Energy (DOE), provides various meteorological observation data, including hourly irradiance values for more than 2100 sites worldwide [19]. Using these hourly data and the aforementioned software, such as the SAM, PVWatts, and PVsyst, enables estimating the hourly EPP values (henceforth, EPPs) from the PV system. Most irradiance observation sites operated by EnergyPlus are distributed in the US, China, and European countries. However, there are no abundant irradiance observation systems present in most developing countries in Africa, South America, and South-East Asia. Thus, it is difficult to obtain adequate hourly irradiance data observed over a long time for such countries from the EnergyPlus website [19].
Conversely, it is relatively easier to secure monthly (mean or accumulated) irradiance data than hourly data in most countries worldwide, including developing countries. This is attributed to the US National Aeronautics and Space Administration (NASA) providing long-term observation data of the monthly worldwide irradiance by analyzing numerous satellite imageries including information of global meteorology [20]. In the case of Korea, hourly irradiance data are available only in a few major cities equipped with irradiance observation systems. However, monthly irradiance data are available across the entire region from the 1 km-resolution solar-energy resource map provided by the National Institute of Meteorological Research (NIMR) of Korea. If monthly irradiance data could be converted into hourly irradiance data at an appropriate confidence level, it would be possible to accurately estimate the hourly EPPs or the total monthly EPPs from such hourly data by employing the aforementioned software. Accordingly, this would help us evaluate the feasibility of a PV project in developing countries not equipped with an irradiance observation system.
Various researchers have studied methods of hourly irradiance estimation and have tried projecting the amount of available solar energy based on such irradiance data. Goh and Tan [21] employed probabilistic modeling to estimate future hourly irradiance, and Perez et al. [22,23,24] developed a model to estimate irradiance from global horizontal irradiance data (GHI) or diffuse horizontal irradiance data (DHI). Aguiar et al. [25] analyzed the association between the daily clearness index (CI) and the hourly CI, and conducted statistical analysis of hourly irradiance data at several sites. Santamouris et al. [26] performed comparative analysis of irradiance estimation models using cloudiness data. Zhang and Huang [27] suggested an hourly irradiance estimation model for China, considering meteorological information including local temperature, humidity, wind speed, and cloudiness. Gueymard [28,29,30] assessed the effect of CI on irradiance and proposed an irradiance estimation model. Recently, Benmouiza and Cheknane [31] modeled the pattern of clustered irradiance data and estimated hourly irradiance using this pattern.
Most previous studies have focused on developing simple models to estimate the future hourly irradiance from existing observed irradiance data. However, little attention has been paid toward examining the universal applicability of these models and, consequently, these models are not directly applicable to developing countries. Furthermore, an approach of solar resources estimation using model-based indicated (or inferred) hourly irradiance data (not measured data), has the limitation of inherent uncertainty owing to the low confidence level of the input data used [32]. Therefore, it is necessary to obtain hourly irradiance data at an adequate level of confidence to accurately estimate the EPP from a PV system in developing countries or rural areas. Several previous studies have estimated EPPs by using monthly irradiance data or hourly irradiance data obtained by simply dividing monthly or yearly accumulated irradiance by the total sunshine hours of the month or the year [33,34,35]. However, these approaches are limited, as they do not consider either the sunshine hours or the hourly variation of the irradiance value for the estimation of EPP. Moreover, few previous studies have compared the conversion methods for the measured monthly irradiance data and the resulting EPPs from the PV system.
The objective of this study is to compare the methods that convert the monthly accumulated irradiance data that are easily obtainable into hourly irradiance data. Toward this aim, three different conversion methods were applied to the irradiance dataset relevant to 11 sites in the US and Korea. These conversion methods are the sunshine hour mean, the SOLPOS algorithm [36], and the Duffie and Beckman algorithm [37]. Each converted hourly irradiance dataset was entered into the SAM to estimate the monthly EPPs from the PV system. The resulting EPPs were compared with the true EPPs analyzed from the measured hourly irradiance data in order to calculate the errors and to examine which method would be appropriate for data conversion. This is because, from the perspective of the feasibility of a PV project, it is more important to predict EPP in a monthly level than the hourly irradiance value. It is reasonable to apply the conversion method for the purpose mentioned above to the region where hourly data are unavailable, but monthly data are abundant. However, in this study, the region for which hourly data are available was selected because reference values (true irradiance or true EPPs) are necessary for error analysis in order to compare the conversion methods. This study did not compare the hourly irradiance data, converted from satellite-based monthly irradiance data, and the observed hourly irradiance data.
2. Data
In this study, hourly irradiance data, observed at seven sites in the US and four sites in Korea, were compiled for data conversion. The reason for selecting the US and Korea as study areas was to take into account both a country with abundant hourly irradiance data (US) and a country without such data (Korea). The latitude, longitude, and standard time zone (expressed as positive or negative offsets from Coordinated Universal Time (UTC)) of the 11 observation points are summarized in Table 1. To consider irradiances throughout the US, hourly irradiance data were acquired at seven sites located throughout the country. The data were statistical data (hourly irradiance values measured for 30 years, from 1981–2010) collected as part of the typical meteorological year (TMY) weather data of the NREL national solar radiation database (NSRDB) (Figure 1). In the case of Korea, four sites in major cities were selected to acquire hourly irradiance data, as only monthly data were available in the rural areas. The irradiance data for Korea were obtained from the EnergyPlus website and were processed by the Korean Solar Energy Society (KSES) [38].
3. Methods
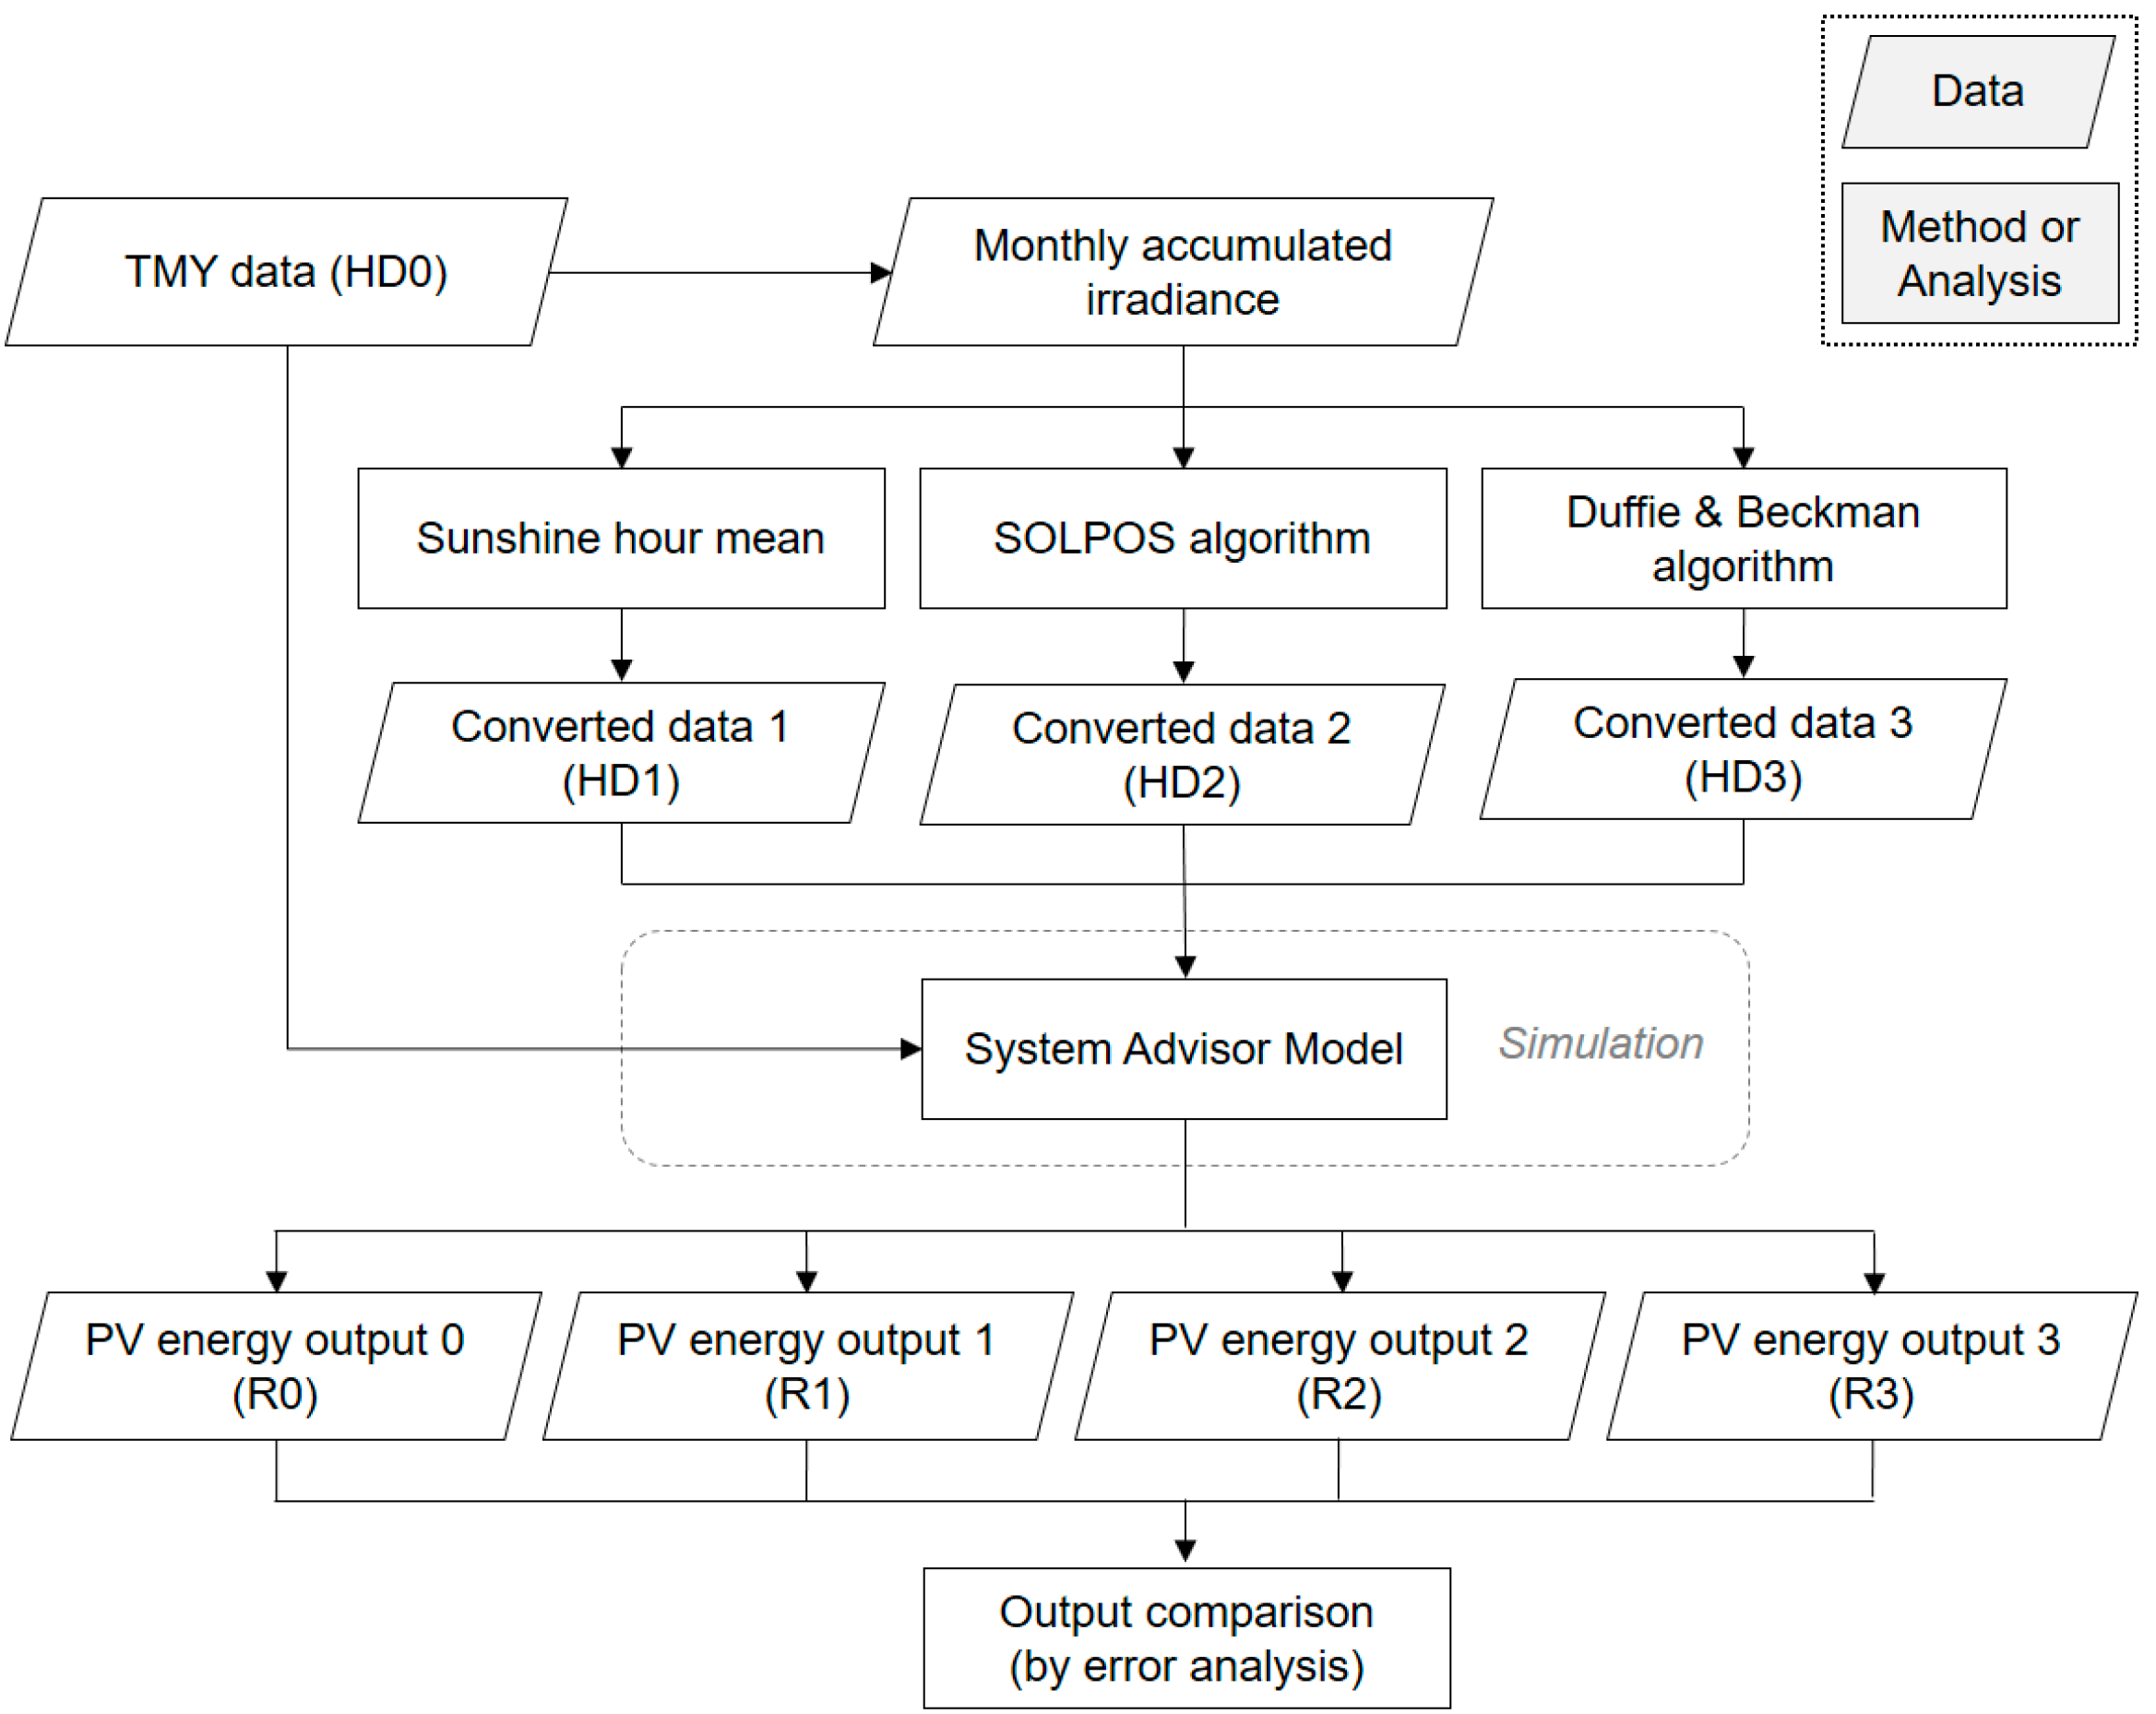
The flowchart employed to determine the most suitable method for converting the monthly accumulated irradiance data into hourly irradiance data is shown in Figure 2. First, the hourly irradiance data measured (code HD0) at each site and acquired from the TMY dataset were summed to produce the monthly accumulated irradiance data. Second, three different methods were applied to convert the monthly accumulated irradiance data into hourly irradiance data (HD1, HD2, and HD3). Third, the capacities of the PV system were designed by selecting the proper model of the PV modules and inverters and setting the parameters (e.g., direct current (DC) to alternating current (AC) ratio, tilt, azimuth, tracking), and the converted data were subsequently entered into the SAM software to estimate the monthly EPPs from the PV system (R1, R2, and R3). Fourth, for a quantitative comparison of the accuracy of the four estimated EPPs, the hourly measured irradiance data were entered into the SAM software to analyze the monthly EPPs from the identical-capacities PV system mentioned above (R0). The monthly EPPs from the identical-capacities PV system were regarded as true EPPs (reference values) in this study. Subsequently, the three conversion methods were compared in terms of the errors between the EPPs estimated from the converted hourly irradiance data and those from the measured hourly irradiance data.
3.1. Construction of Monthly Accumulated Irradiance Data
Hourly irradiance values for each month in the US and Korea were summed separately to produce each monthly accumulated irradiance dataset. This was done because the measured monthly accumulated irradiance data were not provided by the NREL NSRDB. In this study, the produced monthly accumulated irradiance data will be converted into hourly irradiance data to estimate the monthly EPPs.
3.2. Conversion of Monthly Accumulated Irradiance Data into Hourly Irradiance Data
As already mentioned, this study employed three different methods to convert the monthly data into hourly data, namely sunshine hour mean, the SOLPOS algorithm, and the Duffie and Beckman algorithm. These three methods commonly follow the equations:
where m is the month and h is the time (e.g., m = 3 and h = 10 refers to the month of March and the time 10 AM); GHIC indicates the converted global horizontal irradiance (GHI) at a specific month and hour (unit: W/m2); DNIC indicates the converted direct normal irradiance (DNI) at a specific month and hour (W/m2); A(m) indicates the formula for the monthly mean value; and F(m, h) indicates the formula for irradiance at a specific month and hour. Therefore, both A(m) and F(m, h) vary according to the conversion methods used. The DHI was not considered, as only two values (GHI and DNI) were required to simulate EPP using the SAM software. In order to calculate GHIC and DNIC, the observed accumulated GHI value for a specific month (∑GHI(m)) and the observed accumulated DNI value for a specific month (∑DNI(m)) were usually employed, respectively, for all three methods.
GHIC(m, h) = A(m) × F(m, h)
DNIC(m, h) = A’(m) × F’(m, h)
Although the sunshine hour mean method is a simplified way of upscaling the irradiance data and performing the EPP analysis, it was used in this study as a means of comparing the results against those estimated using the other approaches. The simple arithmetic mean method (which defines the converted hourly irradiance value as the ratio of the monthly accumulated irradiance to the total hours of the month) was not considered in this study since it is obviously not compatible with the SAM software. The irradiance values assigned in the non-sunshine hours (night time) were ignored in the simulation process by the SAM software.
3.2.1. Sunshine Hours Mean Method
The sunshine hours mean conversion method calculates the hourly irradiance value by dividing the monthly accumulated irradiance by the total sunshine hours in a month (Equations (3) and (5)). Originally, the term “sunshine hours” represented the duration (in hours) of direct solar irradiation that exceeded a DNI of 120 W/m2, and was closely associated with the EPP [39]. However, in this method, “sunshine hours” is defined as the total hours during the period from sunrise to sunset.
For GHI,
A(m) = ∑GHI(m)/∑ST(m)
F(m, h) = 1 or 0
For DNI,
where ∑ST(m) is the total sunshine hours of a specific month. This method differs from the simple arithmetic mean method, as it considers only the total hours during the period of sunshine hours. The formula for the irradiance value of F(m, h) or F’(m, h) equals zero for non-sunshine hours (irradiance value = 0) or one for sunshine hours (irradiance value > 0) in this method (Equations (4) and (6)). As such, ∑ST(m) is smaller than ∑T(m), and the value of A(m) is larger in the sunshine hours mean method than in the simple arithmetic mean method. Consequently, the converted hourly irradiance is assigned only to sunshine hours, whereas the hourly irradiance value of zero is assigned to the non-sunshine hours.
A’(m) = ∑DNI(m)/∑ST(m)
F’(m, h) = 1 or 0
The resulting converted hourly irradiance (GHIC or DNIC) is a constant value for every sunshine hour, as this method is unable to take into account the variation of irradiance within the duration period of sunshine hours. This method enables entering the monthly mean irradiance, with a consideration of both sunrise and sunset times, into the PV software that uses hourly data to analyze the EPP.
3.2.2. SOLPOS Algorithm
The SOLPOS algorithm provides estimation results of hourly irradiances GHIS(m, h) and DNIS(m, h)) by calculating the apparent solar position and intensity based on the date, time, and location in clear-sky conditions. This is done by considering the extraterrestrial radiation, earth radius vector [36], and the refracted solar zenith angle [40]. The converted hourly irradiance values can be obtained by using the following equations:
For GHI,
A(m) = ∑GHI(m)/∑GHIS(m, h)
F(m, h) = GHIS(m, h)
For DNI,
where GHIS(m, h) indicates GHI at a specific month and hour, DNIS(m, h) indicates DNI at a specific month and hour, and both values are calculated by the SOLPOS algorithm. For further details of the theories and calculation processes pertaining to the SOLPOS algorithm, please refer to Iqbal [36].
A’(m) = ∑DNI(m)/∑DNIS(m, h)
F’(m, h) = DNIS(m, h)
3.2.3. Duffie and Beckman Algorithm
The Duffie and Beckman algorithm is used for the RETScreen software, which employs monthly accumulated irradiance values as input data to simulate monthly total EPP. This algorithm calculates the hourly irradiance on the horizontal surface relevant to all the hours of an average day with the same daily global radiation as the monthly mean [37]. This algorithm provides the estimation results of hourly irradiances (GHIDB(m, h) and DNIDB(m, h)) by breaking down the monthly mean daily radiation using the Collares-Pereira and Rabl model for global irradiance [41] and the sunset hour angle (solar hour angle corresponding to the time when the sun sets) in the clear-sky condition. The converted hourly irradiance values can be obtained by using the following equations:
For GHI,
A(m) = ∑GHI(m)/∑GHIDB(m, h),
F(m, h) = GHIDB(m, h),
For DNI,
where GHIDB(m, h) indicates GHI at a specific month and hour, DNIDB(m, h) indicates DNI at a specific month and hour, and both values are calculated by the Duffie and Beckman algorithm. As both the numerator and the denominator in Equations (11) and (13) are constant values, the resulting A(m) is a constant value. However, F(m, h) depends on the specific month and hour and, therefore, the resulting converted hourly irradiance value (GHI or DNI) varies according to the time change. For further details of the theories and calculation processes pertaining to the Duffie and Beckman algorithm, please refer to Duffie and Beckman [37].
A’(m) = ∑DNI(m)/∑DNIDB(m, h),
F’(m, h) = DNIDB(m, h),
3.3. Simulation of PV Electricity Power Generation
In this study, PV-based EPPs were simulated with SAM software to determine the accuracy of the converted hourly irradiance data. The PV module of SAM software simulates the performances of a PV system by combining the module and the inverter sub-models to calculate the hourly output of the PV power system. Such calculation takes into account the weather file and the data describing the physical characteristics of the module, inverter, and array. As the SAM PV module employs hourly irradiance as the input data, it enables an hourly simulation of EPPs and a detailed design for the PV system. For further details on the PV module of SAM software and the system design process, please refer to Choi and Song [35].
Four different monthly EPPs (R1–R3) were estimated by separately incorporating the three differently converted hourly irradiance datasets into a PV system with identical capacity in order to compare the conversion methods. Different optimal installation angles for the fixed-tilt PV array were set for each observation point based on the latitude (e.g., 40.983° N for Arcata Airport). The cell temperature of each observation point was automatically estimated using ambient temperature and wind speed data of the TMY weather data in the simulation process of the SAM software, assuming that the temperature of the cells in all of the modules in each subarray was uniform [42]. The parameter values of the module, inverter, and system design are listed in Table 2. To evaluate and compare the accuracy of the converted data, the measured hourly irradiance values, as true irradiance values (reference values), were entered into the system to analyze the EPP under the identical conditions indicated above.
3.4. Comparison of Errors in PV Electricity Power Generation
An error test was conducted to quantitatively evaluate and validate the four conversion methods. Errors were calculated by subtracting the true EPPs (R0) from the EPPs estimated from the converted hourly data (R1–R3). Smaller errors indicate that the converted hourly data are accurate and the conversion method is appropriate. The study employed the root mean square error (RMSE), mean bias error (MBE), and mean absolute percentage error (MAPE) statistical test methods using the following equations:
where n indicates the number of data used, and et indicates the difference between the EPP estimated from the converted hourly irradiance data (xt) and the EPP analyzed from the measured hourly irradiance data (yt). The errors relevant to the US and Korea were calculated separately in this study.
4. Results and Discussion
4.1. Results of Constructed Monthly Accumulated Irradiance Data
The monthly accumulated irradiances calculated (kWh·m−2·month−1) at the seven sites in the US and the four sites in Korea are summarized in Table 3. The results show that the monthly accumulated irradiance measured at the seven sites in the US was highest in June and July, with Los Angeles having the highest annually accumulated irradiance of 1824 kWh·m−2·year−1, and Arcata (California) having the lowest annually accumulated irradiance of 1412 kWh·m−2·year−1. In Korea, the measured monthly accumulated irradiance from the four sites was highest in May and June. Daejeon was observed to have the highest annually accumulated irradiance of 1367 kWh·m−2·year−1, whereas Ulsan had the lowest annually accumulated irradiance of 1231 kWh·m−2·year−1. The monthly accumulated irradiances were found to be high in the spring season in Korea, although the altitude of the sun and the number of sunshine hours are higher in summer. This result can be ascribed to Korea generally having long rainy spells and typhoons in July and August (the summer months).
4.2. Results of Converted Hourly Irradiance Data
Figure 3 shows the graph of the converted hourly irradiance values for Denver in the US according to the three different methods. This study selected Denver as no distinct differences were found among the general patterns of the converted hourly data at the seven sites in the US. Although the yearly or monthly accumulated irradiances derived by either the sunshine hour mean method or the SOLPOS algorithm equal the summation of the measured hourly irradiance for each observation site in Table 3, the irradiance graphs looks different in the converted data for a year, as shown in Figure 3a. This is ascribed to the irregular changing patterns, such as the large variations of measured hourly irradiance for hours 6–18, as presented in Figure 3c. These patterns are associated with heavy rainfall and a large amount of cloud.
Although the Duffie and Beckman algorithm utilizes monthly accumulated irradiance data derived from hourly irradiance data, the yearly accumulated irradiances of the method were not equal to the accumulated values of hourly irradiance measured in a year owing to the coefficients used for the conversion. Moreover, the concave irradiance patterns in a month (HD3 in Figure 3a) estimated from this conversion method differed from those analyzed from the measured hourly irradiance. This pattern is associated with the average daily irradiance utilized to calculate hourly value. In general, the daily irradiance value starts increasing within a month after the winter solstice and continues doing so until the summer solstice season ends. To break down monthly irradiance values into hourly values, the Duffie and Beckman algorithm firstly calculates average daily irradiance (identically divided daily irradiance in a month) by dividing monthly accumulated irradiance (input data) by the day of the month (HD3 in Figure 3b), and subsequently obtains hourly values using the average daily irradiance values using the global irradiance formulae provided by Collares-Pereira and Rabl [41]. From the beginning of the month to its end, low GHI in the morning and afternoon increase, whereas high GHI at noon decreases, provided the accumulated monthly irradiance values are identical.
Regarding the results for HD1, HD2, and HD3, the drastically changing hourly irradiance pattern indicates discontinuities at the boundary between two consecutive months (Figure 3a). This is ascribed to the differences of accumulated irradiance inputs between two months. In practice, the difference of GHI between 2 PM on 31 January and 2 PM on 1 February might be very small under similar weather conditions. However, hourly GHI was calculated by applying the conversion algorithm to the monthly accumulated irradiances summarized in Table 3. For example, this study utilized each representative accumulated irradiance for each month (i.e., 52 for January and 75 for February), to convert monthly irradiance into hourly irradiance. As such, the input data of the different monthly accumulated irradiances could result in considerable differences of converted hourly GHI between two consecutive months.
The result from the sunshine hour mean method (HD1, shown as the green line) indicates constant hourly irradiance values only within the period of sunshine. An hourly irradiance value of zero was calculated between approximately 6 PM and 6 AM (Non-sunshine hours). The results from the SOLPOS algorithm (HD2, seen as the blue line) and the Duffie and Beckman algorithm (HD3, seen in the grey line) show changing patterns of hourly irradiance similar to those of the measured hourly data for hours 30–42 and 54–66 (which might have experienced clear-sky conditions) presented in Figure 3c. This result is ascribed to the fact that both methods consider the variation in irradiance within the period of sunshine (duration) based on nearly the exact position of the sun in their calculations of the hourly irradiance values. This is verified by noting that the hourly irradiance values between 10 AM and 2 PM are higher compared with those between 6 AM and 10 AM and those from 2 PM to 6 PM (Figure 3c). However, as mentioned above, large variations in measured hourly irradiance were observed in hours 6–18. These variations can be interpreted as unexpected patterns associated with heavy rainfall and an amount of cloud. In view of the aforementioned, the difficulty of determining the most appropriate conversion method by interpreting only the graphs seen above is apparent.
From the results in Table 4, it is evident that the sunshine hour mean method showed higher errors values in two types of errors in both countries, as compared with those of the SOLPOS algorithm and Duffie and Beckman algorithm. However, it is unclear which conversion method is the most appropriate conversion method by interpreting only the error estimation of the converted hourly irradiance. In general, irradiance values measured at the time around sunrise or sunset are considerably lower than converted irradiance values (xt) at the same time. These very small measured hourly irradiance values (yt) may result in a high value of MAPE. As mentioned above, from the perspective of feasibility of a PV project, it is more important to analyze EPP than hourly irradiance value. Therefore, it was necessary to simulate the monthly EPPs and to analyze their errors to compare the validity of all the converted data.
4.3. Results of PV Electricity Power Simulation
Figure 4a shows the estimated monthly EPPs using the measured hourly irradiance data and three differently converted hourly irradiance data for Denver in the US. The monthly EPPs analyzed from the measured hourly data (R0), shown by the red dotted line, were regarded as the true EPPs (reference values). Monthly estimated EPPs differed according to the conversion method used even though the inputted monthly accumulated irradiance was identical (conserved) for all methods. Basically, the difference of the monthly estimated EPPs can be ascribed to the fact that the hourly EPPs were not linearly proportional to the inputted hourly irradiance values. Detailed equations to calculate power output of modules in the SAM software can be found in Gilman [42].
The result from the sunshine hours mean method (R1) showed changing patterns of EPPs different from those of the true EPPs. Specifically, substantial differences of EPPs and their changing patterns were found for March–April and August–December. The result from the SOLPOS algorithm (R2) showed monthly EPPs and changing patterns highly similar to those obtained from the measured hourly data. Although the results obtained from the Duffie and Beckman algorithm (R3) also showed changing patterns of EPPs roughly similar to those from the measured hourly data, in general, the distinct differences between the EPPs of R1 and R3 exist in most months.
Figure 4b shows the estimated monthly EPPs obtained from the measured hourly irradiance data and three different converted hourly irradiance datasets for Daejeon in Korea. It was observed that the EPPs and their changing patterns obtained with the three datasets are similar to those of Denver. However, the EPPs obtained from the Duffie and Beckman algorithm (R3) are overestimated for all 12 months compared with the true EPPs from the measured hourly data.
4.4. Comparison of Errors in Estimated PV Output
4.4.1. Errors in Estimated PV Output in the US
Figure 4 enables a comparison of the changing patterns of the monthly EPPs estimated from the three different irradiance datasets. However, it is difficult to determine quantitatively which converted hourly irradiance values coincide with the true hourly irradiance values by using only these graphs. Therefore, error calculation and comparative analysis were additionally performed in this study.
Figure 5 shows the distributions of 84 estimated monthly EPPs from a 10 kWp PV system using three converted hourly irradiance datasets and measured hourly irradiance data acquired at seven sites in the US. The grey diagonal line represents the true EPPs, and several symbols describe the EPPs estimated by the three converted hourly irradiance datasets. Accordingly, by analyzing the coincidence (the distance, in this case) of the grey line and the distributions of the symbols, the errors in the estimated EPPs obtained with the three methods were calculated and each conversion method was validated.
The calculation results of the RMSE, MBE, and MAPE for the energy output of the US are summarized in Table 5. In the case of the sunshine hours mean method, the monthly EPP data, presented via the triangle symbols (R1), are spread out across the line plotting the true EPPs (Figure 5a), and the R2 is approximately 0.41. These results indicate high deviation and low correlation between the results. In addition, the high MAPE value of 11.88% is ascribed to the fact that the sunshine hours mean method does not take into account actual variation of irradiance within the period of sunshine (duration) in converting monthly data into hourly data. The distribution of the EPP data, presented by the rectangle symbols, from the SOLPOS algorithm (R2) is considerably similar to that of the true EPPs along the grey line (Figure 5b). All three types of errors (RMSE: 46.63 kWh/month, MBE: 10.09 kWh/month, and MAPE: 2.71%) from the SOLPOS algorithm are the smallest among the errors resulting from the three results by the three conversion methods. The calculated MAPE value indicates that it was possible to estimate the monthly EPPs with an error of less than 2.71% by using the converted hourly irradiance data and without the measured hourly irradiance data. This indicates that the results from the SOLPOS algorithm closely follow the true monthly EPPs simulated by the measured hourly data. Although the result of the Duffie and Beckman algorithm (R3), indicated by the diamond symbols, also show patterns similar to those of the true monthly EPPs in Figure 5c, two types of errors are larger in R3 than in R2 (RMSE: 78.83 kWh/month and MAPE: 6.40%).
In the case of the US, most of the error values from the SOLPOS algorithm are the smallest among the errors from the three results. The Duffie and Beckman algorithm and the sunshine hour mean results are arranged in order of the error values. The results of the changing patterns of monthly EPPs and the two types of errors confirm, as expected that the SOLPOS algorithm is the most suitable conversion method for the US.
4.4.2. Errors in Estimated PV Output in Korea
Figure 6 shows the distributions of 48 estimated monthly EPPs from a 10 kWp PV system using the three converted hourly irradiance datasets and the measured hourly irradiance data acquired at four sites in Korea. All the symbols used were identical to those of Figure 5. The calculation results of the RMSE, MBE, and MAPE for the energy output of Korea are summarized in Table 6.
Overall, the results for Korea are similar to those of the US. The result from the sunshine hour mean method also shows a low degree of precision, with large errors based on the calculated RMSE and MAPE. This method shows the smallest MBE among the three results. This indicates the summation of the bias error values for the 48 datasets is the smallest provided each bias error for a certain EPP dataset is either positive or negative. However, this may be coincidental because the difference between each estimated EPP and each true EPP is obvious for all the 48 datasets, as shown in Figure 6a. The SOLPOS algorithm shows results similar to those of the true EPPs, and this algorithm is confirmed, as expected as the most appropriate conversion method for Korea. In contrast with the values for the US, the results of the monthly EPPs calculated from the Duffie and Beckman algorithm are obviously overestimated, as indicated by all the EPP data (diamond symbols) being distributed above the grey line in Figure 6c.
The RMSE and MAPE values of the SOLPOS algorithm are the smallest. The Duffie and Beckman algorithm and sunshine hour mean results are arranged in order of error values. Furthermore, as mentioned above, the results of the sunshine hour mean method are spread out across the line plotting the true EPPs, and the Duffie and Beckman algorithm and monthly irradiance data obviously provide/show overestimated results.
As mentioned before, in terms of the calculated MAPE values for the EPPs in both US and Korea cases, the SOLPOS algorithm, Duffie and Beckman algorithm, and Sunshine hour mean method can estimate the monthly EPPs with an error of less than 2.71%, 8.08%, and 11.88% by converting hourly irradiance data from the monthly data. Conversely, it can be interpreted that the SOLPOS algorithm, Duffie and Beckman algorithm, and Sunshine hour mean method yielded a prediction accuracy of approximately 98%, 93%, and 88% respectively without the measured hourly irradiance data. Taking into account only the above prediction accuracies for the US and Korea cases, the accuracy of the SOLPOS algorithm is approximately 1.05 times and 1.11 times that of the Duffie and Beckman algorithm and Sunshine mean hour method.
It is evident from Figure 5 and Figure 6 that the Duffie and Beckman algorithm shows high values of the determination factor (R2 > 0.88), which indicates similar patterns or high correlation between the estimated EPPs and the true EPPs. However, the linear regression equations derived for the US and Korea are different. Moreover, it is difficult to confirm that either of these equations would be appropriate for developing countries or rural areas. Consequently, the equation above could not be applied directly to developing countries or rural areas, where measured data on hourly irradiance are unavailable. In contrast, the result from the SOLPOS algorithm shows R2 of more than 0.93 and MAPE of less than 2.72% for both the US and Korea. Consequently, it is feasible to use the converted hourly irradiance data as an alternative to the measured hourly irradiance data (i.e., TMY data) even in other countries.
Although Iqbal [36] and Natural Resources Canada [13] provide other validation results of the SOLPOS and Duffie and Beckman algorithms compared with an hourly model, their findings are not directly comparable to the results of the errors in Table 4 and Table 5 in this study. This is because this study validated the EPP results (not GHI values) with those estimated from measured hourly values, whereas the other studies (original document) using both algorithms validated GHI values with those from an hourly model.
5. Conclusions
This study used the sunshine hour mean method, SOLPOS algorithm, and Duffie and Beckman algorithm to convert monthly irradiance data into hourly irradiance data, and to estimate the monthly EPPs from the PV system at seven sites in the US and four sites in Korea. Three estimated monthly EPPs were compared with those analyzed from the measured hourly irradiance data. Similar results were derived for both countries. In the sunshine hours mean method, the estimated monthly EPPs data were spread out over the graph line of the true EPPs. The result from the SOLPOS algorithm showed that the monthly EPP patterns were highly similar to those of the true EPPs, and low error-value ranges (1.78–2.71%) were generated. This is ascribed to the fact that the SOLPOS method takes into consideration the variation of irradiance within the period of sunshine, based on the position of the sun. The prediction accuracy of the SOLPOS algorithm was approximately 1.05 times and 1.11 times that of the Duffie and Beckman algorithm and sunshine mean hour method. However, as regards the Duffie and Beckman algorithm, the EPPs were overestimated compared with the true EPPs, and the errors were larger than those of the SOLPOS algorithm. Therefore, it could be concluded that it is reasonable to adopt the SOLPOS algorithm to convert the monthly data into hourly data in a feasibility study or the initial design of a PV system in the US and Korea, rather than use the sunshine hour mean method or the Duffie and Beckman algorithm (RETScreen software).
It should be noted that the ranking of the estimation results of the EPPs could change if the metric of interest was alignment during certain key times rather than monthly average EPP. Even though the results for the US and Korea were similar in this study, it is still necessary to conduct additional case studies for other countries in low latitude to ensure the universal applicability and reliability of the conversion methods (e.g., to check whether the estimation of the EPPs may vary according to the latitude of the country). Furthermore, with regard to utilizing the Sandia Array model in the SAM software, it would be interesting to alternatively employ the CEC module with its commonly used database (given its large library), to calculate hourly efficiency values in future studies. The SOLPOS algorithm can be utilized to estimate the monthly EPPs accurately and to assess the feasibility of the PV system reasonably. This can be easily done by converting the acquirable monthly irradiance data into hourly irradiance data in developing countries where measured hourly data and observation systems are unavailable.
The suggested approach may not yield the accurate estimation of EPP at peak hours or hours of interest. In addition, the converted hourly irradiance data cannot substitute for measured hourly irradiance data to estimate hourly EPP toward designing a solar PV project owing to reasons such as unpredictable weather conditions and uncertainties, as seen in Figure 3c. As such, ideally, reliable measured hourly (not monthly) data should be utilized to design hourly based metrics and activities such as net metering and battery/storage implications for smart grid systems in the initial stage of solar PV projects, if hourly data are available.
Acknowledgments
This research was supported by the Basic Science Research Program through the National Research Foundation of Korea (NRF) funded by the Ministry of Education (2015R1D1A1A01061290).
Author Contributions
Yosoon Choi conceived and designed the simulation; Jangwon Suh and Yosoon Choi performed the simulation and analyzed the data; Jangwon Suh and Yosoon Choi wrote the paper.
Conflicts of Interest
The authors declare no conflict of interest.
Abbreviations
| EPP | Electric power production |
| PV | Photovoltaics |
| SAM | System Advisor Model |
| US | United States |
| NREL | National Renewable Energy Laboratory |
| DOE | Department of Energy |
| NSSA | National Aeronautics and Space Administration |
| NIMR | National Institute of Meteorological Research |
| GHI | Global horizontal irradiance |
| DHI | Diffuse horizontal irradiance |
| DNI | Direct normal irradiance |
| CI | Clearness index |
| UTC | Coordinated Universal Time |
| TMY | Typical meteorological year |
| NSRDB | NREL national solar radiation database |
| KSES | Korean Solar Energy Society |
| HD0 | Measured hourly irradiance data |
| HD1 | Hourly irradiance data converted from monthly accumulated irradiance data using Sunshine hour mean method |
| HD2 | Hourly irradiance data converted from monthly accumulated irradiance data using SOLPOS algorithm |
| HD3 | Hourly irradiance data converted from monthly accumulated irradiance data using Duffie and Beckman algorithm |
| R0 | Measured monthly electric power productions from the PV system using HD0 (TMY data) |
| R1 | Estimated monthly electric power productions from the PV system using HD1 (Sunshine hour mean) |
| R2 | Estimated monthly electric power productions from the PV system using HD2 (SOLPIS) |
| R3 | Estimated monthly electric power productions from the PV system using HD3 (Duffie and Beckman) |
| RMSE | Root mean square error |
| MBE | Mean bias error |
| MAPE | Mean absolute percentage error |
References
- Evans, D.L.; Facinelli, W.A.; Koehler, L.P. Simulation and Simplified Design Studies of Photovoltaic Systems; Sandia National Laboratories: Albuquerque, NM, USA, 1980.
- Gilman, P.; Blair, N.; Mehos, M.; Christensen, C.; Janzou, S.; Cameron, C. Solar Advisor Model. User Guide for Version 2.0; National Renewable Energy Laboratory: Golden, CO, USA, 2008.
- King, D.L.; Boyson, W.E.; Kratochvil, J.A. Photovoltaic Array Performance Model; Sandia National Laboratories: Albuquerque, NM, USA, 2004.
- Marion, B.; Andergerg, M.; Gray-Hann, P.; Heimiller, D. PVWATTS Version2-Enhanced Spatial Resolution for Calculating Grid-Connected PV Performance: Preprint; National Renewable Energy Laboratory: Golden, CO, USA, 2001.
- Menicucci, D.F. Photovoltaic array performance simulation models. J. Sol. Cells 1986, 18, 383–392. [Google Scholar] [CrossRef]
- Muñoz, J.; Marroyo, L.; Collares-Pereira, M.; Tyutyuyndzhiev, N.; Conlon, M.; El Moussaoui, A.; Wilkin, B. An open-source simulation tool of grid-connected PV systems. In Proceedings of the 28th European Photovoltaic Solar Energy Conference and Exhibition, Villepinte, Paris, France, 30 September–4 October 2013. [Google Scholar]
- Minister of Natural Resources Canada (MNRC). Photovoltaic Projects Analysis Chapter, Clean Energy Project Analysis: RETScreen Engineering & Cases Text Book; Ministry Natural Resources Canada: Goulais River, ON, Canada, 2003.
- Maui Solar Energy Software Corporation (MSESC). Available online: http://wwww.mauisolarsoftware.com (accessed on 15 June 2017).
- Perez, R.; Reed, R.; Hoff, T. Validation of a simplified PV simulation engine. Sol. Energy 2004, 77, 357–362. [Google Scholar] [CrossRef]
- Valentin Software. Available online: http://www.valentin-software.com (accessed on 15 June 2017).
- Vela Solaris. Available online: http://www.velasolaris.com (accessed on 15 June 2017).
- Insel. Available online: http://www.insel.eu (accessed on 15 June 2017).
- Natural Resources Canada. Available online: http://www.nrcan.gc.ca/energy/software-tools/7465 (accessed on 15 June 2017).
- National Renewable Energy Laboratory (NREL). Available online: https://sam.nrel.gov (accessed on 15 June 2017).
- National Renewable Energy Laboratory (NREL). Available online: http://pvwatts.nrel.gov (accessed on 15 June 2017).
- PVsyst. Available online: http://www.pvsyst.com (accessed on 15 June 2017).
- Dimas, F.A.; Gilani, S.I.; Aris, M.S. Hourly Solar Radiation Estimation from Limited Meteorological Data to Complete Missing Solar Radiation Data. In Proceedings of the International Conference on Environment Science and Engineering, Singapore, 1–3 April 2011. [Google Scholar]
- Reikard, G. Predicting solar radiation at high resolutions: A comparison of time series forecasts. Sol. Energy 2009, 83, 342–349. [Google Scholar] [CrossRef]
- EnergyPlus. Available online: https://www.energyplus.net/weather (accessed on 15 June 2017).
- National Aeronautics and Space Administration (NASA). Available online: https://eosweb.larc.nasa.gov/cgi-bin/sse/global.cgi (accessed on 15 June 2017).
- Goh, T.N.; Tan, K.J. Stochastic modeling and forecasting of solar radiation data. Sol. Energy 1977, 19, 755–757. [Google Scholar] [CrossRef]
- Perez, R.; Seals, R.; Ineichen, P.; Stewart, R.; Menicucci, D. A new simplified version of the perez diffuse irradiance model for tilted surfaces. Sol. Energy 1987, 39, 221–231. [Google Scholar] [CrossRef]
- Perez, R.; Ineichen, P.; Seals, R.; Michalsky, J.; Stewart, R. Modeling daylight availability and irradiance components from direct and global irradiance. Sol. Energy 1990, 44, 271–289. [Google Scholar] [CrossRef]
- Perez, R.; Moore, K.; Wilcox, S.; Renné, D.; Zelenka, A. Forecasting solar radiation—Preliminary evaluation of an approach based upon the national forecast database. Sol. Energy 2007, 81, 809–812. [Google Scholar] [CrossRef]
- Aguiar, R.; Collares-Pereira, M. Statistical properties of hourly global radiation. Sol. Energy 1992, 48, 157–167. [Google Scholar] [CrossRef]
- Santamouris, M.; Mihalakakou, G.; Psiloglou, B.; Eftaxias, G.; Asimakopoulos, D.N. Modeling the global solar radiation on the earth’s surface using atmospheric deterministic and intelligent data-driven techniques. J. Clim. 1999, 12, 3105–3116. [Google Scholar] [CrossRef]
- Zhang, Q.Y.; Huang, Y.J. Development of typical year weather files for Chinese locations. ASHRAE Trans. 2002, 108, 1063–1075. [Google Scholar]
- Gueymard, C.A. Direct solar transmittance and irradiance predictions with broadband models. Part II: Validation with high-quality measurements. Sol. Energy 2003, 74, 381–395. [Google Scholar] [CrossRef]
- Gueymard, C.A. Importance of atmospheric turbidity and associated uncertainties in solar radiation and luminous efficacy modelling. Energy 2005, 30, 1603–1621. [Google Scholar] [CrossRef]
- Gueymard, C.A. Prediction and validation of cloudless shortwave solar spectra incident on horizontal, tilted, or tracking surfaces. Sol. Energy 2008, 82, 260–271. [Google Scholar] [CrossRef]
- Benmouiza, K.; Cheknane, A. Forecasting hourly global solar radiation using hybrid k-means and nonlinear autoregressive neural network models. Energy Convers. Manag. 2013, 75, 561–569. [Google Scholar] [CrossRef]
- Brownson, J.R.S.; Gardner, D.; Nieto, A. Solar resource-reserve classification and flow-based economic analysis. Sol. Energy 2015, 116, 45–55. [Google Scholar] [CrossRef]
- Choi, Y.; Choi, Y.; Suh, J.; Park, H. Assessment of Photovoltaic Potentials at Buguk, Sungsan and Younggwang Abandoned Mines in Jeollanam-do, Korea. J. Korean Soc. Miner. Energy Resour. Eng. 2013, 50, 827–837. [Google Scholar] [CrossRef]
- Song, J.; Choi, Y. Design of photovoltaic systems to power aerators for natural purification of acid mine drainage. Renew. Energy 2015, 83, 759–766. [Google Scholar] [CrossRef]
- Choi, Y.; Song, J. Sustainable Development of Abandoned Mine Areas Using Renewable Energy Systems: A Case Study of the Photovoltaic Potential Assessment at the Tailings Dam of Abandoned Sangdong Mine, Korea. Sustainability 2016, 8, 1320. [Google Scholar] [CrossRef]
- Iqbal, M. An Introduction to Solar Radiation; Academic Press: Toronto, ON, USA, 1983. [Google Scholar]
- Duffie, J.A.; Beckman, W.A. Solar Engineering of Thermal Processes, 4th ed.; John Wiley & Sons: Somerset, NJ, USA, 2013. [Google Scholar]
- The Korean Solar Energy Society (KSES). Available online: http://www.kses.re.kr/data_06/list_hi.php (accessed on 15 June 2017).
- Suh, J.; Brownson, J.R.S. Solar Farm Suitability Using Geographic Information System Fuzzy Sets and Analytic Hierarchy Processes: Case Study of Ulleung Island, Korea. Energies 2016, 9, 648. [Google Scholar] [CrossRef]
- Michalsky, J.J. The Astronomical Almanac’s algorithm for approximate solar position (1950–2050). Sol. Energy 1988, 40, 227–235. [Google Scholar] [CrossRef]
- Collares-Pereira, M.; Rabl, A. The average distribution of solar radiation-correlations between diffuse and hemispherical and between daily and hourly insolation values. Sol. Energy 1979, 22, 155–164. [Google Scholar] [CrossRef]
- Gilman, P. SAM Photovoltaic Model. Technical Reference; National Renewable Energy Laboratory: Golden, CO, USA, 2015.
Figure 1.
Distribution of irradiance data observation points in the US and Korea selected for this study.
Figure 1.
Distribution of irradiance data observation points in the US and Korea selected for this study.

Figure 2.
Overall procedure to determine the best method to convert monthly irradiance data into hourly irradiance data.
Figure 2.
Overall procedure to determine the best method to convert monthly irradiance data into hourly irradiance data.

Figure 3.
Converted hourly global horizontal irradiance (GHI) data for Denver for (a) A year; (b) Daily accumulated GHI for a year; (c) Three days.
Figure 3.
Converted hourly global horizontal irradiance (GHI) data for Denver for (a) A year; (b) Daily accumulated GHI for a year; (c) Three days.


Figure 4.
Estimated monthly electric power production (EPPs), using measured hourly data (R0) and converted hourly irradiance data (R1–R3). (a) Denver (US); (b) Daejeon (Korea).
Figure 4.
Estimated monthly electric power production (EPPs), using measured hourly data (R0) and converted hourly irradiance data (R1–R3). (a) Denver (US); (b) Daejeon (Korea).

Figure 5.
Plots showing correlations between estimated monthly EPPs and true monthly EPPs for seven cities in the US using the (a) Sunshine hours mean method; (b) SOLPOS algorithm; (c) Duffie and Beckman algorithm.
Figure 5.
Plots showing correlations between estimated monthly EPPs and true monthly EPPs for seven cities in the US using the (a) Sunshine hours mean method; (b) SOLPOS algorithm; (c) Duffie and Beckman algorithm.

Figure 6.
Plots showing correlations between estimated monthly EPPs and true monthly EPPs for four cities in Korea, using the (a) sunshine hours mean method; (b) SOLPOS algorithm; and (c) Duffie and Beckman algorithm.
Figure 6.
Plots showing correlations between estimated monthly EPPs and true monthly EPPs for four cities in Korea, using the (a) sunshine hours mean method; (b) SOLPOS algorithm; and (c) Duffie and Beckman algorithm.


Table 1.
Geographic locations of the observation points in the US and Korea (Spheroid: WGS84).
| Country | Observation Point | State | Latitude | Longitude | Time Zone |
|---|---|---|---|---|---|
| US | Arcata Airport | CA | 40.983 | −124.100 | −8 |
| US | Los Angeles International Airport | CA | 33.933 | −118.400 | −8 |
| US | Denver International Airport | CO | 39.833 | −104.650 | −7 |
| US | Bismarck Municipal | ND | 46.770 | −100.770 | −7 |
| US | Austin Mueller | TX | 30.290 | −97.740 | −6 |
| US | Miami International Airport | FL | 25.817 | −80.300 | −5 |
| US | Philadelphia International Airport | PA | 39.867 | −75.233 | −5 |
| Korea | Daejeon | 36.220 | 127.220 | +9 | |
| Korea | Daegu | 35.870 | 128.600 | +9 | |
| Korea | Busan | 35.179 | 129.075 | +9 | |
| Korea | Ulsan | 35.538 | 129.311 | +9 |
Table 2.
Characteristics of module, inverter, and system design parameters.
| Module | Sun Power SPR-210-BLK-U | |
| Nominal Efficiency | 17.3% | |
| Maximum Power | 215.25 Wdc | |
| Maximum Power Voltage | 41 Vdc | |
| Open Circuit Voltage | 47.7 Vdc | |
| Short Circuit Current | 5.8 Adc | |
| Inverter | SMA America: SB4000 US 240 V | |
| Efficiency | 96.08% | |
| Maximum AC Power | 4000 Wac | |
| Maximum DC Voltage | 600 Vdc | |
| Maximum MPPT DC | 480 Vdc | |
| Minimum MPPT DC | 250 Vdc | |
| System design | Module Capacity | 8.61 kWdc |
| Inverter Capacity | 8.0 kWac | |
| DC to AC Ratio | 1.21 | |
| Tilt | Optimal angle based on the altitude (different value for each point) | |
| Azimuth | 180° (South) | |
| Tracking | Fixed | |
Table 3.
Results of monthly accumulated irradiance at each site (unit: kWh·m−2·month−1).
| City | Jan | Feb | Mar | Apr | May | Jun | Jul | Aug | Sep | Oct | Nov | Dec | Sum |
|---|---|---|---|---|---|---|---|---|---|---|---|---|---|
| Arcata | 52 | 74 | 112 | 138 | 174 | 185 | 186 | 158 | 125 | 94 | 64 | 49 | 1412 |
| Los Angeles | 84 | 95 | 148 | 177 | 197 | 214 | 226 | 208 | 163 | 129 | 97 | 84 | 1824 |
| Denver | 78 | 89 | 144 | 144 | 196 | 218 | 208 | 186 | 155 | 114 | 74 | 64 | 1670 |
| Bismarck | 51 | 58 | 107 | 153 | 185 | 203 | 208 | 171 | 132 | 92 | 48 | 42 | 1451 |
| Austin | 78 | 94 | 139 | 147 | 173 | 192 | 217 | 188 | 161 | 117 | 81 | 78 | 1664 |
| Miami | 108 | 119 | 160 | 178 | 180 | 166 | 186 | 170 | 147 | 134 | 106 | 100 | 1753 |
| Philadelphia | 62 | 76 | 118 | 143 | 175 | 188 | 177 | 174 | 131 | 101 | 67 | 55 | 1469 |
| Daejeon | 65 | 94 | 109 | 149 | 171 | 153 | 130 | 135 | 113 | 113 | 67 | 67 | 1367 |
| Daegu | 71 | 87 | 112 | 137 | 161 | 138 | 116 | 121 | 92 | 104 | 76 | 62 | 1277 |
| Busan | 81 | 90 | 112 | 141 | 150 | 136 | 131 | 134 | 102 | 100 | 80 | 68 | 1325 |
| Ulsan | 67 | 85 | 110 | 137 | 139 | 127 | 118 | 131 | 93 | 89 | 69 | 66 | 1231 |
Table 4.
Results of error estimation of converted hourly irradiance according to the conversion methods for the seven sites in US and four sites in Korea.
Table 4.
Results of error estimation of converted hourly irradiance according to the conversion methods for the seven sites in US and four sites in Korea.
| Country | Error | R1 (Sunshine Hour Mean) | R2 (SOLPOS) | R3 (Duffie & Beckman) |
|---|---|---|---|---|
| US | RMSE (kWh/month) | 263.99 | 152.72 | 156.99 |
| MAPE (%) | 828.97 | 98.68 | 87.21 | |
| Korea | RMSE (kWh/month) | 233.67 | 168.98 | 162.64 |
| MAPE (%) | 411.08 | 146.44 | 136.06 |
Table 5.
Results of error estimation of EPPs according to the conversion methods for seven sites in the US.
Table 5.
Results of error estimation of EPPs according to the conversion methods for seven sites in the US.
| Errors | R1 (Sunshine Hour Mean) | R2 (SOLPOS) | R3 (Duffie & Beckman) |
|---|---|---|---|
| RMSE (kWh/month) | 142.30 | 46.63 | 78.83 |
| MBE (kWh/month) | 43.94 | 10.09 | 8.05 |
| MAPE (%) | 11.88 | 2.71 | 6.40 |
| Rank (descending order) | 3 | 1 | 2 |
Table 6.
Results of error estimation of EPPs according to the conversion methods for four sites in Korea.
Table 6.
Results of error estimation of EPPs according to the conversion methods for four sites in Korea.
| Errors | R1 (Sunshine Hour Mean) | R2 (SOLPOS) | R3 (Duffie & Beckman) |
|---|---|---|---|
| RMSE (kWh/month) | 102.03 | 16.92 | 68.29 |
| MBE (kWh/month) | 0.85 | 13.93 | −60.50 |
| MAPE (%) | 11.62 | 1.78 | 8.08 |
| Rank (descending order) | 3 | 1 | 2 |
© 2017 by the authors. Licensee MDPI, Basel, Switzerland. This article is an open access article distributed under the terms and conditions of the Creative Commons Attribution (CC BY) license (http://creativecommons.org/licenses/by/4.0/).
Share and Cite
MDPI and ACS Style
Suh, J.; Choi, Y. Methods for Converting Monthly Total Irradiance Data into Hourly Data to Estimate Electric Power Production from Photovoltaic Systems: A Comparative Study. Sustainability 2017, 9, 1234. https://doi.org/10.3390/su9071234
AMA Style
Suh J, Choi Y. Methods for Converting Monthly Total Irradiance Data into Hourly Data to Estimate Electric Power Production from Photovoltaic Systems: A Comparative Study. Sustainability. 2017; 9(7):1234. https://doi.org/10.3390/su9071234
Chicago/Turabian StyleSuh, Jangwon, and Yosoon Choi. 2017. "Methods for Converting Monthly Total Irradiance Data into Hourly Data to Estimate Electric Power Production from Photovoltaic Systems: A Comparative Study" Sustainability 9, no. 7: 1234. https://doi.org/10.3390/su9071234
Note that from the first issue of 2016, this journal uses article numbers instead of page numbers. See further details here.