Evaluation of Ecological Environmental Quality in a Coal Mining Area by Modelling Approach

1
College of Economics and Management, Nanjing University of Aeronautics and Astronautics, Nanjing 211106, China
2
Accounting Department, College of Accounting, Nanjing University of Finance & Economics, Nanjing 210046, China
*
Authors to whom correspondence should be addressed.
Sustainability 2017, 9(8), 1265; https://doi.org/10.3390/su9081265
Submission received: 21 April 2017
/
Revised: 10 July 2017
/
Accepted: 11 July 2017
/
Published: 27 July 2017
(This article belongs to the Special Issue Sustainable Land Use in China)
Abstract
:The purpose of this study was to explore the effective method of the comprehensive evaluation of ecological environmental quality in a coal mining area. Firstly, we analyzed the ecological environmental effect of the coal mining area according to Pigovian Tax theory and, according to the results of the analysis and the demand for the selection of evaluation indices by the comprehensive evaluation, built the corresponding comprehensive evaluation index system. We then used the correlation function method to determine the relative weights of each index. We determined the basic standards of a comprehensive evaluation of ecological environmental quality in a coal mining area according to the actual situation of ecological environmental quality assessments in coal mining areas in our country and the relevant provisions of the government. On this basis, we built the two-level extension comprehensive evaluation model for the evaluation of ecological environmental quality in mining areas. Finally, we chose a certain coal mining area of Yanzhou Coal Mining Company Limited as the specific case. We used the relevant statistic data, technical and economic indices and the extension evaluation model to do the applied research of the comprehensive evaluation and tested the effectiveness of the comprehensive evaluation model.
1. Introduction
In 2013, the total output of coal in China was 3.68 billion tons, which increased by 0.8% over in 2012. The large scale of coal mining continued to meet the demand of economic developments in energy, at the same time leaving a large number of surface mining areas. At present, there is more than 0.1 billion m2 of ground-subsidence area per year due to coal mining in China. By the end of 2013, the total coal mining subsidence area had accumulated more than 200 × 104 hm2 and caused more than 60 billion RMB of economic losses. The coal mining subsidence area is still growing by 3–5 hm2 per year or 0.2 hm2 per ten thousand tons of coal. Coal mining collapses destroy the original water system and, as a result, the established water conservancy facilities cannot play a role. The water in coal mining collapse areas is immobile and the capacity for sewage is weakened. Also, coal mining collapses lead large arable lands to become desolate marshes. It is obvious that the ecological environment of coal mining areas has been greatly damaged by coal mining collapses. Environmental governance and the ecological restoration of coal mining areas is of great significance for sustainable land use in China.
There is a serious environmental externality in the process of coal mining. The early literature discussed the destructive effects of coal mining on sustainable land use and the regional ecological environment from several perspectives. Rasnic studied the relationship between the American coal industry and environmental pollution and attempted to solve the contradiction between them [1]; Webber researched the securitization of the environmental control of mine subsidence and studied the problem of how to encourage environmental protection [2]; Donna L Erickson compared landscape planning and transformation policies which have been used in mining areas around the world and explored the effective governance methods of collapse areas [3]; Cuperus and Canters researched ecological destruction and ecological compensation standards for large-scale construction projects; Hamdar B studied land-pollution restoration plans in Mississippi, USA through the use of the efficiency method [4]; Gavin Hilson and Barbara Murck analyzed the sustainable development of mining in America from the perspective of environmental protection [5]; Annandale D studied the regional distribution of ecological compensation for specific ecological construction projects in-depth [6]; Humphreys D studied the environmental governance cost undertaken by the sustainable development of coal mining and its feasibility [7]; Gago and Antolin argued that the execution of corporate environmental strategy would cause conflict between the stakeholders and that reducing this conflict would enhance the effect of environmental governance [8]; Cetindanr and Husoy argued that corporate environmental responsibility is a component of social responsibility and that environmental governance is the environmental responsibility which enterprise must bear [9]; Kosoy N et al. compared three cases of environmental governance in America and determined the boundary cost of corporate environmental pollution governance [10].
At present, the main method of environmental governance in coal mining subsidence areas is land reclamation. There are a variety of specific forms of reclamation diversity, and governance effects also have significant differences; we therefore need to study the comprehensive evaluation methods of ecological environmental quality to evaluate the governance effects of coal mining subsidence areas. The methods of evaluating regional ecological environmental quality include the analytic hierarchy process (AHP) [11,12], the entropy method [13], the Grey comprehensive evaluation method [14], the fuzzy comprehensive evaluation [15,16], factor analysis [17], the DEA efficiency evaluation method [18,19,20] and the evaluation method based on the Geographic Information System (GIS) [21,22,23], methods based on big data [24], and so on. According to the characteristics of the research object, the above sources have chosen rich methods for assessing ecological environment quality. However, in comparison with the above evaluation methods of ecological environment quality, the extension evaluation model has advantages in two aspects. Firstly, the extension evaluation model has a strong adaptability, because it compares quantitative analysis with qualitative analysis. Secondly, the extension evaluation model can be developed more easily, as it can be expanded by using the principles of fuzzy evaluation and AHP. Therefore, in recent years, the extension evaluation model has become an important method in research on ecological environment assessment [25,26].
The large-scale exploitation of coal resources in China has brought a large subsidence area and had a great impact on the ecological environment in mining areas. Therefore, this paper attempts to study the theory and method of the comprehensive evaluation of ecological environmental quality in coal mining subsidence areas and provide a quantitative analysis method for the comprehensive management of coal mine subsidence areas in China. The following content of this paper is organized as follows: in Section 2, we discuss the model and methodology which are used in this paper; the main calculated results are summarized in Section 3; finally, Section 4 concludes this paper.
2. Methodology
2.1. Analysis of the Ecological and Environmental Externality of Coal Mining Areas
The external effects of coal mining areas result in a series of ecological and environmental problems caused by the exploitation and utilization of mineral resources. It causes a large area of land subsidence, the destruction of forest and vegetation, and the pollution of the water system and the air and other phenomena due to the extensive plundering and large-scale exploitation of coal resources with a lack of protection in the process of mining and the utilization of coal resources. The analysis of ecological and environmental externality of coal mining areas is a prerequisite for the evaluation of ecological environmental quality in mining areas and the establishment of an index system. The exploited environment of coal resources in China is very complex, meaning that we need to select many indicators for a comprehensive evaluation of its ecological environmental quality; the constructed requirement of the evaluation model is also very high. Therefore, this paper introduces the two-level matter-element extension model to evaluate the ecological and environmental quality of coal mining areas.
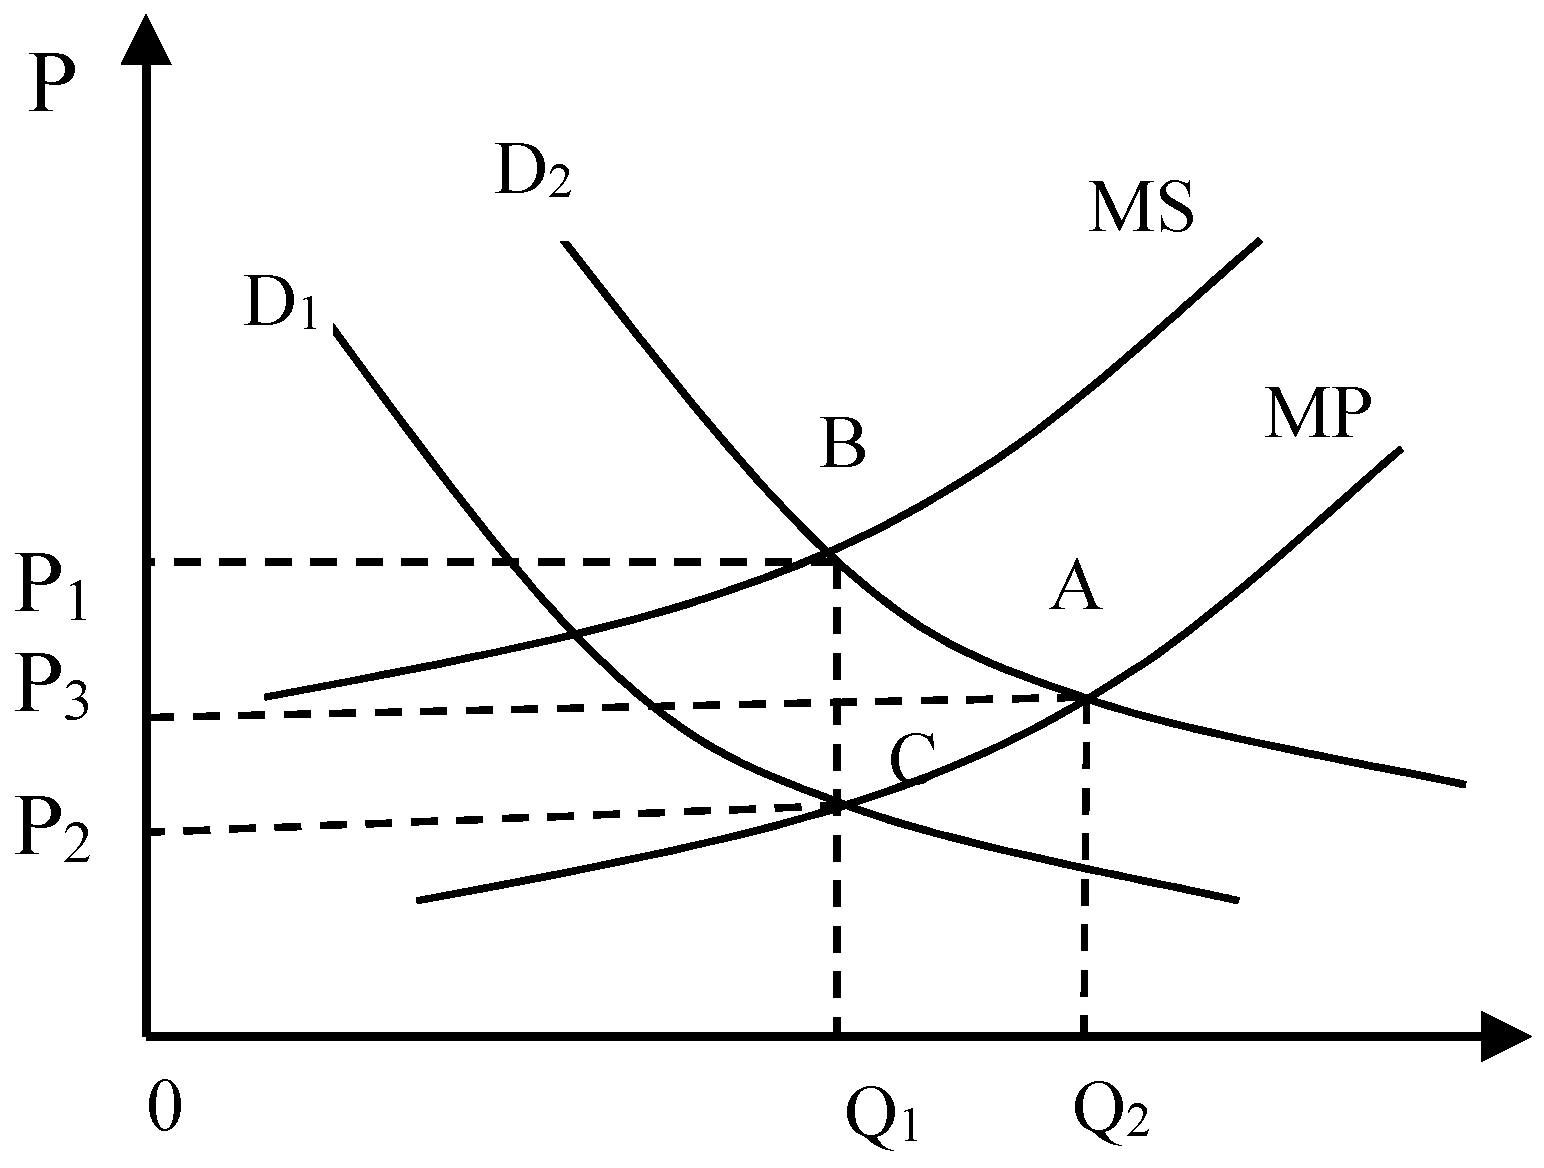
We can analyze the ecological and environmental externality of coal mining areas through Pigovian Tax theory. Pigou believes that government intervention can solve the problem of ecological and environmental externality in coal mining areas; namely, the government should adopt methods to levy tax from coal mining enterprises which cause environmental pollution, while the amount of tax should equal the social cost caused by the environmental pollution, thus making the private cost of coal mining enterprise equal to the social cost. Therefore, in view of the externality problem of the ecological environment of coal mining, the government should levy a certain amount of tax from the coal mine enterprise, aimed at the problem of the ecological and environmental externality of coal mining areas; the amount of tax should not be less than the total cost of the governance of the ecological environment. The following figure shows the process of solving the ecological environmental effect in coal mining areas by using the Pigovian Tax theory. In the indicator coordinates, the horizontal axis represents energy production, the vertical axis represents the price of energy, “MSC” represents the marginal social cost-curve of coal enterprises by considering externality, and “MPC” represents the marginal private cost-curve of coal enterprises which did not consider externality. D1 and D2 represent the demand-curve in different periods, respectively. Figure 1 is the schematic diagram of the internalization of external diseconomies.
According to Figure 1, we can see that, if we do not consider the influence of externality, the marginal private cost-curve (MPC) of coal mining enterprises and the demand-curve D2 intersect at point A, while the corresponding energy output and price are respectively Q2 and P2. On the surface, point A achieves the Pareto optimal; but due to the complexity of the environment, A is not the real Pareto optimal. Therefore, in this state, the resources did not reach the optimal configuration and the energy price cannot reflect the social cost. The government should levy the P3–P1 unit of tax when considering the impact of externality on coal mining enterprises and cause the marginal private cost-curve (MPC) of coal mining enterprises and the marginal social cost (MSC) to become the same, where they intersect at point B with the demand-curve D2. Because the marginal private cost and marginal social cost is the same at point B, the marginal private cost shows a marginal social cost. Therefore, B can achieve the Pareto optimal, wherein the resources achieve the optimal allocation. At point B, the energy yield decreases from Q2 to Q1, while the resource price rises from P2 to P3. At the same time, the demand-curve decreases from D2 to D1 and intersects with the marginal private cost-curve (MPC) at point C. At point C, the resource-production of coal mining enterprises is Q1, the corresponding marginal cost is P1, the sales price is P3, and the tax levied is P3–P1. Because the resource-price of the coal mining enterprise is completely converted to the social price, it achieves the optimal allocation of resources.
Pigovian Tax theory provides a theoretical basis for solving the problem of ecological compensation in coal mining areas. It is conducive to promoting the resolution of the ecological environmental problem in mining areas. However, the taxation standard affects the result of the ecological environment in mining areas directly. If the amount of tax is too high, it will affect the healthy development of coal mining enterprises; but if the amount of tax is too low, it will be difficult to effectively solve the problem of externality due to the inability to restrain the actions of coal mining enterprises. Therefore, a reasonable evaluation of ecological environmental quality is an important means to solve external problems; we can provide a reasonable ecological compensation standard by the comprehensive evaluation of the ecological environment quality in mining areas.
2.2. Model for the Evaluation of Regional Ecological Environment Quality in Coal Mining Areas
(1) The selection of comprehensive evaluation indicators. A comprehensive assessment of the regional ecological environmental quality in coal mining areas, run through the whole process of the ecological environment management of mining areas, is a dynamic evaluation behavior of ecological environmental quality. The whole comprehensive evaluation of ecological environmental quality should include an evaluation before, during and after the levying of tax on mining. It is also the basis for the restoration and improvement of the ecological environment and the determining of the ecological compensation standard. Due to the purpose of this paper is aimed at a comprehensive evaluation system of regional ecological environment quality in coal mining areas based on data from the Yanzhou coal mining area, this study mainly analyzes the evaluation process of the comprehensive evaluation of regional ecological environment quality in coal mining areas by using the multilevel-extension assessment model based on the similarity coefficient. Therefore, we will only study the comprehensive evaluation of regional ecological environmental quality in the Yanzhou coal mining area in this paper due to the similarity of the process, principle and method. Combined with the actual situation of the Yanzhou coal mining area, the indicators selected in this paper are shown in Table 1.
(2) Determining the grade-standard for the comprehensive evaluation. The degrees of importance of all the indicators in the evaluation index system of ecological environmental quality in mining areas are different. We determined the grade-standard of indicators in an evaluation index system according to the national soil environmental quality standards, water environment indicators standards, the noise standards of industrial enterprises, the emission standards of atmospheric pollutants and other relevant standards; these are shown in Table 2.
A higher level represents worse quality of the ecological environment. For example, the destruction of land area (X11) is a contrarian index, i.e., the polluted land-area is large, and the level is higher, while the ecological environmental quality is poorer. Other evaluation standards are determined in accordance with the provision of the state and local governments.
(3) The relative weighting of evaluation indicators. According to the requirements of the comprehensive assessment of ecological environmental quality in mining areas, we must determine the degree of importance of each evaluation index to the evaluation objects; namely the weighting and . There are many methods to determine the weighting, such as the expert investigation method, the correlation function method, the analytic hierarchy process, and so on. This paper uses the correlation function method. The specific method is as follows:
Firstly, we determine the weights of indicators . If the correlation function of the evaluation index is —which is a function of and —according to the relevance theory and the characteristics of the evaluation indicators, the correlation function can be determined as:
where: . Namely, the numerical of the evaluation index is somewhere between the maximum () and minimum (), represents the evaluation index series and represents the state series of evaluation standard:
The computational formula of is as follows:
If the weighting of the comprehensive evaluation index is , then
Secondly, we determine the weight of the indicators . Assume that the weighting of is and . We then calculate the optimal degree of each index by using the above correlation function and construct the optimal evaluation matrix of the two sub factors; its expression is as follows:
Assuming and , we find that:
Using the similarity coefficient method to calculate the close degree of two vectors, assuming the similarity coefficient was , then:
And:
(4) The extended comprehensive evaluation model. Firstly, we construct the classical domain matrix of the evaluated object. Assuming the evaluated object is denoted as and the characteristic of is denoted as , we can define the three-tuple ordered as the matter-element of . When has n characteristics and corresponding n values, the matter-element matrix can be expressed as:
where is known as an n-dimensional element of N, denoted as . is the value interval of the corresponding level; namely, the classical domain, ( = 1, 2,..., n).
Secondly, we build the joint domain of the evaluated object. The joint domain of the evaluated object is the area between the minimum and maximum value of the evaluated index, using RP to represent the joint domain:
where represents all of the evaluated levels, , , ( = 1, 2,…, n) is the joint domain of and .
Thirdly, we determine the matter-element matrix . The evaluated matter-element is its characteristic value, denoted by . According to the extension theory, can be calculated as:
Fourthly, we perform the level I evaluation. We perform the level I evaluation for each sub-system , calculating the correlation-degree of N. Assuming the correlation function is , then its specific expression is:
where :
Fifthly, we perform the level II evaluation. We determine the specific evaluated results for indicators in level II based on the level I evaluation. The evaluated procedure is as follows:
The first step: we calculate the comprehensive correlative degree for object in level . The evaluated formula is as follows:
The second step: we evaluate the level of the two-stage evaluated object. Assuming and the comprehensive evaluated level of is assuming , then the variable characteristic value of can be expressed as:
The third step: we calculate the variable characteristic value. We use the variable characteristic value to determine the evaluated level of evaluated object N.
If the variable characteristic value of the factor is and the variable characteristic value of is , it can be calculated as:
2.3. Data
This paper uses four kinds of indicators—the condition of land resources, the condition of water resources, the condition of waste and the condition of air and noise—and combines data from a mining area of the Yanzhou coal industry from 2011 to 2013 to evaluate the ecological environment in the coal mining area. The data is shown in Table 3.
3. Results and Discussion
We need to understand the idea and the process of establishing the model before applying the extended evaluation method to the comprehensive evaluation of ecological environmental quality in mining areas. According to the idea of establishing the above model, which is based on the similarity coefficient multilevel-extension assessment model, the process of establishing the model is largely based on the following processes: firstly, we build the classical matter-element matrix for ; secondly, we build the tectonic extensional matter-element matrix and the matter-element matrix ; thirdly, we use the correlation function to establish the weight coefficient of the evaluated factors (Level I and Level II); finally, we perform a comprehensive evaluation of Level I and Level II and obtain the evaluated results and the corresponding level. Then, combined with the data from the ecological environment indicators in the Yanzhou coalmining area, we can perform the comprehensive assessment of the ecological environment quality in the mining area. The process of establishing the model and evaluation is as follows:
(1) The building of the classical domain extensional matter-element matrix of the ecological environmental quality in the coal mining area. According to the above principle and matrix types, we can determine the classical domain extensional matter-element matrix of the ecological environmental quality in the coal mining area. This matrix is a matrix of the relationship between the evaluated indicators and evaluated standards. This paper limits the maximum value and minimum value of the evaluated standards to facilitate the calculation. The specific result is as follows:
(2) The standardization of the classical domain matrix. We need to distinguish the contrarian and positive index to perform standardization. The calculation formula is as follows:
According to the above formula, we define evaluated indicators between [0, 1] through the standardization, which is easy to calculate and understand. Because the relative weight of the evaluated indicators is also between [0, 1], it makes the evaluated result between [0, 1], meaning that it can be more convenient to divide the grade of the evaluated results. If we use to represent the result matrix, which is after the standardization, then the standardized result matrix of the evaluated indicators of the ecological environment quality in the coal mining area is as follows:
(3) Building the joint domain extensional matter-element matrix of the ecological environmental quality in the coal mining area. According to the above analysis of the principle and model, we obtain the following matrix:
(4) Determining the matter-element matrix of the ecological environment quality in the coal mining area. According to the above analysis of the principle and model, the result is as follows:
(5) Determining the weighting coefficient of the evaluated indicators of the ecological environmental quality in the coal mining area. We need to use the above correlation function method to determine the relative weight of indicators (Level I) . Firstly, we calculate the correlation function value of the evaluated index in 2011. The correlation function matrix is as follows:
We then use the Formulas (3) and (4), respectively, and calculate the weighting according to the positive and negative factor formula and obtain the weighting of the four indicators (Level I) of the ecological environmental quality in 2011 according to the weight calculation Formula (5); namely, the weight of land resources, water resources, solid waste, air and noise conditions. We then obtain the weight in 2012 and 2013 by using the same method. The result is shown in Table 4.
Based on the above calculated results, we can determine the weight coefficient of sub-factors (Level II). Assuming it is , so , we can obtain a priority-degree evaluation matrix of index in 2011 by using the above formula and then obtain by building the weight vector .
We then use the similarity coefficient formula , , . We calculate the closeness between the two vectors and then obtain the weight of the indicators (Level II) of the ecological quality in 2011, according to the weighting formula . Using the same method, we can also calculate its weight in 2012 and 2013. The results are shown in Table 5.
(6) The comprehensive evaluation of the ecological environment quality in the coal mining area. Firstly, we perform the evaluation of level I. We took the comprehensive evaluation of the ecological environment quality in level I in 2011 as the case, and, according to the above correlation function, we obtained the correlation function matrix as follows:
We perform the evaluation of level I for each factor , and calculate the correlation degree of the evaluated object N.
According to the calculation result of , we can see that the ecological system of land resources in the Yanzhou coal mining area is level IV by combining the data with the level evaluated formula, the ecological system of water resources is level III, the ecological system of waste is level III and the ecological system of air and noise is level IV. We can also calculate the correlation function matrix in 2012 and 2013 by using the same method and then calculate the correlation degree. The results show that the ecological system of land resources in this coal mining area is level III, the ecological system of water resources is level III, the ecological system of waste is level III and the ecological system of air and noise is level III in 2012. The ecological system of land resources in this coal mining area is level III, the ecological system of water resources is level II, the ecological system of waste is level III and the ecological system of air and noise is level III in 2013.
Secondly, we perform a comprehensive evaluation of Level II and calculate the comprehensive correlative degree of object N. The result is as follows:
Finally, we evaluate the comprehensive evaluated grade. According to the formula , we can calculate that the level of the ecological environmental quality in this area in 2011 is level IV and is level III in 2012 and 2013. Obviously, the environmental quality has improved for three consecutive years.
According to the calculation formula of the variable characteristic value, we can obtain variable characteristic values in 2011–2013 of 2.51, 2.91 and 2.89, respectively. This indicates that the environmental pollution-controlled quality of this enterprise in 2011 has risen from grade IV to grade III and from grade III to grade II in 2012 and 2013, showing a gradual improvement.
4. Conclusions
The comprehensive evaluated method and its application for the ecological environment quality of a coal mining area is an important issue that needs to be researched in the long term. This study may promote the improvement of the comprehensive evaluation of ecological environment quality in a coal mining area. In this paper, according to the characteristics and the actual situation of the ecological environment quality in China’s coal mining areas, we study the dynamic comprehensive evaluated method of the ecological environment quality in a coal mining area by selecting an indicator system and applying the comprehensive evaluation model. We then apply it to the comprehensive evaluation of the ecological environment quality in a coal mining area to improve the regional ecological environment and reduce losses. According to the comprehensive evaluated result of a mine within the Yanzhou mining area, we put forward the following suggestions to gradually improve the quality of the ecological environment:
Firstly, the quality of the ecological environment in this mining area is level III (2.89 in 2013), while the overall environmental management and environmental protection conditions are poor and should be strengthened. The government needs to increase investment to gradually promote the improvement of ecological environment quality in this mining area.
Secondly, according to the assessment result, the quality of land, air and noise are poor in this mining area. We therefore need to improve the quality of the ecological environment in this mining area in regard to these two aspects, and, at the same time, strengthen the management of water resources and solid waste and promote the comprehensive improvement of the quality of the ecological environment in this mining area.
Thirdly, according to the above assessment result, we can also see that the speed of the improvement of the quality of the ecological environment in this mining area is relatively slow, while the improvement in the assessment result from 2011 to 2013 is not obvious. It indicates that there is a lack of investment in the management of the ecological environment in this mining area. Therefore, the leaders should attach importance to the management of the ecological environment and improve the quality of the ecological environment.
Acknowledgments
This work was financially supported by Funding of National Natural Science Foundation of China (No. 71671080, No. 71571099, No. 71373123), Funding of National Natural Science Foundation for Young Scientists of China (No. 71301070), Funding of National Statistical Science Research Project (No. 2016LZ36), Funding of Science Foundation of Huainan Normal University (No. 2016xj07zd), Key Project of Philosophy and Social Science Research in Colleges and Universities in Jiangsu Province (No. 2015ZDIXM007).
Author Contributions
Chaodong Yan and Hongjun Dai wrote the paper, Wen Guo Dai analyzed the data.
Conflicts of Interest
The authors declare no conflict of interest.
References
- Rasnic, C.D. Federally required restoration of surface-mined property: Impasse between the coal industry and the environmentally concerned. Nat. Resour. J. 1983, 23, 335–349. [Google Scholar]
- Webber, B.S.; Webber, D.J. Promoting economic incentives for environmental protection in the surface mining control and reclamation act of 1977: An analysis of the design and imolementation of reclamation performance bonds. Nat. Resour. J. 1985, 23, 385–414. [Google Scholar]
- Donna, L.E. Policies for the Planning and Reclamation of Coal-Mincd Landscapes: An Internation Comparison. J. Environ. Plan. Manag. 1995, 38, 29–32. [Google Scholar]
- Hamdar, B. An Efficiency Approach Tomanaging, Smarginal Land based on the Conservation Reserve Program (CRP). Resour. Conserv. Recycl. 1999, 26, 15–24. [Google Scholar] [CrossRef]
- Gavin, H.; Barbara, M. Sustainable development in the mining industry: Clarifying the corporate perspective. Resour. Policy 2000, 6, 227–238. [Google Scholar]
- Annandale, D. Mining company approaches to environmental approvals regulation: A survcy of scnior environment managers in Canadian. Resour. Policy 2000, 26, 51–59. [Google Scholar] [CrossRef]
- Humphreys, D. Sustainable devclopment can the mining industry afford it. Resour. Policy 2001, 27, 1–7. [Google Scholar] [CrossRef]
- Gago, R.F.; Antolin, M.N. Stakeholder Salience in Corporate Environmental Strategy. Corp. Gov. 2004, 4, 65–76. [Google Scholar] [CrossRef]
- Cetindanr, D.; Husoy, K. Corporate Social Responsibility Practices and Environmentally Responsible Behavior: The Case of the United Nations Global Compact. J. Bus. Ethics 2007, 76, 165–176. [Google Scholar]
- Kosoy, N.; Martinez-Tura, M.; Muradian, R.; Martinez-Alier, J. Payments for environmental sevices in watersheds: Insights from a comparative study of three cases in Central America. Ecol. Econ. 2007, 12, 216–223. [Google Scholar]
- Dai, F.G.; Fu, X.G.; Cai, H.J. Evaluation Model Using the AHP of Ecological Environmental Quality of Jiuyuangou Watershed in the Loess Plateau. Adv. Mater. Res. 2012, 356, 2571–2574. [Google Scholar] [CrossRef]
- Chen, Z.; Yuan, L.; Shihai, L.; Jiande, F.; Yanguo, T.; Haibo, Z.; Daiqing, L. Evaluation of urbanized ecological environment quality: A case study on Beijing Chaoyang District. Environ. Eng. Manag. J. 2013, 12, 1779–1784. [Google Scholar]
- Jesmanitafti, N.; Jozi, S.A.; Monavari, S.M. Review the Environmental Effects of Using Industrial Wastewater Effluent (Case Study: Iran Qom Shokouhie Industrial State). J. Environ. Prot. 2014, 5, 877–887. [Google Scholar] [CrossRef]
- Brown, D.; Sadiq, R.; Hewage, K. An overview of air emission intensities and environmental performance of grey cement manufacturing in Canada. Clean Technol. Environ. Policy 2014, 16, 1119–1131. [Google Scholar] [CrossRef]
- Gorai, A.K.; Upadhyay, A.; Goyal, P. Design of fuzzy synthetic evaluation model for air quality assessment. Environ. Syst. Decis. 2014, 34, 456–469. [Google Scholar] [CrossRef]
- Kahraman, A.S.C. Minimizing Environmental Risks Using Fuzzy TOPSIS: Location Selection for the ITU Faculty of Management. Hum. Ecol. Risk Assess. Int. J. 2015, 21, 1326–1340. [Google Scholar]
- Monjezi, M.; Shahriar, K.; Dehghani, H.; Namin, F.S. Environmental impact assessment of open pit mining in Iran. Environ. Geol. 2009, 58, 205–216. [Google Scholar] [CrossRef]
- Choi, Y.; Zhang, N.; Chen, S.C.; Luo, C.C. Quantitative Ecological Risk Analysis by Evaluating China’s Eco-Efficiency and Its Determinants. Hum. Ecol. Risk Assess. 2013, 19, 1324–1337. [Google Scholar] [CrossRef]
- Song, M.; Wang, S.; Liu, W. A two-stage DEA approach for environmental efficiency measurement. Environ. Monit. Assess. 2014, 186, 3041–3051. [Google Scholar] [CrossRef] [PubMed]
- Pérez, V.; Guerrero, F.; González, M.; Pérez, F.; Caballero, R. Composite indicator for the assessment of sustainability: The case of Cuban nature-based tourism destinations. Ecol. Indic. 2013, 29, 316–324. [Google Scholar] [CrossRef]
- Schroeter, L.; Gläβer, C. Analyses and monitoring of lignite mining lakes in Eastern Germany with spectral signatures of Landsat TM satellite data. Int. J. Coal Geol. 2011, 86, 27–39. [Google Scholar] [CrossRef]
- Singer, S.; Wang, G.; Howard, H.; Anderson, A. Environmental Condition Assessment of US Military Installations Using GIS Based Spatial Multi-Criteria Decision Analysis. Environ. Manag. 2012, 50, 329–340. [Google Scholar] [CrossRef] [PubMed]
- Caniani, D.; Labella, A.; Lioi, D.S.; Mancini, I.M.; Masi, S. Habitat ecological integrity and environmental impact assessment of anthropic activities: A GIS-based fuzzy logic model for sites of high biodiversity conservation interest. Ecol. Indic. 2016, 67, 238–249. [Google Scholar] [CrossRef]
- Xie, H.; He, Y.; Xie, X. Exploring the factors influencing ecological land change for China’s Beijing–Tianjin–Hebei Region using big data. J. Clean. Prod. 2017, 142, 677–687. [Google Scholar] [CrossRef]
- Gao, J. The Assessment of Water Environmental Quality Based on Extension Method. Front. Environ. Eng. 2013, 2, 63–66. [Google Scholar]
- Kang, Y.; Cai, H.; Song, S. Application of Improved Fuzzy Matter-Element Model for Assessing Eco-environmental Quality in Arid Area. Disaster Adv. 2012, 5, 637–642. [Google Scholar]
Figure 1.
A schematic diagram of the internalization of external diseconomies.


Table 1.
Index system of regional ecological environmental quality assessment in coal mining areas.
| Indicators (Level 1) | No. | Indicators (Level 2) | Unit | Direction |
|---|---|---|---|---|
| Indicators represent condition of land resources (X1) | 1 | Destruction of land area (X11) | km2 | Contrarian |
| 2 | Degree of destruction of land (X12) | % | Contrarian | |
| 3 | Comprehensive pollution index of soil (X13) | -- | Contrarian | |
| 4 | Tangible economic losses of surface (X14) | 104 RMB | Contrarian | |
| 5 | Ratio of land reclamation (X15) | % | Positive | |
| Indicators represent condition of water resources (X2) | 6 | Ratio of water area (X21) | % | Contrarian |
| 7 | PH of surface water (X22) | -- | Contrarian | |
| 8 | BOD of surface water (X23) | mg/g | Contrarian | |
| 9 | Governance ratio of polluted water (X24) | % | Positive | |
| 10 | Comprehensive pollution index of water quality (X25) | -- | Contrarian | |
| Indicators represent condition of waste (X3) | 11 | Ratio of waste to land occupation (X31) | % | Contrarian |
| 12 | Waste polluted index (X32) | -- | Contrarian | |
| 13 | Utilization of solid waste (X33) | % | Positive | |
| 14 | Vegetation coverage ratio in destructed area (X34) | % | Positive | |
| Indicators represent condition of air and noise (X4) | 15 | Content of total suspended particulate matter (X41) | mg/m3 | Contrarian |
| 16 | Average content of sulfur dioxide (X42) | mg/m3 | Contrarian | |
| 17 | Content of nitrogen oxide (X43) | mg/m3 | Contrarian | |
| 18 | Air polluted index (X44) | -- | Contrarian | |
| 19 | Noise in daytime (X45) | dB | Contrarian |
Table 2.
Grade-standard for the comprehensive evaluation of ecological environment quality in coal mining areas.
Table 2.
Grade-standard for the comprehensive evaluation of ecological environment quality in coal mining areas.
| No. | Indicators | Grade Standard of Comprehensive Evaluation | ||||
|---|---|---|---|---|---|---|
| Level I | Level II | Level III | Level IV | Level V | ||
| 1 | Destruction of land area (X11) | 0–1 | 1–4 | 4–8 | 8–10 | >10 |
| 2 | Degree of destruction of land (X12) | 0–20 | 20–40 | 40–60 | 60–80 | 80–100 |
| 3 | Comprehensive pollution index of soil (X13) | 0–70 | 70–100 | 100–200 | 200–300 | >300 |
| 4 | Tangible economic losses of surface (X14) | 0–100 | 100–500 | 500–1000 | 1000–2000 | >2000 |
| 5 | Ratio of land reclamation (X15) | 60–100 | 50–60 | 40–50 | 30–40 | <0–30 |
| 6 | Ratio of water area (X21) | 0–5 | 5–10 | 10–15 | 15–20 | >20 |
| 7 | PH of surface water (X22) | <8 | 8–9 | 9–10 | 10–11 | >11 |
| 8 | BOD of surface water (X23) | <1 | 1–3 | 3–5 | 5–10 | >10 |
| 9 | Governance ratio of polluted water (X24) | 100–80 | 60–60 | 40–60 | 20–40 | 0–20 |
| 10 | Comprehensive pollution index of water quality (X25) | 0–20 | 20–50 | 50–100 | 100–200 | >200 |
| 11 | Ratio of waste to land occupation (X31) | 0–10 | 10–40 | 40–70 | 70–90 | 90–100 |
| 12 | Waste polluted index (X32) | 0–50 | 50–100 | 100–200 | 200–300 | >300 |
| 13 | Utilization of solid waste (X33) | 80–100 | 70–80 | 60–70 | 50–60 | 0–50 |
| 14 | Vegetation coverage ratio in destructed area (X34) | 30–100 | 20–30 | 15–20 | 10–15 | 0–10 |
| 15 | Content of total suspended particulate matter (X41) | <0.1 | 0.1–0.2 | 0.2–0.3 | 0.3–0.4 | >0.4 |
| 16 | Average content of sulfur dioxide (X42) | <0.1 | 0.1–0.15 | 0.15–0.2 | 0.2–0.25 | >0.25 |
| 17 | Content of nitrogen oxide (X43) | <0.05 | 0.05–0.1 | 0.1–0.15 | 0.15–0.2 | >0.2 |
| 18 | Air polluted index (X44) | 0–50 | 50–100 | 100–200 | 200–300 | >300 |
| 19 | Noise in daytime (X45) | <50 | 50–55 | 55–60 | 60–65 | >65 |
Table 3.
Data about a mining area of the Yanzhou coal industry in 2011–2013.
| Indicators (Level 1) | Indicators (Level 2) | 2011 | 2012 | 2013 |
|---|---|---|---|---|
| Indicators represent condition of land resources (X1) | X11 | 9.4689 | 11.2568 | 12.5891 |
| X12 | 65.26 | 60.27 | 58.31 | |
| X13 | 189.21 | 162.17 | 131.27 | |
| X14 | 1800 | 2100 | 4000 | |
| X15 | 48.26 | 51.28 | 60.29 | |
| Indicators represent condition of water resources (X2) | X21 | 8.21 | 9.35 | 11.21 |
| X22 | 10.21 | 9.56 | 8.58 | |
| X23 | 3.56 | 5.25 | 6.57 | |
| X24 | 40.36 | 52.31 | 60.04 | |
| X25 | 128.16 | 106.17 | 96.38 | |
| Indicators represent condition of waste (X3) | X31 | 13.27 | 10.68 | 8.56 |
| X32 | 178.36 | 167.21 | 154.28 | |
| X33 | 52.58 | 59.58 | 70.21 | |
| X34 | 20.26 | 28.27 | 31.62 | |
| Indicators represent condition of air and noise (X4) | X41 | 0.2816 | 0.2307 | 0.1836 |
| X42 | 0.1626 | 0.1428 | 0.1375 | |
| X43 | 0.1436 | 0.1227 | 0.0958 | |
| X44 | 187.26 | 177.81 | 168.32 | |
| X45 | 61.36 | 56.49 | 54.38 |
Table 4.
Weighting of indicators (Level I) of the ecological environment quality in the Yanzhou coal mining area.
Table 4.
Weighting of indicators (Level I) of the ecological environment quality in the Yanzhou coal mining area.
| Indicators | ||||
|---|---|---|---|---|
| Weight in 2011 | 0.2434 | 0.2522 | 0.2346 | 0.2698 |
| Weight in 2012 | 0.2391 | 0.2536 | 0.2303 | 0.2770 |
| Weight in 2013 | 0.2420 | 0.2566 | 0.2272 | 0.2741 |
Table 5.
Weighting of indicators (Level II) of the ecological environment quality in the Yanzhou coal mining area.
Table 5.
Weighting of indicators (Level II) of the ecological environment quality in the Yanzhou coal mining area.
| Indicators | ||||||||||
| Weight in 2011 | 0.0511 | 0.0524 | 0.0562 | 0.0543 | 0.0575 | 0.0518 | 0.0498 | 0.0492 | 0.055 | 0.0556 |
| Weight in 2012 | 0.0520 | 0.0514 | 0.0565 | 0.0552 | 0.0572 | 0.0527 | 0.0495 | 0.0488 | 0.0559 | 0.0578 |
| Weight in 2013 | 0.0518 | 0.0511 | 0.0562 | 0.0549 | 0.0556 | 0.0524 | 0.0492 | 0.0486 | 0.0543 | 0.0581 |
| Indicators | ∑ | |||||||||
| Weight in 2011 | 0.0486 | 0.0569 | 0.0537 | 0.053 | 0.0511 | 0.0479 | 0.0473 | 0.0607 | 0.0479 | 1 |
| Weight in 2012 | 0.0475 | 0.0584 | 0.0539 | 0.0533 | 0.0507 | 0.0469 | 0.0462 | 0.0604 | 0.0456 | 1 |
| Weight in 2013 | 0.0473 | 0.0568 | 0.0574 | 0.053 | 0.0499 | 0.0467 | 0.0461 | 0.0568 | 0.0537 | 1 |
© 2017 by the authors. Licensee MDPI, Basel, Switzerland. This article is an open access article distributed under the terms and conditions of the Creative Commons Attribution (CC BY) license (http://creativecommons.org/licenses/by/4.0/).
Share and Cite
MDPI and ACS Style
Yan, C.; Dai, H.; Guo, W. Evaluation of Ecological Environmental Quality in a Coal Mining Area by Modelling Approach. Sustainability 2017, 9, 1265. https://doi.org/10.3390/su9081265
AMA Style
Yan C, Dai H, Guo W. Evaluation of Ecological Environmental Quality in a Coal Mining Area by Modelling Approach. Sustainability. 2017; 9(8):1265. https://doi.org/10.3390/su9081265
Chicago/Turabian StyleYan, Chaodong, Hongjun Dai, and Wen Guo. 2017. "Evaluation of Ecological Environmental Quality in a Coal Mining Area by Modelling Approach" Sustainability 9, no. 8: 1265. https://doi.org/10.3390/su9081265
Note that from the first issue of 2016, this journal uses article numbers instead of page numbers. See further details here.