Scenario-Based Simulation on Dynamics of Land-Use-Land-Cover Change in Punjab Province, Pakistan


1
Institute of Geographic Sciences and Natural Resources Research (IGSNRR), Chinese Academy of Sciences (CAS), Beijing 100101, China
2
University of Chinese Academy of Sciences, Beijing 100049, China
3
Center for Chinese Agricultural Policy, Chinese Academy of Sciences (CAS), Beijing 100101, China
4
Institute of Agricultural & Resource Economics (IARE), University of Agriculture, Faisalabad (UAF), Faisalabad 38000, Pakistan
5
Faculty of Resources and Environmental Science, Hubei University, Wuhan 430062, China
*
Author to whom correspondence should be addressed.
Sustainability 2017, 9(8), 1285; https://doi.org/10.3390/su9081285
Submission received: 8 June 2017
/
Revised: 14 July 2017
/
Accepted: 17 July 2017
/
Published: 27 July 2017
(This article belongs to the Special Issue Sustainability Assessment of Land Use and Land Cover)
Abstract
:The dramatic changes in land use are associated with various influencing factors such as socioeconomic, climatic, geophysical and proximity factors. Hence, understanding the driving mechanisms of land use changes is crucial to determine the pattern of future changes in land use. The aim of this study is to project the future land use and land cover changes from 2010 to 2030 in Punjab province under three scenarios: Business-as-Usual scenario (BAU), Rapid Economic Growth scenario (REG) and Coordinated Environmental Sustainability scenario (CES). This article used the previously developed Dynamics of Land System (DLS) model to simulate the land use changes in response to the driving mechanisms. The results indicate that cultivated land and built-up areas would expand while areas of water and grassland would face contraction under all three scenarios. Nevertheless, future land demand varies in different scenarios. Under the CES scenario; forest area would expand in the future while large reduction in unused land would be observed. Under the REG scenario, augmented expansion of built-up areas and drastic decrease in forest areas would be the main features of land use changes. Our findings in the scenario analysis of land use changes can provide a reference case for sustainable land use planning and management in Punjab province.
1. Introduction
The concerns regarding land use and land cover changes (LULCC) are well recognized worldwide. Human activities such as population growth, increased urbanization and rapid economic development have markedly modified the Earth’s surface processes, which causes changes in environmental attributes at a regional and global level [1,2]. The major threats are impacts on climate [3], soil quality [4], global biodiversity [5] and the capability of biological systems to uphold human needs [6]. Thus, studying land use change is crucial to environmental management because it influences the carbon cycling, greenhouse gas emission, radiation and water budgets, and livelihoods [7]. The planning and management of land use is an attempt to achieve land use configuration through influencing the dynamics of land use changes so that a balance is maintained between stakeholders and environmental needs [8].
Land systems represent the relationship of all human activities and processes on land including socioeconomic, organizational and technological investments, benefits from land and externalities of social activities within the natural environment [9]. Land system dynamics work in a diverse and comprehensive process at different scale and time. This process is caused by many factors which can influence the activities of land use agents [10]. The factors are numerous and complex, consisting of biophysical, geophysical, socio-economic and technological factors [11,12,13]. Because of these influencing factors, the land use changes do not occur without “costs”. In recent years, much attention has been paid to analyzing the driving factors involved in such processes and in turn, the impacts of LULCC. Simulation modeling, as a new approach, has been employed at global and regional level to study the land use changes [14,15]. Models and scenario analyses have been recognized as powerful tools for understanding the land use patterns and complex driving mechanisms [16,17,18]. Currently, numerous simulation models on LULCC have been applied in different studies which produced good results [19,20,21]. Some dynamic simulation models can help decision makers in simulating the future scenarios. For example, cellular automata (CA) models, system dynamics (SD) models, Markov chains, the Conversion of Land Use and its Effects at Small regional extent (CLUE-S) model, Multi-Agent System (MAS) models and the Dynamics of Land Systems (DLS) model have been frequently used in simulating the land use changes spatially and temporally [22,23,24,25,26,27,28,29]. The recently developed DLS model has been regarded as a powerful tool for simulating the dynamics of land use changes. This model offers advantages over conventional models due to its comprehensive approach in determining future land demand based on scenario analysis, considering the interaction of driving factors with land uses and adjacent pixels, and simulating the spatio-temporal patterns of all kinds of land use types at regional scale [30,31]. This model has been applied widely in many studies to simulate the dynamics of land systems at different scales [28,29,31,32,33,34,35]. Analyzing the land use changes in Punjab province with the DLS model provides information on the dynamics of land use changes to policy makers and planners for sustainable land use management.
Punjab province has experienced population growth and economic development over the past several years. From 1951 to 1998, the population increased by 258% and from 1998 to 2010 by 26%. Its population density increased from 100 persons/km2 in 1951 to 492 persons/km2 in 2010. Due to high population growth, the province witnessed an accelerated process of urbanization [36]. In addition, with huge government investment, agricultural area in the country has increased more than 50% over the past several decades [37,38,39]. Hence, demographic changes and economic development have caused extensive land use changes in the province, for example, deforestation and conversion of prime agricultural land to built-up area [27,40]. The limited forest cover of only 3% is declining—forest cover of 20–25% is required for a balanced economy [41]—by 2900 hectares per annum [42]. This issue received the attention of the government to protect the environment and aimed at 7% forestry by 2015 which has not been achieved yet [43]. Recently, Punjab Growth Strategy aimed to catalyze GDP at 8% by 2030 based on developing agriculture, manufacturing and energy sectors [44]. Furthermore, implementation of the China–Pakistan Economic Corridor (CPEC) project is expected to have impacts on quality of life in the province [45] and would bring significant land use changes [33].
Not many studies on land use changes have been conducted in Pakistan in general and for Punjab in particular. Specifically in Punjab province, land use change studies are very limited. For example, Ali and Nitivattananon [43] conducted a study using remote the sensing technique at Lahore Metropolitan area. They found that from 1975 to 2009, urban area increased dramatically while areas of agriculture, sparse trees and grasses shrunk. Bhatti et al. [46] used a multilayer perceptron neural network to simulate land use changes in the city district of Lahore and projected maps for 2021 and 2035. The results projected considerable expansion of built-up area and shrinkage of agriculture and vegetation areas. Furthermore, Bhalli et al. [47] used GIS and remote sensing techniques in Faisalabad city. Their results indicated that built-up area increased and agricultural area decreased consistently during the period 1992 to 2010. Mehmood et al. [48] used remote sensing and GIS techniques to understand the urban land use pattern. The results showed that built-up area increased significantly and areas of vegetation cover reduced from 1990 to 2015.
Thus, a limited amount of research has been found on land use/cover changes in Punjab province and most of the research was carried out at city scale using remote sensing techniques. None of these studies have focused on a regional/provincial level of understanding the mechanisms of land use changes for future land use projections. Furthermore, applications of various spatial models for projecting future land use changes are scant in this study area. Hence, it is vital to simulate the processes involved in the spatial pattern of land uses which eventually help in the decision making of land use planning and management [28].
In the study presented here, the aim is to explore the dynamics and future spatial patterns of land use changes from 2010 to 2030 using the Dynamics of Land System (DLS) model under three scenarios: Business-as-Usual (BAU), coordinated environmental sustainability (CES) and rapid economic growth (REG). The BAU scenario was set for future land transitions based on historical and recent socioeconomic trends of, e.g., economic and population growth without any new sustainable environmental or economic policies. The CES scenario was set for future LULCC based on government initiatives to increase forestry area by 7% while some effective measures would be taken to protect the environment such as economic and population growth being maintained at a lower rate. The REG scenario was set based on the economic growth preference for future LULCC, and both the population and economic growth rate would be higher than the BAU scenario. The findings can provide worthwhile knowledge for future land use planning and management in the study area.
2. Data and Methodology
2.1. Study Area
In this study, we focus on the second largest of four provinces in Pakistan, Punjab, with an area of 205,344 km2 (Figure 1) which represents approximately one-quarter of the country [49] and is located at the northwestern border of the geologic Indian plate in South Asia. Furthermore, it has the strongest economy [50] and hosts more than half of the country’s population, driving rapid urbanization and agriculture [51]. Punjab is the land of five rivers, namely Jhelum, Chenab, Ravi, Sutlej that are the tributaries of the Indus River. These five rivers carry alluvium originating from the rapidly eroding and deteriorating south Mountains of Himalaya into the Indus River Delta and the Arabian Sea. The region is also known as the country’s lifeline and the granary of East Pakistan. Punjab’s topography is plain and predominantly consists of fertile land along river valleys bound by the bare land of the Cholistan desert in the southeast, hilly landscapes in the south and northwest, and the Potohar Plateau in the north. Overall, the climate is dry with an annual rainfall ranging from 100 mm in the south to 600 mm in the northwest, approaching 1000 mm by the northeastern boundary. About three-quarters of yearly precipitation is brought by monsoon rains in June to September [52], resulting in floods. The temperature varies between −2 °C and 45 °C but can reach as high as 47 °C in summer and as low as −5 °C in winter. The province has the biggest irrigation system in Pakistan covering about 3000 irrigated channels allowing for a plentiful agricultural production of wheat, rice, cotton, sugarcane, oilseeds, millet, corn, vegetables, pulses, and fruits such as mango and orange. Besides agriculture, it has also progressed considerably in industrial production, including sports goods, textiles, cement, heavy machinery, sugar mills, agricultural machinery etc. In response to economic development and rapid urbanization, the province has gone through extensive land use changes during the past several years. Several researchers in the study area have documented the substantial changes in land use pattern [43,53]. For example, substantial conversion of high quality cultivated lands to urban areas, deforestation, abstraction and extraction of river waters. Consequently, land use changes—especially deforestation in northern mountainous areas—badly affected the environment through changes in the hydrological cycle that led to soil erosion, siltation and floods [54,55,56,57,58].
2.2. Data
2.2.1. Land Use Data
Reliable and up-to-date land cover data with spatial resolution of about 30 m for the years 2000 and 2010 in Punjab province were obtained from Pakistan Space and Upper Atmosphere Research Commission (SUPARCO). By analyzing, interpreting and validating, FAO in consultation with SUPARCO and Crop Reporting Services of Punjab have identified 13 main land use classes in the high resolution spatial satellite data of SPOT-5 at a scale of 1:25,000 [59]. For meeting the requirement of DLS, we prepared all land use and driving data in uniform spatial resolution and projection of 1 km × 1 km [29,60]. Subsequently, 13 land use types were reclassified into six classes [28,31,32,35] with coding 0 to 5 (Table 1) and generalized via a separate spatial representation scheme [28]. For the study analysis, we adopted the land use data from 2010 to evaluate the accuracy of simulation results from the DLS model.
2.2.2. Data on Various Influencing Factors of Land Use Changes in Punjab Province
Many factors potentially influence land use dynamics [31]. In the present study, twelve influencing factors were grouped into four categories: (i) geophysical; (ii) climatic; (iii) proximity; and (iv) socioeconomic that have been generally considered as predictors of land use distribution. Table 2 lists the driving factors that were used in simulation of our scenarios.
Data on driving factors were gathered from various sources. Meteorological data consisting of annual temperature and precipitation were obtained from Pakistan Meteorological Department (PMD). These climate variables were interpolated by means of Krigging algorithm [28,66]. Data on slope and elevation were derived from Digital Elevation Model covering the entire province from CGIAR STRM. Data on soil properties came from International Soil Reference and Information Center (ISRIC) World Soil Information Service [67,68]. The measures on proximity variables including distance to nearest urban centre, highway and expressway were estimated using the minimum Euclidean distance from each cell with the ArcGis 10.1 software (Environmental Systems Research Institute, New York, NY, USA) [69]. The socioeconomic data consisting of population and GDP were obtained from EIU Canbank and World population websites, respectively. Finally, a logistic regression was estimated to find out the statistical relationship between each land use type and influencing factors with STATA, Version 12 software. These regression results were used in the DLS.
2.3. Methodology
2.3.1. Spatial Allocation of Land Use Area Changes
Based on historical LULCC, we define decision rules for the spatial allocation process of land use changes necessary for DLS. The conversion rule for certain kinds of land use is set by assigning a value between 0 and 1. The closer the value to 1, the more difficult the conversion of one land use type to another appears, e.g., urban land is unlikely to be converted back into cultivated land. The closer the value to 0, the more likely the conversion of one land use type to another appears, e.g., agricultural land is easy to convert into another land use type. In order to calculate the decision rules, a transition probability matrix was estimated. Table 3 shows the transition probability matrix which depicts transfer directions of different land uses from 2000 to 2010. Transition matrix gives the probability that one land use type will change to another class in the future, e.g., from 2000 in column to 2010 in row, the probability of converting cultivated land to cultivated land is 0.94, cultivated land to forestry land is 0.16, cultivated land to grassland is 0.15 and cultivated land to unused land is 0.1. The transition probability in Table 3 depends on area-based transitions which come from overlying two classified images and land cover maps of different dates in a geo information system framework [70].
The transition probability matrices are used to estimate the quantity of each land use type for a preferred date to project the future land [32]. Using a transition probability table, we projected the land uses in 2030 for the study area.
2.3.2. Scenario Development
Scenario analysis is important for projecting the future land use changes. Three scenarios were designed for our study, namely Business-as-Usual (BAU) scenario, Coordinated environmental sustainability (CES) scenario and Rapid economic growth (REG) scenario [29]. We developed these scenarios after identifying regional land use characteristics and reviewing the literature related to future plans of Pakistan and Punjab province [41,44,54,71,72,73,74] including expert judgments that relied on discussion and consultation with experts from different organizations in Punjab province. We used land use data from 2010 as a base year and projected land use changes by the year 2030 under different scenarios.
Business-As-Usual (BAU) Scenario
The BAU scenario is a reference case scenario based on past and recent (2000–2010) socioeconomic trends of, e.g., economic and population growth. In the absence of new sustainable economic or environmental policies, future land use distributions follow past trends determined by the influencing factors in Table 2.
Coordinated Environmental Sustainability (CES) Scenario
The core goal of the CES scenario is to organize the hand-in-hand development of environmental protection services and economic growth. In our scenario, the government strives to increase forestry area from 3 to 7% by 2030 mainly on current grasslands. While environmental protection measures would be introduced, economic and population growth as well as urbanization would be maintained at a lower rate.
Rapid Economic Growth (REG) Scenario
In the REG scenario, both population and economic growth will be higher compared to the BAU scenario. This development is driven by favorable economic policies towards industrial growth, introduction of modern techniques and improvements of infrastructure. One key consequence will be the expansion of built-up area into currently cultivated land.
2.3.3. The Dynamics of Land System (DLS) Model
We employed the Dynamics of Land System (DLS) model developed by Deng et al. [28] which has the ability to solve the problems in presently available methods. For example, specification of transition rules in the cellular automat model is decided on the basis of the individual’s knowledge and experience without quantitative understanding of the relationship of land use with individuals which can create problems in simulation results [8]. An agent-based model represents a simpler relationship of land use with agents, as the land system is inherently complex and can lead to bigger bias in simulation [23]. Furthermore, these models are usually capable of simulating the changes of one or two land use types and seldom thoroughly simulate macroscopic changes in all land use types in a systematic way [8,16]. Based on the Conversion of Land Use and its Effects (CLUE) model developed by Verburg et al. [8], the DLS presents two special features. Firstly, it works in dual strategy to attain a balance: perform land demand scenario analysis at a regional level and spatial desegregation of land uses at a pixel level. Secondly, it considers spatial regression between influencing factors and land uses. The model simulates the land use pattern at both regional and grid pixel scales. At regional level, land use changes occur in accordance with changing land demand under socioeconomic development while at the pixel level land use changes occur through the estimated relationship between land uses and their influencing factors (e.g., socio-economic, geophysical, proximity and climatic factors) (Figure 2). DLS comprehensively considers the control of external demand and influences of various adjacent driving factors, emphasizes internal suitability, controls random disturbances, has specific decision rules and constructs multiple objective functions. Therefore, it is robust for simulating land use pattern changes in terms of both expressions of mechanism and simulation effects [28,75]. As DLS has the capability to control external driving factors, performing scenario analysis under the hypothesis of key explanatory variables, the DLS model can improve the robustness of simulation results [29].
The DLS model has three main modules consisting of a spatial regression module, a scenario analysis module and a spatially explicit allocation module [28,30,35,76]. The scenario analysis module shows changes in land demand of different land use types at regional level for a specified period. The spatial explicit allocation module allocates the spatial distribution of different land use types under different scenarios to disaggregated grid cells. The spatial regression module calculates the probability value of each land use type in every grid cell through spatial regression analysis of driving factors. In our study, these three processes occurred during the simulation of spatio-temporal land use changes.
2.3.4. Validation of the DLS Model
Despite having some bottlenecks [77,78], the Kappa coefficient is extensively applied to assess the performance of the model [79,80]. Kappa can be applied to check the accuracy of simulation results obtained from spatial models including DLS [32,35]. We used land use and driving factors data from 2000 and simulated data for the year 2010. Afterwards, the Kappa coefficient was calculated to assess the agreement between the actual 2010 map and the simulated 2010 map.
3. Results
3.1. Performance of DLS Model
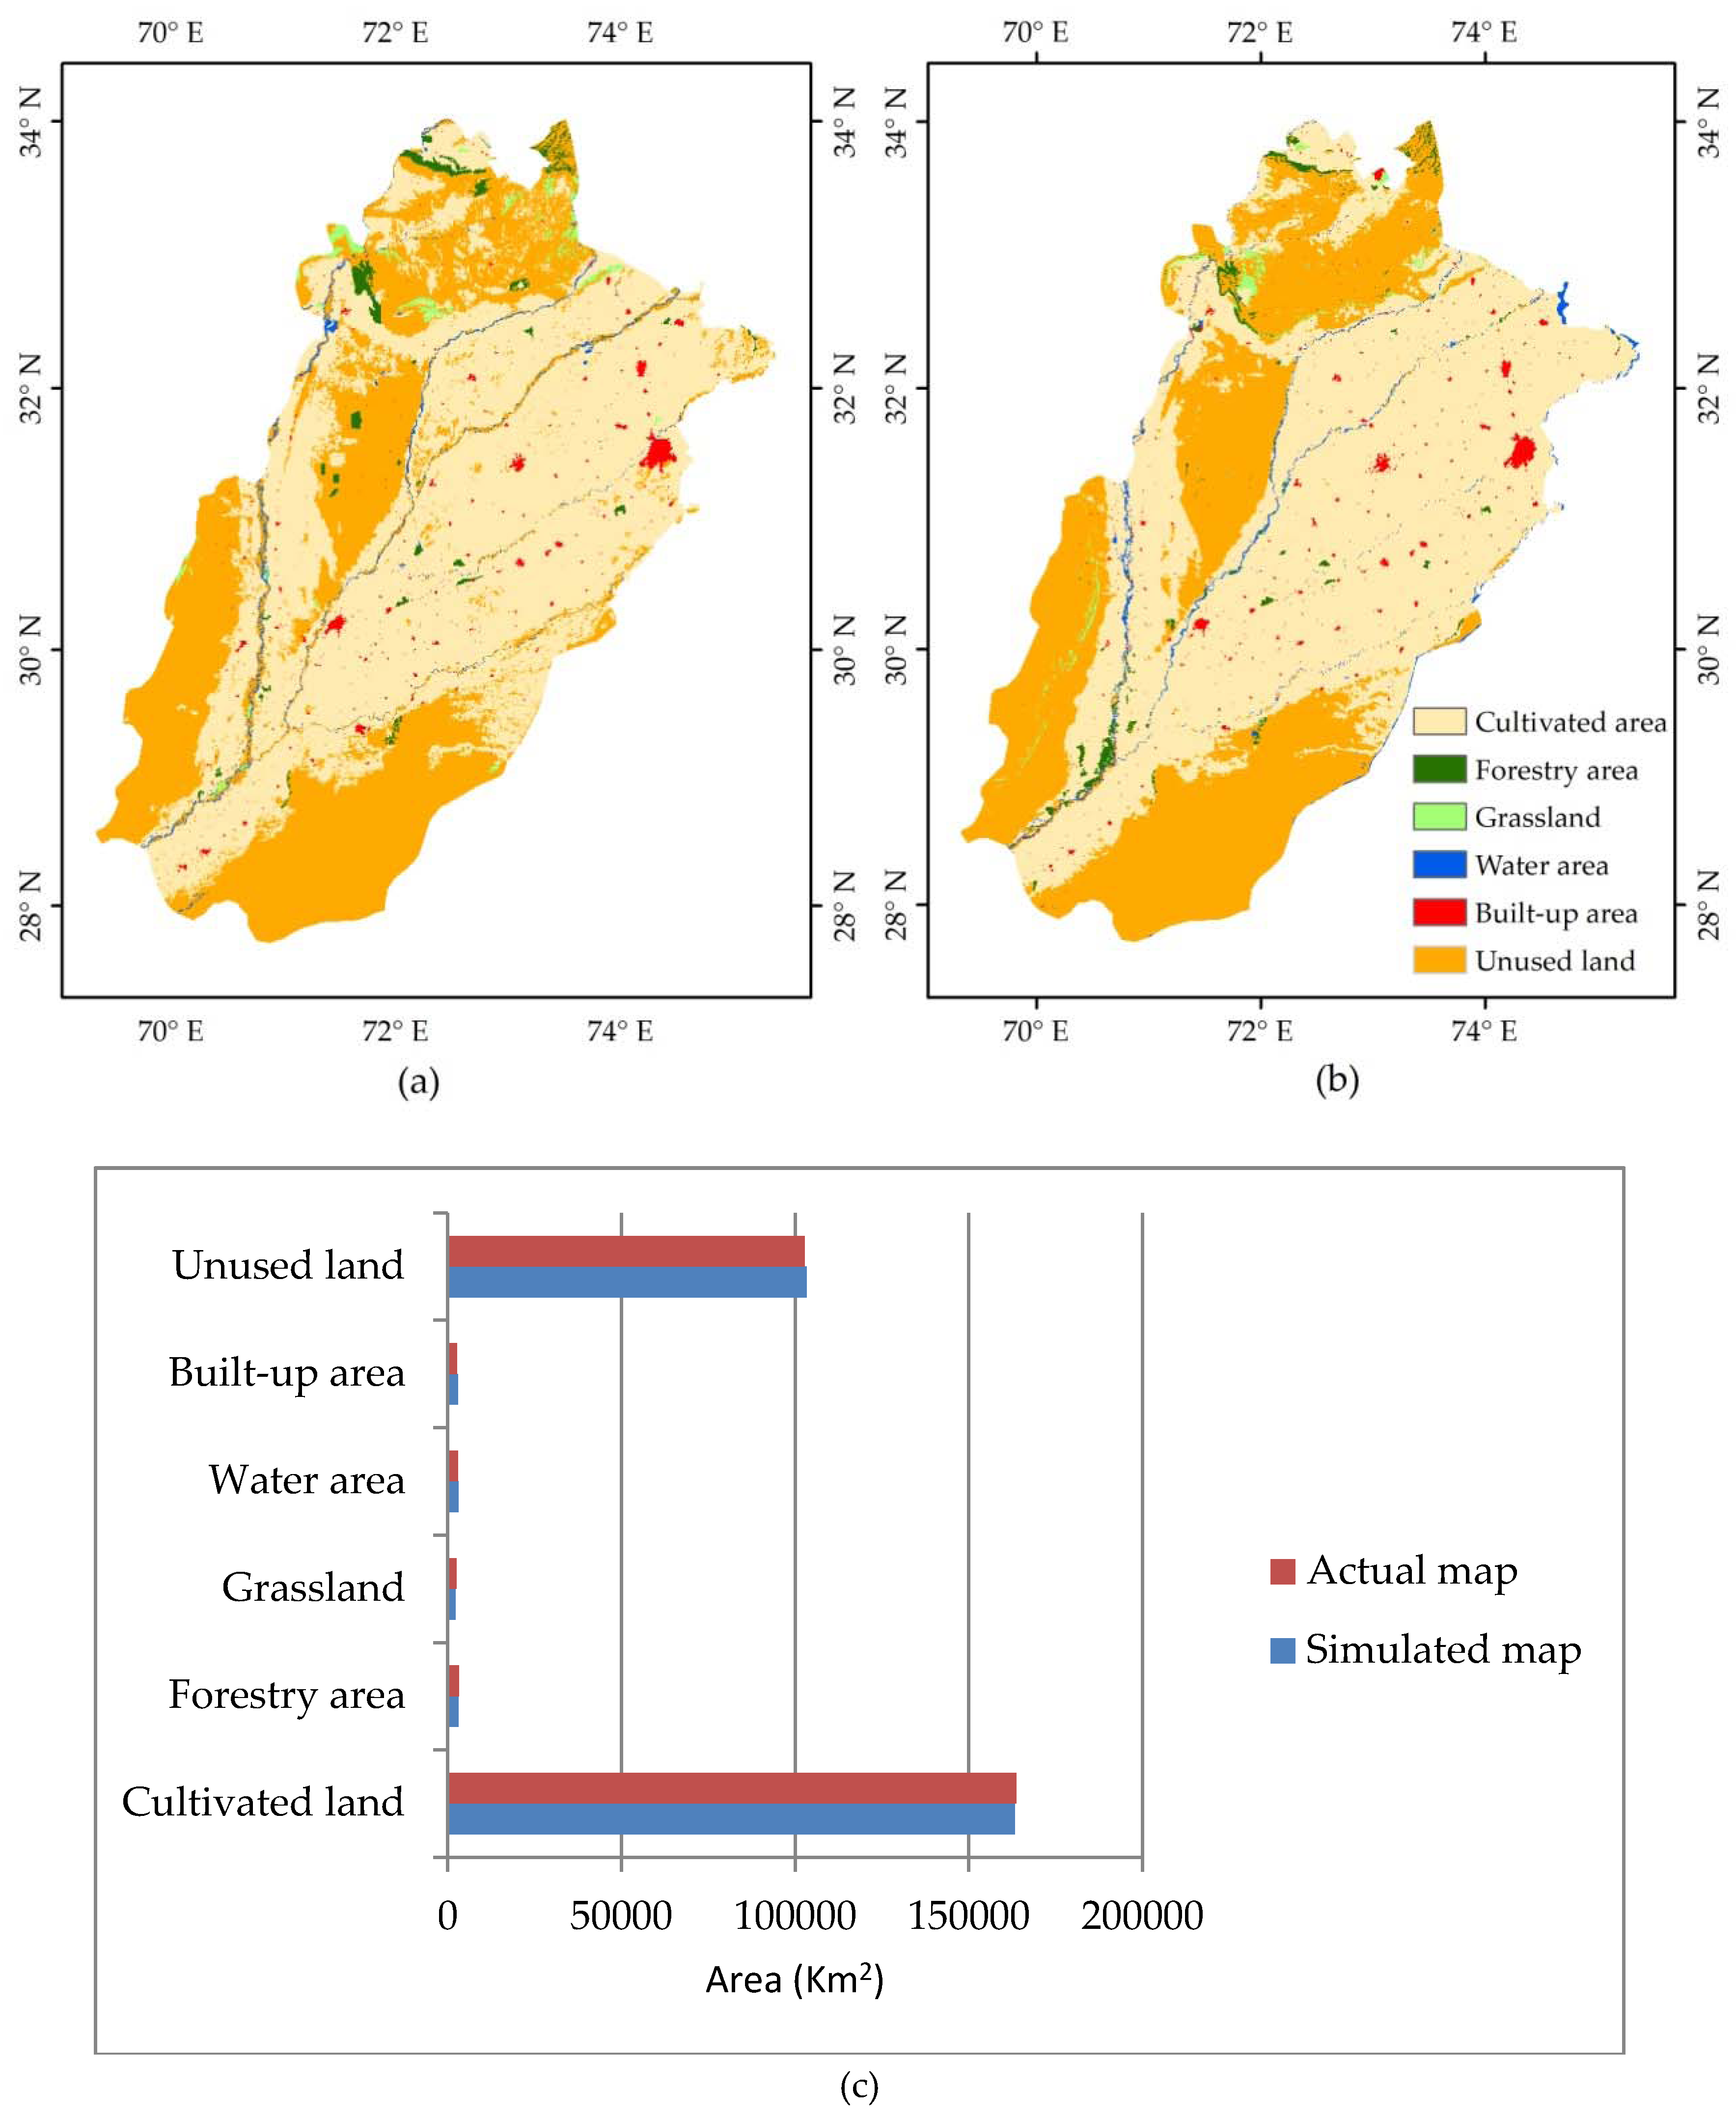
The value Kappa statistic is found to be 0.713 whereby coefficients above 0.6 represent substantial [81,82] and/or good [80,83] agreement between simulated and observed land use patterns. Hence, the DLS model was found to be suitable for simulating the land use patterns of Punjab province. The results indicate that in the simulated map the area of cultivated land, forest and unused land was a little underestimated but the area of water, built-up and unused land was a little overestimated (Figure 3).
3.2. Analysis of Influencing Factors for Dynamics of Land Use Changes
Table 4 shows the regression coefficients of different factors affecting land uses including cultivated land, forestry area, grassland, water area, built-up area, and unused land in Punjab province in 2010. The results indicated that driving factors can reasonably describe the spatial pattern of six classes of land use. Particularly, for each land use type, the significance level of all influencing factors and driving mechanisms were found to be different. For example, changes in cultivated land, forestry area, water area and unused land were significantly driven by 12 influencing factors, whereas changes in grassland and built-up area were carried out by less driving factors.
We selected only significant drivers for each land use type for simulation of the land use pattern. Based on driving processes of land use changes, the spatially explicit allocation module of the DLS model can transform the land demands into location specific land use/cover changes under various scenarios [35].
3.3. Simulation of Land Use Changes
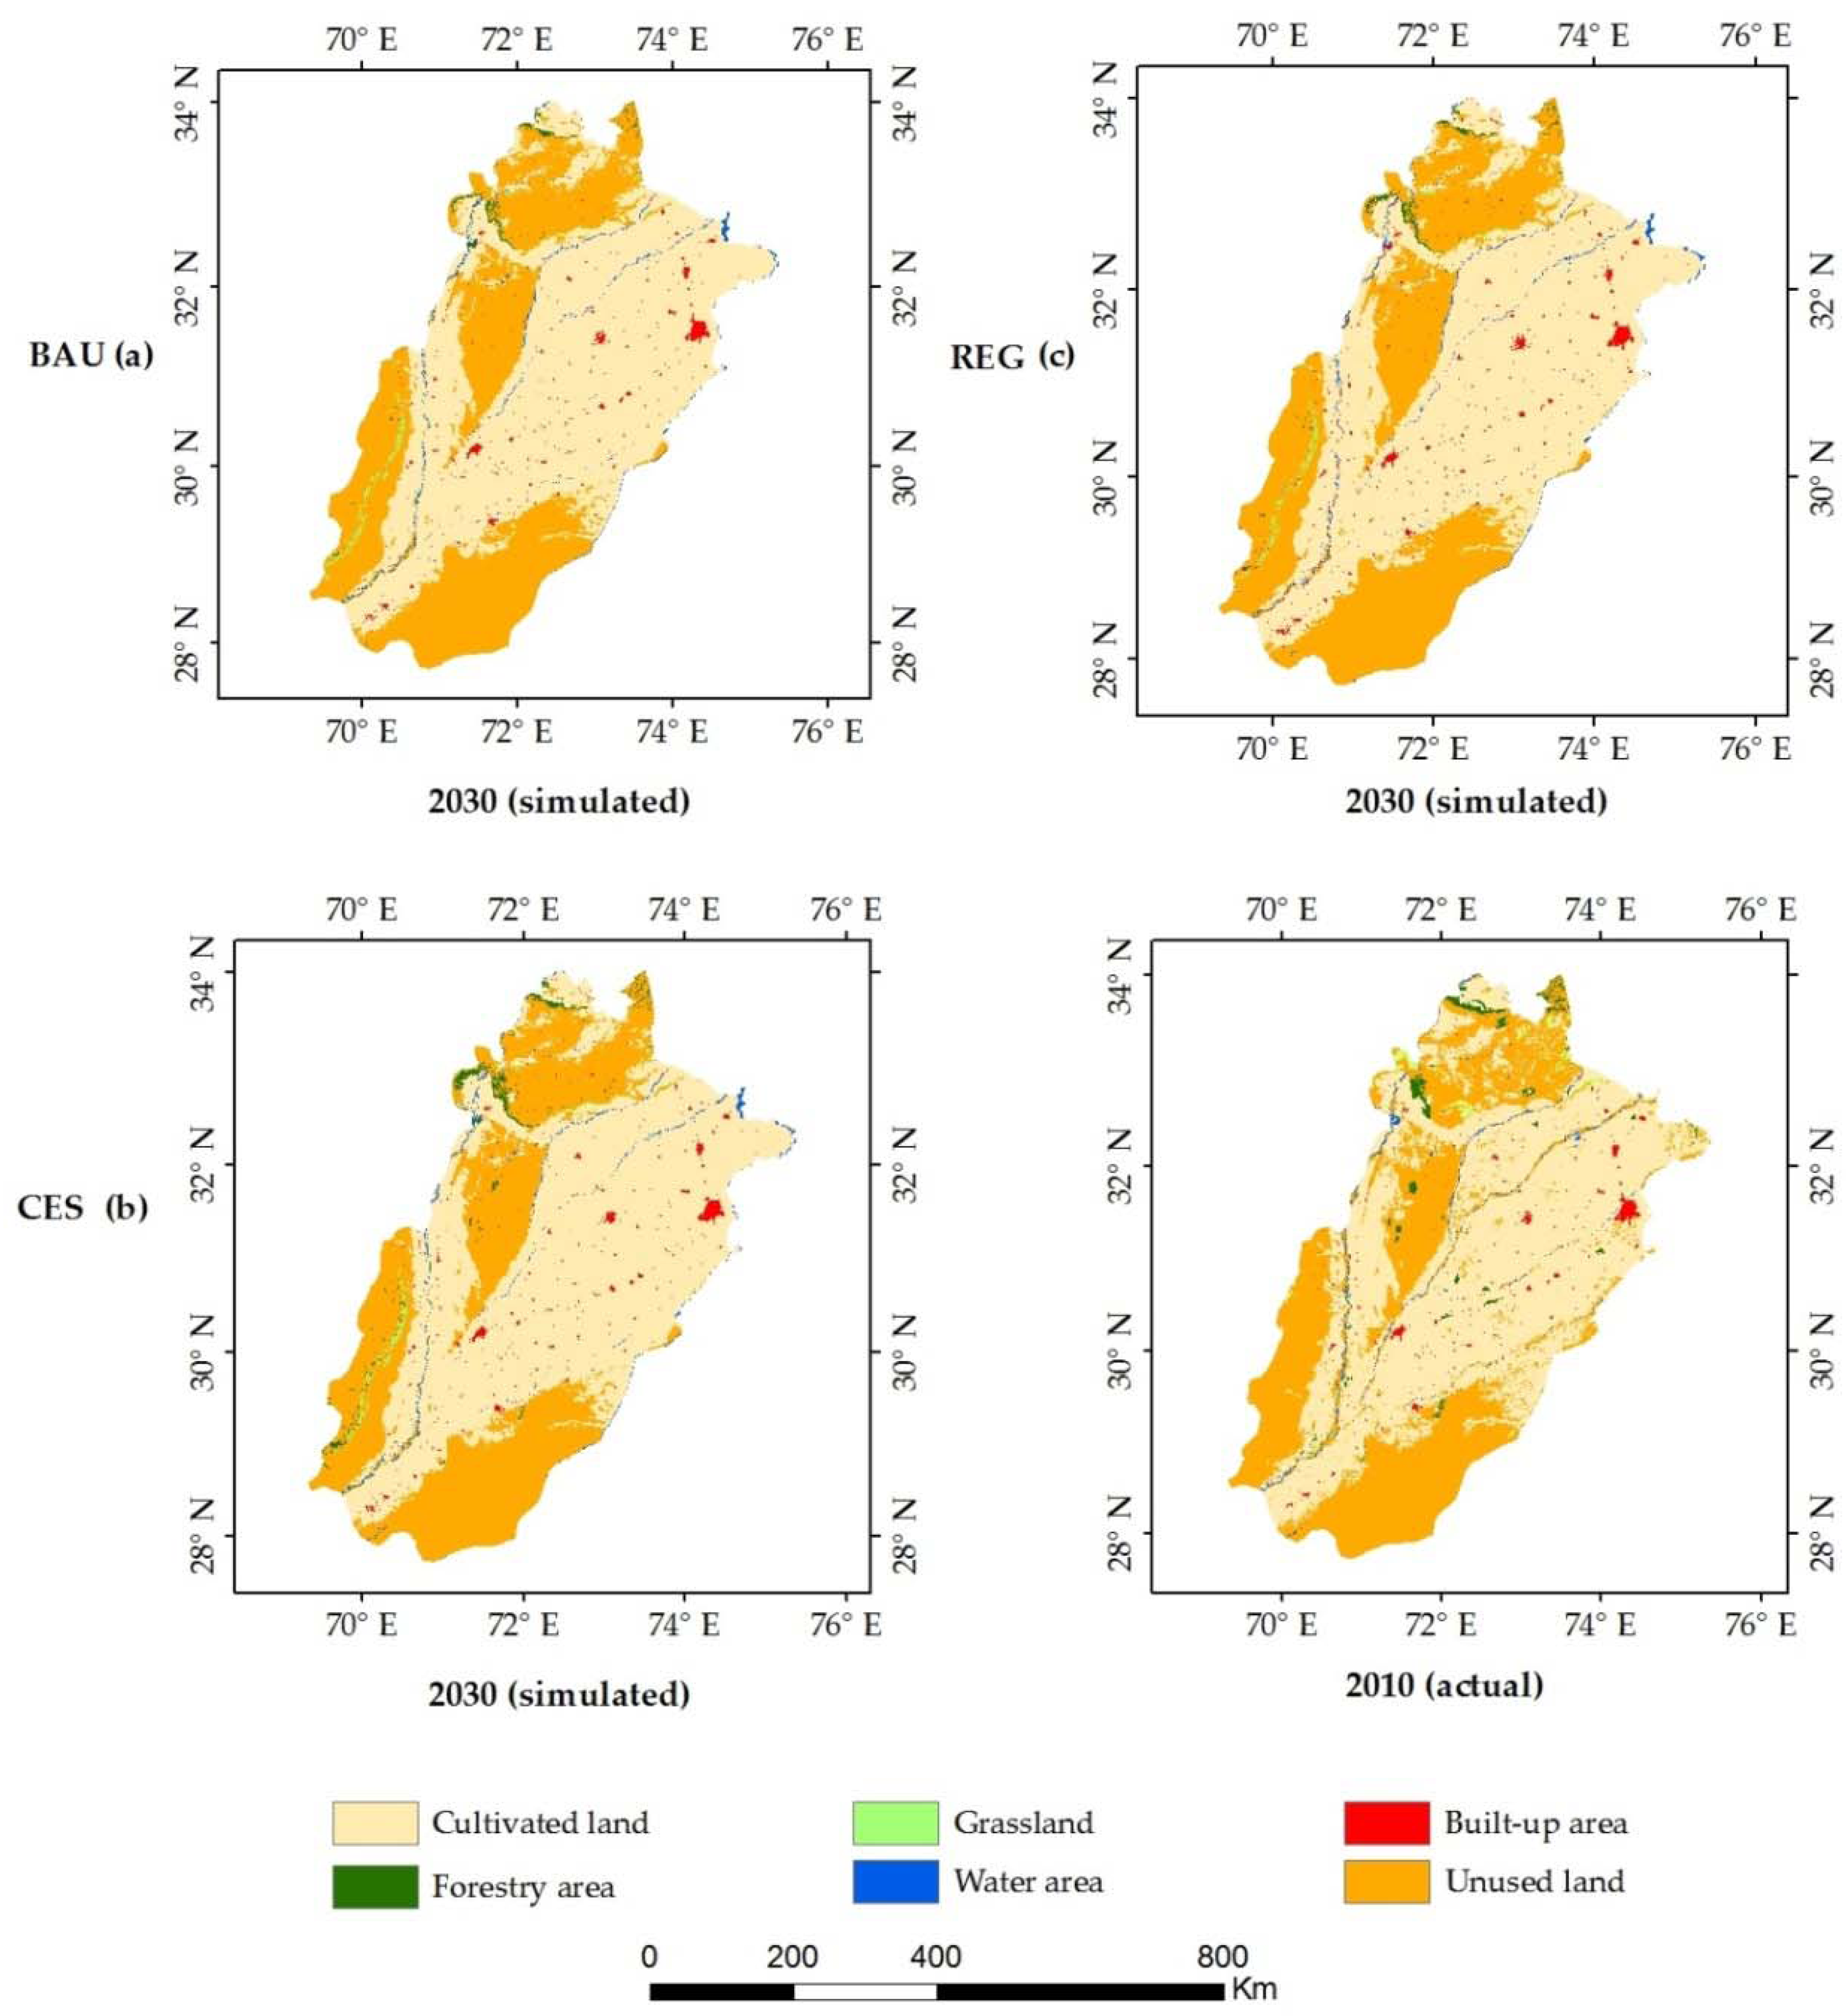
Table 5 and Figure 4 illustrate the simulation results of land use changes among three scenarios: business as usual, coordinated environmental sustainability and rapid economic growth during the period 2010–2030. Scenario analysis indicated that there was competition among land uses in Punjab province. Cultivated land and built-up area increased while the area of water and grass land decreased in each scenario. Forest area showed only an increasing trend in the coordinated environmental sustainability scenario. Built-up area increased dramatically under the rapid economic growth scenario.
The simulation results of land use changes over the study period under three scenarios are as follows.
Under the Business-as-Usual(BAU) scenario (reference scenario), the area of forest, grassland, water and unused land shrank by 52.7%, 38.6%, 7.2% and 0.7%, respectively by 2030 compared with the base year 2010. The area of cultivated and built-up lands increased by 2% and 12.1%, respectively in the simulated period. The area of forest, grassland, water and unused land was substantially changed to cultivated land. Thus, conversion of these lands to cultivated land was expected to occur mostly in flat areas of central and southern Punjab. The increase in built-up area was mainly derived from conversion of cultivated land to built-up area. Moreover, the expansion of built-up area concentrated in administrative districts and their surrounding areas.
Under the coordinated environmental sustainability (CES) scenario, we assumed that the land use was under a strict environmental protection policy from 2010 to 2030. The area of grassland, water, and unused land was contracted by 38.3%, 8.7% and 1.8%, respectively. At the same time, forest area experienced an obvious expansion (2.3%), and areas of cultivated and built-up land increased by 1.6% and 15.3%, respectively. The expansion of forest area was mainly derived from cultivated and unused land compared to other land uses such as grassland and water areas. The increase in area of cultivated land was due to shrinkage of forest, grassland, water and unused land areas. Built-up area was expanded mainly by occupying areas of cultivated land.
Compared with the Business-as-Usual scenario, land use demand was relatively different in the coordinated environmental sustainability scenario. In CES, there was more demand for areas of forest, grassland and built-up land while less demand for areas of water, cultivated land, and unused land than in the BAU scenario. On the spatial scale, some differences in distribution of land uses were found, especially in mountainous areas. More bare areas of mountains in northwest changed to forest cover. In the southwest region, more grassland was observed in the CES scenario.
Under the rapid economic growth (REG) scenario, cultivated land, built-up area and unused land increased (in comparison with values in base year 2010) by 1.1%, 44.3% and 0.1%, respectively. Forest area, grassland and water area reduced by 54.4%, 38.6% and 8.2%, respectively. An obvious expansion of built-up area was mainly derived from cultivated land. The conversion from cultivated land to built-up land primarily happened in metropolitan and neighboring areas. The conversion of unused land to built-up area was distributed in the regions along roads and river valleys. Cultivated land expanded mostly in plain areas of the province due to conversion of forest, grassland, water and unused land areas.
The comparison of the REG scenario with the BAU scenario showed considerable differences in land use demand. The area of built-up (849 km2) and unused land (751 km2) was greater than that in the reference scenario, while the area of forest (1513 km2) and cultivated land (57 km2) was higher in the BAU scenario than the REG scenario. Built-up area was concentrated more towards urban centers and their neighboring areas in the REG scenario. More cultivated land and forest degraded to unused land, particularly in Potohar region and around Cholistan desert in comparison with the BAU scenario.
4. Discussion
In the present study, we used the Dynamics of Land System (DLS) model to simulate the land use changes from 2010–2030 for all land use categories in Punjab province under Business-As-Usual (BAU), Coordinated Environmental Sustainability (CES) and Rapid Economic Growth (REG) scenarios. These scenarios were designed considering the characteristics of land uses and socioeconomic developments in the study area.
The BAU scenario was based on past and recent socioeconomic trends of population and economic growth without any implementation of new economic or environmental policies. In this scenario, areas of cultivated and built-up land expanded due to the shrinkage of water, grassland and unused land areas. The incremental trend of cultivated area was higher than the other two scenarios, implying that land demand for cultivated land would increase with increase in population to meet the food requirements in the future. Built-up area also increased but land demand was lower than in the CES and REG scenarios.
In the CES scenario, we gave priority to environmental protection. In this scenario, the area of forest increased significantly while the rate of decline in grassland area was slightly lower than the other two scenarios, implying that environmental protection policy plays a positive role in conserving the forest and grassland areas. Additionally, this policy promoted a decrease in the water area and unused land. Furthermore, maintaining cultivated and forested land required water bodies and unused land due to increasing food supplies for domestic needs. It is possible for the government to meet the target of forest cover if it controls deforestation by managing population growth, firewood, timber production and the expansion of built-up area on forest area. Moreover, the suitable regions for reforestation are semi-hilly areas and cool regions in the northwest of Punjab.
The REG scenario based on high population and economic growth showed that built-up area increased at a relatively high speed compared to BAU and CES scenarios. In this scenario, the increase in built-up area was at the cost of a decrease in area of forest, grassland, water and an increase in area of unused land. In other words, an increase in built-up area would lead to a greater trade-off for ecologically important land uses such as forest and grasslands. Moreover, an incremental trend in cultivated land area was lower than the other two scenarios, implying that demand for cultivated land would decrease. The decrease in cultivated land demand may increase the pressure on food production with a rapidly increasing population.
Our findings indicate that the study area would experience rapid urbanization in the future with 26,300 hectares in the BAU scenario, 34,900 hectares in the CES scenario and 70,700 hectares in the REG scenario of mainly cultivated land converted to built-up area over the study period. At the same time, cultivated land would experience expansion due to conversion of mainly unused land to cultivated land in each scenario. On the whole, it can be stated that with the expansion of built-up area (resulting from different factors, particularly rapid population growth), the cultivated land would also experience an incremental trend [84] due to simultaneously increasing demand for natural resources.
Our findings suggest that the CES scenario is the most ideal of the three scenarios, provided that environmental policy was strictly implemented. It can offer both environmental and economic benefits. Therefore, this scenario can be a reference for policy makers for future sustainable land use management. In the REG scenario, sustainability will decrease and can be suitable only for economic development; in terms of ecological sustainability, it is very poor. Moreover, choosing REG may cause food security problems due to decline in cultivated area compared to the other two scenarios.
Generally, land system dynamics is a complex process and any land model is unable to describe the pattern of land use changes completely [10]. Evaluation of the performance of various spatial models in recent studies indicated that there were still uncertainties present in the projection of land use changes [85]. In our study, we focused only on geophysical, climatic, socioeconomic and proximity variables but could not consider other factors such as the housing factor and land use policy related variables (e.g., infrastructure policy, zoning of land uses) due to data availability and the quantification problem. Thus, absence of these factors may cause differences in simulation results of land use structure. A future study could use policy and other factors along with current study variables to achieve accurate simulation results of land use changes in the study area. In addition, we focused here only on future land use changes but did not take into account impacts from these changes. Future research should consider the impacts of land use changes on regional climate. Finally, the simulation results of land use changes under the three scenarios in our study can guide the planners and policy makers in the decision making of sustainable land use.
5. Conclusions
We used the Dynamics of Land System (DLS) model to simulate the future land use pattern from 2010 to 2030 in Punjab province.
Simulation results indicate wide changes in land use between the scenarios. The area of cultivated and built-up land would increase under all three scenarios; BAU, CES and REG. Under the BAU scenario, cultivated land and built-up area would expand while areas of forest, grassland and unused land would decrease. Moreover, in the BAU scenario, the incremental trend of cultivated land would be higher than in the other two scenarios. Under the CES scenario, the area of forest would increase significantly while the rate of decline in grassland area would be slightly lower than the BAU and REG scenarios. Under the REG scenario, steep inflation of built-up area and drastic decrease in forest area would be the main features of land use changes in Punjab province. In addition, the incremental trend of cultivated area would be slower than the BAU and CES scenarios. In each scenario, the grassland area continues to decline at almost the same rate whereas the water area would decline with a small change in rate. The shrinkage of the water area would be a serious threat in the future for the province.
The likely expansion of built-up and cultivated land at the cost of forest and grassland may cause serious consequences for ecosystems and the natural environment. For the sustainability of the study area, the CES scenario is the ideal scenario if environmental protection policy is strictly implemented. This scenario can be a reference for policy makers for sustainable land use management. If the environmental initiative to realize 7% forest fails, then the BAU scenario would be relatively better than the REG scenario for land use management. Though both BAU and REG scenarios can cause environmental problems, the BAU scenario is preferable for land use management as sustainability measures would decline more in the REG scenario. Hence, our scenario analysis findings on land use changes can provide a reference for sustainable land use planning and management in Punjab province.
Acknowledgments
This research was financially supported by China National Natural Science Funds for Distinguished Young Scholars (Grant No. 71225005). We extend our heartfelt thanks to Prof. Xiangzheng Deng, Research Supervisor of Abdus Samie for his constructive guidance to conduct this research.
Author Contributions
In this article, Abdus Samie contributed in formulating research design and organizing the research flow, preparation of data, analysis and interpretation; Xiangzheng Deng contributed to the analysis of results and interpretation; Siqi Jia contributed to prepare maps and interpretation. Dongdong Chen contributed to the DLS simulation. All the authors contributed to the writing of the article.
Conflicts of Interest
The authors declare no conflict of interest.
References
- Lambin, E.F.; Geist, H.J.; Lepers, E. Dynamics of land-use and land-cover change in tropical regions. Annu. Rev. Environ. Resour. 2013, 28, 205–241. [Google Scholar] [CrossRef]
- Lambin, E.F.; Meyfroidt, P. Global land use change, economic globalization, and the looming land scarcity. Proc. Natl. Acad. Sci. USA 2011, 108, 3465–3472. [Google Scholar] [CrossRef] [PubMed]
- Sagan, C.; Toon, O.B.; Pollack, J.B. Anthropogenic albedo changes and the earth’s climate. Science 1979, 206, 1363–1368. [Google Scholar] [CrossRef] [PubMed]
- Trimble, S.W.; Crosson, P. Land use—US soil erosion rates: myth and reality. Science 2000, 289, 248–250. [Google Scholar] [CrossRef] [PubMed]
- Sala, O.E.; Chapin, F.S.; Armesto, J.J.; Berlow, E.; Bloomfield, J. Global biodiversity scenarios for the year 2100. Science 2000, 287, 1770–1774. [Google Scholar] [CrossRef] [PubMed]
- Vitousek, P.M.; Mooney, H.A.; Lubchenco, J.; Melillo, J.M. Human domination of earth’s ecosystems. Science 1997, 277, 494–499. [Google Scholar] [CrossRef]
- Turner II, B.L. Local faces, global flows: The role of land use and land cover in global environmental change. Land Degrad. Rehabil. 1994, 5, 71–78. [Google Scholar] [CrossRef]
- Verburg, P.H.; Soepboer, W.V.A.; Limpiada, R.V.A.; Espaldon, V. Modeling the spatial dynamics of regional land use: The CLUE-S model. Environ. Manag. 2002, 30, 391–405. [Google Scholar] [CrossRef] [PubMed]
- Verburg, P.H.; Erb, K.-H.; Mertz, O.; Espindola, G. Land System Science: Between global challenges and local realities. Curr. Opin. Environ. Sustain. 2013, 5, 433–437. [Google Scholar] [CrossRef] [PubMed]
- Verburg, P.H.; Overmars, K.P. Dynamic simulation of land-use change trajectories with the CLUE-S model. In Modelling Land-Use Change; Koomen, E., Stillwell, J., Bakema, A., Scholten, H.J., Eds.; Springer: Amsterdam, The Netherlands, 2007; Volume 90, pp. 321–337. [Google Scholar]
- Rao, K.S.; Pant, R. Land use dynamics and landscape change pattern in a typical micro watershed in the mid elevation zone of central Himalaya, India. Agric. Ecosyst. Environ. 2001, 86, 113–124. [Google Scholar] [CrossRef]
- Semwal, R.L.; Nautiyal, S.; Sen, K.K.; Rana, U.; Maikhuri, R.K.; Rao, K.S.; Saxena, K.G. Patterns and ecological implications of agricultural land-use changes: A case study from central Himalaya, India. Agric. Ecosyst. Environ. 2004, 102, 81–92. [Google Scholar] [CrossRef]
- Braimoh, A.K.; Onishi, T. Spatial determinants of urban land use change in Lagos, Nigeria. Land Use Policy 2007, 24, 502–515. [Google Scholar] [CrossRef]
- Liu, J.; Liu, M.; Zhuang, D. Analysis of China’s recent change of land use spatial pattern. Sci. China Earth Sci. 2002, 32, 1031–1040. (In Chinese) [Google Scholar]
- Couclelis, H. Where has the future gone? Rethinking the role of integrated land-use models in spatial planning. Environ. Plan. 2005, 37, 1353–1371. [Google Scholar] [CrossRef]
- Li, P.; Li, X.; Liu, X. Macro-analysis on the driving forces of the land-use change in China. Geogr. Res. 2001, 20, 129–138. (In Chinese) [Google Scholar]
- Britz, W.; Verburg, P.H.; Leip, A. Modeling of land cover and agricultural change in Europe: Combining the CLUE and CAPRI-Spat approaches. Agric. Ecosyst. Environ. 2011, 142, 40–50. [Google Scholar] [CrossRef]
- Deng, H.; He, Z.; Chen, Y. The land use spatio-temporal pattern simulation in metropolitan fringe of the Sichuan Basin: A case study in Yanjian District, Ziyang City, Sichuan. Sci. Geogr. Sin. 2013, 33, 1524–1530. (In Chinese) [Google Scholar]
- Evans, T.P.; Manire, A.; de Castro, F.E.A. A dynamic model of household decision-making and parcel level land cover change in the eastern Amazon. Ecol. Model. 2001, 143, 95–113. [Google Scholar] [CrossRef]
- Tang, H.; Wu, W.; Yang, P.E.A. Recent progresses of land use and land cover change (LUCC) models. Acta Geogr. Sin. 2009, 64, 457–468. (In Chinese) [Google Scholar]
- Zhang, W.; Liu, M.; Qi, Y. Land-use scenarios simulation based on the CLUE-S model in Kunming. Chin. J. Ecol. 2014, 33, 1655–1662. (In Chinese) [Google Scholar]
- Hu, R.; Dong, S. Land use dynamics and landscape patterns in Shanghai, Jiangsu and Zhejiang. J. Res. Ecol. 2013, 4, 141–148. (In Chinese) [Google Scholar]
- Ligtenberg, A.; Bregt, A.K.; Lammeren, R.V. Multi-actor-based land use modeling: Spatial planning using agents. Landsc. Urban Plan. 2001, 56, 21–33. [Google Scholar] [CrossRef]
- Bah, A.; Toure, I.; Le Page, C.; Ickowicz, A.; Diop, A.T. An agent-based model to understand the multiple uses of land and resources around drillings in Sahel. Math. Comput. Model. 2006, 44, 513–534. [Google Scholar] [CrossRef]
- Hu, Y.; Zheng, Y.; Zheng, X. Simulation of land-use scenarios for Beijing using CLUE-S and Markov composite models. Chin. Geogr. Sci. 2013, 23, 92–100. [Google Scholar] [CrossRef]
- Xia, L.; Gar-On Yeh, A. Neural-network-based cellular automata for simulating multiple land use changes using GIS. Int. J. Geogr. Inf. Sci. 2002, 16, 323–343. [Google Scholar]
- Nazir, N.; Olabisi, L.S. Forest Area and Land Use Change in Pakistan: A System Dynamics Approach. 2015. Available online: http://www.systemdynamics.org/conferences/2015/proceed/papers/P1296.pdf (accessed on 16 March 2016).
- Deng, X.Z.; Su, H.B.; Zhan, J.Y. Integration of multiple data sources to simulate the dynamics of land systems. Sensors 2008, 8, 620–634. [Google Scholar] [CrossRef] [PubMed]
- Deng, X.; Jiang, Q.; Zhan, J.; He, S.; Lin, Y. Simulation on the dynamics of forest area changes in Northeast China. J. Geogr. Sci. 2010, 20, 495–509. [Google Scholar] [CrossRef]
- Deng, X. Modeling Framework. In Modeling the Dynamics and Consequences of Land System Change; Springer: Berlin/Heidelberg, Germany, 2011; pp. 41–89. [Google Scholar]
- Zhen, L.; Deng, X.; Wei, Y.; Jiang, Q.; Lin, Y.; Helming, K.; Wang, C.; König, H.; Hu, J. Future land use and food security scenarios for the Guyuan district of remote western China. iForest 2014, 7, 372–384. [Google Scholar] [CrossRef]
- Hasan, S.; Deng, X.; Li, Z.; Chen, D. Projections of Future Land Use in Bangladesh under the Background of Baseline, Ecological Protection and Economic Development. Sustainability 2017, 9, 505. [Google Scholar] [CrossRef]
- Chen, D.; Deng, X.; Jin, G.; Samie, A.; Li, Z. Land-use-change induced dynamics of carbon stocks of the terrestrial ecosystem in Pakistan. Phys. Chem. Earth 2017, in press. [Google Scholar] [CrossRef]
- Ke, X.; Ma, E.; Yuan, Y. Scenario Simulation of the Influence of Land Use Change on the Regional Temperature in a Rapidly Urbanizing Region: A Case Study in Southern-Jiangsu, China. Adv. Meteorol. 2014, 2014, 1–12. [Google Scholar] [CrossRef]
- Li, Z.; Deng, X.; Wu, F.; Hasan, S. Scenario Analysis for Water Resources in Response to Land Use Change in the Middle and Upper Reaches of the Heihe River Basin. Sustainability 2015, 7, 3086–3108. [Google Scholar] [CrossRef]
- CDPR. Urban Development in Punjab: A Political Economy Analysis; Consortium for Development Policy Research: Lahore, Pakistan, 2011. [Google Scholar]
- FAO. Agricultural Sector in Pakistan. 1998. Available online: http://www.pakissan.com/english/agri.overview/fao.agricultural.sector.pakistan1.shtml (accessed on 27 April 2016).
- Ahmad, M. Agricultural Productivity Growth Differential in Punjab, Pakistan: A District-level Analysis. Pak. Dev. Rev. 2001, 40, 1–25. [Google Scholar]
- Khan, M.A.; Ahmad, M.; Hashmi, H.S. Review of Available Knowledge on Land Degradation in Pakistan. 2012. Available online: http://pdf.usaid.gov/pdf_docs/PBAAF673.pdf (accessed on 9 December 2014).
- Zaman, K.-U. Urbanization of arable land in Lahore city in Pakistan. A case-study. Eur. J. Sustain. Dev. 2012, 1, 69–83. [Google Scholar]
- Government of Punjab. Punjab Forestry Sector. Forest Policy Statement. (Forests, Watershed, Rangelands and Wildlife). 1999. Available online: http://fwf.punjab.gov.pk/sites/fwf.punjab.gov.pk/files/Forest%20Policy.pdf (accessed on 3 March 2011).
- WWF. WWF-Pakistan Expresses Grave Concern on the Recent Punjab Forest Act amendment. Available online: http://www.wwfpak.org/newsroom/240216_forest.php#sthash.Mkt7GGSZ.dpuf (accessed on 24 February 2016).
- Ali, G.; Nitivattananon, V. Exercising multidisciplinary approach to assess interrelationship between energy use, carbon emission and land use change in a metropolitan city of Pakistan. Renew. Sustain. Energy Rev. 2012, 16, 775–786. [Google Scholar] [CrossRef]
- Government of Punjab. Punjab Growth Strategy 2018: Accelerating Economic Growth and Improving Social Outcomes. 2015. Available online: http://www.pndpunjab.gov.pk/system/files/Punjab_Growth_Strategy_2018_0.pdf (accessed on 31 March 2015).
- Haq, R.; Farooq, N. Impact of CPEC on Social Welfare in Pakistan: A District Level Analysis. In Proceedings of the 32nd Annual General Meeting and Conference, Pakistan Society of Development Economics, Pakistan Institute of Development Economics, Islamabad, Pakistan, 13–15 December 2016. [Google Scholar]
- Bhatti, S.S.; Tripathi, N.K.; Nitivattananon, V.; Rana, I.A.; Mozumder, C. A multi-scale modeling approach for simulating urbanization in a metropolitan region. Habitat Int. 2015, 50, 354–365. [Google Scholar] [CrossRef]
- Bhalli, M.N.; Ghaffar, A.; Shirazi, S.A.; Parveen, N. Use of multi-temporal digital data to monitor LULC changes in Faisalabad-Pakistan. Pak. J. Sci. 2013, 65, 58–62. [Google Scholar]
- Mehmood, H.; Sajjad, S.H.; Shirazi, S.A. Spatio-temporal trends and patterns of urban sprawl in Gujranwala city, Punjab-Pakistan. Pak. J. Sci. 2017, 69, 63–68. [Google Scholar]
- Ali, S.S. Changing Spatial Patterns of Agriculture in the Punjab Province and the Food Sustainability. J. Basic Appl. Sci. 2013, 9, 389–400. [Google Scholar] [CrossRef]
- Burki, S.J. Punjab’s Economic Importance. Available online: https://tribune.com.pk/story/378252/Punjabs -economic-importance/ (accessed on 13 May 2012).
- Dowall, D.; Ellis, P. Urban Land and Housing Markets in the Punjab, Pakistan. Available online: https://openknowledge.worldbank.org/handle/10986/8280 (accessed on 15 June 2006).
- Hijmans, R.; Cameron, S.E.; Parra, J.L.; Jones, P.G.; Jarvis, A. Very high resolution interpolated climate surfaces for global land areas. Int. J. Climatol. 2005, 25, 1965–1978. [Google Scholar]
- Shirazi, S. Spatial analysis of NDVI and density of population: A case study of Lahore-Pakistan. Sci. Int. 2012, 24, 323–328. [Google Scholar]
- FAO. Asia-Pacific Forestry Sector Outlook Study II: Pakistan Forestry Outlook Study. Working Paper No. APFSOS II/WP/2009/28. Available online: http://www.fao.org/docrep/014/am623e/am623e00.pdf (accessed on 16 January 2016).
- Shehzad, K.; Qamer, F.M.; Murthy, M.; Abbas, S.; Bhatta, L.D. Deforestation Trends and Spatial Modelling of its Drivers in the Dry Temperate Forests of Northern Pakistan—A Case Study of Chitra. J. Mt. Sci. 2014, 11, 1192–1207. [Google Scholar] [CrossRef]
- Butt, A.; Shabbir, R.; Ahmad, S.S.; Aziz, N.; Nawaz, M.; Shah, M.T.A. Land cover classification and change detection analysis of rawal watershed using remote sensing data. J. Biodivers. Environ. Sci. 2015, 6, 236–248. [Google Scholar]
- Abbas, A.; Amjath-Babu, T.S.; Kächele, H.; Usman, M.; Müller, K. An overview of flood mitigation strategy and research support in South Asia: Implications for sustainable flood risk management. Int. J. Sustain. Dev. World Ecol. 2016, 23, 98–111. [Google Scholar] [CrossRef]
- Usman, M.; Abbas, A.; Saqib, Z.A. Conjunctive use of water and its management for enhanced productivity of major crops across tertiary canal irrigation system of Indus basin in Pakistan. Pak. J. Agric. Sci. 2016, 53, 257–264. [Google Scholar] [CrossRef]
- FAO. The Land Cover Atlas of Pakistan: The Punjab Province. Available online: http://www.glcn.org/activities/pak_lc_en.jsp (accessed on 28 September 2015).
- Jiang, Q.; Cheng, Y.; Jin, Q.; Deng, X.; Qi, Y. Simulation of Forestland Dynamics in a Typical Deforestation and Afforestation Area under Climate Scenarios. Energies 2015, 8, 10558–10583. [Google Scholar] [CrossRef]
- DIVA-GIS. Elevation, roads. Available online: http://www.diva-gis.org/gdata (accessed on 10 October 2016).
- ISRIC: World Soil Information. Available online: https://www.soilgrids.org/#!/?layer=PHIHOX_M_sl2_250m (accessed on 11 October 2016).
- WorldPop. High resolution age-structured population distribution maps. Available online: http://www.worldpop.org.uk/data/get_data/ (accessed on 1 November 2016).
- Doll, C.N.H.; Muller, J.P.; Morley, J.G. Mapping regional economic activity from night-time light satellite imagery. Ecol. Econ. 2006, 57, 75–92. [Google Scholar] [CrossRef]
- EIU Canback. Available online: https://www.canback.com/c-gidd/ (accessed on 5 November 2016).
- Eric, P.J.; Beurs, K.M.B.; Hartkamp, A.D. Kriging and thin plate splines for mapping climate variables. Int. J. Appl. Earth Obs. Geoinform. 2001, 3, 146–154. [Google Scholar]
- Batjes, N.H.; Ribeiro, E.; van Oostrum, A.; Leenaars, J.; Hengl, T.; de Mendes, J.J. WoSIS Serving standardised soil profile data for the world. Earth Systain. Sci. Data Discuss. 2016, 9, 1–14. [Google Scholar] [CrossRef]
- Ribeiro, E.; Batjes, N.H.; Leenaars, J.G.B.; Van Oostrum, A.J.M.; de Mendes, J.J. Towards the Standardization and Harmonization of World Soil Data; Procedures Manual ISRIC World Soil Information Service (WoSIS Version 2.0); ISRIC—World Soil Information: Wageningen, The Netherlands, 2015; p. 110. Available online: http://www.isric.org/sites/default/files/isric_report_2015_03.pdf (accessed on 1 April 2015).
- Aguiar, A.P.D.; Camara, G.; Escada, M.I.S. Spatial statistical analysis of land-use determinants in the Brazilian Amazonia: Exploring intra-regional heterogeneity. Ecol. Model. 2007, 209, 169–188. [Google Scholar] [CrossRef]
- Mas, J.F.; Vega, E. Assessing yearly transition probability matrix for land use/land cover dynamics. In Proceedings of the 10th International Symposium on Saptial Accuracy Assessment in Natural Resources and Environmental Sciences, Florianopolis, Brazil, 10–13 July 2012. [Google Scholar]
- Nachmany, M.; Fankhauser, S.; Davidová, J.; Kingsmill, N.; Landesman, T.; Roppongi, H.; Schleifer, P.; Setzer, J.; Sharman, A.; Singleton, C.S.; et al. Climate Change Legislation in Pakistan. The 2015 Global Climate Legislation Study. A Review of Climate Change Legislation in 99 Countries. 2015. Available online: http://www.lse.ac.uk/GranthamInstitute/wp-content/uploads/2015/05/Global_climate_legislation_study_20151.pdf (accessed on 5 Octobor 2016).
- Planning Commission of Pakistan. Pakistan Millennium Development Goals. 2013. Available online: http://www.pk.undp.org/content/dam/pakistan/docs/MDGs/MDG2013Report/final%20report.pdf (accessed on 13 May 2015).
- Planning Commission of Pakistan. Pakistan 2025 One Nation—One Vision. 2014. Available online: http://fics.seecs.edu.pk/Vision/Vision-2025/Pakistan-Vision-2025.pdf (accessed on 14 April 2015).
- Pasha, H.A. Growth of the Provincial Economies. 2015. Available online: http://ipr.org.pk/wp-content/uploads/2016/04/GROWTH-OF-PROVINCIAL-ECONOMICS-.pdf (accessed on 18 September 2016).
- Zhan, J.; Deng, X.; Jiang, Q.; Shi, N. The application of system dynamics and CLUE-S model in land use change dynamic simulation: A case study in Taips County, Inner Mongolia of China. In Proceedings of the 2007 Conference on System Science, Management Sciences and System Dynamics: Sustainable Development and Complex System, Shanghai, China, 19–25 October 2007; pp. 2781–2789. [Google Scholar]
- Bai, W.Q.; Zhang, Y.M.; Yan, J.Z.; Zhang, Y.L. Simulation of land use dynamics in the upper reaches of the Daduriver. Geogr. Res. 2005, 24, 206–212. [Google Scholar]
- Eugenio, D.B.; Glass, M. The Kappa Statistic: A Second Look. Comput. Linguist. 2004, 30, 95–101. [Google Scholar] [CrossRef]
- Kraemer, H.C.; Periyakoil, V.S.; Noda, A. Kappa coefficients in medical research. Stat. Med. 2002, 21, 2109–2129. [Google Scholar] [CrossRef] [PubMed]
- Hartling, L.; Bond, K.; Santaguida, P.L.; Viswanathan, M.; Dryden, D.M. Testing a tool for the classification of study designs in systematic reviews of interventions and exposures showed moderate reliability and low accuracy. J. Clin. Epidemiol. 2011, 64, 861–887. [Google Scholar] [CrossRef] [PubMed]
- Fleiss, J.L.; Cohen, J. The equivalence of weighted kappa and the interclass correlation coefficient as measures of reliability. Educ. Psychol. Meas. 1973, 33, 613–619. [Google Scholar] [CrossRef]
- Saraux, A.; Tobón, G.J.; Benhamou, M.; Devauchelle-Pensec, V.; Dougados, M.; Mariette, X.; Berenbaum, F.; Chiocchia, G.; Rat, A.C.; Schaeverbeke, T.; et al. Potential classification criteria for heumatoid arthritis after two years: Results from a French multi center cohort. Arthritis Care Res. 2013, 65, 1227–1234. [Google Scholar] [CrossRef] [PubMed]
- Anthony, J.; Viera, M.D.; Joanne, M.G. Understanding Inter observer Agreement: The Kappa Statistic. Fam. Med. 2005, 37, 360–363. [Google Scholar]
- Altman, D.G. Practical Statistics for Medical Research; Chapman and Hall: London, UK, 1991. [Google Scholar]
- Parsa, V.A.; Salehi, E. Spatio-temporal analysis and simulation pattern of land use/cover changes, case study: Naghadeh, Iran. J. Urban Manag. 2016, 5, 43–54. [Google Scholar] [CrossRef]
- Pontius, R.G., Jr.; Huffaker, D.; Denman, K. Useful techniques of validation for spatially explicit land-change models. Ecol. Model. 2004, 179, 445–461. [Google Scholar] [CrossRef]
Figure 1.
Location and land use structure of Punjab province in 2010.
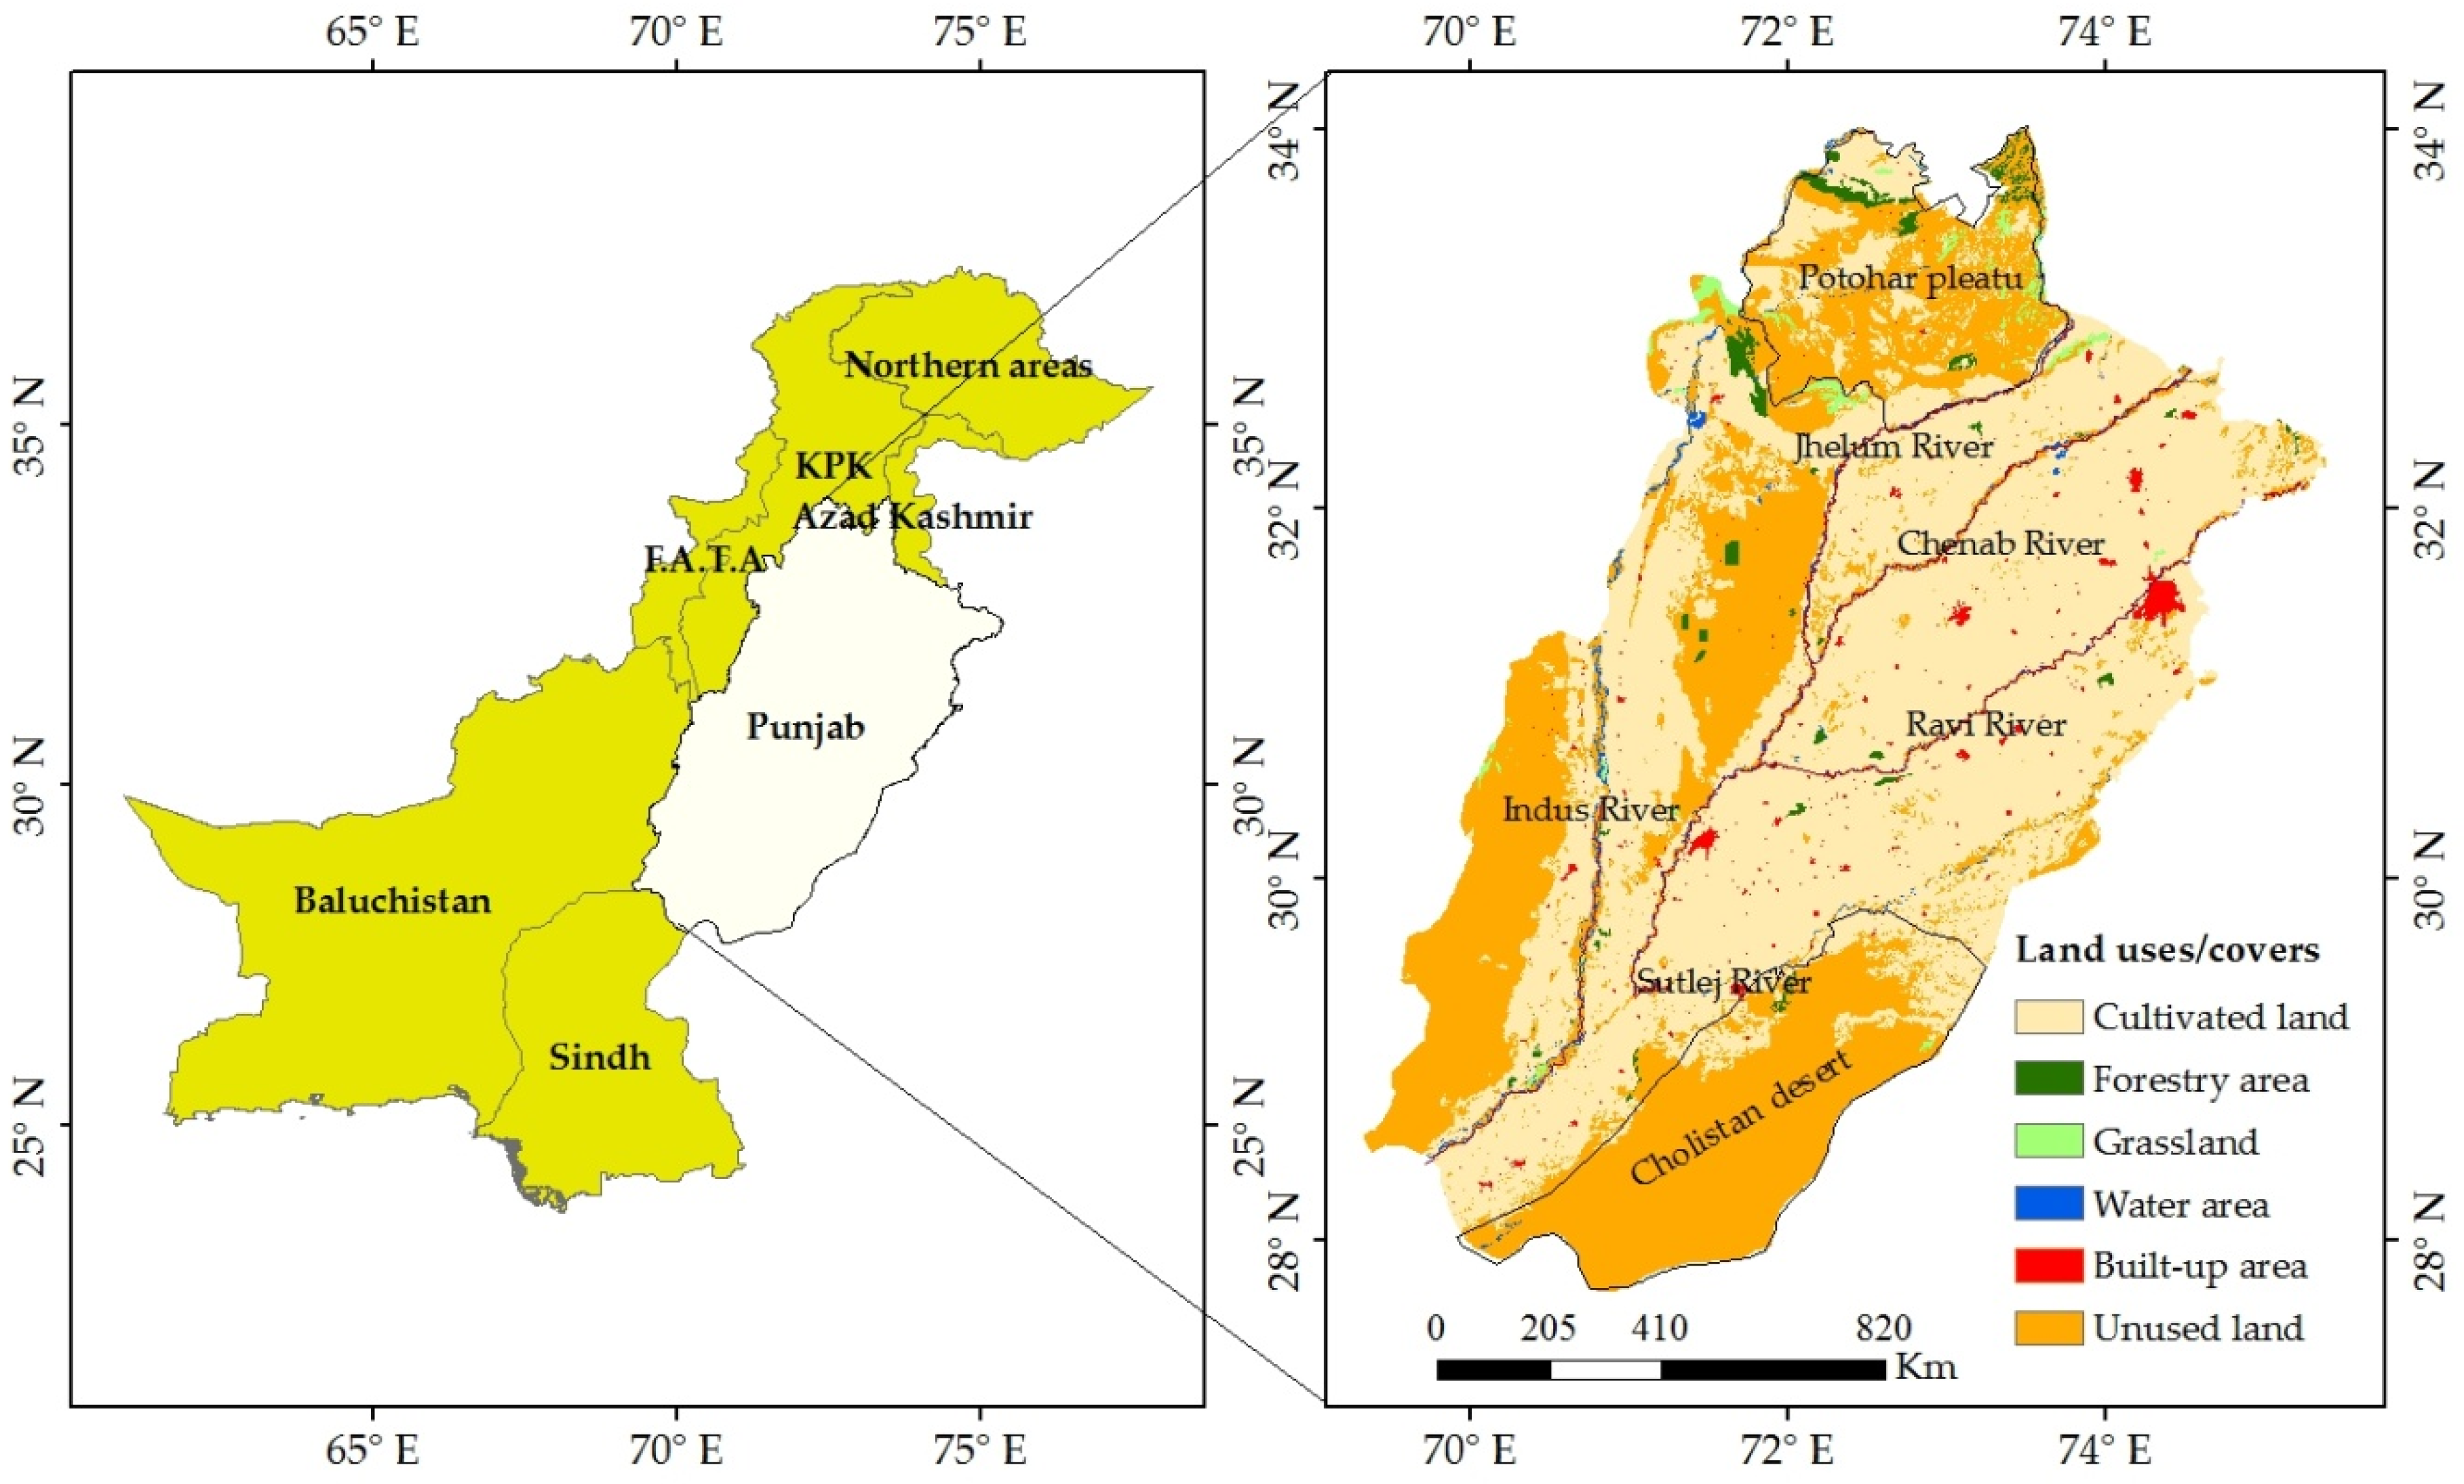
Figure 2.
Spatial allocation of projected land use changes using the Dynamics of Land System (DLS) model.
Figure 2.
Spatial allocation of projected land use changes using the Dynamics of Land System (DLS) model.
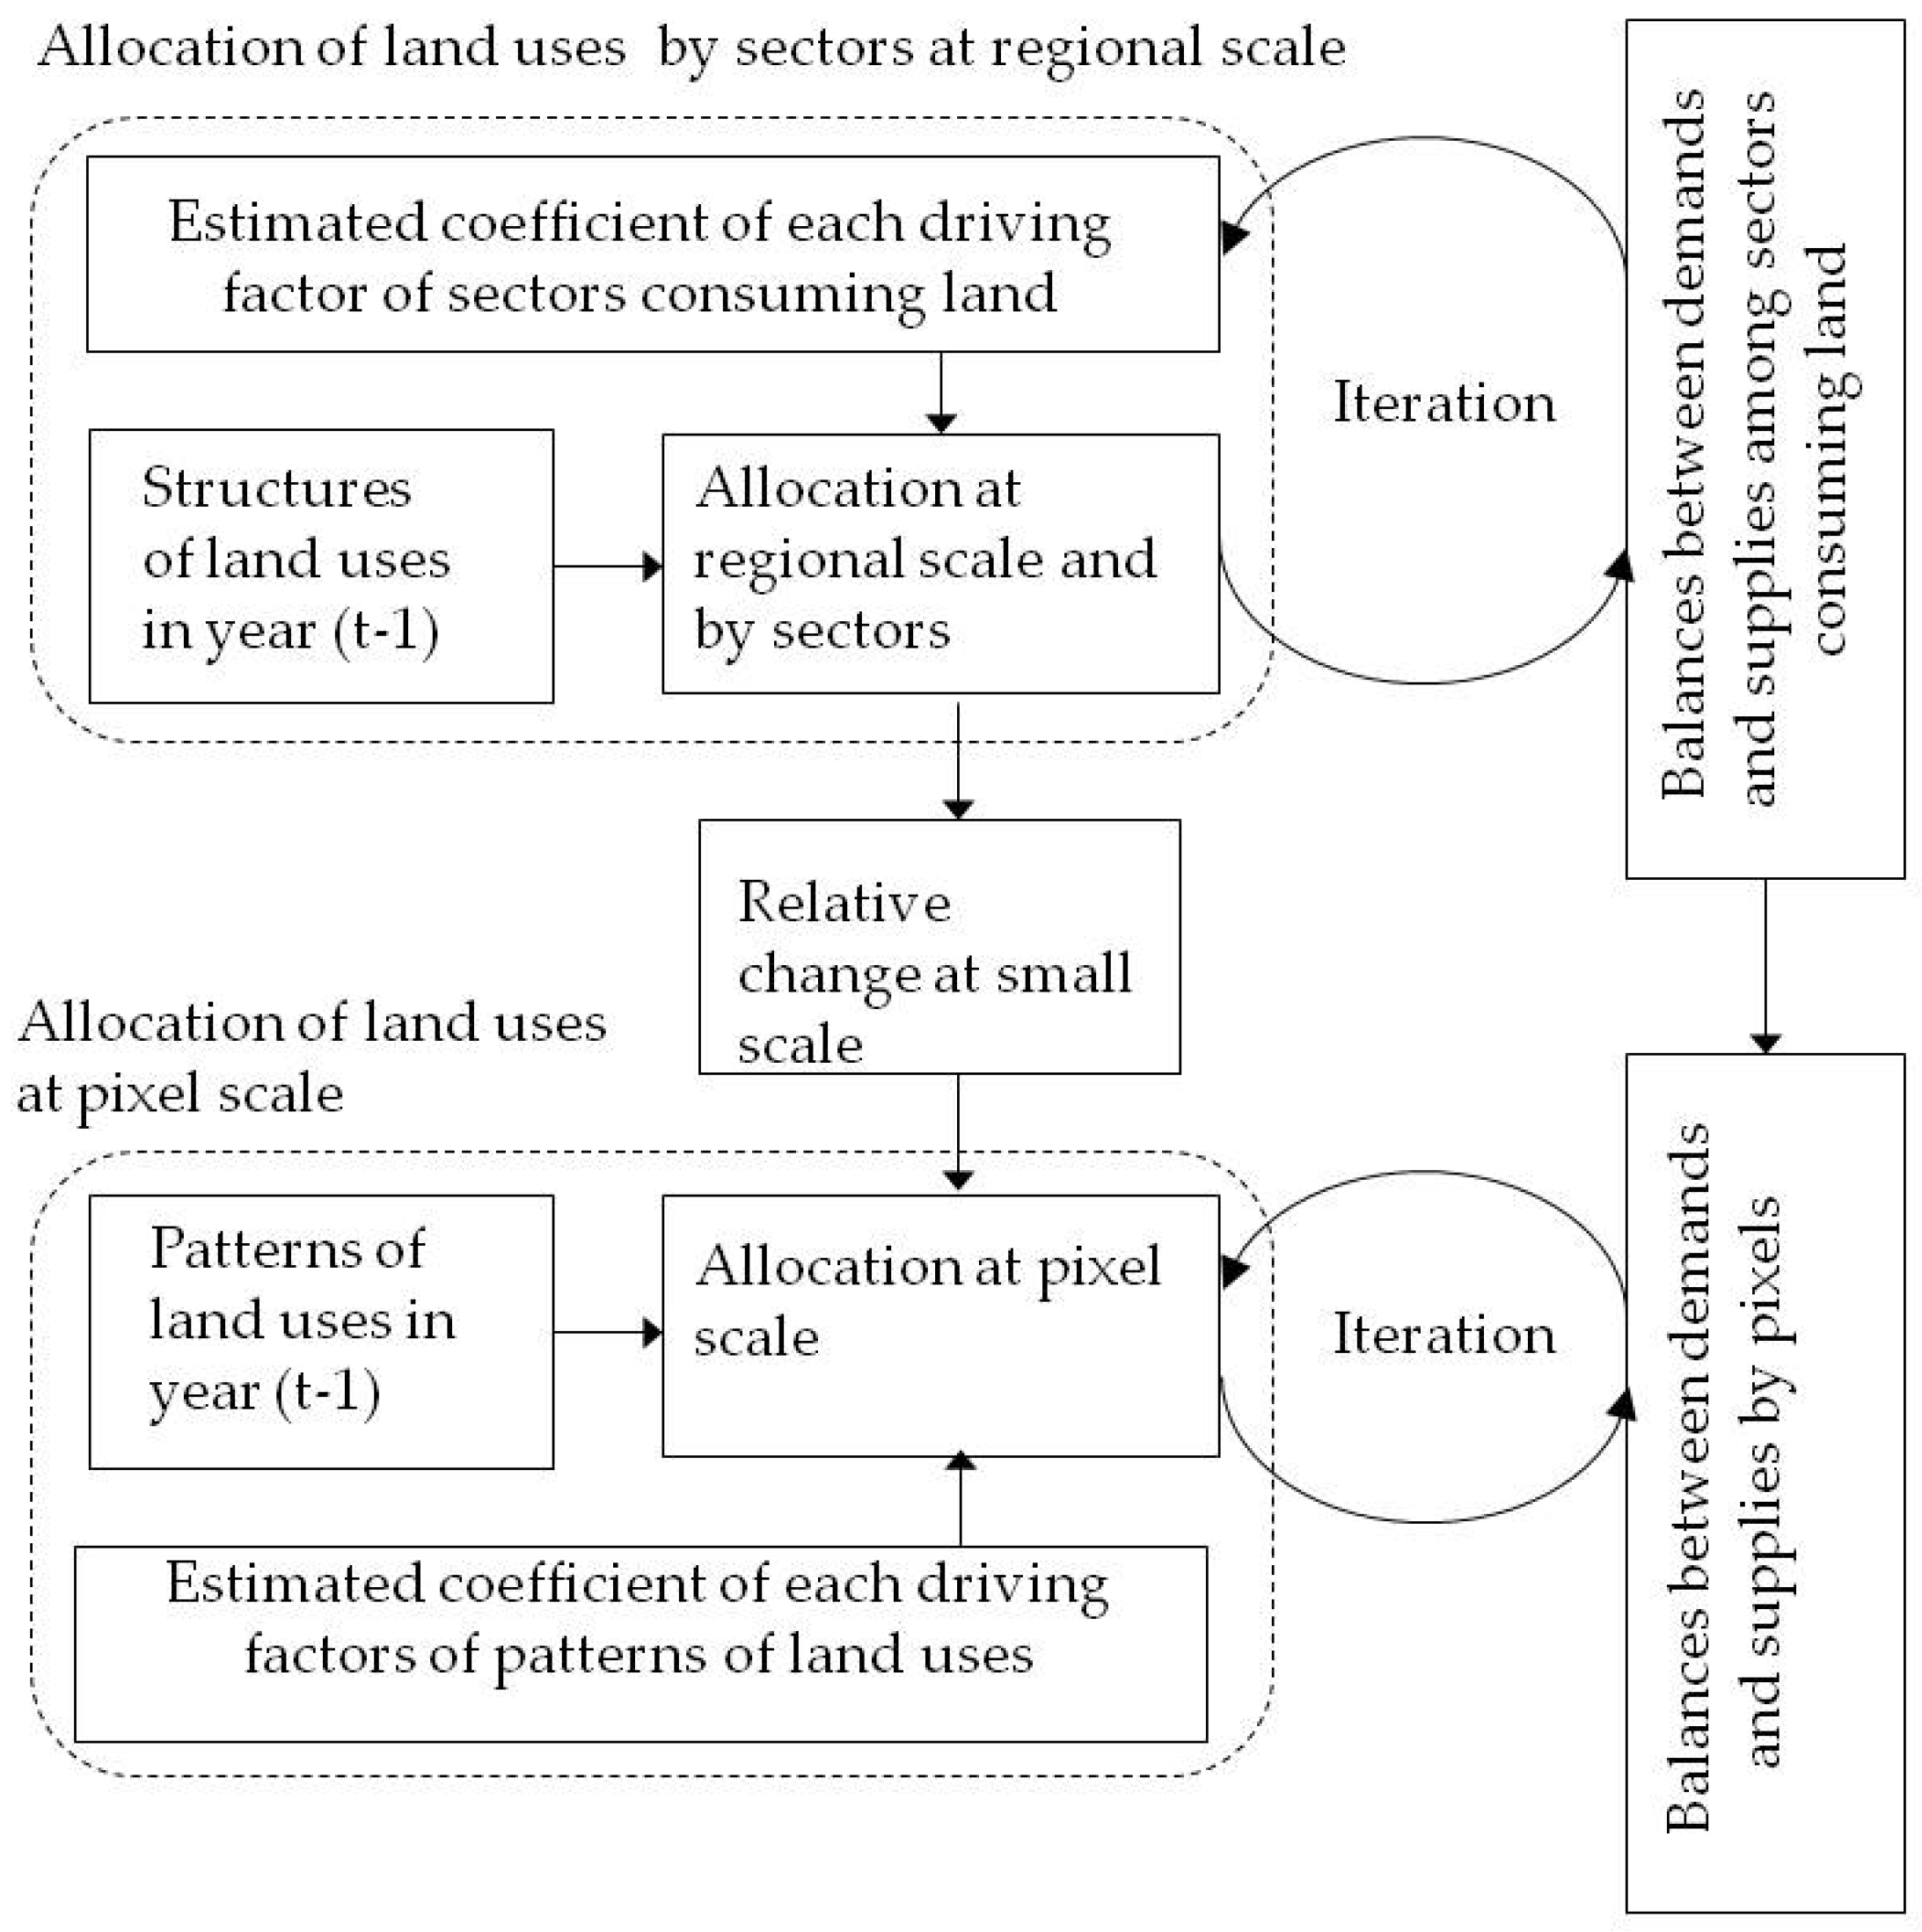
Figure 3.
Land use maps: (a) actual land use in 2010 (b) simulated land use in 2010 (c) comparison of area extents between actual and simulated land uses.
Figure 3.
Land use maps: (a) actual land use in 2010 (b) simulated land use in 2010 (c) comparison of area extents between actual and simulated land uses.

Figure 4.
Land use and land cover change (LULCC) maps in Punjab province; actual changes in 2010 and simulated changes in 2030 under BAU, CES and REG scenarios.
Figure 4.
Land use and land cover change (LULCC) maps in Punjab province; actual changes in 2010 and simulated changes in 2030 under BAU, CES and REG scenarios.


Table 1.
Land uses/covers in Punjab province.
| Code | Land Use Type | Description |
|---|---|---|
| 0 | Cultivated land | Land covered by orchard that includes cultivated or maintained area for fruit production; crop irrigation that includes area for production of annual crops; crop marginal and irrigated saline that include herbaceous crops in irrigated saline fields and rainfed in desert area; crops in flood plains, including herbaceous crops located in the proximity of a river bed and receiving water either from annual floods or by irrigation; and rainfed crops that include herbaceous crops in rainfed and sloping land dependent on only rainfall. |
| 1 | Forestry area | Land covered by both natural and planted forest with a height greater than 6 m. Planted forest refers to plantation by government. This forest is identified by a large area and block shape. Natural forest includes closed forest with canopy cover more than 60% and open forest with canopy cover between 10% and 60%. |
| 2 | Grassland | Land covered by natural vegetation in wet areas and rangelands with height less than 6 m tall. Natural vegetation in wet areas includes herbaceous vegetation with cover 60 to 100%; closed to open shrubs with cover 20–100%, closed woody vegetation with cover 60 to 100% and woody vegetation with cover 10 to 60%. Rangelands include grasslands, shrublands and woodlands. These areas are not under intensive management but can be used for grazing. |
| 3 | Built-up area | Land covered by all built up area such as urban, industrial, airport, roads etc. |
| 4 | Water area | Land covered by lakes and rivers. |
| 5 | Unused land | Land covered by bare areas and bare areas with sparse natural vegetation. Bare areas include sand dunes and barren land. Barren land represents bare soil area with very low density of shrubs and no agricultural activity. Sand dunes represent low ridges or hillocks of drifted sands mainly moved by wind. Bare areas with sparse natural vegetation consist of sand dunes with natural vegetation, bare rocks with sparse vegetation and desert flat plain. |
Table 2.
List of influencing factors exploring the dynamics of land use changes in Punjab province.
| Factor Category | Influencing Factors | Year | Description | Source |
| Geophysical variables | Slope | 2000 | SRTM Digital Elevation Model (DEM) 90 m | DIVA-GIS [61] |
| Elevation | ||||
| Soil pH | 2013 | Depth for pH is 5 cm (Index *10) | World Soil Information [62] | |
| Soil depth | Depth up to 200 cm | |||
| Silt content | (2–50 micro meter) mass fraction in % (5 cm depth) | |||
| Climate Variables | Temperature | 2010 | Annual mean air temperature (°C) | Pakistan Meteorological Department |
| Precipitation | Annual cumulative precipitation (mm) | |||
| Proximity variables | Distance to urban centers | 1993 | Euclidean distance to nearest urban center (Km) | DIVA-GIS [61] |
| Distance to the highway | Euclidean distance to nearest highway (Km) | |||
| Distance to the expressway | Euclidean distance to nearest expressway (Km) | |||
| Socioeconomic variables | Population density | 2010 | Estimates of number of people per grid square (persons/km2) [28] | World Population [63] |
| GDP | 2010 | Interpolated gross domestic values (GDP; USD dollars/km2 founded on spatially explicit analysis of linking economic growth and factors which may influence economic growth) [64] | EIU Canback [65] |
* pH index measured in water solution.
Table 3.
Transition probability matrix of land uses in Punjab province from 2000 to 2010.
| From 2000 | To 2010 | |||||
|---|---|---|---|---|---|---|
| Cultivated Land | Forestry Area | Grassland | Water Area | Built-Up Area | Unused Land | |
| Cultivated land | 0.94 | 0.16 | 0.15 | 0.17 | 0.11 | 0.10 |
| Forestry area | 0.00 | 0.62 | 0.01 | 0.00 | 0.00 | 0.00 |
| Grassland | 0.00 | 0.02 | 0.68 | 0.02 | 0.00 | 0.00 |
| Water area | 0.00 | 0.03 | 0.01 | 0.36 | 0.00 | 0.01 |
| Built-up area | 0.00 | 0.00 | 0.00 | 0.00 | 0.86 | 0.00 |
| Unused land | 0.05 | 0.17 | 0.15 | 0.45 | 0.03 | 0.89 |
Table 4.
Significant values of regression coefficients of explanatory variables for land use categories in Punjab province, 2010.
Table 4.
Significant values of regression coefficients of explanatory variables for land use categories in Punjab province, 2010.
| Driving Factors | Cultivated Land | Forestry Area | Grassland | Water Area | Built-Up Area | Unused Land |
|---|---|---|---|---|---|---|
| Slope | −0.5000 (1) | 0.3659 (1) | 0.0716 (1) | −0.54094 (1) | - | −0.1200 (1) |
| Elevation | −0.0070 (1) | 0.0009 (1) | 0.0013 (1) | −0.007 (1) | - | 0.0055 (1) |
| Soil ph | −0.0197 (1) | −0.0701 (1) | - | −0.117 (1) | −0.0222 (1) | 0.0950 (1) |
| Soil depth | −0.0078 (1) | 0.0227 (1) | −0.0119 (1) | 0.027 (1) | 0.0353 (1) | 0.0036 (2) |
| Silt content | 0.2500 (1) | 0.0447 (1) | 0.0769 (1) | 0.144 (1) | −0.0161 (1) | −0.2203 (1) |
| Temperature | −0.4923 (1) | 3.5949 (1) | −2.3493 (1) | −0.654 (1) | 3.8602 (1) | −0.9810 (1) |
| Precipitation | −0.0009 (1) | 0.0075 (1) | 0.0017 (1) | 0.001 (1) | 0.0066 (1) | −0.0008 (1) |
| Distance to urban centers | −0.0009 (1) | −0.0009 (1) | 0.0004 (1) | −0.001 (1) | −0.0004 (1) | 0.0010 (1) |
| Distance to the highway | −0.0005 (1) | 0.0004 (1) | 0.0002 (1) | 0.002 (1) | −0.0009 (1) | 0.0005 (1) |
| Distance to the expressway | 0.0008 (1) | −0.0001 (1) | 0.0003 (1) | 0.003 (1) | −0.0006 (1) | 0.0001 (1) |
| Population density | −0.0003 (1) | −0.0049 (1) | −0.0052 (1) | −0.011 (2) | 0.0009 (1) | −0.0023 (1) |
| GDP | −0.0002 (1) | 0.0002 (1) | −0.0003 (2) | 0.002 (1) | 0.0007 (1) | −0.0001 (1) |
| Constant | 9.6001 | −99.0562 | 52.3665 | 13.431 | −109.9696 | 23.0897 |
| Number of significant factors | 12 | 12 | 11 | 12 | 10 | 12 |
| Pseudo R2 | 0.4979 | 0.2389 | 0.2238 | 0.1870 | 0.5375 | 0.5064 |
Note: (1) and (2) represent significance at 1% level and 5% level, respectively.
Table 5.
Simulated changes in land uses/covers under different scenarios (Unit: km2 and %).
| Land Use Types | Base Year | BAU (a) | CES (b) | REG (c) | |||
|---|---|---|---|---|---|---|---|
| 2010 | 2030 | 2030 | 2030 | ||||
| Area | Area | % | Area | % | Area | % | |
| Cultivated land | 163,725 | 166,973 | 2 | 166,318 | 1.6 | 165,460 | 1.1 |
| Forestry area | 3255 | 1540 | −52.7 | 3330 | 2.3 | 1483 | −54.4 |
| Grassland | 2525 | 1550 | −38.6 | 1557 | −38.3 | 1551 | −38.6 |
| Water area | 2881 | 2675 | −7.2 | 2629 | −8.7 | 2644 | −8.2 |
| Built-up area | 2630 | 2947 | 12.1 | 3033 | 15.3 | 3796 | 44.3 |
| Unused land | 102,686 | 102,017 | −0.7 | 100,835 | −1.8 | 102,768 | 0.1 |
© 2017 by the authors. Licensee MDPI, Basel, Switzerland. This article is an open access article distributed under the terms and conditions of the Creative Commons Attribution (CC BY) license (http://creativecommons.org/licenses/by/4.0/).
Share and Cite
MDPI and ACS Style
Samie, A.; Deng, X.; Jia, S.; Chen, D. Scenario-Based Simulation on Dynamics of Land-Use-Land-Cover Change in Punjab Province, Pakistan. Sustainability 2017, 9, 1285. https://doi.org/10.3390/su9081285
AMA Style
Samie A, Deng X, Jia S, Chen D. Scenario-Based Simulation on Dynamics of Land-Use-Land-Cover Change in Punjab Province, Pakistan. Sustainability. 2017; 9(8):1285. https://doi.org/10.3390/su9081285
Chicago/Turabian StyleSamie, Abdus, Xiangzheng Deng, Siqi Jia, and Dongdong Chen. 2017. "Scenario-Based Simulation on Dynamics of Land-Use-Land-Cover Change in Punjab Province, Pakistan" Sustainability 9, no. 8: 1285. https://doi.org/10.3390/su9081285
Note that from the first issue of 2016, this journal uses article numbers instead of page numbers. See further details here.