Article

Assessment of Two Soil Fertility Indexes to Evaluate Paddy Fields for Rice Cultivation

by
Bahareh Delsouz Khaki
1,
Naser Honarjoo
1,*,
Naser Davatgar
2,
Ahmad Jalalian
1 and
Hosein Torabi Golsefidi
3
1
Department of Soil Science, College of Agriculture, Isfahan (Khorasgan ) Branch, Islamic Azad University, 81551-39998 Isfahan, Iran
2
Soil and Water Research Institute, Agricultural Research, Education and Extension Organization (AREEO), 3177993545 Karaj, Iran
3
Department of Soil Science, Faculty of Agricultural Sciences, Shahed University, 3319118651 Tehran, Iran
*
Author to whom correspondence should be addressed.
Sustainability 2017, 9(8), 1299; https://doi.org/10.3390/su9081299
Submission received: 29 May 2017 / Revised: 7 July 2017 / Accepted: 19 July 2017 / Published: 26 July 2017

Abstract

:
Assessing soil fertility is essential to help identify strategies with less environmental impact in order to achieve more sustainable agricultural systems. The main objective of this research was to assess two soil fertility evaluation approaches in paddy fields for rice cultivation, in order to develop a user-friendly and credible soil fertility index (SFI). The Square-Root method was used as a parametric approach, while the Joint Fuzzy Membership functions as a fuzzy method with adapted criteria definition tables, were used to compute SFI. Results indicated that both of the methods determined the major soil limiting factors for rice cultivation clearly, and soil fertility maps established using GIS (Geographic Information System) could be helpful for decision makers. The coefficients of determination (R2) for the linear regression between the two SFI values and rice yields were relatively high (0.63 and 0.61, respectively). Additionally, the two SFI were significantly correlated to each other (r = 0.68, p < 0.05). The study results demonstrated that both of the methods provide reliable and valuable information. Compared to the fuzzy method, the procedure of the parametric method is easier but may be expensive and time-consuming. However, the fuzzy method, with carefully chosen indicators, can adequately evaluate soil fertility and provide useful information for decision making.

1. Introduction

Soil, the source of life, is the most vital and valuable natural resource which is not renewable quickly. Soil fertility is a dynamic natural property that can change through the impact of natural and human derived factors [1]. Having detailed knowledge about soil fertility is a prerequisite for assessing the long-term impact of new intensive rice production technologies on paddy soils [2]. Moreover, soil characterization in relation to the evaluation of the fertility of the soil of an area is an important aspect in the basis of sustainable agriculture [3]. To have suitable soil management, the farmer should know what amendments are required to optimize the productivity of the soil for specific crops [1]. Specific spatial assessment and monitoring of the limitations of soil nutrient uptake and rice yield at regional scales is needed to identify the problem areas as a context for making strategic agronomic decisions [2]. An assessment of the soil fertility status by using a soil index could provide key information to improve strategies and effective techniques for the future to achieve sustainable agriculture. Soil Fertility Index (SFI) values can be used to develop fertility maps and make recommendations based on soil spatial variability in fertility management. The analysis, which allows the identification of the main limiting factors for agricultural production, and enables decision makers to enhance high quality crop management, can increase land productivity [4]. Management guidelines and improving requirements and constraints which have key roles in sustaining productivity can be established for a specific site when soil variability, with its major evaluative indicators, is identified [5]. Moran el al. [6], calculated a soil fertility index (SFI) using pH, organic carbon (OC), phosphorus (P), potassium (K), exchangeable calcium (Ca), magnesium (Mg), and aluminum (Al) for a forest, to explore the relationship between soil fertility and secondary succession rate and crop choice. Panwar et al. [7], used the soil fertility index (SFI) according [3] to quantify the soil fertility for four types of land-use systems: plantation of Tectona grandis (forest), home gardens (mixture of arecanut, banana, citrus, vegetables, and flowers in four to five vertical strata), plantation of arecanut (Areca catechu), and agriculture (mono-cropping of rice and maize). Mbogoni et al. [8] evaluated soil fertility using organic matter content (OC), soil pH, electrical conductivity (EC), total nitrogen (TN), C/N ration, available phosphorus (AP), exchangeable calcium (Ca), magnesium (Mg) and texture (sand, silt and clay) for enhancing productivity in rice-based systems. They used average weighted data of topsoil samples (0–25 cm depth) for the mentioned fertility characteristics.
FAO (Food and Agriculture Organization) guidelines for the land evaluation system [9,10] have been used widely for land suitability. This system is based on matching between land (soil and climate) qualities and characteristics, and crop requirements. The system is based on field surveys, including slope, flooding and drainage, coarse fragment and soil depth, and a chemical and physical analysis such as pH, organic carbon, electrical conductivity, exchangeable sodium percentage, cation exchange capacity, carbonate content, texture, structure, etc., which have to be recalculated over a certain depth (upper 25 cm, depth of the rooting system), sometimes by using weighting factors for the different profile sections. Physical land evaluation methods [11,12] are crucial for evaluating potentials and constraints of land for an intended land use. Land suitability assessment methods can be divided into the relative limitation scale approach (simple limitation—limitation regarding number and intensity) and the parametric approach (Storie—square root) [11]. Although the outcomes of different land suitability methods are usually correlated to each other [13,14,15], comparison of the methods indicates that the results of parametric methods, in particular the square root parametric method, are more realistic than others [13,16]. Torabi Golsefidi et al. [17], Chen [18], Olaley et al. [19], Boroom Nasab et al. [20], and Soltani et al. [21] carried out land suitability evaluations for irrigated rice production using the parametric method. They showed land suitability classes and the most limiting factors, and suggested some corrective and conservation practices to achieve long-term sustainable production of rice in paddy fields under consideration of 0–100 cm depth. Selassie et al. [22] evaluated land suitability using FAO [9,10,11,12,13,14,15,16,17,18,19,20,21,22,23] guidelines, and applied the maximum limitation method. They analyzed surface layer samples (0–30 cm) for cereal crops (maize, millet, teff, and rice) in northwestern Ethiopia. Ayalew and Selassie [24] evaluated land suitability for cereal and pulse crops (maize, wheat, soybean, and chickpea) in Ethiopia based on the maximum limitation method. The evaluation criteria were soil depth, texture, drainage, pH, organic matter and slope, which were rated based on the FAO land evaluation system, based on FAO [9,25] guidelines.
Due to the combined effects of physical, chemical and biological processes that operate with different intensities and scales, soils are typically highly variable [26]. Moreover, due to their low spatial resolution, focus on pedological characterizations, lack of quantitative data, large between-farm variability in crop management, and dynamic changes in many soil nutrients, existing soil maps in the developing countries of Asia often do not provide sufficient information for agronomic purposes [27]. Studies show that fuzzy methods produce contiguous areas and reject less information at all stages of the analysis. They are much better methods for the classification of continuous variation. The use of fuzzy sets theory in land suitability evaluations for agricultural uses was examined in some studies, which revealed that this methodology is one of the best methods in given circumstances [28,29,30,31]. Furthermore, joint fuzzy membership functions (JFMF) can be used to combine sets of different soil properties into more general indices of soil fertility quality [32]. Additionally, the use of fuzzy mapping techniques that account for the various sources of uncertainty in a spatial land classification procedure is of particular interest for large floodplains [2]. Dobermann and Oberthür [2] defined two soil fertility qualities for irrigated Riceland (Paddy fields) in the Philippines by using data from 0–20 cm and fuzzy membership functions with Monte Carlo simulation to produce maps of membership values for three soil fertility classes and two multivariate soil fertility qualities. They didn’t evaluate the results with actual yield.
Rice (Oryza sativa L.) is an important food crop for a large proportion of the World’s population [33]. It also is considered to be a strategic crop in Northern Iran and the second staple food in that country, after wheat [34]. Guilan province is the center of rice production in Iran [35], in which rice is planted in the paddy fields. Despite the importance of rice cultivation in the province, soil fertility and suitability studies have not been conducted widely. Due to special situations in the paddy fields, soil assessment is very difficult, time-consuming and expensive. Therefore, in order to achieve sustainable production of rice in the area, and in similar paddy fields, the study objectives were: (1) to develop a user-friendly, inexpensive and credible soil fertility index to evaluate the paddy fields for rice cultivation through assessment and comparison of two methods which are conceptually different from each other: the square root method as a parametric approach and the joint fuzzy membership functions as a fuzzy method; (2) to identify specific soil limitations for rice cultivation in the paddy fields of the Foumanat plain in Guilan province; (3) to determine the soil suitability of the study area, for regarded land-use, using parametric and fuzzy methods; and (4) to map the soil suitability of the study area for rice cultivation.

2. Materials and Methods

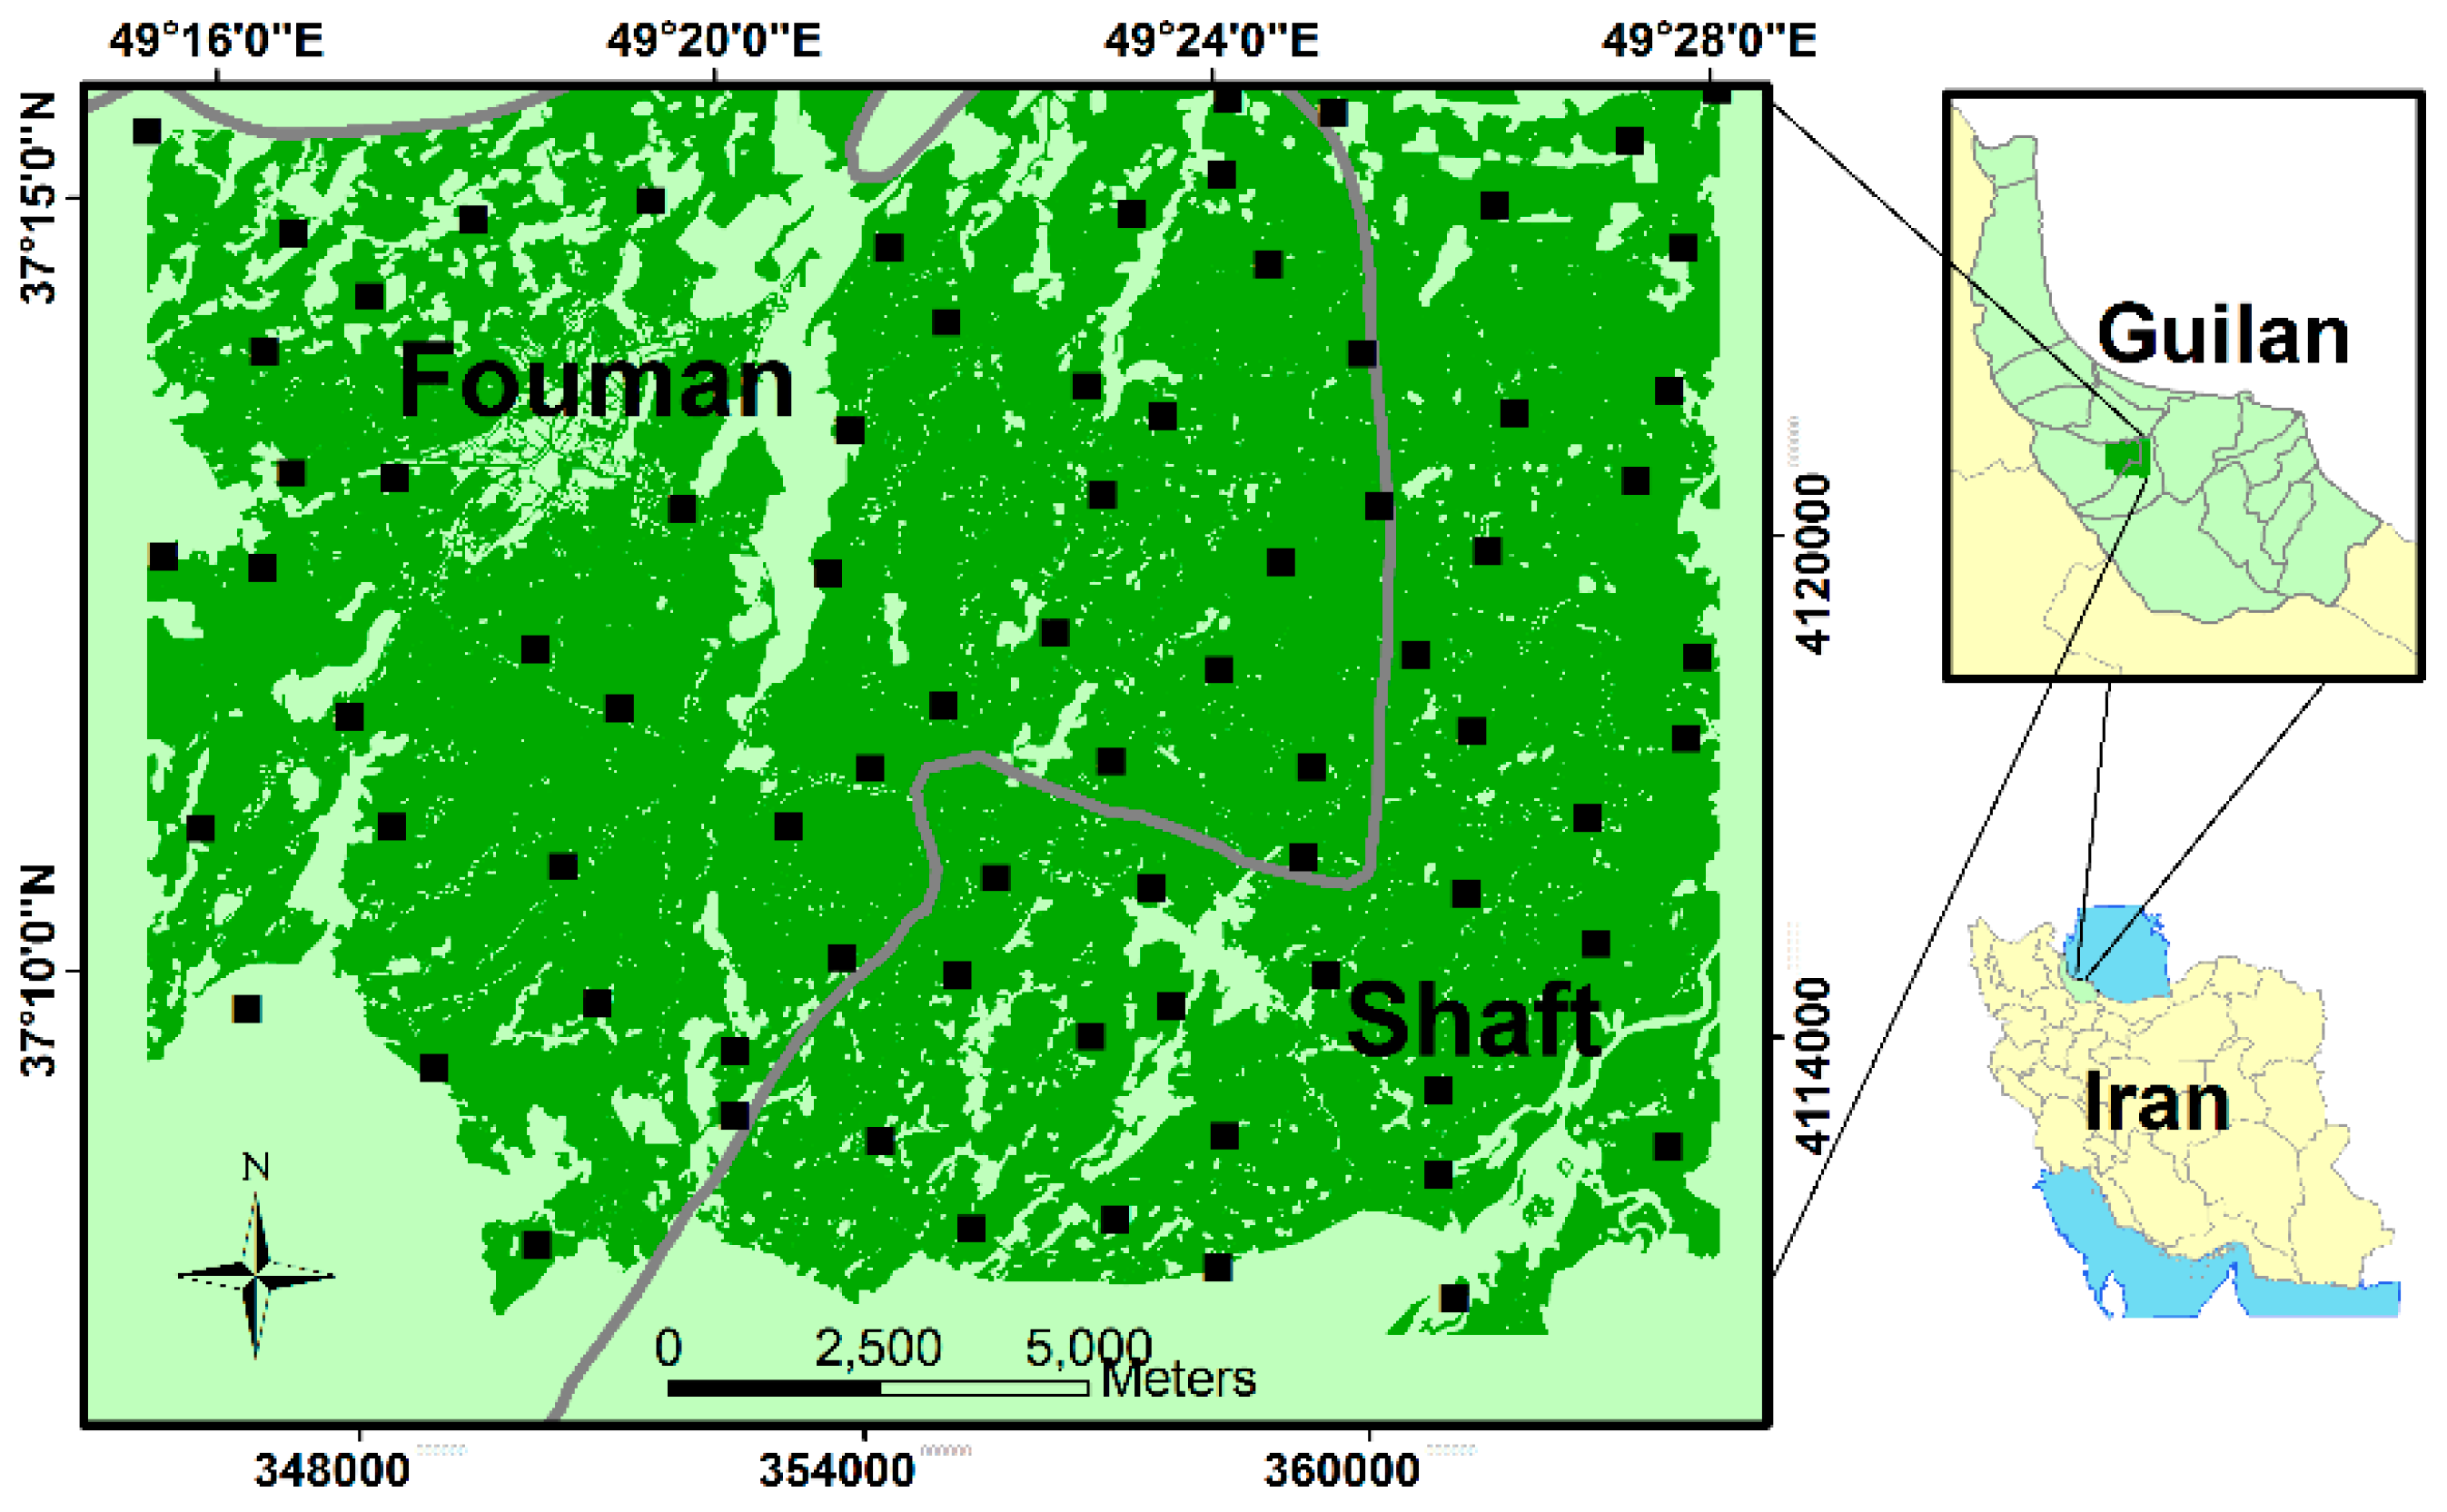
2.1. Site Description, Soil Sampling and Measurements, and Descriptive Statistics

This study was conducted in an area of 20,000 ha of the paddy fields located in the Foumanat plain. The region is located on flat alluvial soils within two cities (Fouman and Shaft) of Guilan province, in Northern Iran, with 49°15’40” to 49°28’5” east longitude and 37°7’48” to 37°15’56” north latitude. An overview of the boundary of the study area is given in Figure 1. Soil sampling points were well scattered in the paddy cultivated area, except for some places due to the existence of roads or urban areas. The region is sub-humid with a mean annual temperature of 20.5 °C and a mean annual precipitation of about 1200 mm. The soil texture ranges from silty loam to clay. The soil is classified as alfisol and inceptisol [36]. The land use of the study area is mainly irrigated rice paddy fields. Hashemi cultivar, a high quality and semi dwarf rice (Oryza sativa), is cultivated in the irrigated lowland paddy fields of the study area. Land preparation (including plowing, puddling, and harrowing) was performed 30 to 7 days before transplanting, annually in early spring. The study area was fertilized with 60 kg/ha 146 N2 (as urea). Although some farmers use 45 kg/ha P2O5 (a triple super-phosphate), a few farmers use 100 kg/ha K2O (a potassium sulfate). Soil samples were taken before fertilizing and planting the fields. More than 90% of the total root length of irrigated rice is located within the topmost 0–20 cm soil [37], soil samples were collected from the two upper layers, at depths of 0–25 cm at 77 well-scattered points and the thick­ness of the puddled plow layer (Ap horizon) was measured. Teams of two persons collected soil samples of nearly equal quantities from each site. The location coordinates of each sampling site were recorded using the global positioning system (GPS). Soil samples were kept in plastic bags, air-dried and ground to pass through a 2 mm sieve before chemical and physical analysis. The electrical conductivity (EC) was determined from the saturation soil paste extract by an EC meter device. Particle size analysis for soil texture was conducted by the hydrometer method. Soil pH was measured in 1:1 (W/W) soil/water suspension, organic C (OC, Walkley–Black [38], cation exchange capacity (CEC, Na-Oac method, pH 8.2). Overall slope percentage, flooding, drainage, and coarse fragment (volume %) were determined in the field survey. Yield data and general agronomic information were collected from around the center of 77 fields at harvest time. These sampling locations were chosen according to soil sampling points and all was irrigated rice (Oryza sativa L.). Around the center of each field, one 0.5 × 0.5 m quadrate was selected for yield sampling. The hollow and plum grain were separated carefully from air-dried samples; thereafter, the plum grain weights were determined after 48 h in 70 °C. The descriptive statistics including mean, standard deviation (SD), minimum, median, maximum, and coefficient of variation (CV) were calculated for each of the properties in SPSS 17.0 software (SPSS Inc., Chicago, IL, USA).

2.2. Soil Parametric Fertility Index (SFI-1) Calculation

In this study, the root square method was used as a parametric method for calculating soil fertility index. To evaluate the qualitative land suitability, land properties—including soil and climate requirements—were compared with the corresponding plant requirements. This procedure used a numerical scale ranging between a maximum value of 100 and a minimum value of 0 was assigned to each characteristic of the land. If a characteristic was quite good for the intended crop, the maximum rate of 100 was assigned to it and when it met some limitations, a lesser rate was assigned to it, then, using Equation (1), the Land Index was calculated. Since the objective of the study was a soil fertility index calculation, climatic characteristics were not considered. To determine the requirements for rice cultivation, some literature sources were reviewed, including studies by the FAO [10,25], Sys et al. [39], Mongkolsawat et al. [40], and Dengiz [41]. Additionally, results obtained from Torabi [17], combined with experimental reports and regional experiences, were used to adapt the suggested tables by Sys et al. [11,39], and Givi [42] for the requirements of irrigated rice cultivation in the study area. Table 1 shows soils and landscape requirements for irrigated rice in the paddy fields of the Foumanat plain in Guilan province in the Northern Iran. According to the adjusted table, the soil requirements for irrigated rice in the study area included slope, flooding, drainage, texture, coarse fragment, soil depth, apparent cation exchange capacity, base saturation, sum of basic cations, pH, organic carbon, electrical conductivity and exchangeable sodium percentage. Hence, these characteristics were rated using Table 1 and then a soil parametric fertility index (SFI-1) was calculated using the square root method equation (Equation (1)) [39]. This method takes into account all of the considered characteristics and they are combined by multiplication. The most limiting characteristic (the one with the lowest rate) influences the final obtained land index (total rate for a land unit or sample point) more than others in the equation. When multiplied by other characteristics, the limiting factor with the lowest rate may affect the total land rating irrationally. Thus, the square root method was used in order to decrease its irrational influence on the total index and make it more mathematically balanced [25].
I = (Rmin) × √A/100 × √B/100 × …
where:
  • I = index of square root method (here as soil parametric fertility index: SFI-1);
  • Rmin = the minimum rated criterion;
  • A, B, etc. = criteria other than minimum rated criterion.
After calculating a soil parametric fertility index (SFI-1), using the values, the index (SFI-1) map was produced using the IDW method in Arc GIS (9.3) and then classified into four classes, as presented in Table 2.

2.3. Soil Fuzzy Fertility Index (SFI-2) Calculation

Dobermann and Oberthür [2] combined sets of different soil properties into inherent soil fertility quality using joint fuzzy membership functions (JFMF) and, as in this study, a soil fuzzy fertility index (SFI-2) was defined using a minimum function. Additionally, in order to calculate the index (SFI-2), general physical and physico-chemical soil conditions, which are mainly influenced by the soil type, were considered. The suitable indicators of the SI-2 are thickness of the plow layer (Ap), clay content (Clay), CEC, organic C (OC), EC and pH. Changes of such soil properties occur slowly, but intensive rice cultivation may be affected by some of them.
A fuzzy membership function (FMF) converts attributed value Z to fuzzy membership function values (FMFz) on a continuous scale ranging from 0 to 1, with 1 representing full membership and 0 no membership to the set. Dobermann and Oberthür [2] defined three categories for each soil property:
  • Class 1—low fertility, severe constraint to nutrient uptake and high rice yield (Z < bl).
  • Class 2—medium fertility, possible constraint to nutrient uptake and high rice yield (b1 < Z < b2).
  • Class 3—high fertility, no constraint to nutrient uptake and high rice yield (Z > b2).
Dobermann and Oberthür [2] used a sigmoid FMF, which, in its symmetrical form, can be written as:
F M F z   =   1 ( ( 1   +   Z b 1 d d )   p )   f o r   Z   < ( b 1 + d )
F M F z   =   1 f o r   ( b 1 +   d )     Z     ( b 2 d )
F M F z   =   1 ( ( 1   +   Z b 2 +   d d )   p ) f o r   Z   > ( b 2 d )
where b1 and b2 are the lower and upper class limits, d is the dispersion value, and p is the power value (determining curve slope).
To calculate and map the soil fertility index for Class 3, in this study only one threshold (except for pH) was used in all three of the above Equations (2)–(4)) for soil properties; thus, rather than b1 and b2, it has been shown as b in Table 3. Table 3 shows some of b and d values determined by using Dobermann and Oberthür [2] based on the Rice Research Institute of Iran (RRII) expert knowledge. Fuzzy membership functions (FMF) were calculated for EC, pH and other soil characteristics using Equations (2), Equations (2)–(4), and (4), respectively. According to Table 3, a high suitability (all stable soil properties are favorable for intensive rice cropping) occurs when Ap ≥ 20, Clay ≥ 35, OC ≥ 2, CEC ≥ 20, EC ≤ 2 and pH = 6–7)). After calculating fuzzy membership function (FMF) values using Table 3, Equation (5) was used to combine fuzzy membership function values into a soil fuzzy fertility index (SFI-2).
SFI-2 = MIN (FMFAp, FMF Clay, FMF OC, FMF CEC, FMF EC, FMF pH)
where FMFAp, FMF Clay ,FMF OC, FMF CEC, FMF EC, FMF pH are the recalculated FMF values for Ap, Clay ,OC, CEC, EC and pH by using Equation (1), respectively.
Therefore, all conditions have to be fulfilled before a soil matches the requirements of an inherently very productive and highly suitable soil for rice cultivation. Finally, using the soil fuzzy fertility index (SFI-2) values, the index (SFI-2) map was produced using IDW method in Arc GIS (9.3), then classified into four classes according to Table 2.

2.4. Validation of Soil Fertility Index

The soil fertility index values estimated by the parametric and fuzzy methods were compared through the Pearson correlation coefficient to understand the effectiveness of each.

3. Results and Discussion

3.1. Exploratory Analysis of Data

Descriptive statistics for soil properties are given in Table 4. The soil was acid to slightly alkaline, with pH ranging from 5.49 to 7.53. The mean OC was 2.48%. According to the study by Dobermann and Fairhurst [43], the mean soil OC content in this area was high for rice growth. Thickness of the plow layer (Ap) was mostly in the range of 10 to 22 cm. The restriction to root growth is possible in shallow plow layers of less than 15 cm [44]. Moreover, soil volume available for nutrient uptake is limited in this condition.

3.2. Soil Limitations to Intensive Rice Cropping

Minimum calculated values in both of the two conducted methods show the main constraint of soil for the regarded land use. Based on the parametric method, about 41% of all analyzed samples had minimum values (Rmin) due to drainage. Soil texture, organic carbon, coarse fragment, slope, EC, base saturation and soil depth caused 20.5%, 15.4% and 7.7%, 5.1%, 5.1%, 2.6% and 2.6% of minimum values in other sample points, respectively. Therefore, the greatest limitations in this method’s factors were caused by drainage. Alternatively, based on the fuzzy method, about 43.4% of all the analyzed samples had minimum FMF values due to the thickness of the plow layer. Soil acidity (pH), clay, organic C, EC and CEC caused 20.5%, 16.4%, 12.3%, 4.9% and 2.5% of minimum values in other sample points respectively and about 8% of the sample points did not have any limitations. Thus, among the soil factors used in this method, most of the limitations were caused by the thickness of the top soil. Consequently, the most limiting factors include drainage, thickness of the plow layer, and soil texture, organic carbon, pH and coarse fragments. Conservation techniques can be adopted to improve the utilization of soil in the case of unfavorable drainage and texture. Additionally, as long as a sufficient quantity of water is applied, texture may not be a serious problem for irrigated rice production in the study area. Therefore, for adequate rice production, sufficient quantity of water is needed. Organic matter and pH are crucial to sustainable agriculture. Soil pH affects the plant nutrient availability by controlling the chemical forms of the nutrients and their availability in the soil. High levels of organic matter not only provide part of the N requirement for crop plants, but also enhance the nutrient and water retention capacity of soils and create a favorable physical, chemical and biological environment. Therefore, according to the study results, it is essential to increase the level of organic matter in the soils, and apply sufficient fertilizer with due attention to organic matter and pH. The content of coarse fragments influences the capacity of soil to retain nutrients and water and tillage conditions but, since they are more permanent in nature, it is difficult to remove them either culturally or mechanically.

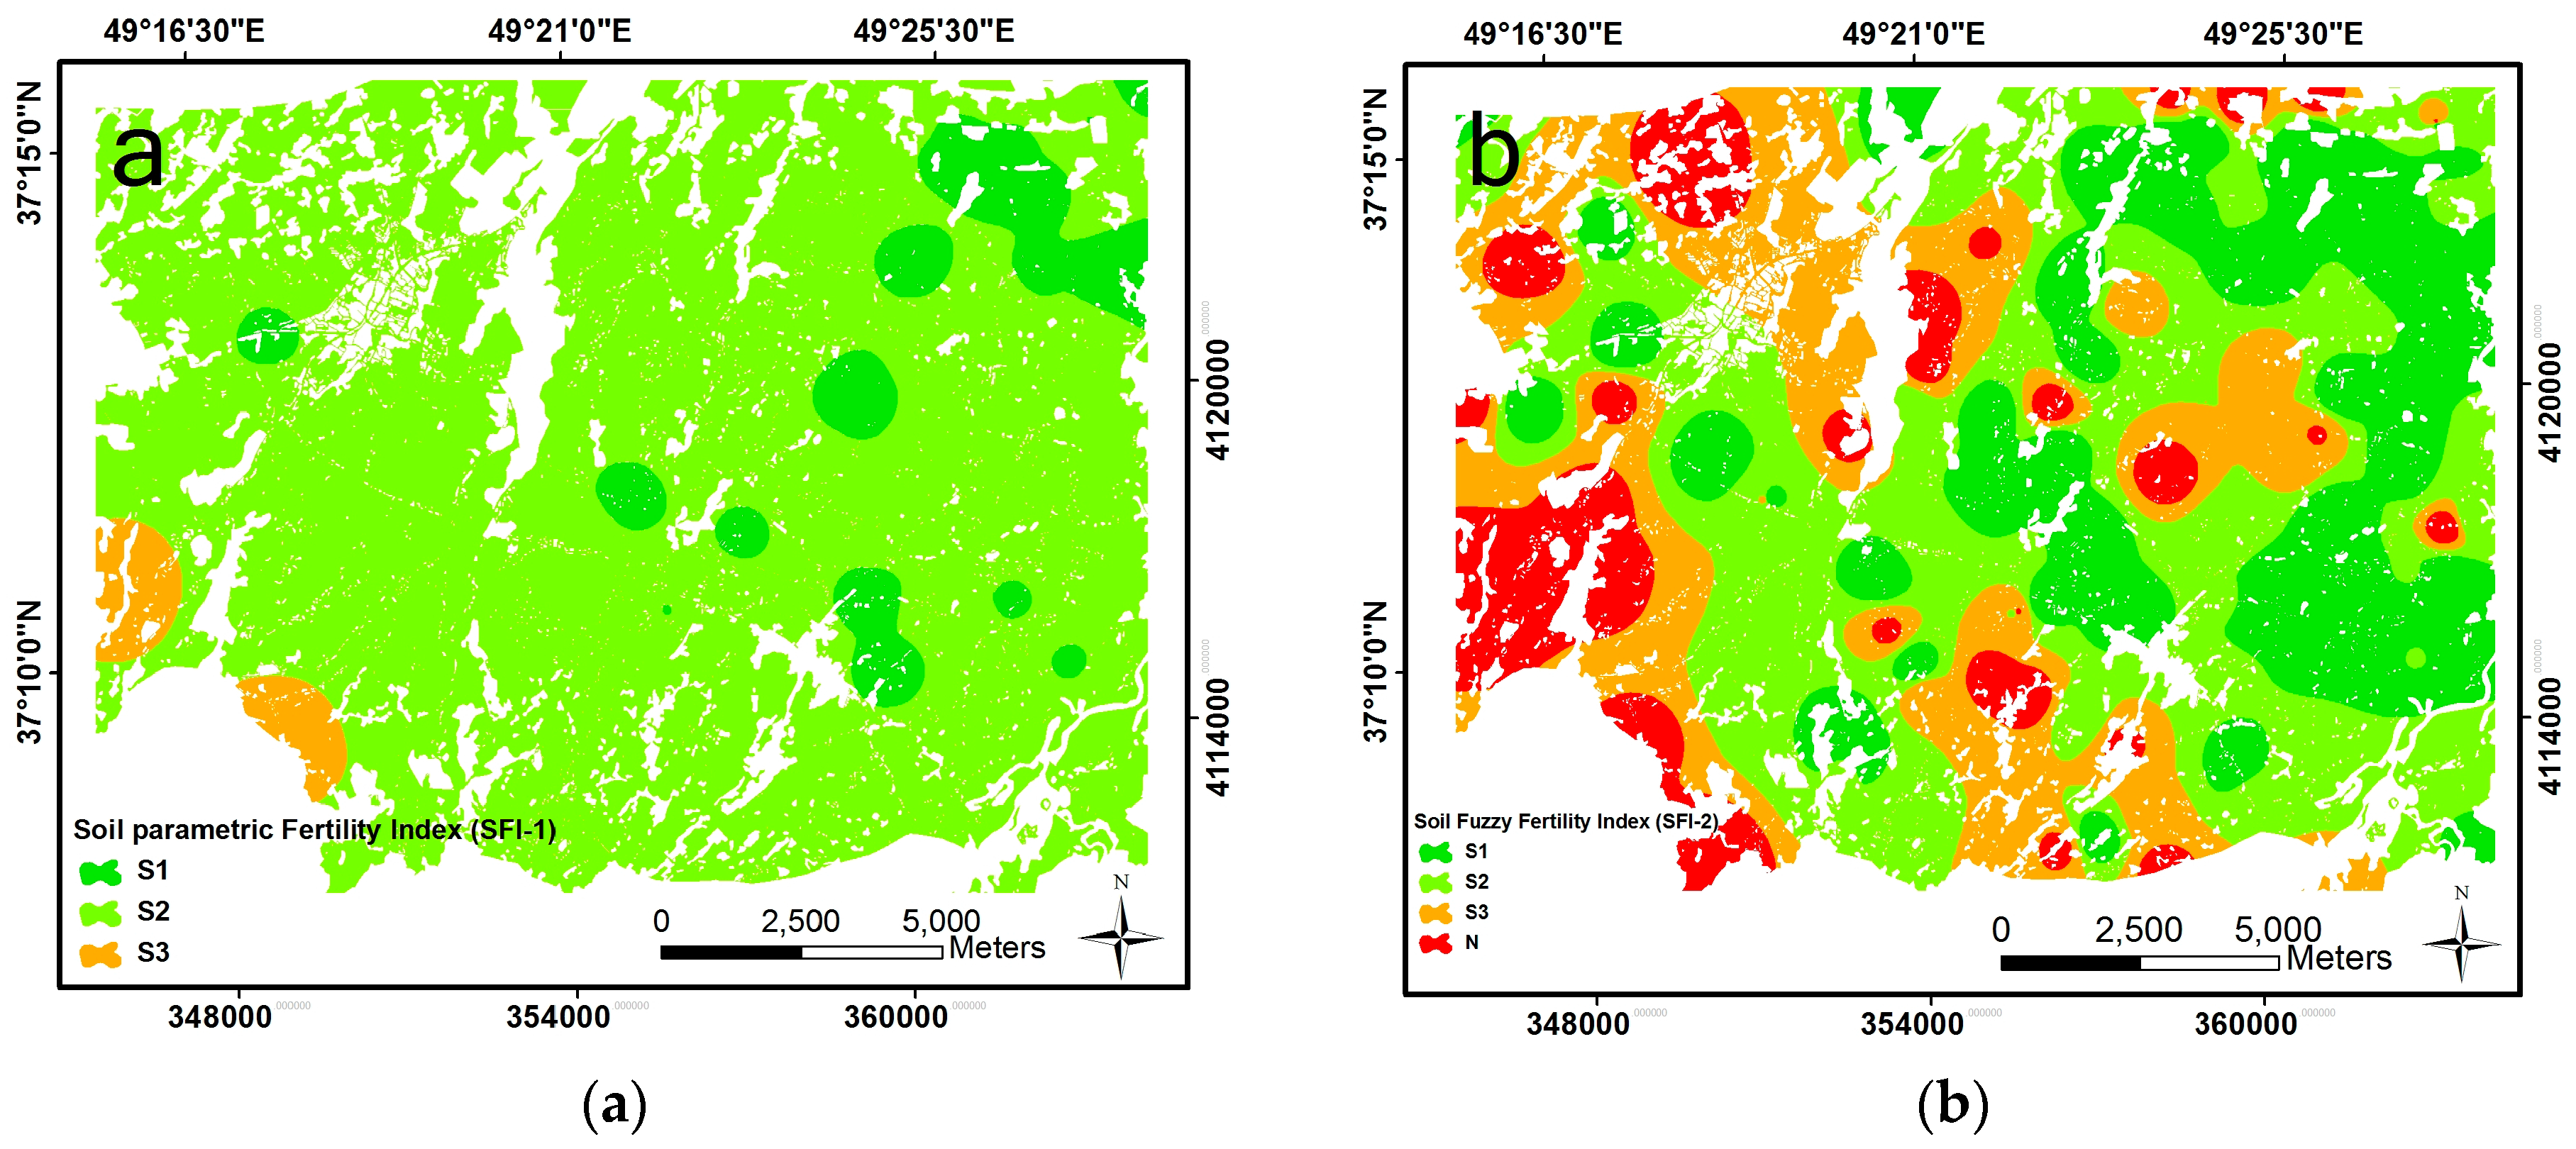
3.3. Soil Fertility Index (SFI-1 and SFI-2)

The maximum and minimum of soil fertility indexes, which were calculated through the parametric method (SFI-1), were about 78.8 and 46.8, respectively. The average value of SFI-1 was 66.7. Thus, as shown in Figure 2, most of the investigated area had a moderate fertility for intensive rice cultivation. Due to their lower SFI-1 values, two small parts of the study area in the southwestern part were not suitable for rice cultivation due to clay content. The maximum and minimum soil fertility indexes which were calculated through the fuzzy method (SFI-2) were about 1 and 0.1, respectively and the average value of SFI-2 was 0.64. Figure 2 shows that, based on the fuzzy method, 38% of the investigated area had a moderate fertility for intensive rice cultivation. Due to their lower SFI-2 values, most of the study area in the western parts may not be suitable for further intensification of rice cultivation due to soil depth and slope.

3.4. Soil Suitability

Table 5 shows the distribution of soil fertility classes for rice cultivation based on the parametric and fuzzy methods. This Table indicates the range of changes amongst classes in the study area, based on the two methods that are S1, S2, S3 and S1, S2, S3, N, respectively. Based on the parametric method, 8% of the study area was highly suitable (S1), 90% of the area was moderately suitable (S2) and just 2% was marginally suitable (S3). Evaluating the soil suitability by the fuzzy method indicated that 27% of the study area was highly suitable (S1), 38% of the area was moderately suitable (S2), 24% was marginally suitable (S3) and 11% was non-suitable (N) for rice cultivation. Therefore, based on Figure 2 and Table 5, a comparison of the two methods indicated that the results of the fuzzy method showed more differentiation in results.

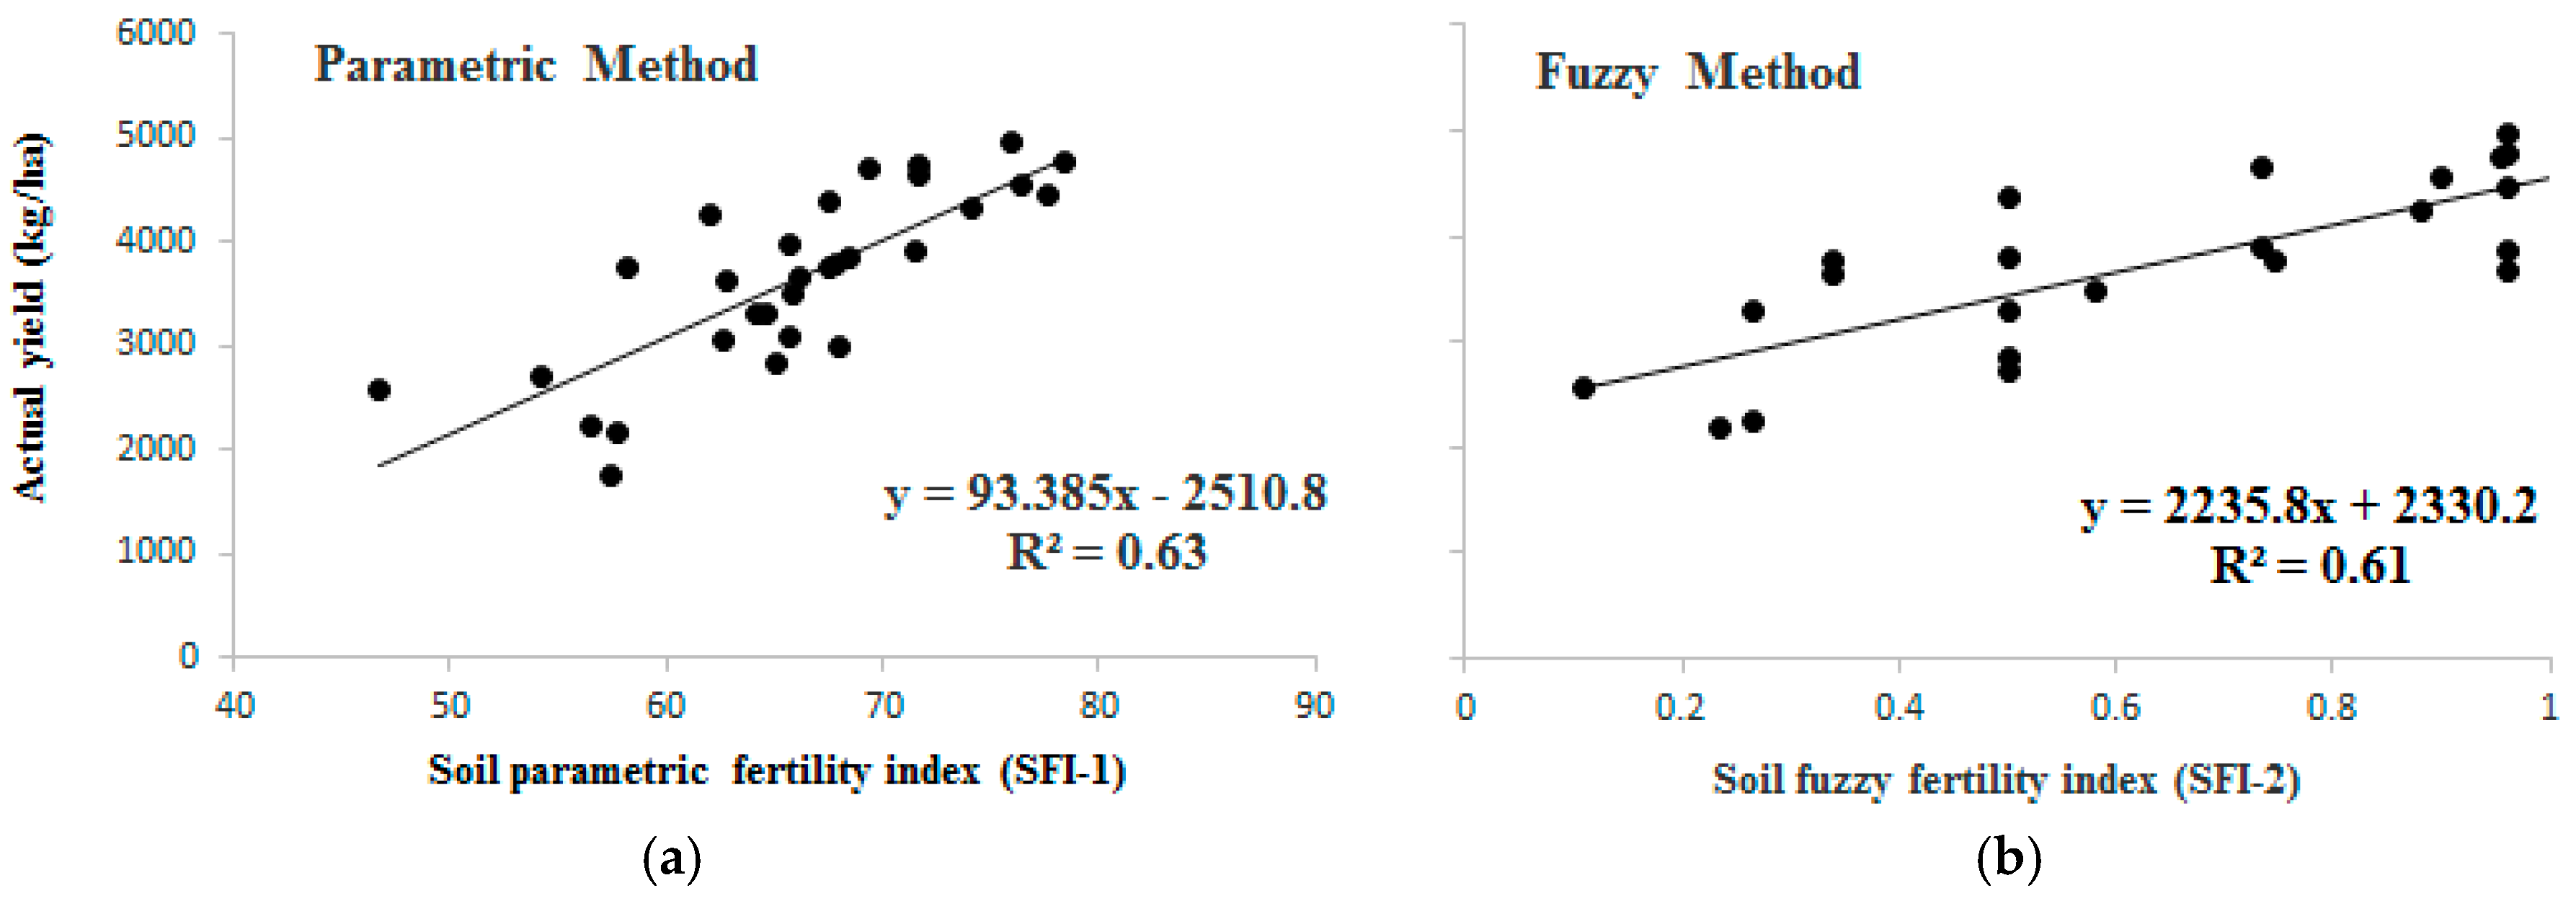
3.5. Relationship between SFI-1 and SFI-2 and Actual Yield

Figure 3 shows the relationship between the two calculated indexes (SFI-1 and SFI-2) and actual yield. The coefficients of determination (R2) for the linear regressions between the two indexes and actual yields for rice were relatively high: 0.632 and 0.61, respectively. Therefore, based on the two coefficients of determination (R2), the response of the rice yield to the two methods was similar and the two indexes (SFI-1 and SFI-2) could explain 60% of yield variations. Other yield variations could be due to climate and fertilizer management effects which were not considered in the two indexes.

3.6. Comparison of the Parametric and Fuzzy Methods

The FAO method may include a soil survey or soil survey data [45]. This would help to bridge the gap between soil survey and land-use planning by comparing the land conditions (sometimes provided by planners) and land-use requirements. A soil survey provides information about the land surface characteristics as well as the morphological, physical, chemical and mineralogical characteristics of the soils occupying a land area [46]. Therefore, this method can be employed by land-use planners to select areas suitable for crop production and for identifying and removing major limitations for cultivated crop production. Alternatively, decision makers can use the resulting information from the fuzzy method to focus on more detailed and meaningful options in water and nutrition requirements, as well as soil management, within the different suitability areas in paddy fields.
The index values (SFI-1 and SFI-2) calculated by the two different methods were compared through the Pearson correlation coefficient. There was a relatively high and significant correlation between the two index values (r = 0.68, p < 0.05), which indicated a significant positive relationship between the two indexes. Hence, the two approaches are related in the assessment of the soil fertility for crop production. Since both two methods were significantly correlated to each other, it is difficult to conclude which is the best approach; however, it depends greatly on factors such as the design of the study and choice of soil properties included in the model to compute the soil fertility index. The advantage of using the parametric method is that the soil fertility index could be assessed after measuring any number (low to high) of soil parameters, and this procedure is easier compared to the fuzzy method in terms of the scoring. It requires more literature review and expert opinions, however. The disadvantage of the method is that it requires multiple numbers of soil properties under different soil functional systems, which may be expensive and time-consuming in practical cases. The advantage of the conducted fuzzy method is that it includes scoring based on the design of the study, the system or the dataset to offset the subjectivity of the approach present in SFI-2. Additionally, it is advantageous due to its ability to calculate soil fertility with a lower number of soil parameters. However, some key soil indicators such as soil fertility (macro and micronutrients) and microbial (microbial biomass, microbial C, and N, and soil respiration) parameters for effective prediction of crop yield were not included in the dataset of the model of the fuzzy method, which was conducted by Dobermann and Oberthür [2]. The disadvantage of the fuzzy method is that it is subjective and relies mainly on the researcher’s point of view. In fact, soil parameters and the b and d values should be selected carefully.
One part of the study was a demonstrative test of fuzzy sets theory in soil fertility evaluations for agricultural uses. The results were in agreement with the findings of Elaalem [28], Sharififar et al. [29], Bagherzadeh and Gholizadeh [30], and Chaddad et al. [31]. The study confirmed that the fuzzy method could be useful for the incorporation of data from various domains and sources, and to define an area diverse in suitability classes for specific crops by using joint fuzzy membership functions (JFMF). This agrees with the findings of Dobermann and Oberthür [2]. However, rice ecosystems are currently faced with numerous issues, such as poor crop establishment, unsuitable soil and land conditions, water scarcity, biotic and environmental stresses, and inefficient agronomical practices, which result in low returns from rice cultivation. This study suggests that a small number of carefully chosen soil indicators, when used in a simple, non-linearly scored index such as the fuzzy method, provide information needed for the selection of better management practices. Additionally, both methods used clearly showed the main constraint of soil for the observed land use. Therefore, both soil fertility indexes can be considered efficient tools to help quantify the combined chemical and physical response of soil and improve crop management practices and sustainable use of soil as a resource.

4. Conclusions

According to the two methods used in the study, the majority of the study area was classified as moderately suitable for rice cultivation. The results of the parametric and fuzzy methods also demonstrated that the most important limiting factors were drainage and the thickness of the plow layer. The other limiting factors were texture, pH, organic matter and coarse fragment. The appropriate recommended management practices suggested to overcome these limitations and upgrade the suitability for increasing rice production include: increasing the thickness of the plow layer, application of sufficient water and fertilizer, improving the low levels of organic matter content of the soil in the area, and suitable conservation measures.
Soil fertility assessments can be made to help identify areas where problems occur, or need special attention, or a different management system. Comparison of parametric and fuzzy methods for calculating a soil fertility index suggested that the parametric method has higher success for predicting crop yield, however, the soil fertility indexes computed using the two established methods were significantly correlated to each other, indicating that the simpler and user-friendly SFI (SFI-1) can be similarly useful to evaluate soil fertility, but requires a number of soil parameters under different soil functional components as well as a carefully chosen minimum data set with small numbers of soil variables. Application of the fuzzy method and using joint fuzzy membership functions (SFI-2), can adequately evaluate soil fertility. Furthermore, SFI-2 can be regarded as the best and easiest method, with a lower number of indicator selection abilities, which should be regarded as a less expensive procedure over time compared to SFI-1. Therefore, SFI-2 can be recommended for developing countries where soil fertility evaluation studies are lacking due to funds. The determination of soil fertility using this method will strengthen basic information, the ability to formulate workable solutions to sustainable crop production and the adoption of best management practices for paddy fields. Although, it would make the methods more expensive, in order to effectively predict a particular crop yield, one must include soil nutrients and microbial parameters in the two models of SFI. In addition, the use of satellite data can provide accurate information for soil properties and yield prediction in similar studies. Although these would make the methods expensive.
In conclusion, the two methods conducted in the study offer two approaches to the improvement of rice yield by using the potentialities and capabilities, and removing the constraints, of the paddy fields. The soil fertility maps for rice, established using GIS, can enhance the planning alternatives within the paddy fields with a meaningful strategy to achieve optimum management and utilization of the available land resources for sustainable rice production in terms of location.

Acknowledgments

This research was funded by the Rice Research Institute of Iran (RRII) in Rasht. We appreciate their assistance with soil sampling and soil analyses and providing support.

Author Contributions

Bahareh Delsouz Khaki, Naser Honarjoo, Naser Davatgar, Ahmad Jalalian and Hosein Torabi Golsefidi designed the study and developed the methodology. Bahareh Delsouz Khaki, Naser Davatgar and Hosein Torabi Golsefidi collected the data. Bahareh Delsouz Khaki performed the analysis and wrote the manuscript. Naser Honarjoo, Naser Davatgar, Ahmad Jalalian and Hosein Torabi Golsefidi helped to interpret the results.

Conflicts of Interest

The authors declare no conflict of interest.

References

  1. Kavitha, C.; Sujatha, M.P. Evaluation of soil fertility status in various agro ecosystems of Thrissur District, Kerala, India. Int. J. Agric. Crop Sci. 2015, 8, 328–338. [Google Scholar]
  2. Dobermann, A.; Oberthür, T. Fuzzy mapping of soil fertility—A case study on irrigated riceland in the Philippines. Geoderma 1997, 77, 317–339. [Google Scholar] [CrossRef]
  3. Singh, R.P.; Mishra, S.K. Available macro nutrients (N, P, K and S) in the soils of Chiraigaon block of district Varanasi (UP) in relation to soil characteristics. Indian J. Sci. Res. 2012, 3, 97–100. [Google Scholar]
  4. Rabia, A.H. A GIS based land suitability assessment for agricultural planning in Kilte Awulaelo district, Ethiopia. In Proceedings of the 4th International Congress of ECSSS, Eurosoil 2012 “Soil Science for the Benefit of Mankind and Environment”, Bari, Italy, 2–6 July 2012. [Google Scholar]
  5. Xia, M.; Zhao, B.Z.; Hao, X.Y.; Zhang, J.B. Soil quality in relation to agricultural production in the North China Plain. Pedosphere 2015, 25, 592–604. [Google Scholar] [CrossRef]
  6. Moran, E.F.; Brondizio, E.S.; Tucker, J.M.; da Silva-Forsberg, M.C.; McCracken, S.; Falesi, I. Effects of soil fertility and land-use on forest succession in Amazonia. For. Ecol. Manag. 2000, 139, 93–108. [Google Scholar] [CrossRef]
  7. Panwar, P.; Pal, S.; Reza, S.K.; Sharma, B. Soil fertility index, soil evaluation factor, and microbial indices under different land uses in acidic soil of humid subtropical India. Commun. Soil Sci. Plan Anal. 2011, 42, 2724–2737. [Google Scholar] [CrossRef]
  8. Mbogoni, J.D.J.; Kiwambo, B.J.; Urassa, G.J.; Assenga, S.V. Soil Fertility Appraisal for Enhancing Productivity in Rice-Based Systems of Ruvu Basin, Tanzania; ARI-Mlingano: Tanga, Tanzania, 2011. [Google Scholar] [CrossRef]
  9. Food and Agriculture Organization. A Framework for Land Evaluation; FAO Soils Bulletin, No: 32; FAO: Rome, Italy, 1976; ISBN 92-5-1001 11-1. [Google Scholar]
  10. Food and Agriculture Organization. Guidelines: Land Evaluation for Irrigated Agriculture; FAO Soils Bulletin, No: 55; FAO: Rome, Italy, 1985; p. 243. ISBN 92-5-102243-7. [Google Scholar]
  11. Sys, C.; van Ranst, E.; Debaveye, J. Land Evaluation, Part I, Principles in Land Evaluation and Crop Production Calculations; International Training Centre for Post-Graduate Soil Scientists, University Ghent: Gent, Belgium, 1991. [Google Scholar]
  12. Sys, C.; van Ranst, E.; Debaveye, J. Land Evaluation, Part II: Methods in Land Evaluation. General Administration for Development Cooperation; International Training Centre for Post-Graduate Soil Scientists, University Ghent: Gent, Belgium, 1991. [Google Scholar]
  13. Ashraf, S.; Normohammadan, B. Qualitative evaluation of land suitability for wheat in Northeast-Iran Using FAO methods. Indian J. Sci. Technol. 2011, 4, 703–707. [Google Scholar] [CrossRef]
  14. Ashraf, S. Land suitability evaluation for irrigated barley in Damghan plain, Iran. Indian J. Sci. Technol. 2011, 4, 1182–1187. [Google Scholar]
  15. Jafarzadeh, A.; Abbasi, G. Qualitative land suitability evaluation for the growth of onion, potato, maize, and alfalfa on soils of the Khalat Pushan research station. Biologia 2006, 61, S349–S352. [Google Scholar] [CrossRef]
  16. Shahbazi, F.; Jafarzadeh, A.A. Qualitative evaluative evaluation of land suitability in Khusheh-mehr region of bonab for wheat, barley, alfalfa, onion, sugarbeet and maize. J. Agric. Sci. 2004, 14, 69–86. [Google Scholar]
  17. Torabi Golsefidi, H. Genesis, Classification and Land Suitability Evaluation of Wetland Soils for Irrigated Rice in Eastern Guilan Province. Ph.D. Thesis, Faculty of Agriculture, Isfahan University of Technology, Isfahan, Iran, 2001. [Google Scholar]
  18. Liu, W.; Rossi, M. Land Evaluation in Danling County, Sichuan Province, China. In Proceedings of the 26th Course Professional Master Geomatics and Natural Resources Evaluation, Florence, Italy, 23 June 2006; pp. 1–153. [Google Scholar] [CrossRef]
  19. Olaleye, A.O.; Akinbola, G.E.; Marake, V.M.; Molete, S.F.; Mapheshoane, B. Soil in suitability evaluation for irrigated lowland rice culture in southwestern Nigeria: Management implications for sustainability. Commun. Soil Sci. Plant Anal. 2008, 39, 2920–2938. [Google Scholar] [CrossRef]
  20. Boroomand Nasab, S.; Albaji, M.; Landi, A. Qualitative evaluation of land suitability for the major crops in the Shavoor Region, Iran. Crop Res. 2008, 36, 125–132. [Google Scholar]
  21. Soltani, S.M.; Hanafi, M.M.; Karbalaei, M.T.; Khayambashi, B. Qualitative land suitability evaluation for the growth of rice and off-seasons crops as rice based cropping system on paddy fields of Central Guilan, Iran. Indian J. Sci. Technol. 2013, 6, 5395–5403. [Google Scholar]
  22. Selassie, Y.G.; Ayalew, G.; Elias, E.; Getahun, M. Soil characterization and land suitability evaluation to cereal crops in Yigossa Watershed, Northwestern Ethiopia. J. Agric. Sci. 2014, 6, 199. [Google Scholar] [CrossRef]
  23. Food and Agriculture Organization. Guidelines on Land Evaluation for Rainfed Agriculture; Soils Bulletin No.52; FAO: Rome, Italy, 1998. [Google Scholar]
  24. Ayalew, G.; Selassie, Y.G. Land suitability evaluation for cereal and pulse crops using geographical information system in east amhara region, Ethiopia. Res. J. Agric. Environ. Sci. 2015, 4, 141–148. [Google Scholar]
  25. Food and Agriculture Organization. Guidelines: Land Evaluation for Rain Fed Agriculture; FAO Soils Bulletin, No: 52; FAO: Rome, Italy, 1983; p. 237. ISBN 9251014558. [Google Scholar]
  26. Goovaerts, P. Geostatistical tools for characterizing the spatial variability of microbiologycal and physico-chemical soil properties. Biol. Fertil. Soils 1998, 27, 315–334. [Google Scholar] [CrossRef]
  27. Oberthür, T.; Dobermann, A.; Neue, H.U. How good is a reconnaissance soil map for agro-nomic purposes? Soil Use Manag. 1996, 12, 33–43. [Google Scholar] [CrossRef]
  28. Elaalem, M. A comparison of parametric and fuzzy multi-criteria methods for evaluating land suitability for olive in Jeffara Plain of Libya. APCBEE Procedia 2013, 5, 405–409. [Google Scholar] [CrossRef]
  29. Sharififar, A.; Ghorbani, H.; Sarmadian, F. Soil suitability evaluation for crop selection using fuzzy sets methodology. Acta Agric. Slov. 2016, 107, 159–174. [Google Scholar] [CrossRef]
  30. Bagherzadeh, A.; Gholizadeh, A. Qualitative land suitability evaluation by parametric and fuzzy approaches for sugar beet crop in Sabzevar plain, northeast of Iran. Agric. Res. 2016, 5, 277–284. [Google Scholar] [CrossRef]
  31. Chaddad, I.; Feng, C.B.; AL-Husni, M.; Zhen, R.J. An application of land suitability evaluation for FTDP: A fuzzy MCDM approach. Int. J. Arab Cult. Manag. Sustain. Dev. 2009, 1, 160–176. [Google Scholar] [CrossRef]
  32. Burrough, P.A.; MacMillan, R.A.; Deursen, W.V. Fuzzy classification methods for determining land suitability from soil profile observations and topography. Eur. J. Soil Sci. 1992, 43, 193–210. [Google Scholar] [CrossRef]
  33. Fageria, N.K.; Slaton, N.A.; Baligar, V.C. Nutrient management for improving lowland rice productivity and sustainability. Adv. Agron. 2003, 80, 63–152. [Google Scholar] [CrossRef]
  34. Khush, G.S. Varietal needs for different environments and breeding strategies. In New Frontiers in Rice Research; Muralidharan, K., Siddiq, E.A., Eds.; Directorate of Rice Research: Hyderabad, India, 1993. [Google Scholar]
  35. Keshavarz, F.; Allahyari, M.S.; Azarmi, Z.; Khayati, M. Effective factors on non-adoption of high producing varieties among rice producers in Guilan province. J. Agric. Ext. Educ. Res. 2011, 3, 99–112. [Google Scholar]
  36. Soil Survey Staff. Keys to Soil Taxonomy, 9th ed.; USDA-NRCS: Washington, DC, USA, 2003.
  37. De Datta, S.K.; Samson, M.I.; Kai-Rong, W.; Buresh, R.J. Nitrogen use efficiency and nitrogen-15 balances in broadcast-seeded flooded and transplanted rice. Soil Sci. Soc. Am. J. 1988, 52, 849–855. [Google Scholar] [CrossRef]
  38. Walkley, A.; Black, I.A. An examination of the Degtjareff method for determining soil organic matter, and a proposed modification of the chromic acid titration method. Soil Sci. 1934, 37, 29–38. [Google Scholar] [CrossRef]
  39. Sys, C.; van Ranst, E.; Debaveye, J. Land Evaluation, Part III: Crop Requirements. General Administration for Development Cooperetion; International Training Centre for Post-graduate Soil Scientists, University Ghent: Gent, Belgium, 1993. [Google Scholar]
  40. Mongkolsawat, C.; Thirangoon, P.; Kuptawutinan, P. A Physical Evaluation of Land Suitability for Rice. A Methodological Study Using GIS. Available online: https://www.geospatialworld.net/article/a-physical-evaluation-of-land-suitability-for-rice-a-methodological-study-using-gis/ (accessed on 1 September 2009).
  41. Dengiz, O. Land suitability assessment for rice cultivation based on GIS modeling. Turk. J. Agric. For. 2013, 37, 326–334. [Google Scholar] [CrossRef]
  42. Givi, J. Qualitative Evaluation of Land Suitability for field and fruit crops; Iranian Soil and Water Research Institute: Tehran, Iran, 1997; pp. 1–115. [Google Scholar]
  43. Dobermann, A.; Fairhurst, T.H. Nutrient Disorders and Nutrient Management; Potash and Phosphate Institute, Potash and Phosphate Institute of Canada and International Rice Research Institute: Singapore, 2000. [Google Scholar]
  44. Davatgar, N.; Neishabouri, M.R.; Sepaskhah, A.R. Delineation of site specific nutrient management zones for a paddy cultivated area based on soil fertility using fuzzy clustering. Geoderma 2012, 173, 111–118. [Google Scholar] [CrossRef]
  45. Abdulkadir, A. Land Evaluation for Irrigation in Bauchi State. Ph.D. Thesis, Bayero University Kano, Kano, Nigeria, 1986. [Google Scholar]
  46. Yau, S.L.; Manasseh, E.A.; Sharifai, A.I. Land Evaluation for improved Rice Production in Watari Irrigation Project Kano State, Nigeria. Bayreo J. Pure Appl. Sci. 2014, 7, 116–120. [Google Scholar] [CrossRef]
Figure 1. Location of the study area in the paddy fields of the Foumanat plain in the Northern Iran.
Sustainability 09 01299 g001
Figure 2. Spatial variability and suitability classes of soil in the study area based on: (a) Soil parametric fertilityindex (SFI-1); (b) Soil fuzzy fertility index (SFI-2).
Sustainability 09 01299 g002
Figure 3. The relationship between (a) Soil parametric fertility index and rice actual yield; (b) Soil fuzzy fertility index and rice actual yield.
Sustainability 09 01299 g003
Table 1. Soil and landscape requirements for irrigated rice [17] & the study authors.
Land CharacteristicsRating Scale
Sustainability 09 01299 i001
Slope (%)<0.5, 0.5–11–22–4>4
FloodingF0, F11, F12F21, F22, F31, F32F13, F23, F33, F41, F42, F43F14, F24, F34, F44 F15, F25, F35, F45
DrainageimperfectmoderatePoor, goodVery poor__
Texture*C, SiL, SC, L, SCL, SLCL, SiCL, Si, LfS, LSmLcS, fS, Sm, cS Texture
**C, SiC, SiCL, CL, Si, SiL, SC, L, SCL, SLLfS, LSmLcS, fS, Sm, cS
Coarse fragment (vol %)0<33–1515–35_>35
Soil depth (cm)>9090–7575–5050–20_<20
Apparent CEC>2424–16<16(−)<16(+)__
Base saturation (%)>6080–5050–3535–20<20_
Sum of basic cations (cmol kg−1)>6.56.5–44–2.82.8–1.6<1.6_
pH H2O6.5–6.06.0–5.55.5–5.05.0–4.5_<4.5
6.5–7.07.0–8.28.2–8.58.5–9.0_>9.0
Organic carbon (%)>22–1.51.5–0.8<0.8__
ECe (ds/m)0–11–22–44–66–12>12
* Subsoil has an infiltration rate of more than 0.1 cm/h and no groundwater is present within 50 cm from the soil surface. ** Subsoil has an infiltration rate of less than 0.1 cm/h and no groundwater is present within 50 cm from the soil surface.
Table 2. Suitability classes according to the soil [16] and fuzzy indexes *.
Suitability ClassIntensity of LimitationSoil Index [16]Fuzzy Index
S1Highly suitable75–1000.75–1
S2Moderately suitable50–750.50–0.75
S3Marginally suitable25–500.25–0.50
Nnot suitable0–250–0.25
*: the authors.
Table 3. Definitional criteria for membership models describing soil fertility constraints to high rice yields under intensive irrigated cropping.
Soil Propertiesbd
Ap horizon (cm)* 20** 2.5
Clay content (%)* 35* 3
Organic C (%)** 2* 0.2
CEC (cmol kg−1)* 20* 2
pH of paste** 6&7** 0.6
EC (dS m−1)** 2** 0.2
Notes: Dobermann and Oberthür * [2] and Rice IRRI experts **.
Table 4. Descriptive statistics of soil characteristics in the study area.
Soil PropertiesMinMeanSDMaxCV (%)
pH5.496.630.527.537.92
OC (%)1.02.480.724.528.96
CEC (cmol kg−1)1029.467.164724.29
EC (dS m−1)0.121.270.512.7140.51
Clay (%)639.889.785624.52
Ap (cm)1015.982.362214.77
OC: organic carbon; CEC: cation exchange capacity; Ap: top soil depth.
Table 5. Distribution of suitability classes for rice cultivation in the study area.
Suitability ClassParametric Method (%)Fuzzy Method (%)
S1827
S29038
S3224
N-11

