Concept Paper

Classification of Global Land Development Phases by Forest and GDP Changes for Appropriate Land Management in the Mid-Latitude

Department of Environmental Science and Ecological Engineering, Korea University, 145 Anamro, Seongbukgu, Seoul 02855, Korea
*
Author to whom correspondence should be addressed.
Sustainability 2017, 9(8), 1342; https://doi.org/10.3390/su9081342
Submission received: 14 June 2017 / Revised: 20 July 2017 / Accepted: 27 July 2017 / Published: 1 August 2017

Abstract

:
To implement appropriate land management strategies, it is essential to identify past and current land cover and land use conditions. In addition, an assessment of land development phases (LDPs) in a human-dominated landscape coupled with an analysis of the water-food-ecosystem (WFE) nexus can deepen our understanding of sustainable land management. In this study, we proposed the concept of land development phases (LDPs) by forest and GDP changes using previously-applied theoretical and empirical approaches. The positive relationship between GDP growth and forest stock changes was used to analyze the timing of forest stock changes as five-year averages, which were aggregated over 20 years to classify LDPs. In addition, forest area changes compared with GDP and GDP per capita changes were analyzed to identify LDPs. Based on two conceptual approaches, we suggested global land into three LDPs: degradation, restoration and sustainability. Using this approach, most of Europe, North America and northeast Asia were classified as sustainability phases, while Africa and Central Asia in the Mid-Latitude region appeared to have degradation or restoration phases. The LDPs described could be improved with further incorporation of solid data analysis and clear standards, but even at this stage, these LDP classifications suggest points for implementing appropriate land management. In addition, indices from comparative analysis of the LDPs with the WFE nexus can be connected with socio-economic global indices, such as the Global Hunger Index, the Food Production Index and the Climate Change Performance Index. The LDPs have the potential to facilitate appropriate land management strategies through integrating WFE nexus and ecosystem services; we propose future research that uses this integration for the Mid-Latitude region and worldwide.

1. Introduction

Environmental sustainability is considered both a current and future challenge for global society, which needs to address human poverty and nature conservation, particularly at the Mid-Latitude region, where most of the world’s population resides [1,2,3]. Based on criticism of the current destructive production and consumption system, the declaration of the United Nation’s Sustainable Development Goals (SDGs) raised awareness of environmental sustainability [4]. Furthermore, achieving environmental sustainability has been recognized as a global challenge to improve climate change adaptation capacity through enhanced ecosystem resilience and ecosystem services [5,6,7].
Managing the ecosystem services and water-food-energy nexus is an important part of environmental decision-making [8,9]. In addition, the water-food-energy nexus is known as a key driver of promoting SDGs and environmental sustainability [10]. The nexus approach includes policy suggestions under the synergy and trade-offs between the water, food and energy production and consumption system, so it can contribute to sustainable management [11,12]. Understanding the relationship between environmental sustainability and the water-food-energy system requires integrating environmental and socio-economic dimensions [13,14]. Previous studies have specifically focused on the environmental dimension of the ecosystem. Ecosystems provide services by generating socio-economic benefits, and the concept of the ecosystem services is critical in understanding the relationship between environmental sustainability and the water-food-energy system [15,16,17]. Furthermore, ecosystems have been emphasized as a component of improving not only ecosystem services, but also ecosystem resilience and climate change adaptation [18,19].
Ecosystems include all three nexus pillars of water, food and energy; therefore, previous studies have described the relationships between ecosystems and the nexus concept. For example, the importance of ecosystems in supporting water cycles and food production has been analyzed based on the relationship between water and food [20]. In addition, the relationship between ecosystem habitats and agricultural intensification were also assessed to characterize the consequences for people and national development [19]. Ecosystem and energy relationships, between bio-fuels and energy consumption systems, have also been evaluated using an integrated analysis [21]. Ecosystems are not only fundamental for water and food sustainability, but are an important resource because they serve as the primary source of energy. Thus, the water-food-ecosystem (WFE) nexus could conceptually replace the water-food-energy nexus to provide eco-centric perspectives on forest and land management issue.
Although the WFE nexus is a new proposal, the overall characteristics of the nexus approach were not changed. The WFE nexus is comprehensively integrated similar to the water-food-energy nexus, so socio-economic dimension should also be closely connected to each variable of water, food and ecosystem [22,23]. Furthermore, understanding the current environmental and socio-economic status of land cover and land use both at global and regional levels, including the Mid-Latitude region, should be identified to appropriately balance the WFE nexus and achieve environmental sustainability [8]. In addition, differences in land development circumstances between regions could be conceptually connected in a global agenda for appropriate land management and the success of SDGs and the WFE nexus.
The Mid-Latitude region generally refers to the area between 30° and 60° latitudes in the Northern Hemisphere. This region could be broadened to the area between the xeric belts and the tropical region, which is also described by diversity in climatic, geographic, demographic and national characteristics. Past warming trends between 15° and 45° latitudes have resulted in different future projections for changing land cover in temperate, arid and semi-arid climates [24,25]. In addition, climate extremes have caused direct and indirect problems, such as abnormalities in temperature, decreasing gross primary productivity (GPP) and land degradation [25,26,27]. More than 50% of the world’s population lives in this zone, which increases the pressure on natural resources and limits the adaptation and carrying capacity of the Mid-Latitude region. This directly affects the achievement of environmental sustainability and human well-being [28]. Although these problems are expected in the Mid-Latitude region, policies based on different land development circumstances and latitudinal approaches are implemented, which suggests a direction of analysis [29]. The Mid-Latitude region covers a huge area and the issues and challenges in this region are also diverse; each sub-region and country has different socio-economic conditions, in addition to environments, that drive different land management policies.
In summary, evidence suggests that a primary analysis of common challenges globally and at the Mid-Latitude region should address maintaining environmental sustainability. As a primary step for identifying environmental sustainability, we tried to argue some conceptual connections based on novel theoretical approaches that incorporate a land development phases (LDPs) classification. We incorporated previously-published empirical approaches and theories to examine LDPs, such as degradation, restoration and sustainability, to improve conceptual linkages for environmentally-sustainable decision-making [2,30]. On this conceptual basis, we suggest discussion points for current environmental and socio-economic sustainability and global indices related to the WFE and ecosystem services given the LDPs status in the Mid-Latitude region and worldwide.

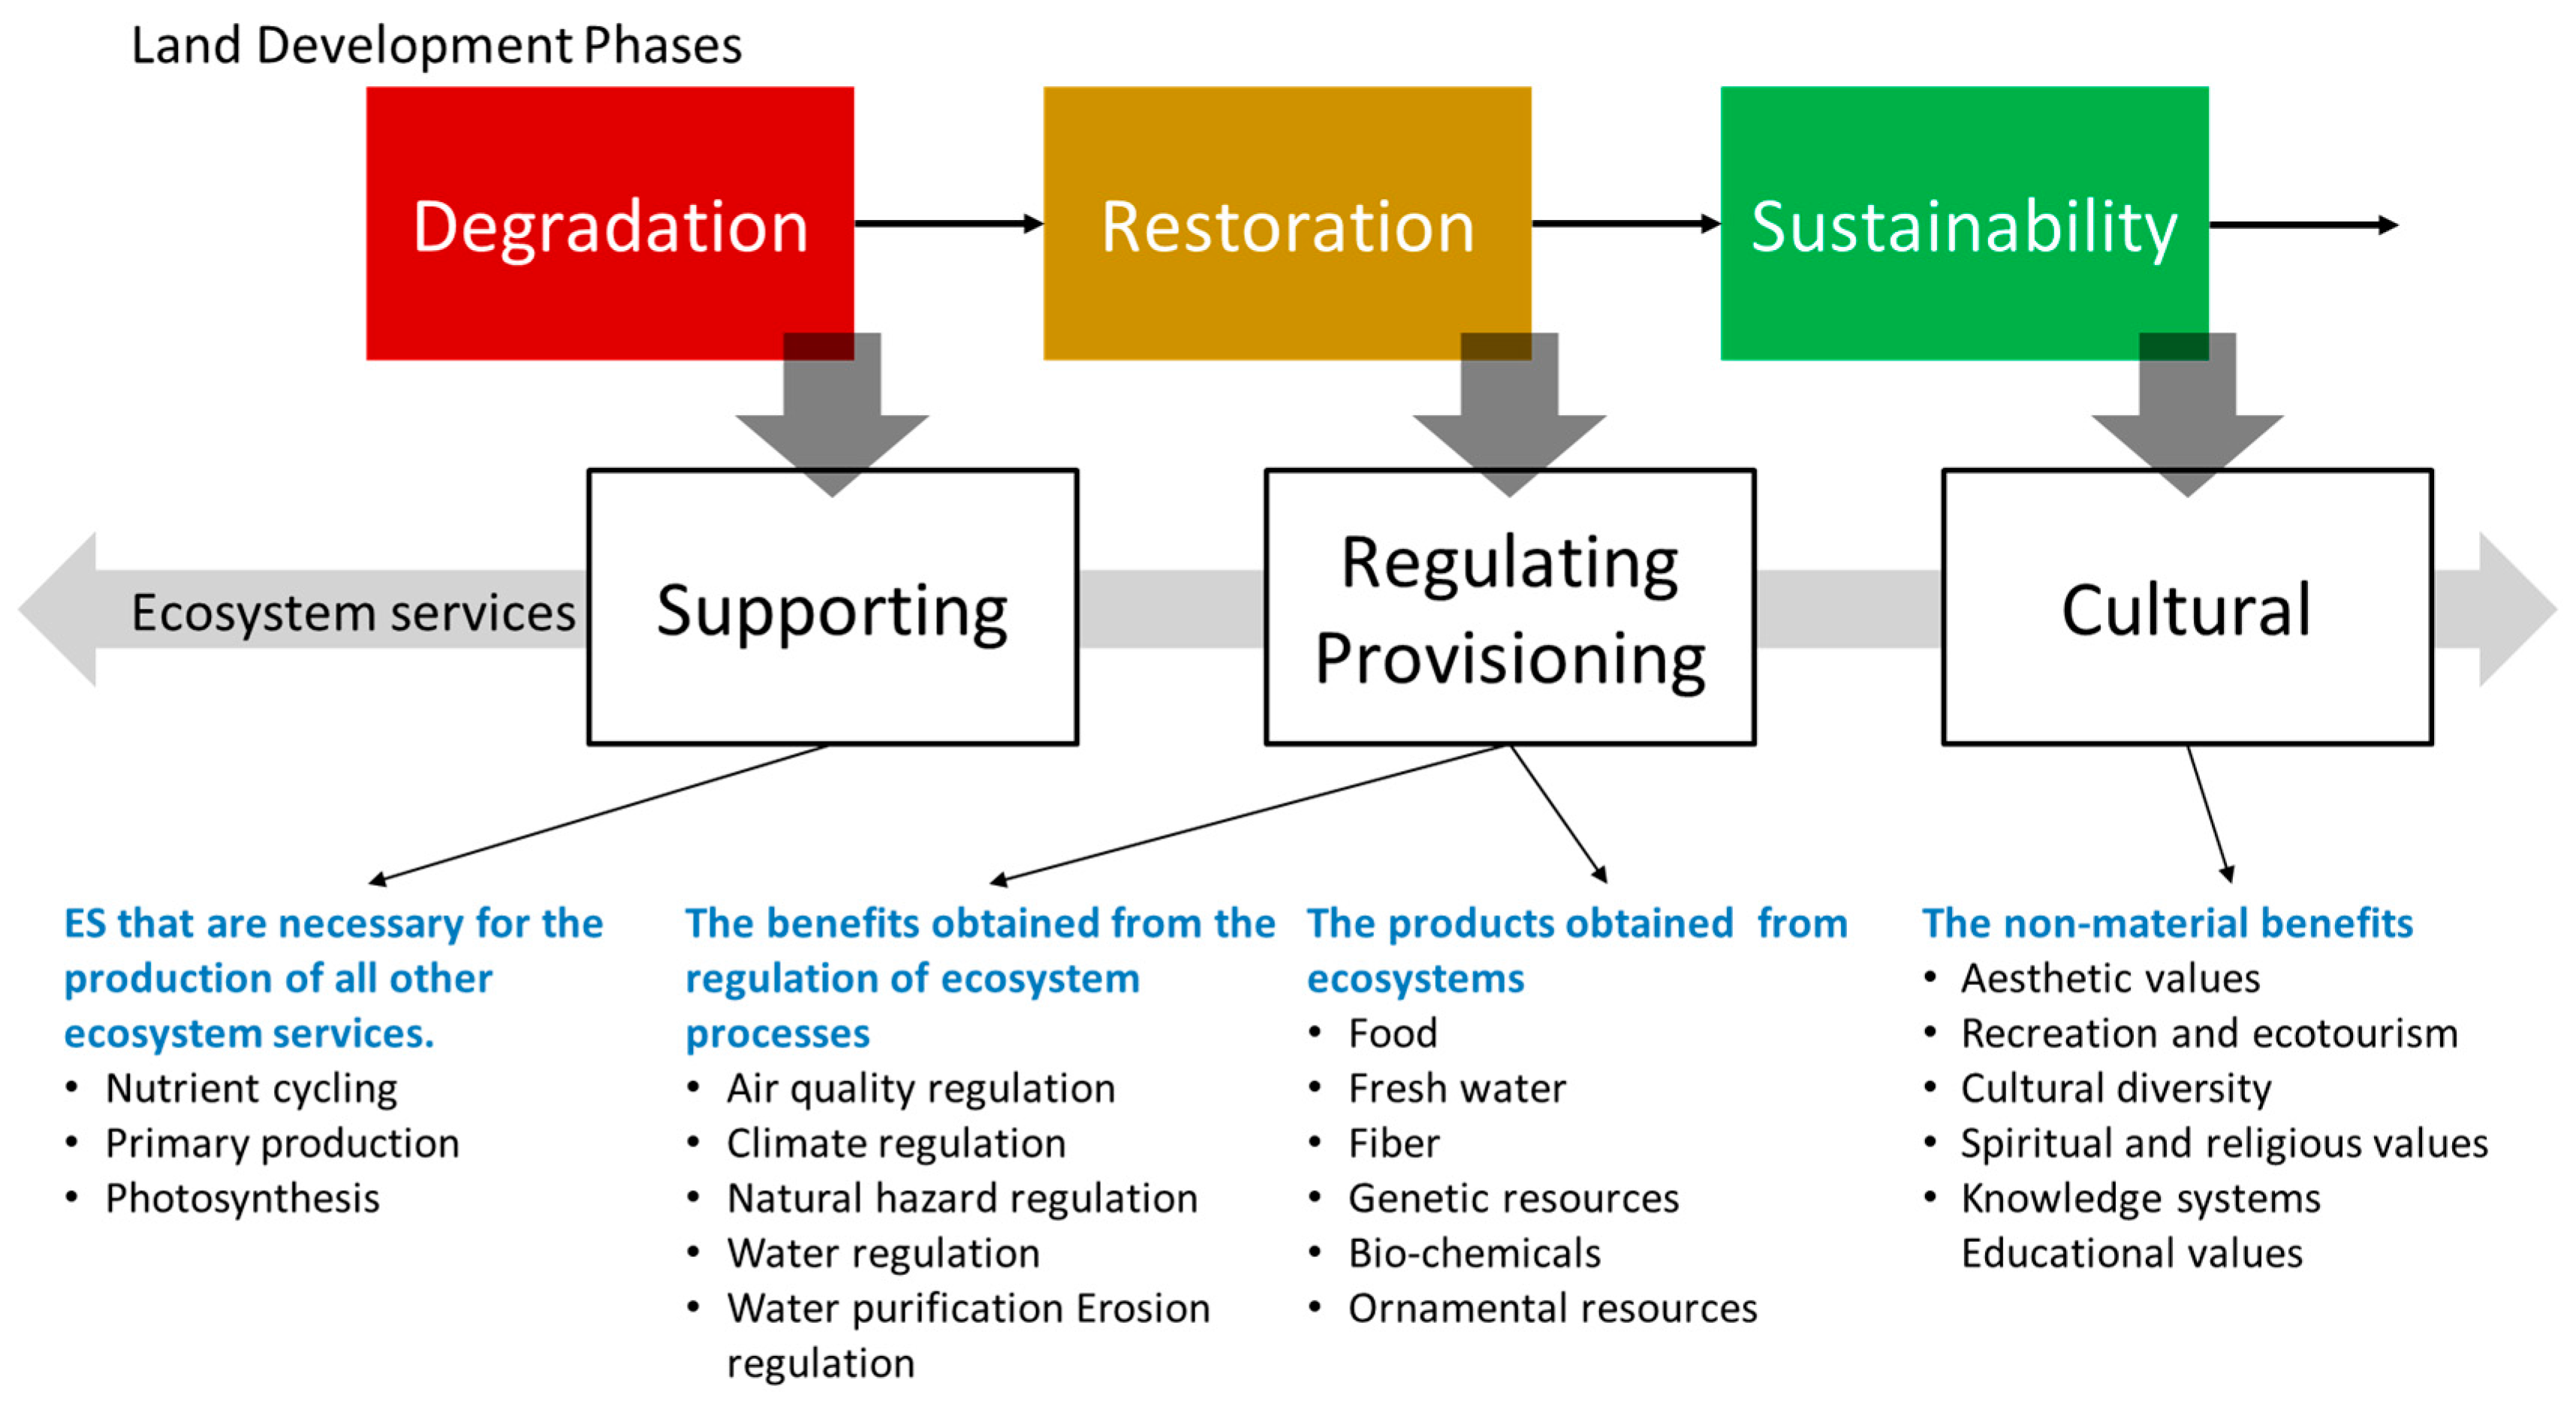
2. The Relationship between Ecosystem and Socio-Economic Status

Previous studies have evaluated the effect of economic growth on environmental restoration [31,32]. As a commonly-accepted approach, the environmental Kuznets curve (EKC), represented by inverted U-shape curves, was usually adopted to explain the theoretical relationship between per capita income and environmental quality [33,34]. This approach originally hypothesized that economic development leads to decreasing economic inequality. However, in terms of the ecosystems and environment, conservation and recovery due to economic growth have been limited due to various drivers from each sector. Therefore, it has been challenging to determine exact inflection points in the EKC. With the uncertainty in coordinating environmental decision-making based on economic factors, a comparison of economic and forest stock changes was proposed [35]. Although in-depth analysis was limited with this approach, the ECK research has provided a theoretical background and motivations for considering economic factors with natural environmental quality and developing the LDPs concept.
Regardless of these challenges, evidence for correlated ecosystem restoration and economic growth is exemplified in some regions, such as the Korean Peninsula. Based on forest restoration history, the Republic of Korea (South Korea) and the Democratic People’s Republic of Korea (North Korea) had different political, economic and environmental pathways. Notably, serious environmental degradation has been reported since the 1990s in North Korea, which resulted in forest degradation and decreasing net primary productions [36,37,38]. In contrast, forest stock in South Korea has increased since the 1970s with proper forest management and restoration activities [39]. A quantitative comparison of the two countries based on gross domestic product (GDP) per capita data from the World Bank and forest stock data from 1960–2010 provided by the Korea National Institute of Forest Science (NIFoS) is shown in Figure 1 [40,41].
The relationship between GDP growth and forest stock changes in South Korea and North Korea represents positive evidence between environmental restoration and economic development. Although there are many factors that affect GDP per capita and forest growth, we can infer that economic growth has a positive impact on environmental restoration capacity [40]. To expand the regional scales to the Mid-Latitude region and global scale, global 1° forest stock data were adopted to figure out the relationship between GDP and forest stock change [42]. Data were compared based on five-year averages, and the relationship between GDP growth and forest stock changes showed differing results depending on the country. In France, forest stock increased rapidly with increasing economic GDP per capita. In contrast, a clear relationship was not identified in China, Iran and Iraq. The forest stock of these countries fluctuated, and GDP per capita grew rapidly after the 2000s (Figure 2).
Such results provide important evidence of the connection between environmental status, represented by forest stock, and socio-economic status, represented by GDP per capita. Canada, Germany, USA and Italy had similar patterns as the French case. China had converted its industrial structure after the 1970s, and GDP per capita increased rapidly after the 2000s. Iran also showed increasing GDP per capita after the 2000s, but an economic recession occurred from the late 1980s to the 1990s. There was a time gap between economic recession and a decrease in forest stock. Afghanistan also showed a similar pattern as Iran, but we could only compare forest stock changes because of missing GDP per capita data from 1980–2005. Trends characterized by variable economic status were also found for Pakistan, Greece, Tunisia and Iraq. Similarly, there was insufficient time series data for global statistics for several countries. Furthermore, internal and external issues, such as war, independence and civil disorder, were also important factors for understanding the linkage between forest and socio-economic changes.
In the above trends, GDP per capita and forest growth both characteristically increase in value with time. Global GDP per capita gradually increases due to inflation from industrialization, removing tariffs and national stability [43]. In addition, without conditions that cause decreases in forest stock, such as forest degradation and forest management, forest stock should also increase due to forest restoration activities [44]. Therefore, increasing trends from 1950–2000 are reasonable in many countries even in the context of fluctuation between countries. Inversed patterns between forest growth and economic changes in several countries suggest that environmental sustainability can be different depending on land status. From the perspective of the forest transition model (FT), a decrease in forest stock is the result of deforestation and forest degradation in the early and late transition stage of forest land changes, but forest stability is a constant stage observed in the restored area [45,46]. Based on FT theory, France has been classified as in a post-restoration phase. However, other countries are classified into deforestation or restoration phases, suggesting that forest stock changes and socio-economic changes could be used as evidence for understanding the relationship between environmental sustainability and the WFE nexus.
Based on this theoretical background and empirical evidence, an approach for classifying land status is summarized as follows. First, forest is a representative of the ecosystem in the WFE nexus, which shows land transition and changes. Second, forest quality and quantity should be considered with socio-economic capability. Third, quantifiable outputs for future application to decision-making should be required for driving and testing the concept. Based on these considerations, Figure 3 depicts the conceptual flows for (1) classifying LDPs based on forest area and GDP changes and (2) applying the LDPs for the WFE nexus in the Mid-Latitude region.

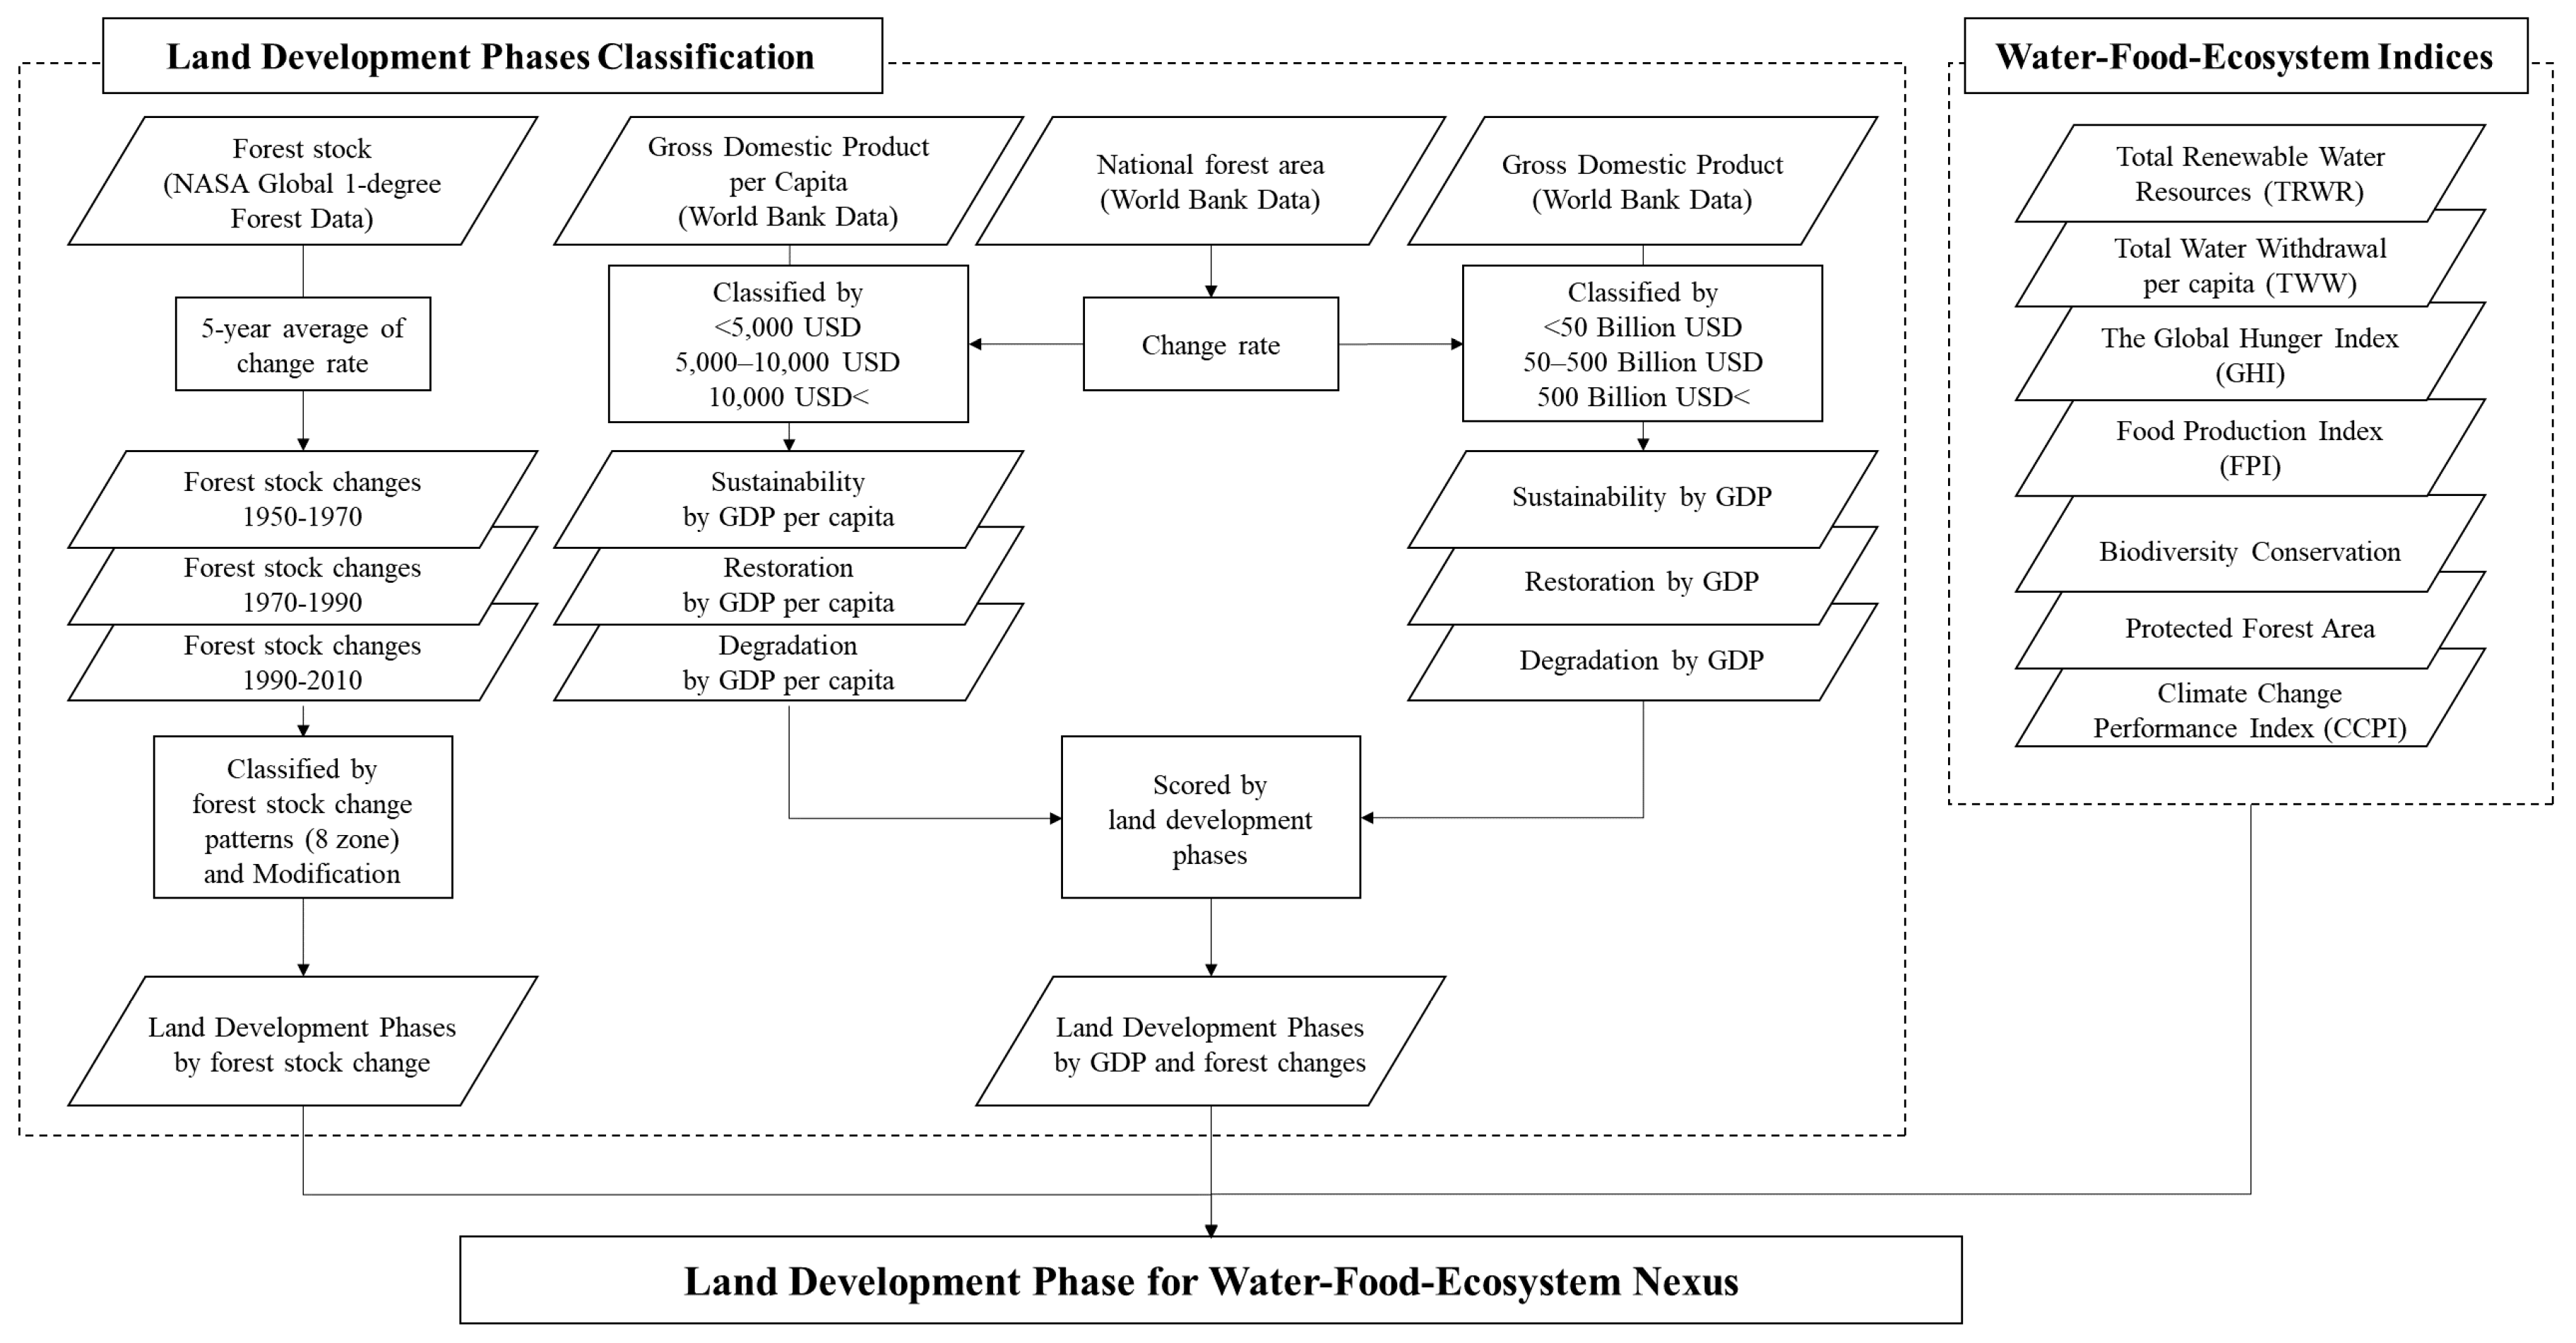
3. Classification of Global Land Development Phases

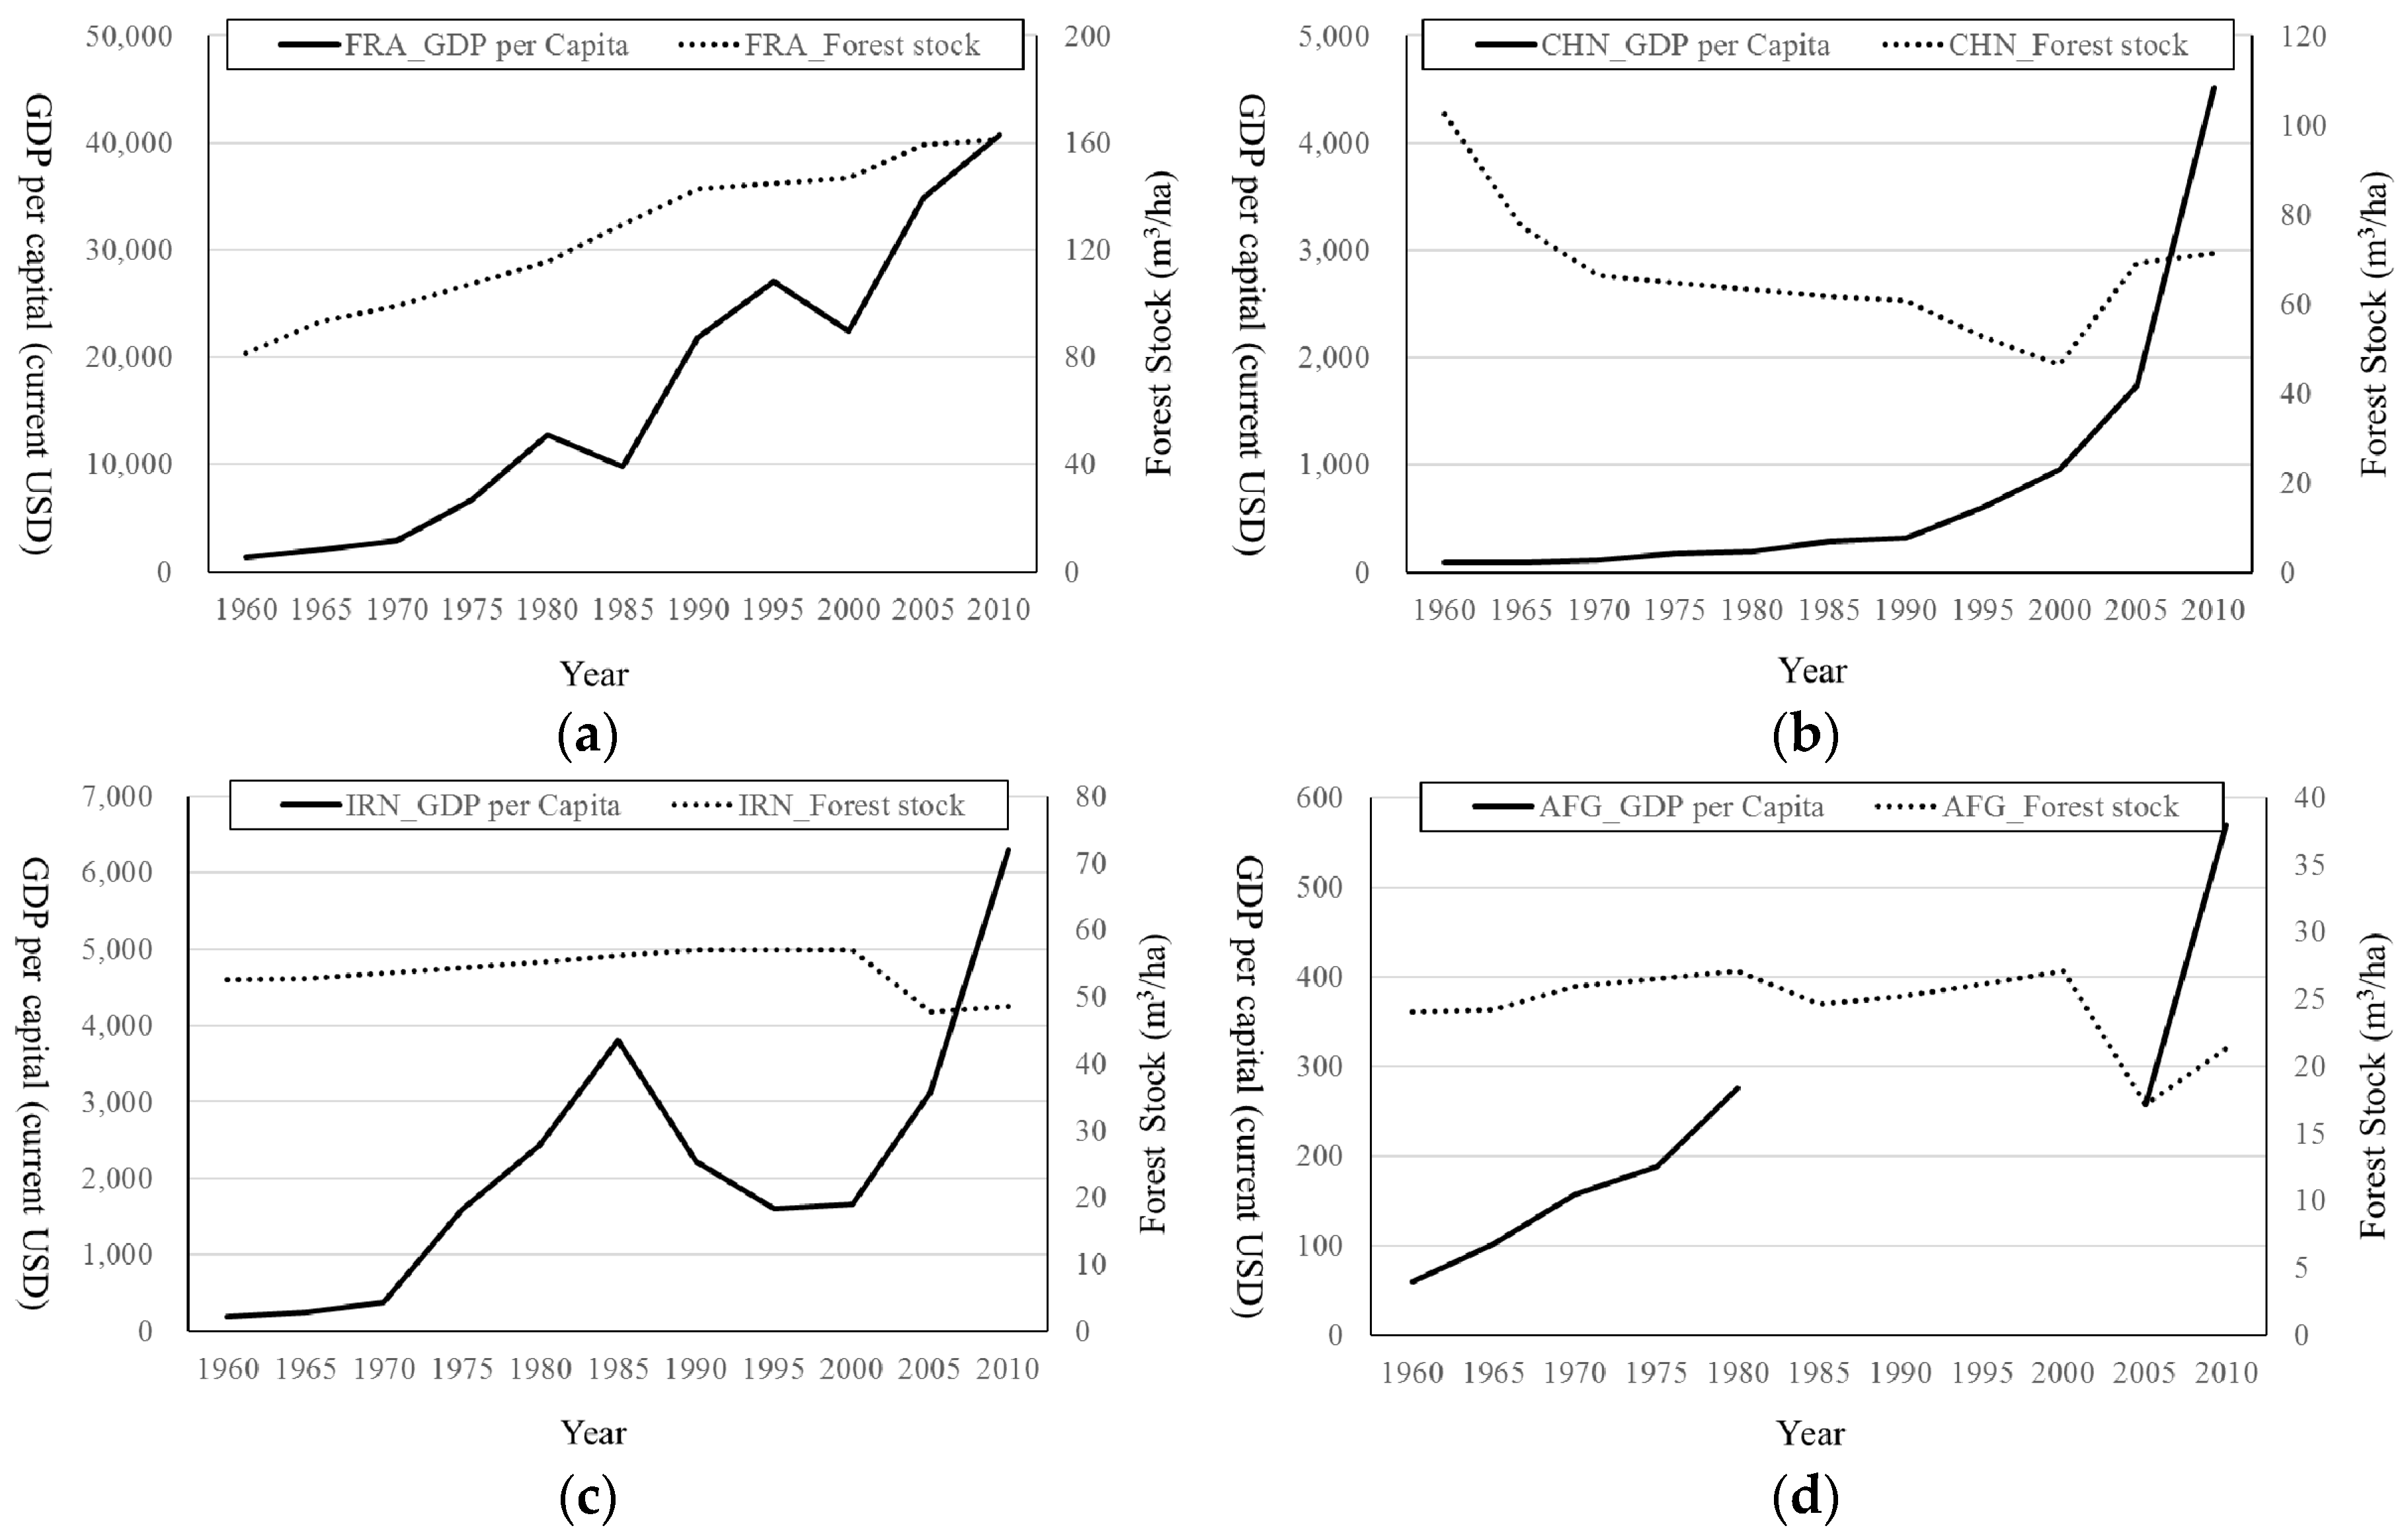
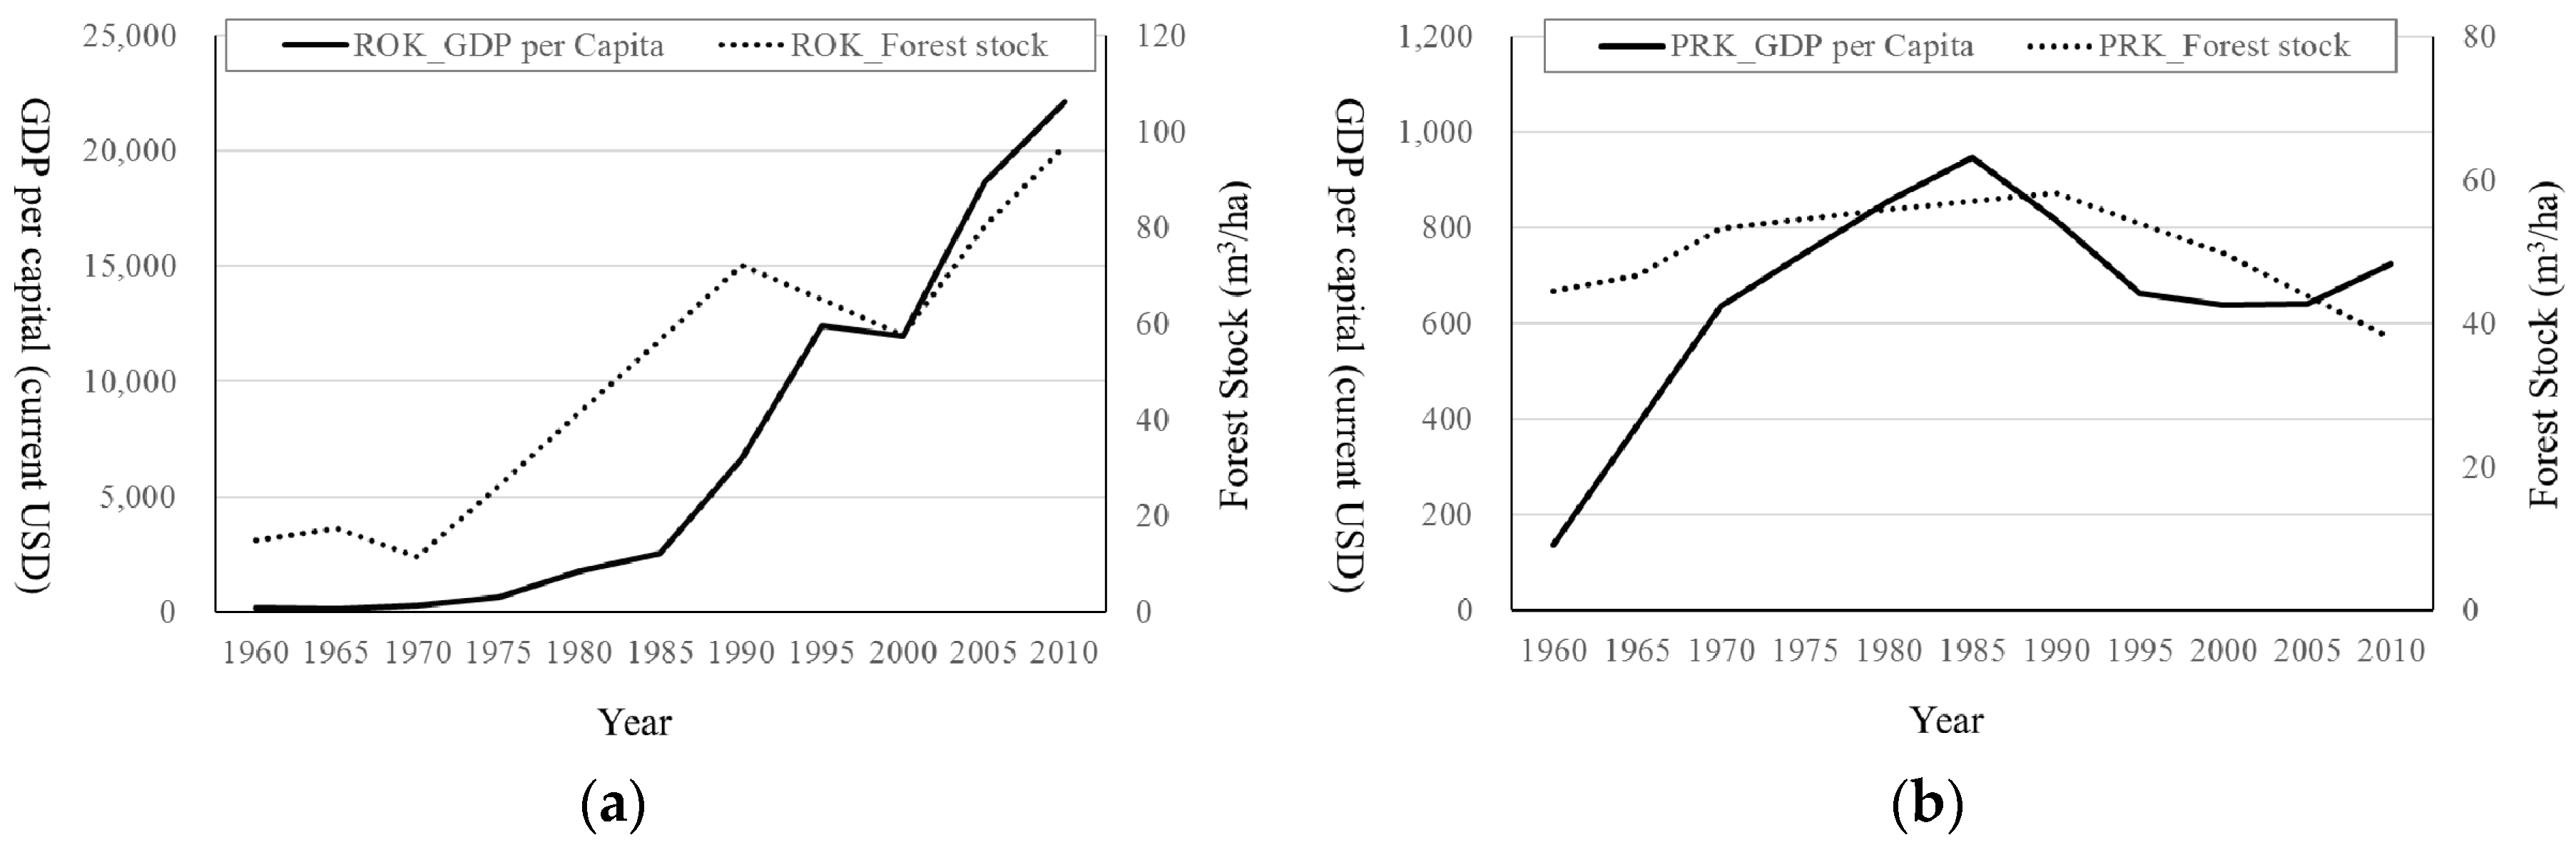
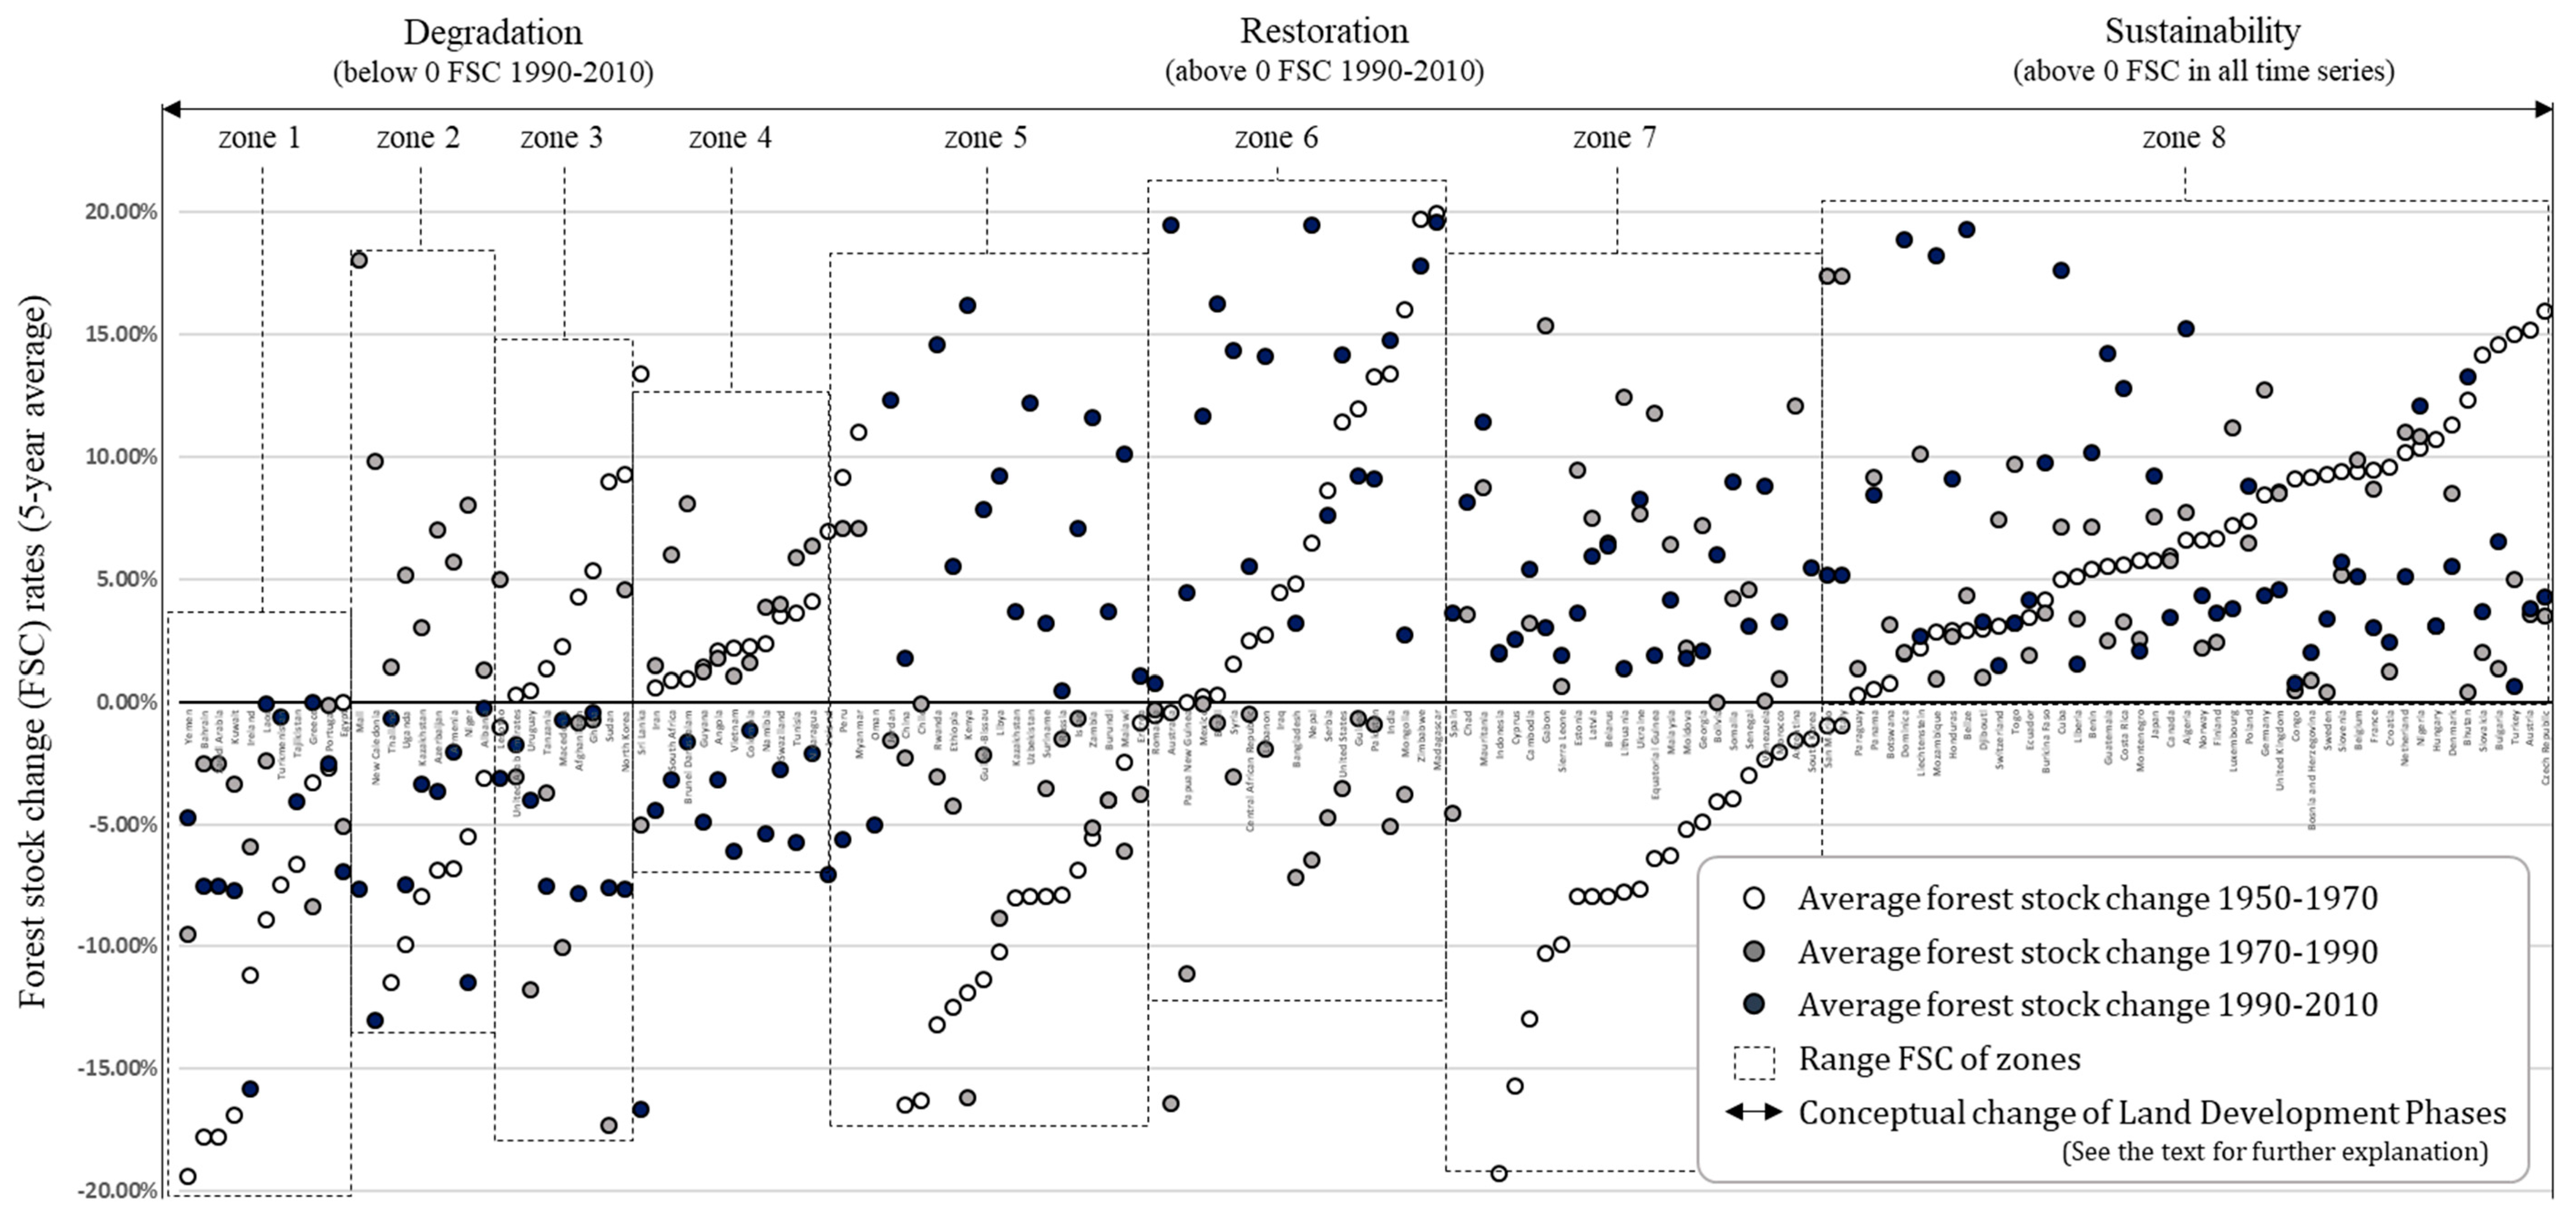
3.1. LDPs Based on Forest Stock Changes

Based on forest stock changes and adopting FT theory, land sustainability status can be classified into three phases: early transition as a degradation phase, late transition as a restoration phase and post-restoration as a sustainability phase. In FT theory, forest variables and attributes, such as forest area, forest stock, forest biomass and forest carbon, are suggested variables. However, quality also needs to be accounted for; for example, forest area represents the quantitative amount of forest, but not the quality of the forest in such an area [47]. Therefore, we adopted forest stock as the classification variable, as it incorporates both quality and quantity. The average of five-year forest stock changes was calculated and aggregated into 20-year intervals, 1950–1970, 1970–1990 and 1990–2010. Forest degradation was defined as an aggregated average value in the time series of below zero (negative), decreasing forest stock. Forest restoration and sustainable management were defined by stock values above zero (positive). The analysis also considered changes through time: trends from negative to positive were regarded as restoration or reaching a sustainability phase and good management, while declining trends were regarded as approaching a degradation phase. This approach is also an attempt to reflect current forest management activities to mitigate climate change through increasing forest stock for carbon sequestration and adaptation based on Reducing Emission from Deforestation and forest Degradation (REDD+) activities in developing countries [48]. In addition, it could represent sustainable forest management schemes in certified forests [49]. After synthesizing the data and evaluating the trends over the three 20-year periods, we divided the countries into eight zones (Figure 4).
Figure 4 indicates the patterns of each zone and LDPs. The eight zones were calculated using trends in restoration and degradation over the three time periods, i.e., increasing or decreasing forest stock in a given time period. Therefore, there were eight combinations as follows: Zone 1 (decreasing-decreasing-decreasing), Zone 2 (decreasing-increasing-decreasing), Zone 3 (increasing-decreasing-decreasing), Zone 4 (increasing-increasing-decreasing), Zone 5 (decreasing-decreasing-increasing), Zone 6 (increasing-decreasing-increasing), Zone 7 (decreasing-increasing-increasing) and Zone 8 (increasing-increasing-increasing). The classification used the 2010 status as the end point; therefore, decreasing forest stock from 1990–2010 was degradation, and increasing forest stock from 1990–2010 was restoration. In the degradation phase, overall forest stock change (FSC) was below zero, and it implied that countries lost their forest stock due to negative environmental conditions in the forest or management failure. In the restoration phase, some absolute values of the FSCs were below zero, but most were above zero between 1990 and 2010. In addition to classification by the zones, countries were also assigned an overall LDPs status. Countries with FSCs remaining in degradation from 1950–2010 were classified as in a degradation phase. Countries with FSCs indicating restoration from 1990–2010, but having experienced degradation from 1950–1990 or degradation from 1970–1990 were classified as the restoration phase. Countries with forest stock growth from 1970–2010 were classified as the sustainability phase. Therefore, Zones 1 to 3 were regarded as the degradation phase because of the timing of the decreasing forest stock. Zone 5 was regarded as the restoration phase, and Zone 8 was regarded as the sustainability phase. However, Zones 4, 6 and 7 were more complex; ultimately, land phases were classified as restoration and sustainability if the previous decrease in forest stock was recovered by the subsequent increase in forest stock. The bottom line is that most of Zone 4 was regarded as in the degradation phase, most of Zone 6 as in the restoration phase and most of Zone 7 as in the sustainability phase.
The LDPs classification shown in Figure 4 was based on the forest stock change. The restoration phase included countries where forest stock growth exceeded the decreasing amounts of forest stock from the past or where there was normal forest growth with no degradation. To set a proper standard for small-scale forest stock decreases, average forest stock change rates were calculated over shorter time scales and compared with the average growth rates for the entire time series. Forest stock change rates exceeding the growth rate for the entire time series indicated that restoration was more intense than degradation. Therefore, recent degradation from 1990–2010 was classified into degradation, but some countries with small-scale forest stock decreases were adjusted as in the restoration phase. In addition, countries that had forest stock growth from 1950–1970 with small-scale forest stock decreases from 1970–1990 were adjusted into the sustainability phase. Countries where the FSCs did not exceed the decrease in forest stock from 1950–1970 and from 1970–2010 were also reclassified into the restoration phase (Figure 5 and Table 1).

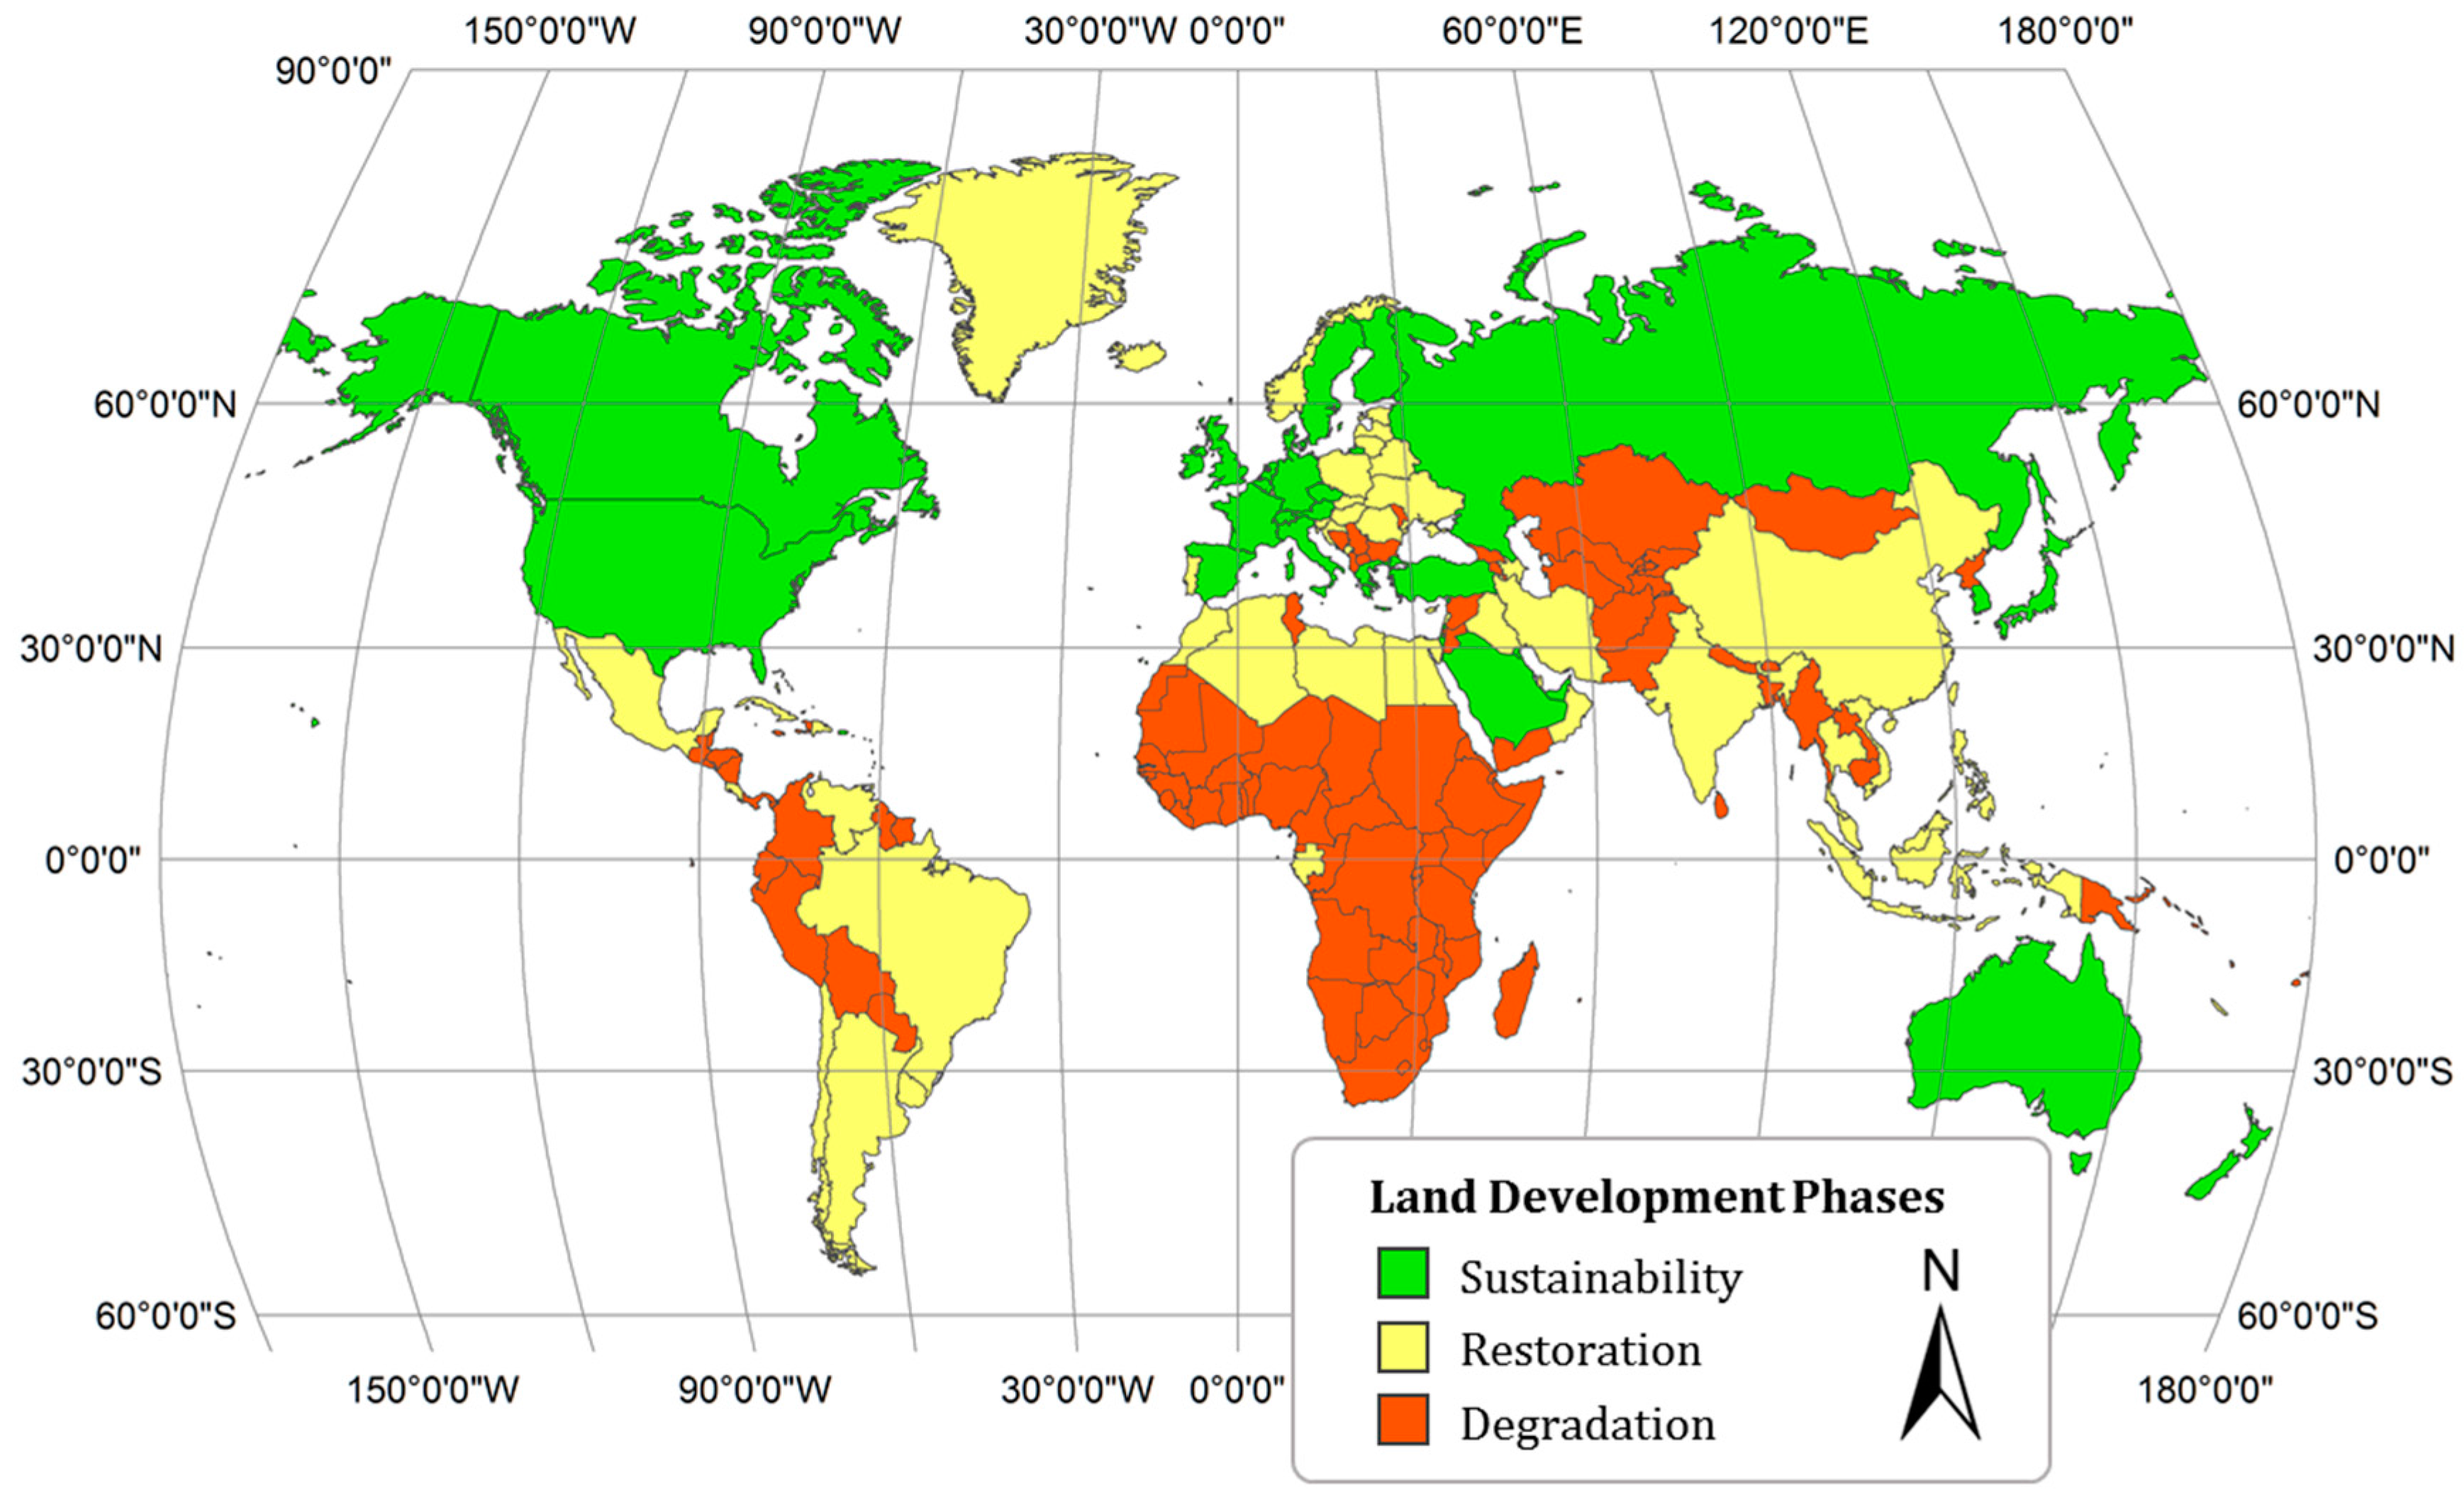
3.2. LDPs Based on Forest Area and GDP Changes

Based on FT theory and using forest growth changes, the world can be divided into three phases. However, socio-economic capacity is also an important part of environmental sustainability measurement represented in EKC theory [33,34]. In addition, previous empirical EKC analysis indicated a strong relationship between forest area growth and economic improvement based on afforestation and reforestation mechanisms [48,49]. Therefore, while forest stock represents the quality of the forest and environment, a quantity change needs to be compared with the appropriate capacity, i.e., from society. Therefore, GDP per capita and forest area change were compared to understand and properly represent LDPs.
We classified the countries with thresholds set at 5000 USD and 10,000 USD of GDP per capita in 2010, which divides low-income countries, middle-income countries and high-income countries. The World Bank has classified countries using the WESP (the World Economic Situation and Prospects) by gross national income (GNI) per capita. Their classifications are <4085 USD for low-income and lower-middle-income countries and 4085–12,615 USD for upper-middle-income countries. Countries with GNI per capita > 12,615 USD are classified as high-income countries. However, they also aggregated data with GDP, exchange rate, purchasing power parity and gross domestic incomes because the timing of data availability was quite different for rapidly-developing countries. Therefore, we adopted a classification similar to the World Bank’s, but still tried to consider the relationship between GDP and forest change [39,50]. The countries in each economic zone were divided based on increasing and decreasing forest area, so six zones were classified as combinations; low economy with decreasing forest area, low economy with increasing forest area, middle economy with decreasing forest area, middle economy with increasing forest area, high economy with decreasing forest area and high income with increasing forest area [51,52,53]. Countries were divided with the breakpoints of 50 billion USD and 500 billion USD GDP prior to classification based on forest change [39,50,53]. Subsequently, GDP per capita and GDP zones were aggregated by scoring each zone from 0–5 to classify countries (Figure 6 and Table 1).
Adding an economic measure for classification resulted in some countries remaining in the same LDPs classification, while other countries changed (see Figure 6 compared to Figure 5). However, countries in Central Asia and Central Africa were commonly classified in the degradation phase. In contrast, developed countries in West Europe, North America and East Asian countries were categorized in the sustainability phase. Some countries in Africa and East Europe showed different LDPs based on the classification using GDP and GDP per capita with forest area change. Some countries were classified in the same phases in both classification approaches. However, many countries in degradation based on the classification using GDP and GDP per capita were classified as restoration phase or sustainability phase when they were classified by forest stock changes (Table 1). Therefore, we can apply different approaches to classify LDPs in different decision-making process. Through conceptual LDPs classification, some commonalities were found in both classification approaches. The countries with decreasing forest area and forest stock growth combined with less environmental restoration capacity based on economic size were classified as in the degradation phase. Countries that had increasing forest area and forest stock growth combined with the trend and that had restoration capacity were classified as in the restoration phase. The countries that had increasing forest area and forest stock growth combined with small forest management intervention and enough restoration capacity were classified into the sustainability phase.

4. Relationship between LDPs and WFE Indices

LDPs can be correlated with the WFE nexus based on related global indices. At the same time, an integrated framework for examining environmental and socio-economic sustainability has been proposed because there are many challenges in a holistic assessment of the nexus [10]. However, this global scale conceptual framework needs to be improved, and the relationship between many variables should be defined for practical nexus analysis [7,54]. Therefore, available indices were adopted to determine trends in the WFE nexus over a global scale.
In the water sector, total renewable water resources (TRWR) is a water-related WFE nexus index [55]. A high score indicates that a country has enough water resources, while a low score indicates that a country experiences water stress. Total water withdrawal per capita (TWW) is the indicator that measures the total annual amount of water withdrawn per inhabitant [55]. In short, TWW indicates water demand of each country [56]. The percentage of TWW to TRWR indicates the demand from total water resources where higher values indicate a greater quantity of consumed water resources. It also implies a country’s ability to use available water resources. High values can also be interpreted as the country having enough capacity for using resources.
The Global Hunger Index (GHI) and Food Production Index (FPI) were applied to evaluate the food aspect of the WFE nexus. The GHI was developed to measure and track hunger at the global, regional and country scale. It describes the hunger status of children where high values imply greater hunger [57]. As a complement, FPI describes the status of crops and livestock that are considered edible and contain nutrients [58]. FPI explains the relative level of the aggregate volume of agricultural production for each year in comparison with the base period from 2004–2006. The base year is regarded as one hundred percent and is compared with a certain year’s production volume. It includes the quantity of the commodity sold in the market and the quantity consumed or used by producers.
To evaluate ecosystems in the WFE nexus, the Forest and Agriculture Organization of the United Nations (FAO)-published Global Forest Resources Assessments (FRA), which monitor the world’s forest status, were used. Among the many assessments made in the FRA, protected forest areas and areas designated as having high biodiversity in countries and territories are good representations of ecosystem status. The unit of measure for both the protected areas and conservation of biodiversity is 1000 ha, meaning greater numbers indicate larger areas with biodiversity conservation and protected forest.
The Climate Change Performance Index (CCPI) can also be integrated into the WFE nexus because of the socio-economic dimension of climate change. This index is a tool to keep track of national and international climate policy, because it incorporates emission trends and levels. Therefore, it can be used as a proxy to show the relationship between energy usage and efficient energy pressure management for balancing the components in the WFE nexus. To provide corresponding time scales, indices within five years of 2010 were analyzed (Table 2 and Table 3).
Through Table 2 and Table 3, it is clear that the ratio of TWW to TRWR changed based on the classification approaches of LDPs. For example, their values in the sustainability phases were similar, but different in the restoration and degradation phases. In addition, GHI had varying trends between classification approaches. As described previously, low GHI values indicate less hunger, so values in the sustainability phase were expected to be lower than values in other phases, which was observed in the approach using GDP, but not forest stock. In contrast, FPI had similar patterns for both LDPs classification approaches, with minor variance in the restoration phase. Examining the data according to each country’s land phase classification, biodiversity conservation and protected forest areas had the highest values in countries classified in the restoration phase and had the smallest values in countries classified in the degradation phase. In the case of the CCPI, the average scores in the sustainability and restoration phases were higher than those in the degradation phase. Overall, the trends based on LDPs classified by forest area change and GDP were considered reasonable.
Water-food-energy indices correlated with the different LDPs approaches. The indices related with socio-economic factors were better correlated with the GDP-based approach. However, the forest stock-based approach also better represented the environmental perspective. In some land phases, the indices had limitations because the indices were originally created for developing countries. That is, some indices’ calculations for developed countries were insufficient for indicating the sustainability phase. In this study, these kinds of indices were regarded as outliers in the global overview, which implied an imperfection of LDPs classification and the limitation of the WFE indices.

5. Implementation of LDPs with the WFE Nexus in the Mid-Latitude Region

The overarching environmental sustainability status in time and on national scales can be viewed from the perspectives of degradation, restoration and sustainability phases. Through LDPs, it is clear that forest stock, forest area and economic changes can indicate the environmental sustainability status of a country. Previous literature has provided the basis for the LDPs approach through empirical evidence comparing forest changes with economic drivers, as well as FT and EKC theories [33,34,59]. In particular, studies that considered forest stock change as a restoration process and national restored capacity quantitatively described relationships between forest changes and national economic size [60]. Nonetheless, LDPs could be improved by considering other land cover or ecosystem status. Distributions of forest cover vary due to more general global land cover changes from vegetated parts of East Asia and the Mediterranean to desert parts of Central Asia and arid and semi-arid regions in Central Asia [61]. Therefore, additional details would substantially improve on the suggested conceptual approaches. However, current statistical and spatial data availability limits the analysis. Therefore, obtaining spatio-temporally different national data that describe ecosystem change is important for further analyzing land classification. For example, the resolution of the forest stock data should be improved to provide better national-scale analysis at the appropriate time scale. Therefore, future research should focus on improving data for LDPs and solving the theoretical challenges to set the standard for socio-economic thresholds for classifying LDPs. With these further adjustment and analysis, we can integrate land management issues with the WFE nexus and ecosystem services enhancement in the Mid-Latitude region.
LDPs can aid in analyzing the WFE nexus. Overall relations between each LDP and the nexus indices suggest casual mechanisms, but some limitations still exist. Selecting and improving indices more appropriately should provide enhanced relationships, albeit potentially more complicated. In addition, land phases were represented at a broad spatial and geographic scale, so more detailed data are required to overcome the generalized approaches used in this study [62]. Specifically, key features and challenges highlighted in previous studies were found in the LDPs analysis [12]. Connecting SDGs goals and indicators would be possible and could improve the LDPs approach [63]. However, the concept of LDPs with WFE indices applied to the Mid-Latitude region and globally provides some insight into land status and future management. Based on this work, we can categorize similar problems and circumstances and suggest regional decision-making solutions.
Ecosystem services based on the LDPs can be implemented for sustainable management. The benefit of ecosystem services using the LDPs approach is that they can suggest management solutions that achieve environmental sustainability. In reviewing some past and current major environmental challenges worldwide and in the Mid-Latitude region, grouping land covers based on LDPs provides an environmental rationale for research. Focusing on the problem area will provide better understanding of the function and interaction of ecosystems from various perspectives. This type of approach can be used to address global climate change and move towards sustainable management of natural resources. Therefore, it is critical that ecosystem services be managed by the classified LDPs [64,65,66] (Figure 7).
The Mid-Latitude region exemplifies a close relationship between ecosystem services and the LDPs. This region is important in terms of the global carbon budget, climate change mitigation and adaptation and understanding the food-water-energy nexus for achieving SDGs [22,27,28,29]. Many challenges regarding ongoing degradation exist, and some successful restorations are expected to incorporate ecosystem services management [38,39,67]. The Mid-Latitude region is a large region with various climates and diverse land cover types with expanding megacities and urban areas. Thus, the region might face water and food shortages with massive land degradation [26]. These effects imply that countries in degradation phases are misappropriating their primary production from ecosystem services [64,68], and countries in the restoration phase are taking more active measures to protect the regulating and provisioning services of ecosystems [69,70]. In practice, regions in the degradation phase in Central Asia should consider adopting practical knowledge from successful restoration cases observed in Europe and East Asia. The experiences from these latter countries in recovery processes and enhancement of ecosystem service should be shared to facilitate restoration activities.

6. Conclusions

Taking a holistic approach in understanding the complexity of the WFE nexus demands an eco-centric perspective to secure environmental sustainability in the Mid-Latitude region and ultimately for global sustainability. Our study proposed two conceptual approaches to classify LDPs, a mechanism for understanding the status of the global land development and ecosystems. Starting from empirical and theoretical backgrounds, we tried to classify LDPs using the available, but limited, data for forest area, forest stock and socio-economic status. The LDPs, degradation, restoration and sustainability, represent environmental sustainability statuses. However, this work represents a first step in this kind of classification, which neglected this as common knowledge, and future research should further improve the LDP classification. In addition, related issues, such as environmental sustainability and the WFE nexus, were evaluated in the context of LDPs. Based on these integrated investigations, proper management plans are clearly indispensable for addressing climate change adaptation and enhancing ecosystem services. Planning is essential because, as indicated by previous development paradigms, unexpected environmental problems are manifestations of the cost of indiscriminate development. In comparison to other regions worldwide, especially the Mid-Latitude region is facing inequality of environmental sustainability. Similar to the north-south problems, the Mid-Latitude region is also impacted by country-specific geopolitical factors. Therefore, global society needs to prepare detailed frameworks to address current and future challenges in the Mid-Latitude region and improve environmental sustainability and the WFE nexus.

Acknowledgments

This study was supported by the “Climate Change Correspondence Program” (Project No. 2014001310008) provided by the Ministry of Environment, Korea, and also supported by the Korea National Research Foundation (Project No. 2015K1A3A7A08074225 and Project No. 2016K1A3A1A04940772).

Author Contributions

Cholho Song designed the conceptual mapping processes and wrote the paper. Sea Jin Kim and Jooyeon Moon analyzed the data. Woo-Kyun Lee organized idea and overall research. All authors gave comments to improve and read the final manuscript.

Conflicts of Interest

The authors declare no conflict of interest.

References

  1. Stern, D.I.; Common, M.S.; Barbier, E.B. Economic growth and environmental degradation: The environmental Kuznets curve and sustainable development. World Dev. 1996, 24, 1151–1160. [Google Scholar] [CrossRef]
  2. Turner, B.L.; Lambin, E.F.; Reenberg, A. The emergence of land change science for global environmental change and sustainability. Proc. Natl. Acad. Sci. USA 2007, 104, 20666–20671. [Google Scholar] [CrossRef] [PubMed]
  3. Griggs, D.; Stafford-Smith, M.; Gaffney, O.; Rockström, J.; Öhman, M.C.; Shyamsundar, P.; Steffen, W.; Glaser, G.; Kaine, N.; Noble, I. Policy: Sustainable development goals for people and planet. Nature 2013, 495, 305–307. [Google Scholar] [CrossRef] [PubMed]
  4. United Nations. The Sustainable Development Agenda. Available online: http://www.un.org/sustainabledevelopment/development-agenda/ (accessed on 15 March 2017).
  5. Bazilian, M.; Rogner, H.; Howells, M.; Hermann, S.; Arent, D.; Gielen, D.; Steduto, P.; Mueller, A.; Komor, P.; Tol, R.S.J.; et al. Considering the energy, water and food nexus: Towards an integrated modelling approach. Energy Policy 2011, 39, 7896–7906. [Google Scholar] [CrossRef]
  6. Scott, C.A.; Pierce, S.A.; Pasqualetti, M.J.; Jones, A.L.; Montz, B.E.; Hoover, J.H. Policy and institutional dimensions of the water-energy nexus. Energy Policy 2011, 39, 6622–6630. [Google Scholar] [CrossRef]
  7. Ringler, C.; Bhaduri, A.; Lawford, R. The nexus across water, energy, land and food (WELF): Potential for improved resource use efficiency? Curr. Opin. Environ. Sustain. 2013, 5, 617–624. [Google Scholar] [CrossRef]
  8. Allan, T.; Keulertz, M.; Woertz, E. The water-food-energy nexus: An introduction to nexus concepts and some conceptual and operational problems. Int. J. Water Resour. Dev. 2015, 31, 301–311. [Google Scholar] [CrossRef]
  9. Gallagher, L.; Dalton, J.; Brethaut, C.; Allan, T.; Bellfield, H.; Crilly, D.; Cross, K.; Gyawali, D.; Klein, D.; Kaine, S.; et al. The critical role of risk in setting directions for water, food and energy policy and research. Curr. Opin. Environ. Sustain. 2016, 23, 12–16. [Google Scholar] [CrossRef]
  10. Biggs, E.M.; Bruce, E.; Boruff, B.; Duncan, J.M.; Horsley, J.; Pauli, N.; Pauli, N.; McNeill, K.; Neef, A.; Ogtrop, F.V.; et al. Sustainable development and the water-energy-food nexus: A perspective on livelihoods. Environ. Sci. Policy 2015, 54, 389–397. [Google Scholar] [CrossRef]
  11. Rasul, G. Managing the food, water, and energy nexus for achieving the Sustainable Development Goals in South Asia. Environ. Dev. 2016, 18, 14–25. [Google Scholar] [CrossRef]
  12. Rasul, G.; Sharma, B. The nexus approach to water-energy-food security: An option for adaptation to climate change. Clim. Policy 2016, 16, 682–702. [Google Scholar] [CrossRef]
  13. Giddings, B.; Hopwood, B.; O’brien, G. Environment, economy and society: Fitting them together into sustainable development. Sustain. Dev. 2012, 10, 187–196. [Google Scholar] [CrossRef]
  14. Conway, D.; Van Garderen, E.A.; Deryng, D.; Dorling, S.; Krueger, T.; Landman, W.; Lankford, B.; Lebek, K.; Osborn, T.; Ringler, C.; et al. Climate and southern Africa’s water-energy-food nexus. Nat. Clim. Chang. 2015, 5, 837–846. [Google Scholar] [CrossRef] [Green Version]
  15. Costanza, R.; d’Arge, R.; de Groot, R.; Farber, S.; Crasso, M.; Hannon, B.; Limburg, K.; Naeem, S.; O’Neill, R.V.; Paruelo, J.; et al. The value of the world’s ecosystem services and natural capital. Nature 1997, 387, 253–360. [Google Scholar] [CrossRef]
  16. De Groot, R.S.; Wilson, M.A.; Boumans, R.M. A typology for the classification, description and valuation of ecosystem functions, goods and services. Ecol. Econ. 2002, 41, 393–408. [Google Scholar] [CrossRef]
  17. Feld, C.K.; Martins da Silva, P.; Paulo Sousa, J.; de Bello, F.; Bugter, R.; Grandin, U.; Hering, D.; Lavorel, S.; Mountford, O.; Pardo, I.; et al. Indicators of biodiversity and ecosystem services: A synthesis across ecosystems and spatial scales. Oikos 2009, 118, 1862–1871. [Google Scholar] [CrossRef]
  18. Karlberg, L.; Hoff, H.; Amsalu, T.; Andersson, K.; Binnington, T.; Flores-López, F.; de Bruin, A.; Gebrehiwot, S.G.; Gedif, B.; zur Heide, F.; et al. Tackling complexity: Understanding the food-energy-environment nexus in Ethiopia’s Lake Tana sub-basin. Water Altern. 2015, 8, 710–734. [Google Scholar]
  19. Newbold, T.; Hudson, L.N.; Hill, S.L.; Contu, S.; Lysenko, I.; Senior, R.A.; Börger, L.; Bennett, D.J.; Choimes, A.; Collen, B.; et al. Global effects of land use on local terrestrial biodiversity. Nature 2015, 520, 45–50. [Google Scholar] [CrossRef] [PubMed] [Green Version]
  20. Porter, J.; Costanza, R.; Sandhu, H.; Sigsgaard, L.; Wratten, S. The value of producing food, energy, and ecosystem services within an agro-ecosystem. Ambio 2009, 38, 186–193. [Google Scholar] [CrossRef] [PubMed]
  21. Tilman, D.; Socolow, R.; Foley, J.A.; Hill, J.; Larson, E.; Lynd, L.; Pacala, S.; Reilly, J.; Searchinger, T.; Somerville, C.; et al. Beneficial biofuels—The food, energy, and environment trilemma. Science 2009, 325, 270–271. [Google Scholar] [CrossRef] [PubMed]
  22. Biba, S. The goals and reality of the water-food-energy security nexus: The case of China and its southern neighbours. Third World Q. 2016, 37, 51–70. [Google Scholar] [CrossRef]
  23. Smajgl, A.; Ward, J.; Pluschke, L. The water-food-energy Nexus-Realising a new paradigm. J. Hydrol. 2016, 533, 533–540. [Google Scholar] [CrossRef]
  24. Fu, Q.; Johanson, C.M.; Wallace, J.M.; Reichler, T. Enhanced mid-latitude tropospheric warming in satellite measurements. Science 2006, 312, 1179. [Google Scholar] [CrossRef] [PubMed]
  25. Coumou, D.; Robinson, A. Historic and future increase in the global land area affected by monthly heat extremes. Environ. Res. Lett. 2013, 8, 034018. [Google Scholar] [CrossRef]
  26. Bai, Z.G.; Dent, D.L.; Olsson, L.; Schaepman, M.E. Proxy global assessment of land degradation. Soil Use Manag. 2008, 24, 223–234. [Google Scholar] [CrossRef]
  27. Reichstein, M.; Bahn, M.; Ciais, P.; Frank, D.; Mahecha, M.D.; Seneviratne, S.I.; Zscheischler, J.; Beer, C.; Buchmann, N.; Frank, D.C.; et al. Climate extremes and the carbon cycle. Nature 2013, 500, 287–295. [Google Scholar] [CrossRef] [PubMed]
  28. Kummu, M.; Varis, O. The world by latitudes: A global analysis of human population, development level and environment across the north-south axis over the past half century. Appl. Geogr. 2011, 31, 495–507. [Google Scholar] [CrossRef]
  29. Moon, J.; Lee, W.K.; Song, C.; Lee, S.G.; Heo, S.B.; Shvidenko, A.; Kraxner, F.; Lamchin, M.; Lee, E.J.; Zhu, Y.; et al. An introduction to Mid-Latitude ecotone: Sustainability and environmental challenges. Sib. J. For. Sci. in press.
  30. Brand, F. Critical natural capital revisited: Ecological resilience and sustainable development. Ecol. Econ. 2009, 68, 605–612. [Google Scholar] [CrossRef]
  31. Deudney, D. The case against linking environmental degradation and national security. Millennium 1990, 19, 461–476. [Google Scholar] [CrossRef]
  32. Fodha, M.; Zaghdoud, O. Economic growth and pollutant emissions in Tunisia: An empirical analysis of the environmental Kuznets curve. Energy Policy 2010, 38, 1150–1156. [Google Scholar] [CrossRef]
  33. Arrow, K.; Bolin, B.; Costanza, R.; Dasgupta, P.; Folke, C.; Holling, C.S.; Jansson, B.; Levin, S.; Mäler, K.; Perrings, C.; et al. Economic growth, carrying capacity, and the environment. Ecol. Econ. 1995, 15, 91–95. [Google Scholar] [CrossRef]
  34. Magnani, E. The Environmental Kuznets Curve, environmental protection policy and income distribution. Ecol. Econ. 2000, 32, 431–443. [Google Scholar] [CrossRef]
  35. Feiock, R.C.; Stream, C. Environmental Protection Versus Economic Development: A False Trade-Off? Public Adm. Rev. 2001, 61, 313–321. [Google Scholar] [CrossRef]
  36. Cui, G.; Lee, W.K.; Kim, D.; Lee, E.J.; Kwak, H.; Choi, H.A.; Kwak, D.A.; Jeon, S. Estimation of forest carbon budget from land cover change in South and North Korea between 1981 and 2010. J. Plant Biol. 2014, 57, 225–238. [Google Scholar] [CrossRef]
  37. Kim, D.; Lim, C.H.; Song, C.; Lee, W.K.; Piao, D.; Heo, S.; Jeon, S. Estimation of future carbon budget with climate change and reforestation scenario in North Korea. Adv. Space Res. 2016, 58, 1002–1016. [Google Scholar] [CrossRef]
  38. Kang, S.; Choi, W. Forest cover changes in North Korea since the 1980s. Reg. Environ. Chang. 2014, 14, 347–354. [Google Scholar] [CrossRef]
  39. Bae, J.S.; Joo, R.W.; Kim, Y.S. Forest transition in South Korea: Reality, path and drivers. Land Use Policy 2012, 29, 198–207. [Google Scholar] [CrossRef]
  40. Song, M.K.; Park, K.S. North Korea Forestry Technology. In Forest and Forestry Trends and Technology; Research Report 702; Korea National Institute of Forest Science: Seoul, Korea, 2017; pp. 123–183. [Google Scholar]
  41. World Bank. GDP per capita, PPP. Available online: http://data.worldbank.org/indicator/NY.GDP.PCAP.PP.CD?view=chart (accessed on 10 February 2017).
  42. Hengeveld, G.M.; Gunia, K.; Didion, M.; Zudin, S.; Clerkx, A.P.P.M.; Schelhaas, M.J. Global 1-Degree Maps of Forest Area, Carbon Stocks, and Biomass, 1950–2010; ORNL DAAC: Oak Ridge, TN, USA; Available online: http://dx.doi.org/10.3334/ORNLDAAC/1296 (accessed on 28 July 2017).
  43. Kubiszewski, I.; Costanza, R.; Franco, C.; Lawn, P.; Talberth, J.; Jackson, T.; Aylmer, C. Beyond GDP: Measuring and achieving global genuine progress. Ecol. Econ. 2013, 93, 57–68. [Google Scholar] [CrossRef]
  44. De Jong, W. Forest rehabilitation and its implication for forest transition theory. Biotropica 2010, 42, 3–9. [Google Scholar] [CrossRef]
  45. Rudel, T.K.; Schneider, L.; Uriarte, M. Forest transitions: An introduction. Land Use Policy 2010, 27, 95–97. [Google Scholar] [CrossRef]
  46. Hosonuma, N.; Herold, M.; De Sy, V.; De Fries, R.S.; Brockhaus, M.; Verchot, L.; Angelsen, A.; Romijn, E. An assessment of deforestation and forest degradation drivers in developing countries. Environ. Res. Lett. 2012, 7, 044009. [Google Scholar] [CrossRef]
  47. Kauppi, P.E.; Ausubel, J.H.; Fang, F.; Mather, A.S.; Sedjo, R.A.; Waggoner, P.E. Returning forests analyzed with the forest identity. Proc. Natl. Acad. Sci. USA 2006, 103, 17574–17579. [Google Scholar] [CrossRef] [PubMed]
  48. Food and Agriculture Organization of the United Nations (FAO). Managing forests for climate change. In FAO, Working with Countries to Tackle Climate Change through Sustainable Forest Management; FAO: Rome, Italy, 2010; pp. 1–20. [Google Scholar]
  49. Kraxner, F.; Schepaschenko, D.; Fuss, S.; Lunnan, A.; Kindermann, G.; Aoki, K.; Dürauer, M.; Shvidenko, A.; See, L. Mapping certified forests for sustainable management-A global tool for information improvement through participatory and collaborative mapping. For. Policy Econ. 2017, 83, 10–18. [Google Scholar] [CrossRef]
  50. World Bank. How Does the World Bank Classify Countries? Available online: https://datahelpdesk.worldbank.org/knowledgebase/articles/378834-how-does-the-world-bank-classify-countries (accessed on 28 July 2017).
  51. Baek, J.; Kim, H.S. Is economic growth good or bad for the environment? Empirical evidence from Korea. Energy Econ. 2013, 36, 744–749. [Google Scholar] [CrossRef]
  52. Barbati, A.; Marchetti, M.; Chirici, G.; Corona, P. European forest types and forest Europe SFM indicators: Tools for monitoring progress on forest biodiversity conservation. For. Ecol. Manag. 2014, 321, 145–157. [Google Scholar] [CrossRef] [Green Version]
  53. Wang, C.; Yang, Y.; Zhang, Y. Economic development, rural livelihoods, and ecological restoration: Evidence from China. Ambio 2011, 40, 78–87. [Google Scholar] [CrossRef] [PubMed]
  54. El Gafy, I.; Grigg, N.; Reagan, W. Dynamic Behaviour of the Water-Food-Energy Nexus: Focus on Crop Production and Consumption. Irrig. Drain. 2017, 66, 19–33. [Google Scholar] [CrossRef]
  55. Food and Agriculture Organization of the United Nations (FAO). AQUASTAT Main Database. Available online: http://www.fao.org/nr/water/aquastat/data/query/index.html?lang=en (accessed on 10 March 2017).
  56. Organization for Economic Co-operation and Development (OECD) Database. Available online: https://data.oecd.org/water/water-withdrawals.htm (accessed on 9 March 2017).
  57. The International Food Policy Research Institute (IFPRI) Hunger Index. Available online: http://ghi.ifpri.org/ (accessed on 11 March 2017).
  58. Food and Agriculture Organization of the United Nations (FAO). Global Forest Resources Data, Biodiversity and Conservation. Available online: http://www.fao.org/forest-resources-assessment/explore-data/flude/en/ (accessed on 2 March 2017).
  59. Rudel, T.K.; Coomes, O.T.; Moran, E.; Achard, F.; Angelsen, A.; Xu, J.; Lambin, E. Forest transitions: Towards a global understanding of land use change. Glob. Environ. Chang. 2005, 15, 23–31. [Google Scholar] [CrossRef]
  60. Ewers, R.M. Interaction effects between economic development and forest cover determine deforestation rates. Glob. Environ. Chang. 2006, 16, 161–169. [Google Scholar] [CrossRef]
  61. Olson, D.M.; Dinerstein, E.; Wikramanayake, E.D.; Burgess, N.D.; Powell, G.V.; Underwood, E.C.; D’amico, J.A.; Itoua, I.; Strand, H.E.; Morrison, J.C.; et al. Terrestrial Ecoregions of the World: A New Map of Life on Earth: A new global map of terrestrial ecoregions provides an innovative tool for conserving biodiversity. BioScience 2001, 51, 933–938. [Google Scholar] [CrossRef]
  62. Karabulut, A.; Egoh, B.N.; Lanzanova, D.; Grizzetti, B.; Bidoglio, G.; Pagliero, L.; Bouraoui, F.; Aloe, A.; Reynaud, A.; Maes, J.; et al. Mapping water provisioning services to support the ecosystem-water-food-energy nexus in the Danube river basin. Ecosyst. Serv. 2016, 17, 278–292. [Google Scholar] [CrossRef]
  63. Hák, T.; Janoušková, S.; Moldan, B. Sustainable Development Goals: A need for relevant indicators. Ecol. Indic. 2016, 60, 565–573. [Google Scholar] [CrossRef]
  64. Chazdon, R.L. Beyond deforestation: Restoring forests and ecosystem services on degraded lands. Science 2008, 320, 1458–1460. [Google Scholar] [CrossRef] [PubMed]
  65. Benayas, J.M.R.; Newton, A.C.; Diaz, A.; Bullock, J.M. Enhancement of biodiversity and ecosystem services by ecological restoration: A meta-analysis. Science 2009, 325, 1121–1124. [Google Scholar] [CrossRef] [PubMed]
  66. Bullock, J.M.; Aronson, J.; Newton, A.C.; Pywell, R.F.; Rey-Benayas, J.M. Restoration of ecosystem services and biodiversity: Conflicts and opportunities. Trends Ecol. Evol. 2011, 26, 541–549. [Google Scholar] [CrossRef] [PubMed]
  67. Li, M.S. Ecological restoration of mineland with particular reference to the metalliferous mine wasteland in China: A review of research and practice. Sci. Total Environ. 2016, 357, 38–53. [Google Scholar] [CrossRef] [PubMed]
  68. Erb, K.H.; Fetzel, T.; Plutzar, C.; Kastner, T.; Lauk, C.; Mayer, A.; Niedertscheider, M.; Körner, C.; Haberl, H. Biomass turnover time in terrestrial ecosystems halved by land use. Nat. Geosci. 2016, 9, 674–678. [Google Scholar] [CrossRef]
  69. Baral, H.; Guariguata, M.R.; Keenan, R.J. A proposed framework for assessing ecosystem goods and services from planted forests. Ecosyst. Serv. 2016, 22, 260–268. [Google Scholar] [CrossRef]
  70. Ciccarese, L.; Mattsson, A.; Pettenella, D. Ecosystem services from forest restoration: Thinking ahead. New For. 2012, 43, 543–560. [Google Scholar] [CrossRef]
Figure 1. Relationship between GDP per capita and forest stock on the Korean Peninsula: (a) South Korea; and (b) North Korea.
Sustainability 09 01342 g001
Figure 2. Relationship between GDP per capita and forest stock in the Mid-Latitude region: (a) France; (b) China; (c) Iran; and (d) Afghanistan.
Sustainability 09 01342 g002
Figure 3. Conceptual flows for classifying and implementing land development phases (LDPs).
Sustainability 09 01342 g003
Figure 4. Classification of the eight zone for LDPs classification (degradation, restoration and sustainability). FSC, forest stock change.
Sustainability 09 01342 g004
Figure 5. LDPs classification by forest stock change.
Sustainability 09 01342 g005
Figure 6. Land development phases by GDP and GDP per capita with forest area change.
Sustainability 09 01342 g006
Figure 7. Ecosystem services by each land development phase.
Sustainability 09 01342 g007
Table 1. Matrix of LDPs classification of major countries based on two approaches: (1) forest stock change and (2) GDP and GDP per capita with forest area change.
LDPs ClassificationDegradation Phase Based on Forest Stock ChangeRestoration Phase Based on Forest Stock ChangeSustainability Phase Based on Forest Stock Change
Degradation phase based on GDP and GDP per capita with forest area changeAfghanistan, Albania, Angola, Armenia, Colombia, Congo, Dominica, El Salvador, Gambia, Ghana, Grenada, Guyana, Jamaica, Kazakhstan, Laos, Lesotho, Macedonia, Maldives, Mali, Myanmar, Namibia, Nicaragua, Niger, North Korea, Peru, South Africa, Sri Lanka, Sudan, Swaziland, Tajikistan, Tanzania, Tonga, Tunisia, Turkmenistan, Uganda, Western Sahara, YemenBangladesh, Bolivia, Burundi, Cambodia, Central African Republic, Chad, Equatorial Guinea, Eritrea, Ethiopia, Georgia, Guinea-Bissau, Kyrgyzstan, Madagascar, Malawi, Mauritania, Moldova, Mongolia, Nepal, Papua New Guinea, Rwanda, Senegal, Serbia, Sierra Leone, Somalia, Suriname, Kenya, Syria, Jordan, Uzbekistan, Zambia, ZimbabweBelize, Benin, Bhutan, Bosnia and Herzegovina, Botswana, Bulgaria, Burkina Faso, Cameroon, Congo, Djibouti, Ecuador, Guatemala, Guinea, Haiti, Honduras, Ivory Coast, Liberia, Mozambique, Nigeria, Pakistan, Panama, Paraguay, Togo
Restoration phase based on GDP and GDP per capita with forest area changeAzerbaijan, Bahrain, Brunei, Egypt, Iceland, Iran, Portugal, Thailand, Uruguay, VietnamBelarus, Brazil, Chile, China, Cyprus, Estonia, Faroe Islands, Gabon, Greenland, Indonesia, Iraq, Latvia, Lebanon, Libya, Lithuania, Malaysia, Malta, Mexico, Monaco, Morocco, Oman, Philippines, Qatar, Romania, Singapore, Taiwan, Trinidad and Tobago, Ukraine, VenezuelaAlgeria, Andorra, Argentina, Costa Rica, Croatia, Cuba, Dominican Republic, Hungary, India, Liechtenstein, Luxembourg, Montenegro, Norway, Poland, San Marino, Slovakia, Slovenia
Sustainability phase based on GDP and GDP per capita with forest area changeGreece, Iceland, Kuwait, Saudi Arabia, United Arab EmiratesAustralia, Israel, RussiaAustria, Belgium, Canada, Czech Republic, Denmark, Finland, France, Germany, Italy, Japan, Netherlands, New Zealand, Puerto Rico, South Korea, Spain, Sweden, Switzerland, Turkey, United Kingdom, United States
Table 2. Water-food-ecosystem indices classified into LDPs based on forest stock. IFPRI, International Food Policy Research Institute.
Indices (Year)DegradationRestorationSustainabilitySource
TWW (2007)713.85479.36547.69FAO, 2016
TWW (2012)1322.81383.64508.62FAO, 2016
TRWR (2002)29,274.8219,041.8722,972.90FAO, 2016
TRWR (2007)27,712.1017,619.8420,937.94FAO, 2016
TWW/TRWR × 100 (2007)2.582.722.62FAO, 2016
TWW/TRWR × 100 (2012)5.132.342.65FAO, 2016
GHI (2008)20.9722.0423.39IFPRI, 2017
GHI (2016)17.8418.5021.63IFPRI, 2017
FPI (2007)105.44103.25102.46World Bank, 2017
FPI (2012)115.96118.54111.45World Bank, 2017
Biodiversity Conservation (2010)1998.514443.943231.39FAO, 2017
Protected Forest Area (2010)1856.107753.063088.32FAO, 2017
CCPI (2008)51.1150.8552.21Germanwatch, 2007
CCPI (2012)51.9655.3255.77Germanwatch, 2011
Table 3. Water-food-ecosystem indices classified into LDPs based on forest area and GDP change.
Indices (Year)DegradationRestorationSustainabilitySource
TWW (2007)510.13571.63691.53FAO, 2016
TWW (2012)450.14789.23607.45FAO, 2016
TRWR (2007)23,889.8523,855.8312,063.90FAO, 2016
TRWR (2012)21,795.3822,600.5511,565.08FAO, 2016
TWW/TRWR × 100 (2007)2.142.345.73FAO, 2016
TWW/TRWR × 100 (2012)2.073.495.25FAO, 2016
GHI (2008)25.5313.227.17IFPRI, 2017
GHI (2016)21.4011.476.80IFPRI, 2017
FPI (2007)105.42102.16100.15World Bank, 2017
FPI (2012)120.40112.36104.47World Bank, 2017
Biodiversity Conservation (2010)1900.283749.677087.29FAO, 2017
Protected Forest Area (2010)2045.218332.064854.10FAO, 2017
CCPI (2008)49.8753.3049.94Germanwatch, 2007
CCPI (2012)47.6056.3754.43Germanwatch, 2011

