1. Introduction
Technology is one of the most important factors in national and company management. Many companies have tried to research and develop innovative technologies to improve their technological competitiveness. In addition, they have conducted technology analyses to maintain their technological sustainability in competition with their competitors [
1,
2,
3]. The companies that have developed innovative technologies and launched new products have dominated the market. The development of new products by technological innovation is a very important factor in maintaining technological sustainability of companies [
4]. Therefore, technological innovation is a very important factor in the management of sustainable technology. In this paper, we first take a look at the companies that have successfully sustained innovative technology management. Apple is a representative company creating innovative technologies and products. Through smart devices such as the iPhone and iPad, Apple holds many customers around the world. A lot of institutes and business schools have therefore studied Apple’s technological innovations with a wide range of books and research papers on Apple’s technology published in diverse fields [
5,
6,
7,
8]. Some of these studies conducted technology analysis using Apple’s patents to understand Apple’s technological innovation. Jun and Park (2013) analyzed the applied and registered patents of Apple to examine its innovations in terms of technology. They considered data mining methods and social network analysis techniques for analyzing the patents of Apple. Kim and Jun (2015) also proposed a statistical model for the analysis of Apple’s technology. The research used graphical causal inference, copula regression, and text mining techniques to analyze the patent data related to Apple technology. A number of studies have also been conducted on technology analyses of other companies. Jun and Park (2016) also analyzed the technologies of BMW and Hyundai motors and compared each other to examine the technological competition between these two companies [
9]. Using the patent analysis for the technological innovation and evolution between the two competitors, they compared the sustainability of BMW and Hyundai in the Korean car market. It also implies that the sustainable technology in given technological fields can be identified by using the results of technology analysis based on patent data. Most of the methods of technology analysis in previous studies were dependent on the knowledge and experience of technological experts, especially using techniques such as Delphi, technology road-mapping, or scenario analysis [
4,
10,
11,
12]. Hung et al. (2012) provided a technology forecast of Taiwan’s PC ecosystem by carrying out a Delphi survey based on end users and experts. Keller and Gracht (2014) also used a Delphi survey for technology forecasting analysis. In recent years, many studies have been conducted on a hybrid technology analysis that combines the results of qualitative and quantitative analyses [
13,
14]. Huang et al. (2014) combined bibliometrics (quantitative technology analysis) and road-mapping (qualitative technology analysis) to examine research and development (R&D) planning. Zhang et al. (2014) also conducted a technology analysis combining multivariate analysis (clustering, factor analysis, and topic model) as a quantitative approach with purposive analysis TRIZ (theory of solving inventive problem) and technology road-mapping) as a qualitative approach. Using the extracted keywords from the patent title and abstract, they carried out term clumping for technological intelligence. The results of these kinds of studies are basically unstable because they depend on subjective judgment of experts in some or all of their technology analyses. As an alternative to overcome the subjectivity problem, we propose a quantitative approach to analyze patent data using statistical modeling. The model that is going to be dealt with in this study is apt for analyzing technology objectively, since it is mainly based on quantitative patent analysis and limits the subjective judgment of experts as much as possible. In addition to the statistical model, this study aims to develop a methodology for sustainable technology management using quantitative technology analysis. To verify the practical applicability, it is necessary to select one of the promising technology fields to which the proposed methodology is applied. The smart light emitting diode (LED) system is chosen as a target technology in this study to apply our method in a practical domain. LED is a semiconductor light source technology used in lighting applications in diverse areas such as industry and home [
15]. Liour et al. (2011) predicted that traditional LED technology would reach the saturation stage by 2016, using a logistic regression model. The spread of traditional LED technology has led to the development of smart LED systems. Demand for the development and management of smart LED technology has continued to increase. Sung and Lin (2013) proposed the design and implementation of smart LED systems using self-adaptive weighted data fusion [
16]. They developed a smart LED system controlled by smart devices. The IHS Technology Lighting and LEDs Team (2015), Chen et al. (2012), and Kim et al. (2012) explained the need for the development of smart LED technology [
17,
18,
19]. Furthermore, AZoOptics (2015) forecast that the average annual growth rate of smart light systems would be at 36.4% during the period from 2014 to 2018 [
20]. Smart LED systems are therefore major emerging technologies both now and in the future. In this study, technology analysis of smart LED systems is performed to understand this technology, and utilize the results of the analysis to establish efficient R&D strategies for securing sustainable technology in smart LED fields. In order to analyze the technology of smart LED systems, it is required to analyze related patents. Many studies related to patent analysis have extracted keywords and the international patent classification (IPC) codes from patent documents and analyzed them [
1,
2,
5,
6,
9,
19,
21,
22]. Keywords are used in many fields such as bibliometrics [
23,
24]. Chen and Xiao (2016) researched on selecting publication keywords from journal paper databases for bibliometrics. To improve bibliographic information retrieval, Zhu et al. (2017) used a graph system based on term structure extracted from papers. Citation analysis is another useful technique in bibliometrics. Glanzel (2001) studied on making the national characteristics of co-authorship relations in international scientific areas [
25]. In addition, Yan et al. (2010) introduced a co-authorship network analysis by mapping library and information science [
26]. They were all related to the citation analysis between authors. We can consider the co-authorship citation analysis for analyzing patent inventors.
In general, the data used for quantitative patent analysis consist of the number of occurrences of the keyword or the IPC codes in patent documents, which are representative count data. Thus, count data models are needed for patent analysis; however, most previous researches on patent analysis did not consider count data models, which led to the accuracy of their analytical results. To solve this problem, we propose an approach to analyze the keywords and IPC codes using count data models. Additionally, we visualize the technological relationships between patent keywords and IPC codes. Visualization is a good way to grasp the associative distribution of technology in patent and technology analysis [
27,
28]. Leydesdorff and Bornmann (2012) used Google maps to visualize patent data mapping. Zhang et al. (2017) also proposed a visualization method based on science map for finding out the evolutionary relationships of scientific activities. In our research, we consider a visualization method based on Bayesian statistics, and add this visualization to the patent count data modeling. In our case study on smart LED technology, we show how the proposed method could be applied in reality. This paper contributes to efficient R&D planning in management of technology (MOT) for finding global sustainable technology of smart LED systems. The remainder of the paper is structured as follows.
Section 2 introduces general count data models in statistics. We propose a technology analysis method using a count data model and visualization based on Bayesian networks in
Section 3. To illustrate the practical application of this paper, we carry out a case study in
Section 4. Finally, in
Section 5, we present our conclusions and suggestions for future research.
2. Count Data Modeling
Using text mining techniques, we extracted keywords and other information, such as IPC codes, from patent documents collected for analysis [
5,
21,
29,
30]. These patent keywords and IPC codes are represented by the frequency of occurrence. The frequency values are typical count data. In many existing studies, the frequency data were analyzed using the methods of continuous data analysis [
22,
31,
32]. However, in order to perform a more effective patent analysis, it is necessary to consider frequency data analysis. Kim and Jun (2016) analyzed patent keywords using a zero-inflated Poisson distribution and negative binomial regression [
33]. This approach is one of several models available for count data analysis. In many patent documents, the response and explanatory variables (keywords or IPC codes) are nonnegative integer data. We thus need to explain the response variable (Y) in terms of explanatory variables (X) using the count data model. First, since the response variable is the count data, a discrete probability distribution can be considered. The Poisson distribution, which is often used for count data analysis, has a probability mass function as below [
34,
35]:
where
m is the basic parameter of the Poisson distribution and represents the average number of event occurrences. The expectation of Y is
m, and the variance of Y is also
m. In this paper, we consider Poisson regression as a count data model. Poisson regression is based on the Poisson distribution formula and its parameter (
m). Poisson regression is a representative model for count data analysis [
35]. Using the Poisson distribution, we derive the Poisson density of Y given X as follows:
[
34]. The basic version of the Poisson regression model is parameterized as below:
where
m is the parameter of the Poisson distribution with the expectation and conditional variance of Y given X. In this paper, we consider the Poisson model as a technique for frequency analysis. We also take into account visualization based on Bayesian networks to understand the relationship between keywords and IPC codes.
3. Technology Analysis Using a Count Data Model and Visualization Based on Bayesian Networks
Patent data provide a good resource to analyze technology for R&D management [
4]. Many studies have therefore used patent data for technology analysis; the methods of patent analysis employed were also very diverse. In this paper, we combine Poisson hurdle regression with visualization based on Bayesian networks for the proposed patent analysis. The field of smart LED system technology is chosen to show how the proposed method could be applied to practical problems. In the proposed method, the keywords and IPC codes are extracted first from the patent documents. This process requires text mining techniques for preprocessing patent documents. In our research, we use R data language and its text mining package ‘tm’ [
29,
30,
36]. This software provides diverse functions to transform documents into structured data for patent analysis using statistical modeling, as statistical analysis is only applicable to structured data.
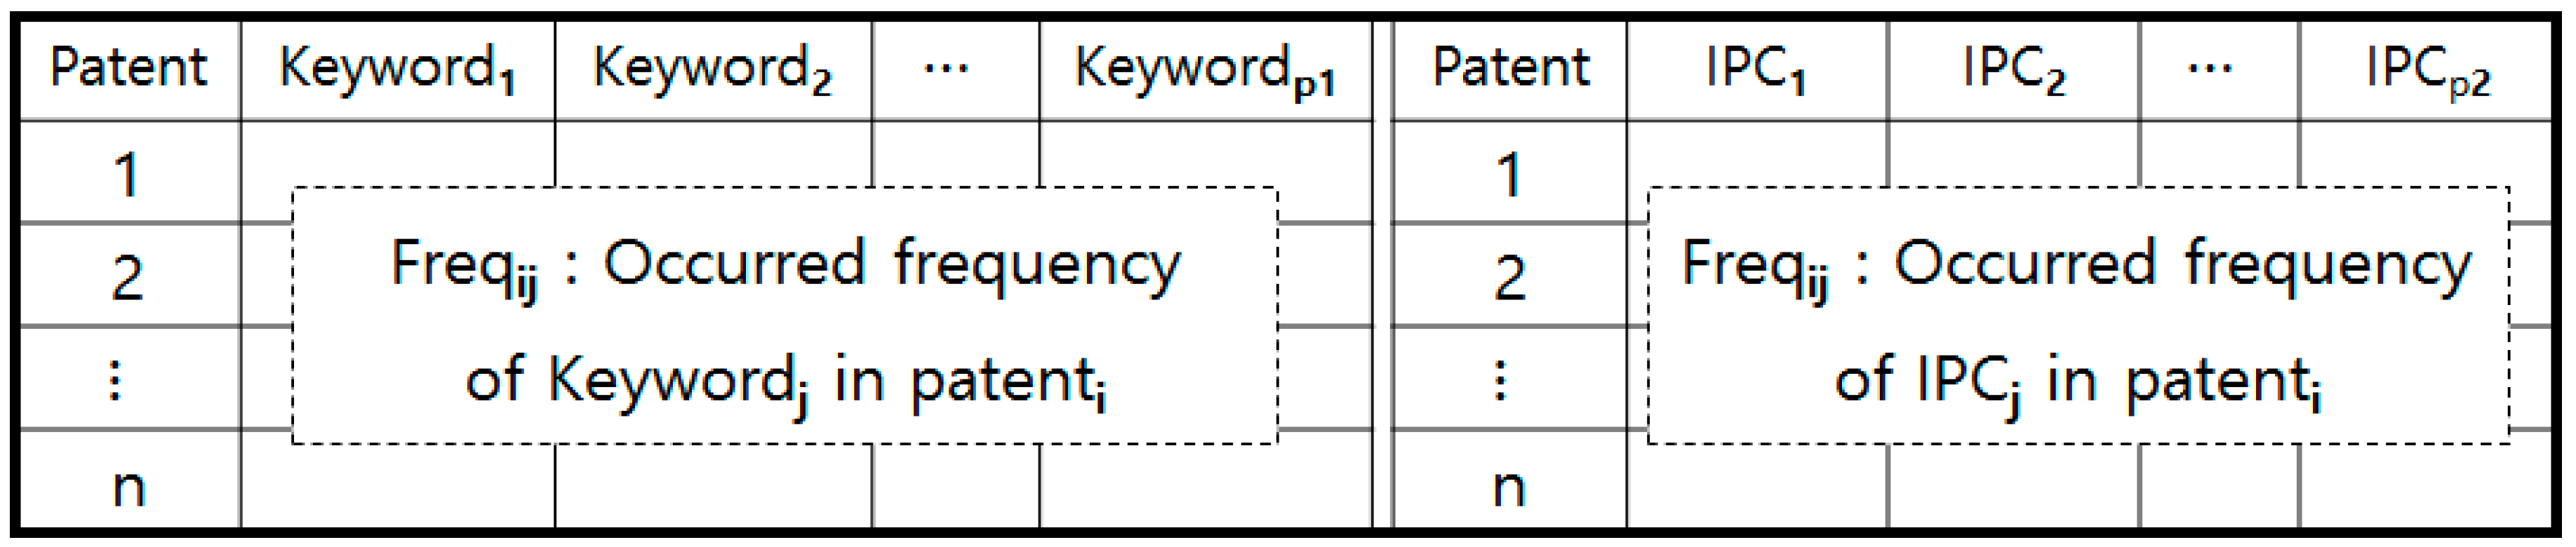
Figure 1 shows the data structure proposed for this research.
The structured data comprise a matrix of rows representing patent documents and columns corresponding to keywords or IPC codes. The elements of the matrix indicate the frequency at which each keyword or IPC code occurs in a particular patent document. As shown in
Figure 1, the keyword and IPC code are included in one structured patent data for convenience. However, in the actual analysis process, the keyword and the IPC code data are independently analyzed by count regression model and visualization based on Bayesian networks. The occurrence frequencies included in the structured data are typical count data. Therefore, in this paper, we need a count analysis model, and consider Poisson hurdle regression. This model was introduced by Mullahy (1986) and is built by dividing frequency data into zero and nonzero parts. The following equation represents the Poisson hurdle model proposed by Mullahy and Ridout et al. [
37,
38]:
where
π is the probability of Y = 0,
. The regression analysis is performed by dividing the model into zero and nonzero parts. When the frequency is 0, Y is calculated by
π, and when the frequency is greater than 0, Y is modeled by a Poisson distribution with a weight of (1 −
π). The Poisson hurdle model is therefore an efficient approach for the frequency analysis of patent keywords. We also consider two variables for the response variable Y. The variables are “
Smart” and “
LED”, because the target technology of our research is related to smart LED systems. All other keywords apart from
Smart and
LED are used as explanatory variables. All IPC codes captured are also used as explanatory variables for
Smart and
LED. To carry out the technology analysis of smart LED systems, we consider the following pair of Poisson hurdle regression models:
The regression parameters are estimated by fitting the structured data in
Figure 1 with two proposed models. Using the results of keywords and IPC codes analyses, we can grasp the technological relations among the sub-technologies related to smart LED systems. The other method considered in this research for technology analysis is a visualization based on Bayesian networks. In this paper, we call this visualization based on Bayesian networks. Bayesian networks are statistical models based on graph theory [
39]. In the model, the response and explanatory variables are the nodes of the network. In the Bayesian network, connections and arrows represent probabilistic dependencies between nodes [
40]. The structure of a Bayesian network is a directed acyclic graph (DAG) as follows:
where
N and
E represent nodes and edges respectively. The edges are the connections between nodes in the Bayesian network. In this paper,
N consists of the keywords and IPC codes and is expressed as
, while
E represents the technological relationships between the keywords or IPC codes. The joint probability function of the nodes is represented as follows:
This conditional probability is used to construct the graph of the corresponding keywords or IPC codes, because the nodes indicate the keywords or IPC codes in this paper. The process of visualization based on Bayesian networks for understanding technological structure consists of two steps:
In step 1, a structure learning algorithm is used for visualization based on Bayesian networks. Bayesian structure learning for visualization begins with an initial belief in the given technology data. The initial belief is a prior distribution and multiplied by a likelihood function of individual data, resulting in an updated posterior distribution. The algorithm depends on two possible methods, which are the constraint-based and the score-based approaches [
39]. We use the former, because this approach provides a stronger theoretical framework for the statistical testing. A conditional independence test is also performed in step 2. This test uses the conditional probability function through the observed frequencies of keywords or IPC codes in patent documents. In the proposed methodology, the testing data is constructed as follows:
The notation “tilde(~)” means that two keywords on both sides of “~” are considered as response variables at the same time. The keywords
Smart and
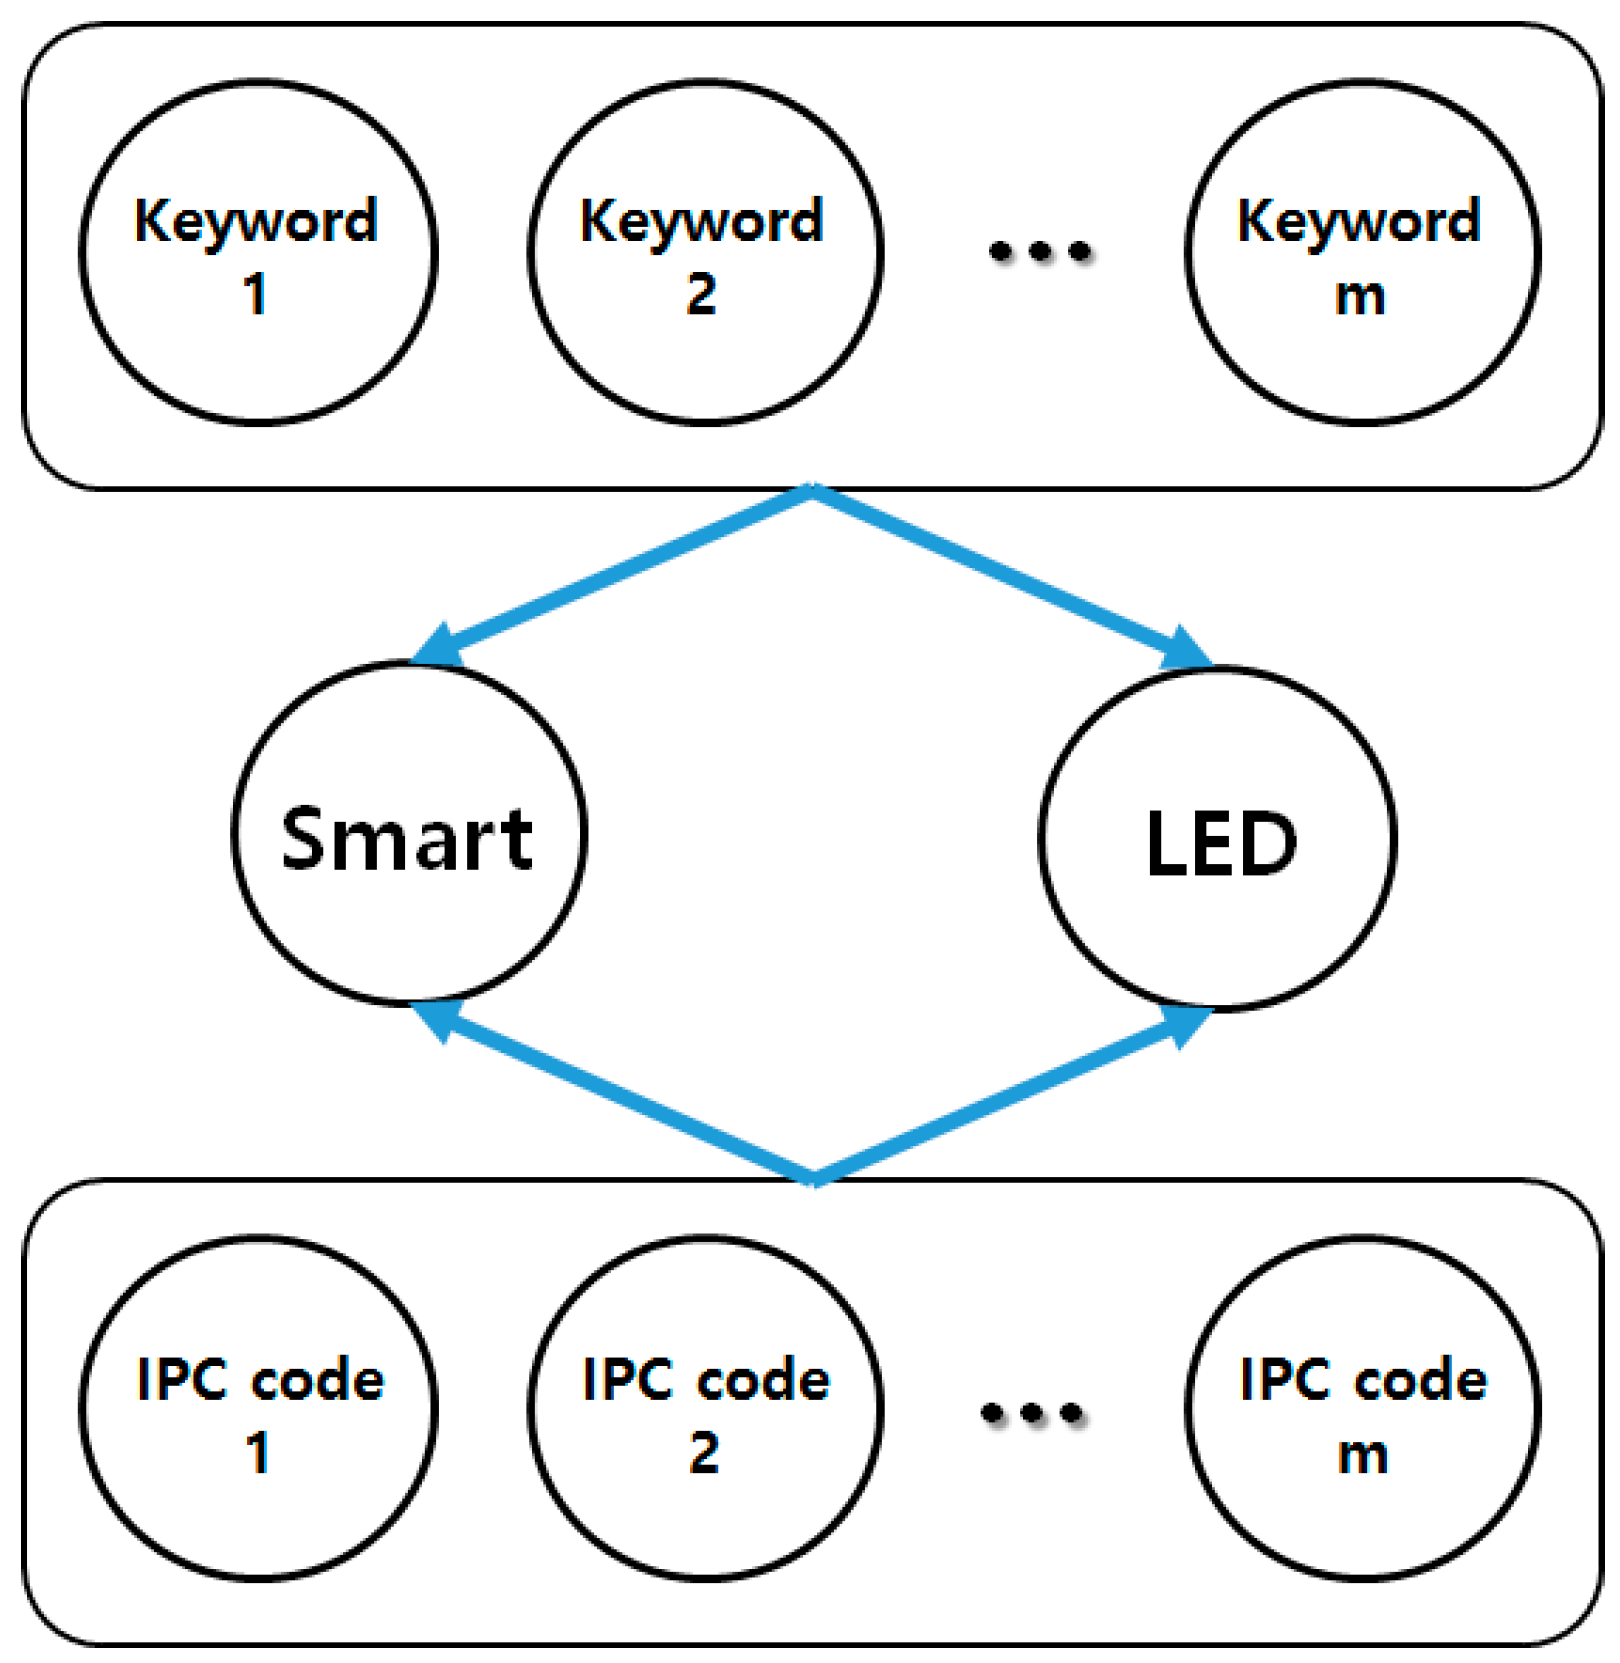
LED are the target nodes, while other keywords and IPC codes are the explanatory nodes in the Bayesian network graph. The basic structure of the proposed visualization based on Bayesian networks is shown in
Figure 2.
The Bayesian network consists of various nodes that describe the two nodes around
Smart and
LED. Of course, other nodes apart from
Smart and
LED can also be linked to each other if their connections are significant. In addition, we carry out a conditional independence test to confirm the statistical significance of the visualization results [
39]. We use 0.05 as the threshold for the probability value (
p-value) of testing in our research. That is, it can be concluded that the statistical testing result is significant when the
p-value is less than 0.05. In this paper, we perform the technology analysis on smart LED systems considering the results of both count data analysis and visualization based on Bayesian networks simultaneously.
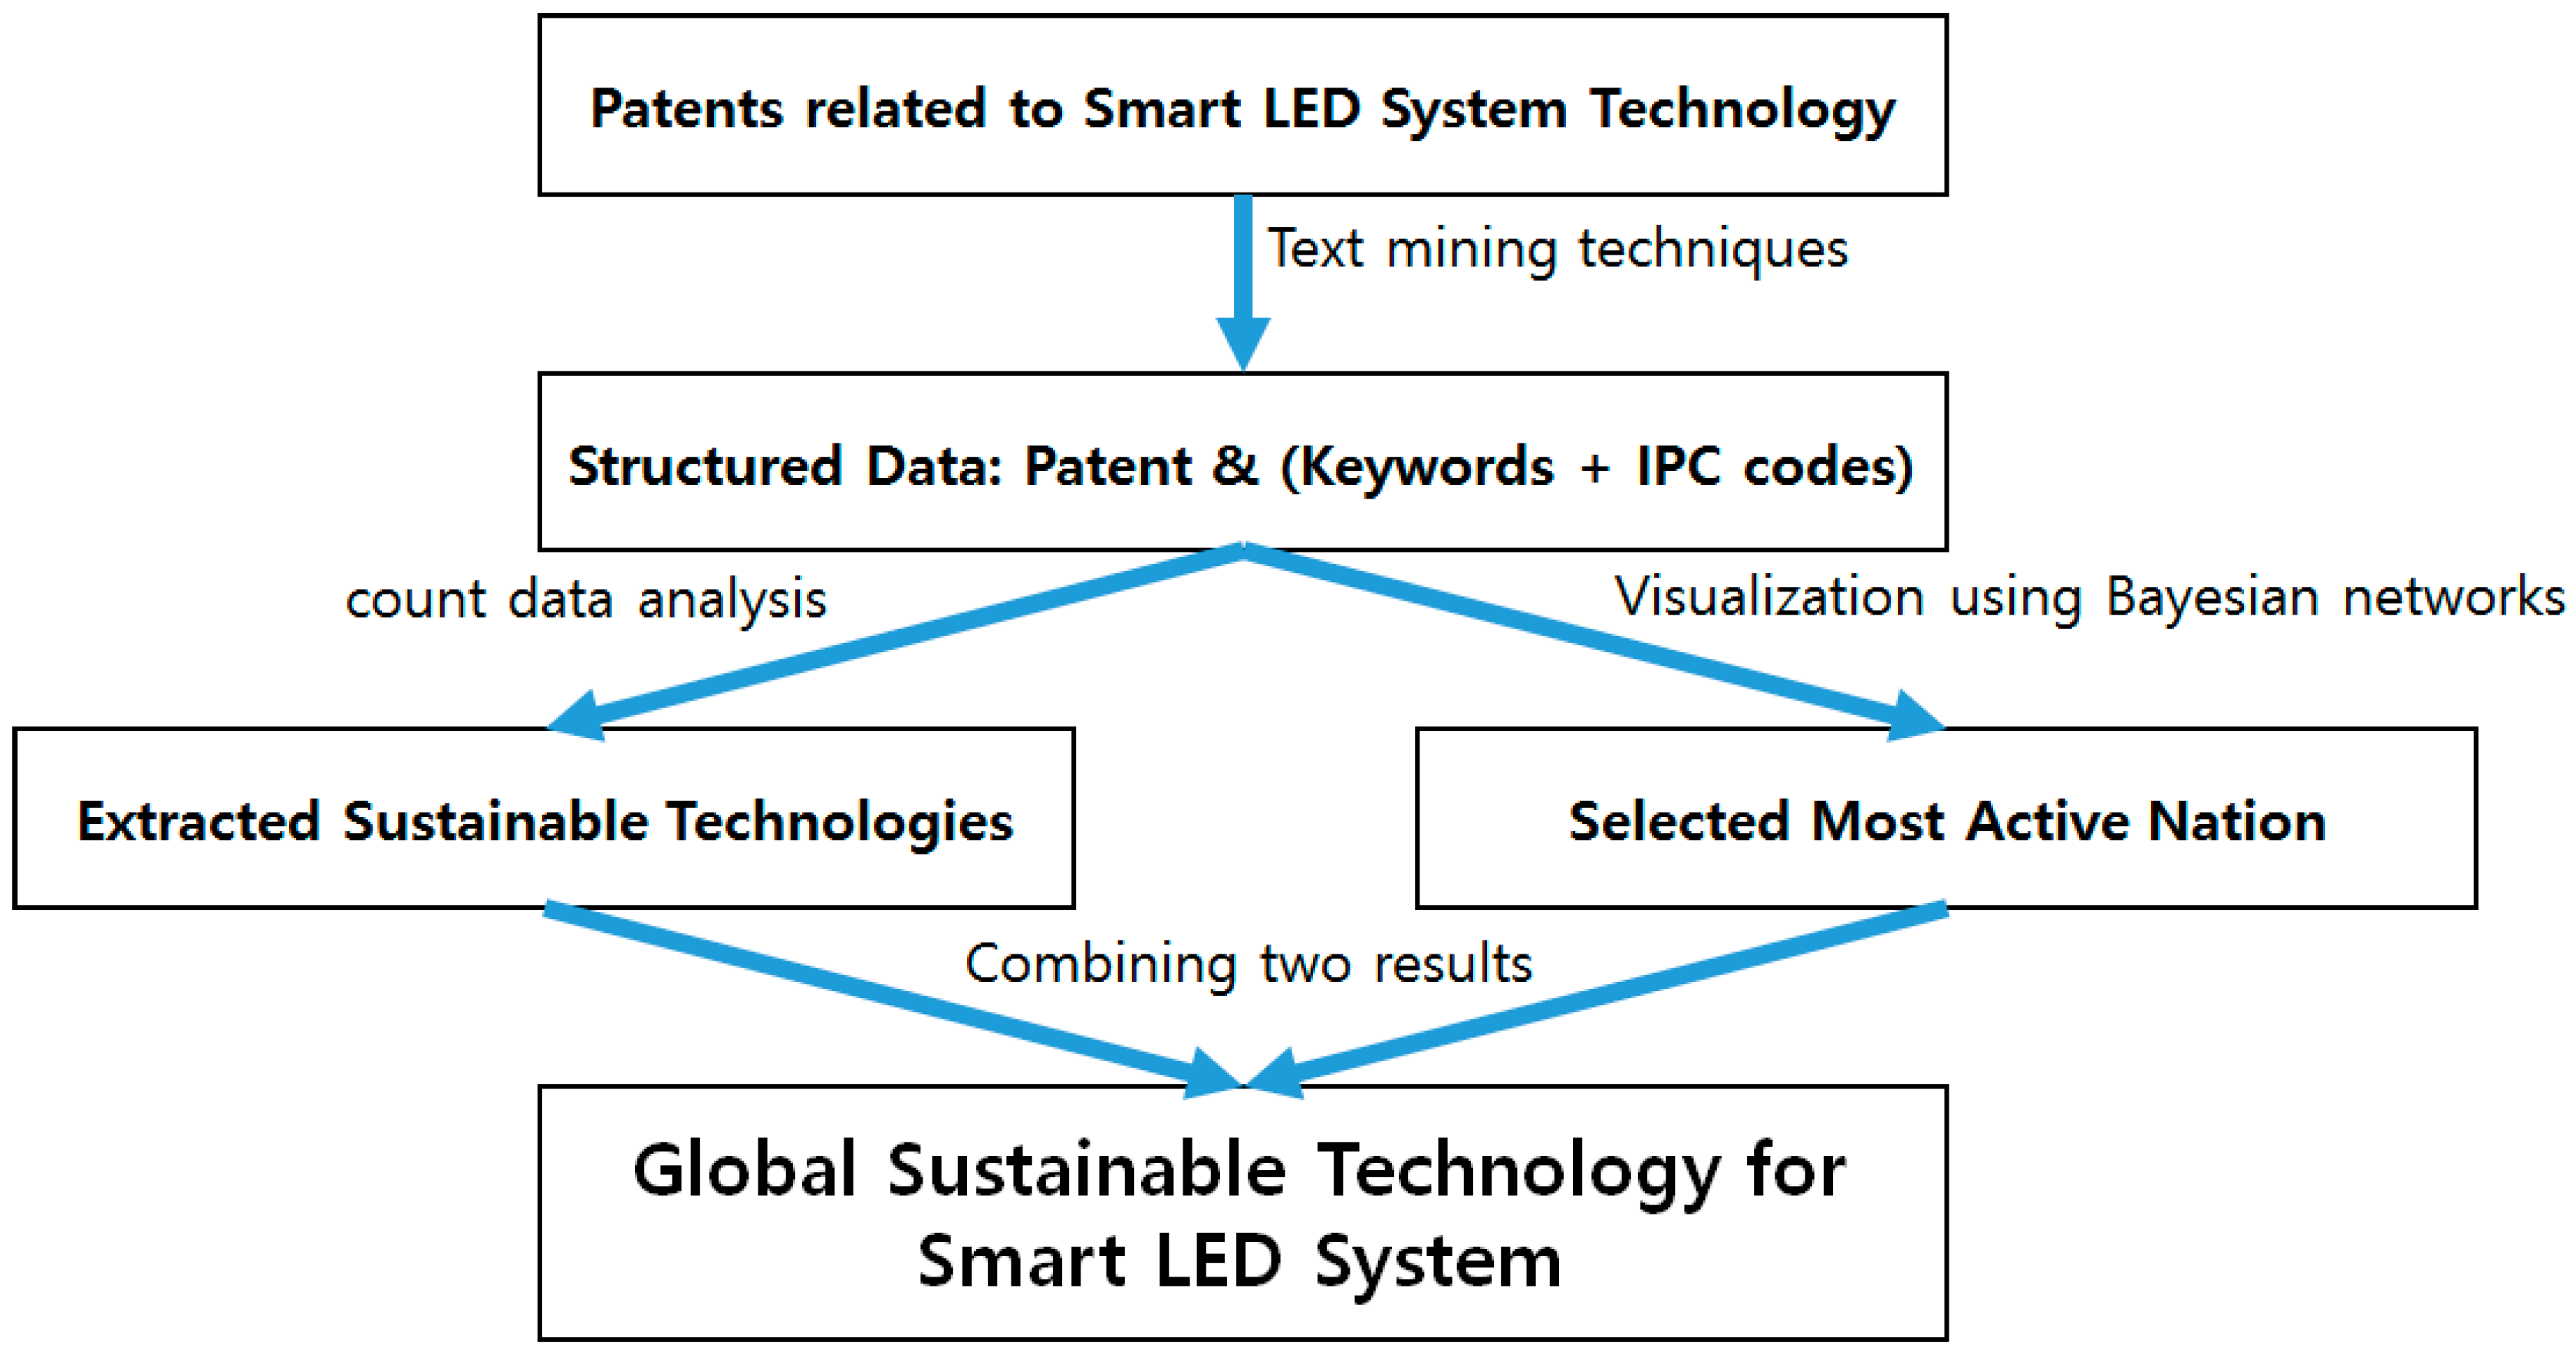
Figure 3 shows the overall procedure proposed in this paper for finding sustainable technologies in smart LED systems.
From the collected patents related to smart LED technology, the structured dataset consisting of keywords and IPC codes is created by using text mining techniques. Using these structured data, we extract sustainable technologies by count regression analysis and recognize the most active nation for developing smart LED technology by visualization based on Bayesian networks. In conclusion, we provide a detailed description of the sustainable technology environment of smart LED systems and identify the country where the most active technology development takes place for smart LED systems. In the next section, we deal with a case study of technology analysis for smart LED systems to illustrate how our methodology can be applied in practical domains.
4. Case Study of Technology Analysis for Smart LED Systems
In this paper, a case study using the patent data related to smart LED light systems was carried out to show how our method can be applied to a real problem. First, the relevant patent documents were retrieved from the patent databases of the United States Patent and Trademark Office and WIPS Corporation [
41,
42]. Experts of the Korea Intellectual Property Strategy Agency (KISTA) [
43] helped to construct our search formula for collecting the patent documents related to smart LED light systems as follows.
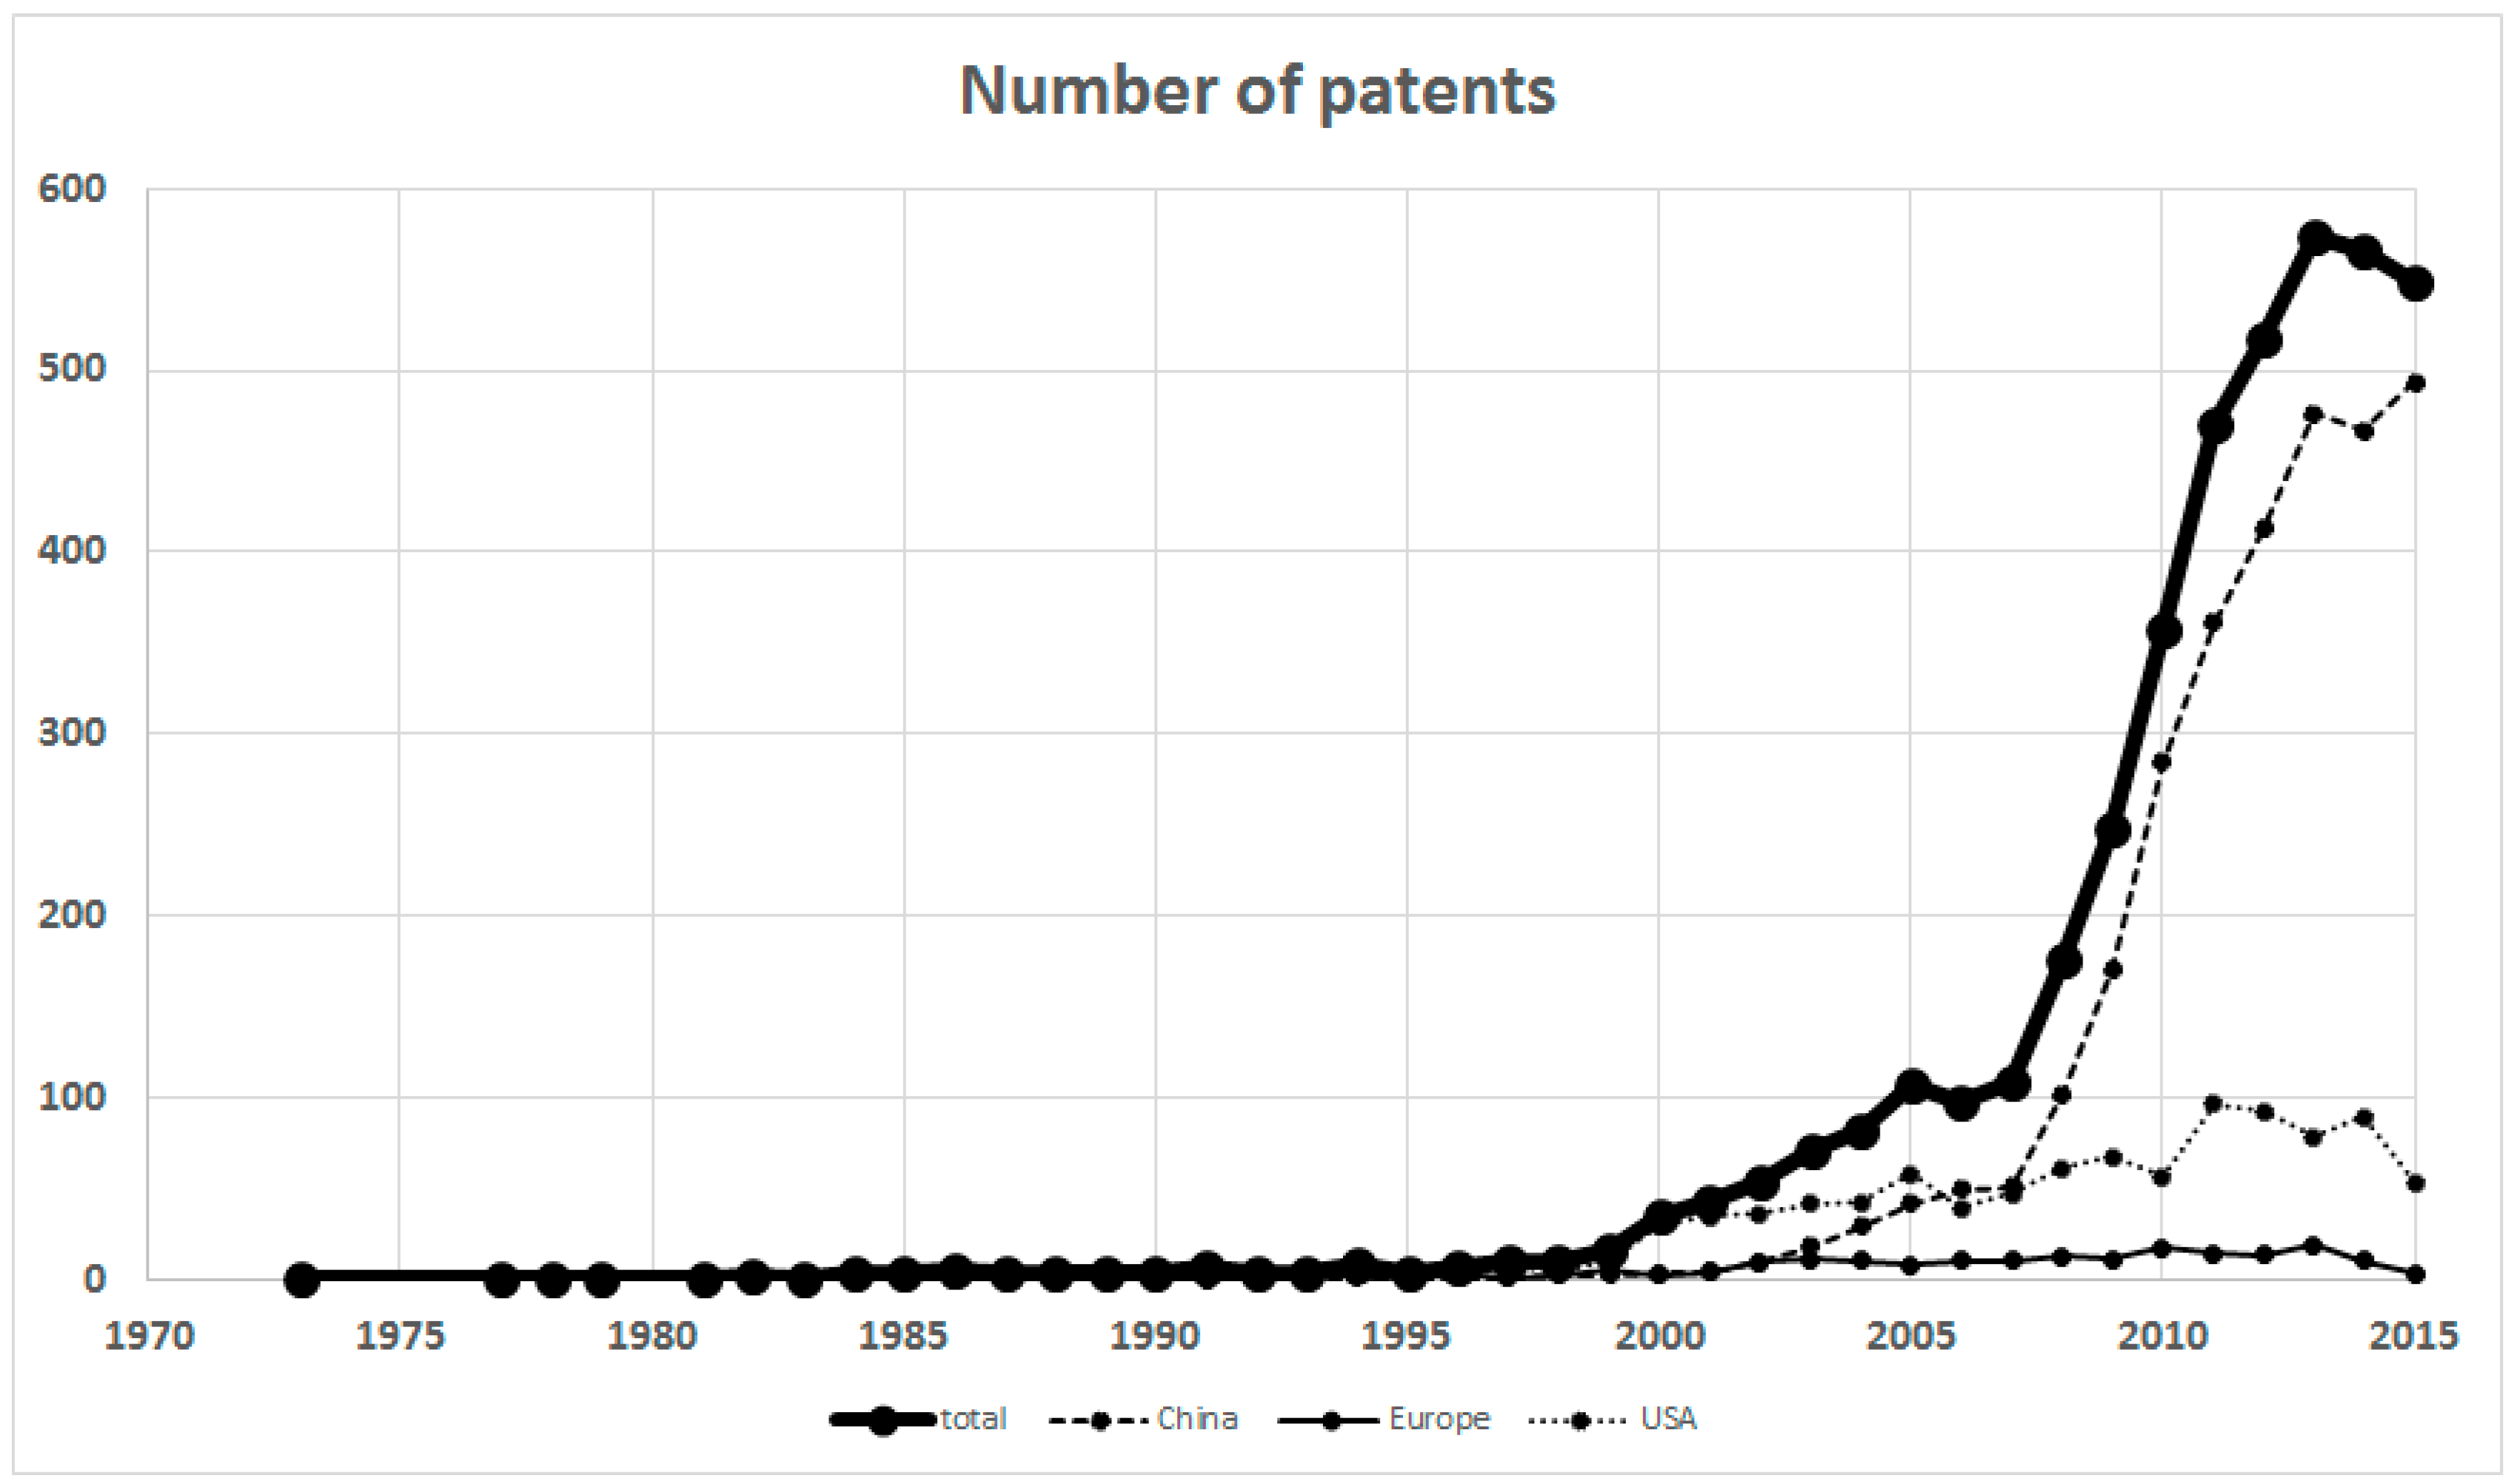
We also searched the patents according to three regions, Asia, Europe, and North America, with China and the US acting as representative nations for the continents of Asia and America. We obtained 4226 samples by filtering valid patents. The numbers of patents from China, Europe, and the US are 3043, 184, and 999, respectively.
Figure 4 shows the number of patents issued each year.
Compared with Europe and US, China has issued more patents for smart LED technology. Overall, since the late 2000s, the patents related to smart LED light systems increased dramatically. We extracted the keywords and IPC codes from the patent documents using text mining techniques. In this paper, we used the R data language and its ‘tm’ package for text mining [
29,
30,
36]. In addition, the top ten major IPC codes identified from the patent documents are as follows.
Table 1 includes the main IPC codes and their technological definitions from the World Intellectual Property Organization (WIPO) [
44,
45]. It is known that the top ten IPC codes have a large impact on the development of smart LED technology; we thus used the IPC codes to illustrate how the technologies corresponding to each IPC code could influence smart LED technology. In our statistical model, the IPC codes are independent variables and the keywords
Smart and
LED become the dependent variables as follows:
where the error term is
. We performed this statistical regression according to the three regions and obtained the following results.
From these results, we can find those significant keywords with
p-values less than 0.05. Although there are some differences in the keyword list, depending on the region, it can be seen that the overall results are similar to each other. The estimate value of each keyword indicates the degree of influence on the smart LED. For example, when the technology related to keyword
control in “Total” increases by 1 unit, the estimate 0.0478 means that the total technology development related to smart LEDs is increased by 0.0478 unit. The estimates under “Total” are the results of the regression analysis using all the data from China, Europe, and US. Using the results of
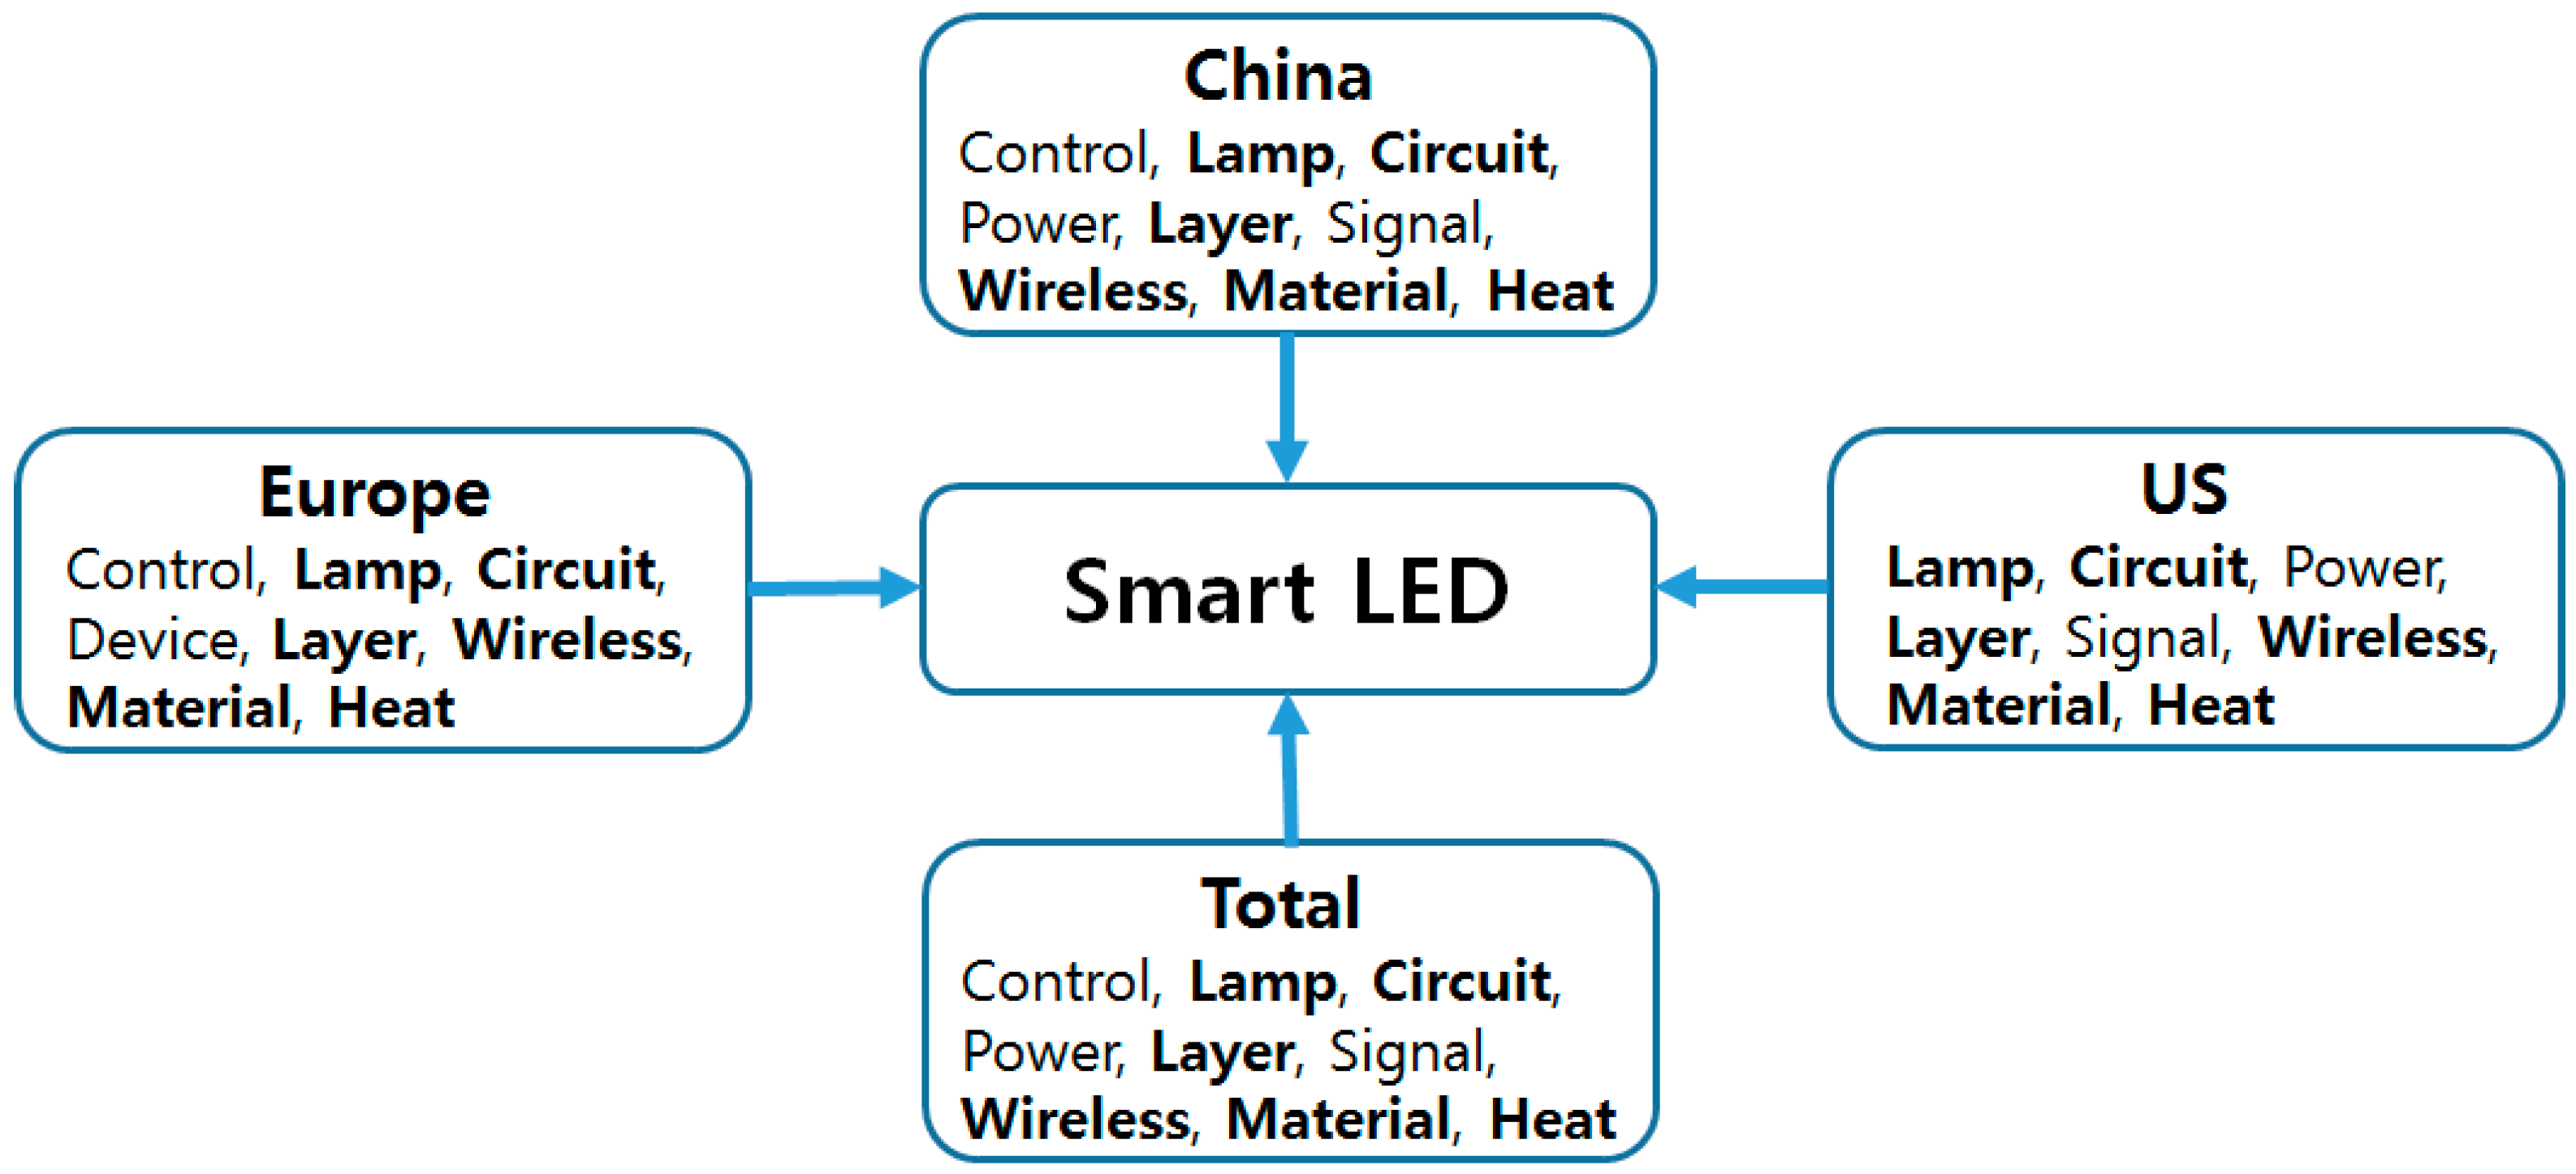
Table 2, we created the following technology structure of smart LED systems by keywords.
In
Figure 5, China affects the development of smart LED technology via the technologies based on
Control,
Lamp,
Circuit,
Power,
Layer,
Signal,
Wireless,
Material, and
Heat. These keywords have
p-values less than 0.05 in
Table 2. The results of Europe, US, and Total are also explained as in the case of China. The keywords in bold type are common to all regions; they represent the underlying technologies for smart LED systems. We considered another approach to technology analysis by the IPC codes.
Table 3 shows the result of IPC code analysis based on the top ten codes.
In this paper, NA means “not available”. We used the top ten IPC codes that occurred across all patents related to smart LED systems. This approach does not yield uniform findings across the regions; for example, there is no sample among the patents from Europe that references G08B. As in the case of keyword analysis in
Table 2, IPC codes with p-values less than 0.05 were selected and used for the technology analysis. As the case of the keywords in
Table 2, the estimate value for each IPC code also shows the influence on the entire smart LED technology. Using the results of
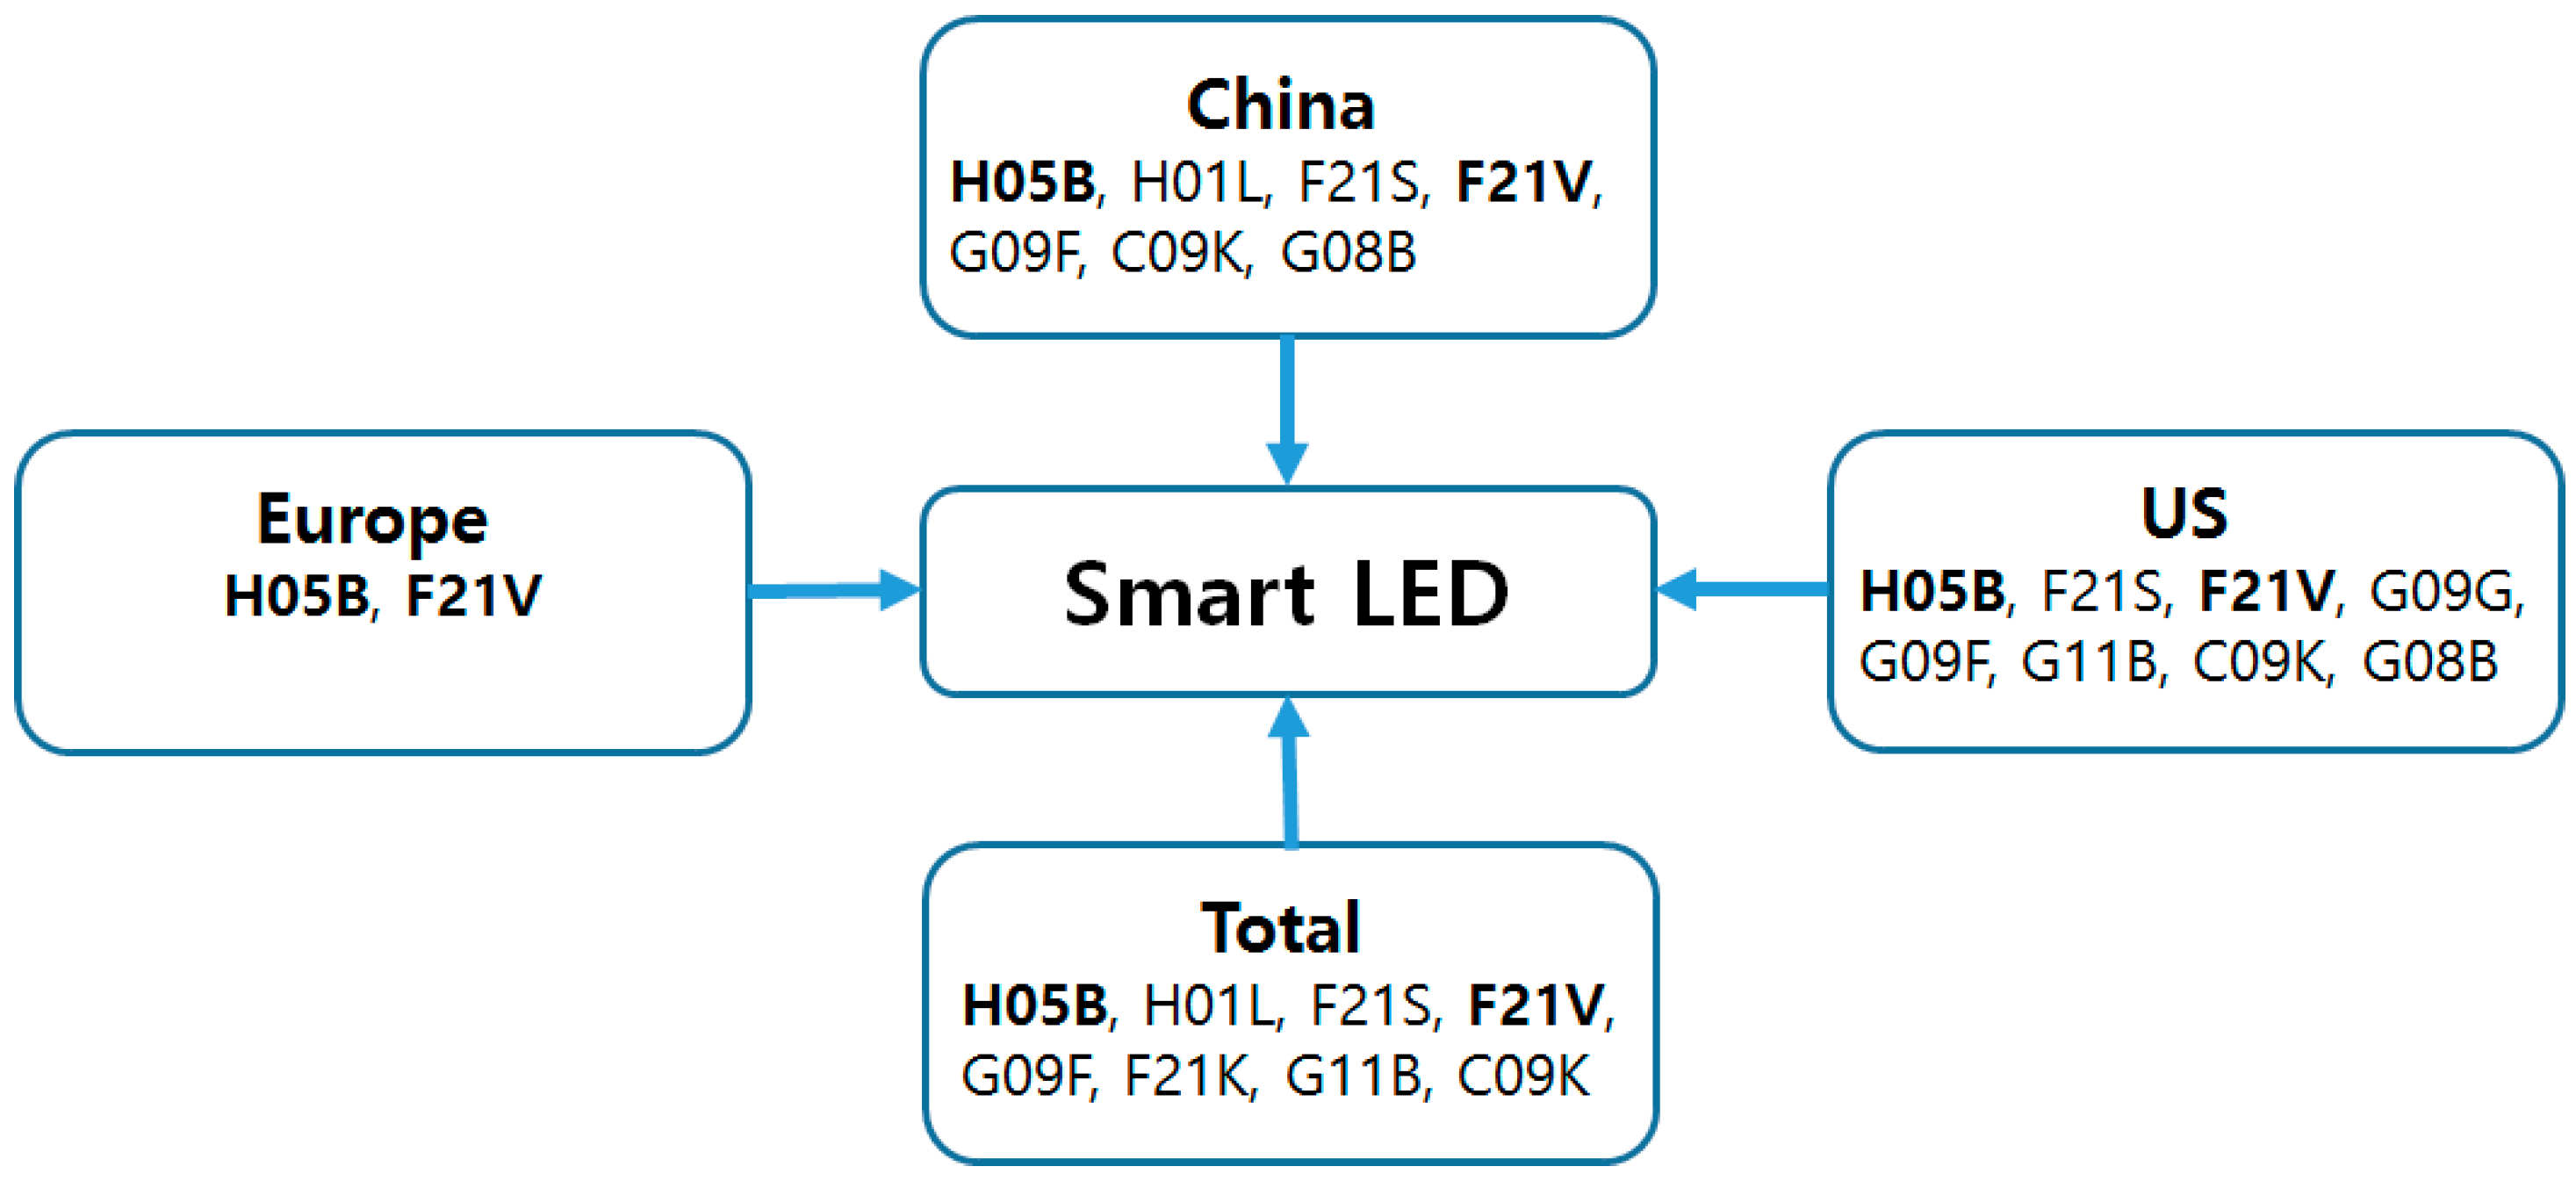
Table 3, we built the technology structure as
Figure 6.
Compared with the technology structure based on keywords, the technology structure of IPC codes has a simple form. This is because the IPC codes represent broader ranges of technology than the keywords do. As with the technology structure of keywords in
Figure 5, the common codes of technology are shown in a bold text font in the case of the IPC codes. The IPC codes H05B and F21V are common codes for the development of smart LED systems and are defined as follows [
45]:
H05B: electric heating and lighting
F21V: functional features or details of lighting devices or systems, structural combinations of lighting devices with other articles.
Thus, using the results of
Figure 4 and
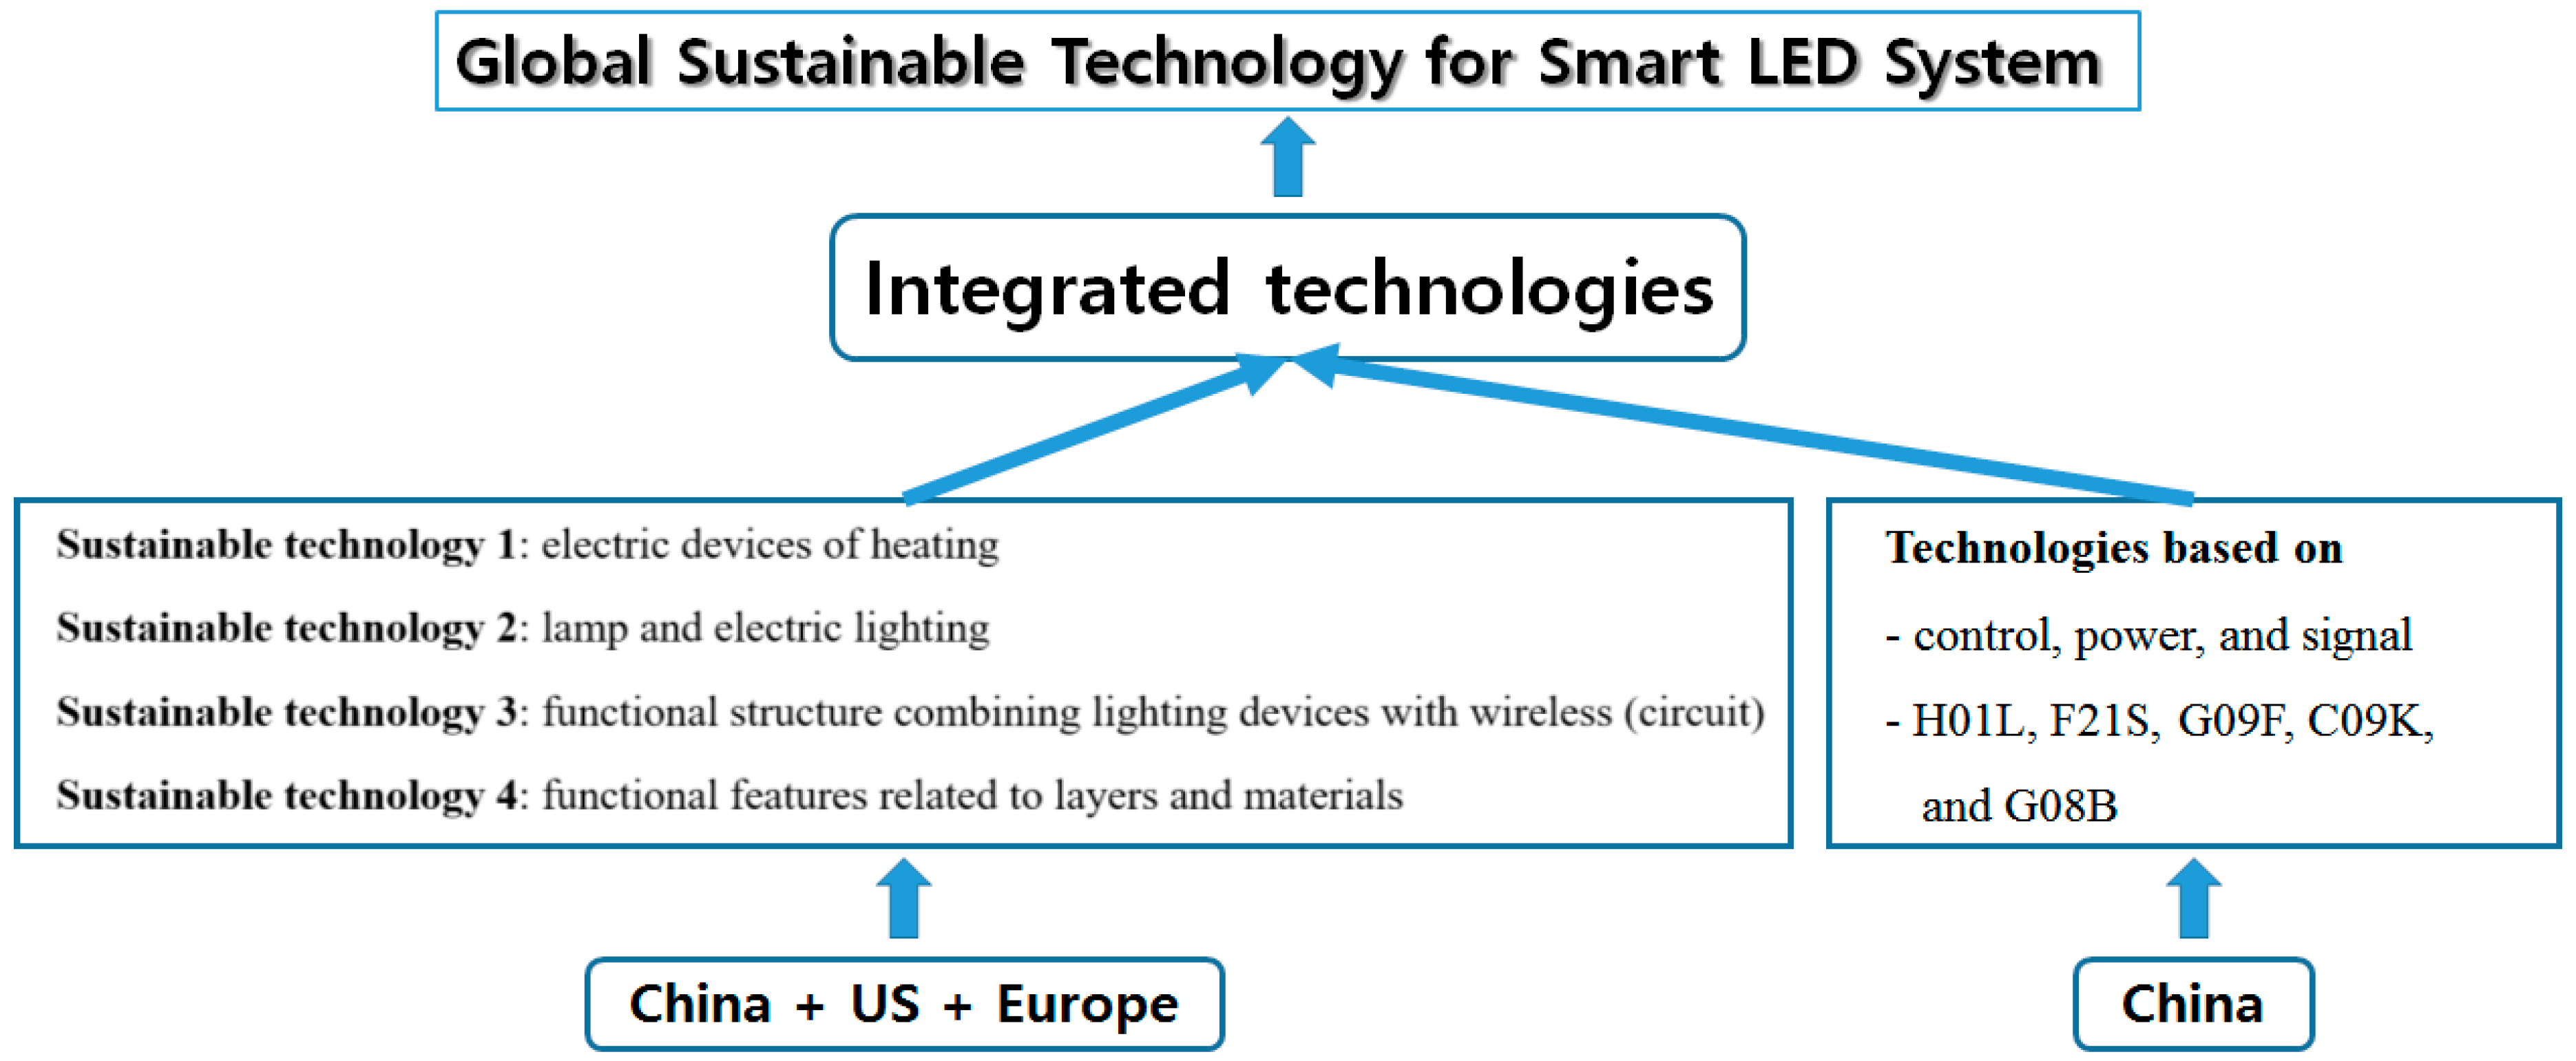
Figure 5, we found the representative technologies for the technological sustainability of smart LED systems as follows:
Sustainable technology 1: electric devices for heating
Sustainable technology 2: lamp and electric lighting
Sustainable technology 3: functional structures combining lighting devices with wireless (circuit)
Sustainable technology 4: functional features related to layers and materials
These findings suggest that smart LED companies will be able to maintain their technological sustainability through continuous research and development on the above four technologies. In addition, the results contribute to R&D planning for companies that manufacture smart LED systems. The next step is visualization, another approach to technology analysis of smart LED systems.
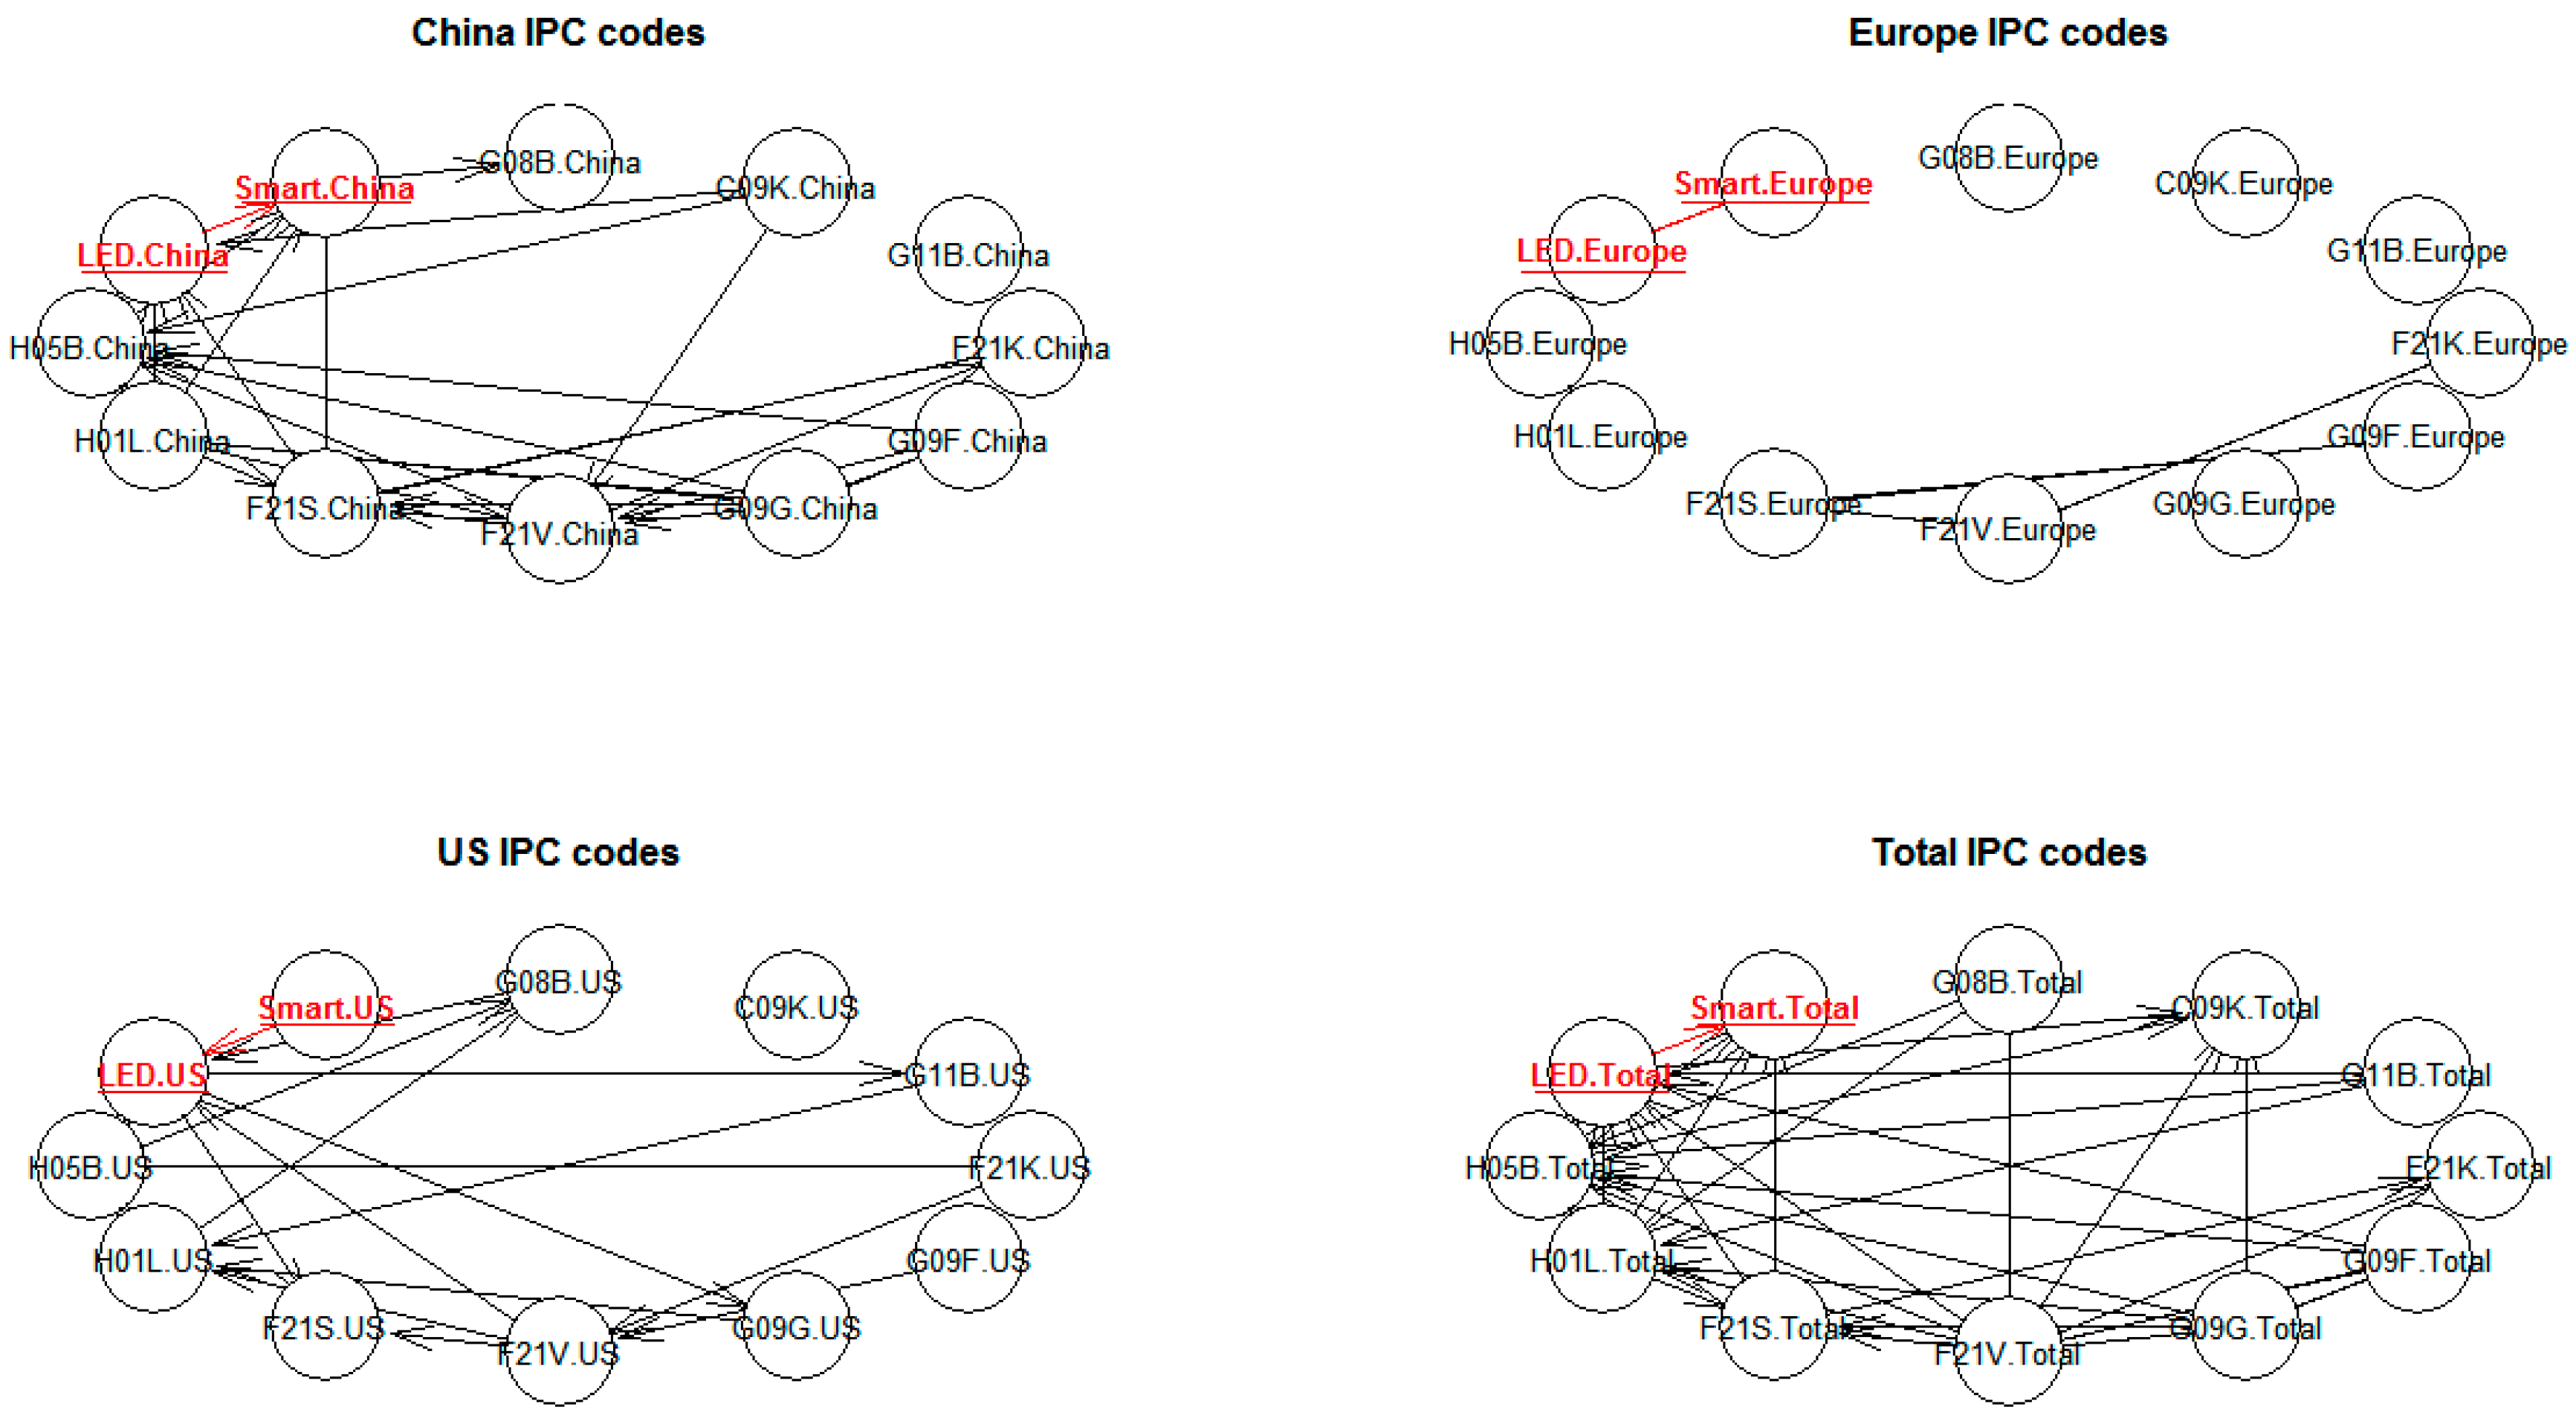
Figure 7 represents the results of visualization based on Bayesian networks according to the regions:
The higher the density of the network, the more research and development on technology becomes active. Therefore, it can be seen that smart LED technology is being actively developed in China compared with Europe or USA, because the nodes (IPC codes) in China show the most interconnections. China is clearly the most active, followed by the United States and Europe. Using the visualization results in
Figure 7, we can also find the relevance of IPC codes that directly or indirectly affect smart LED technology. For example, in China, C09K technology affects LED and H05B technologies, and LED technology affects smart technology. In addition, G11B technology is not associated with any other IPC code technology as well as smart LED technology. This is because the G11B node is not connected to any other nodes and exists alone.
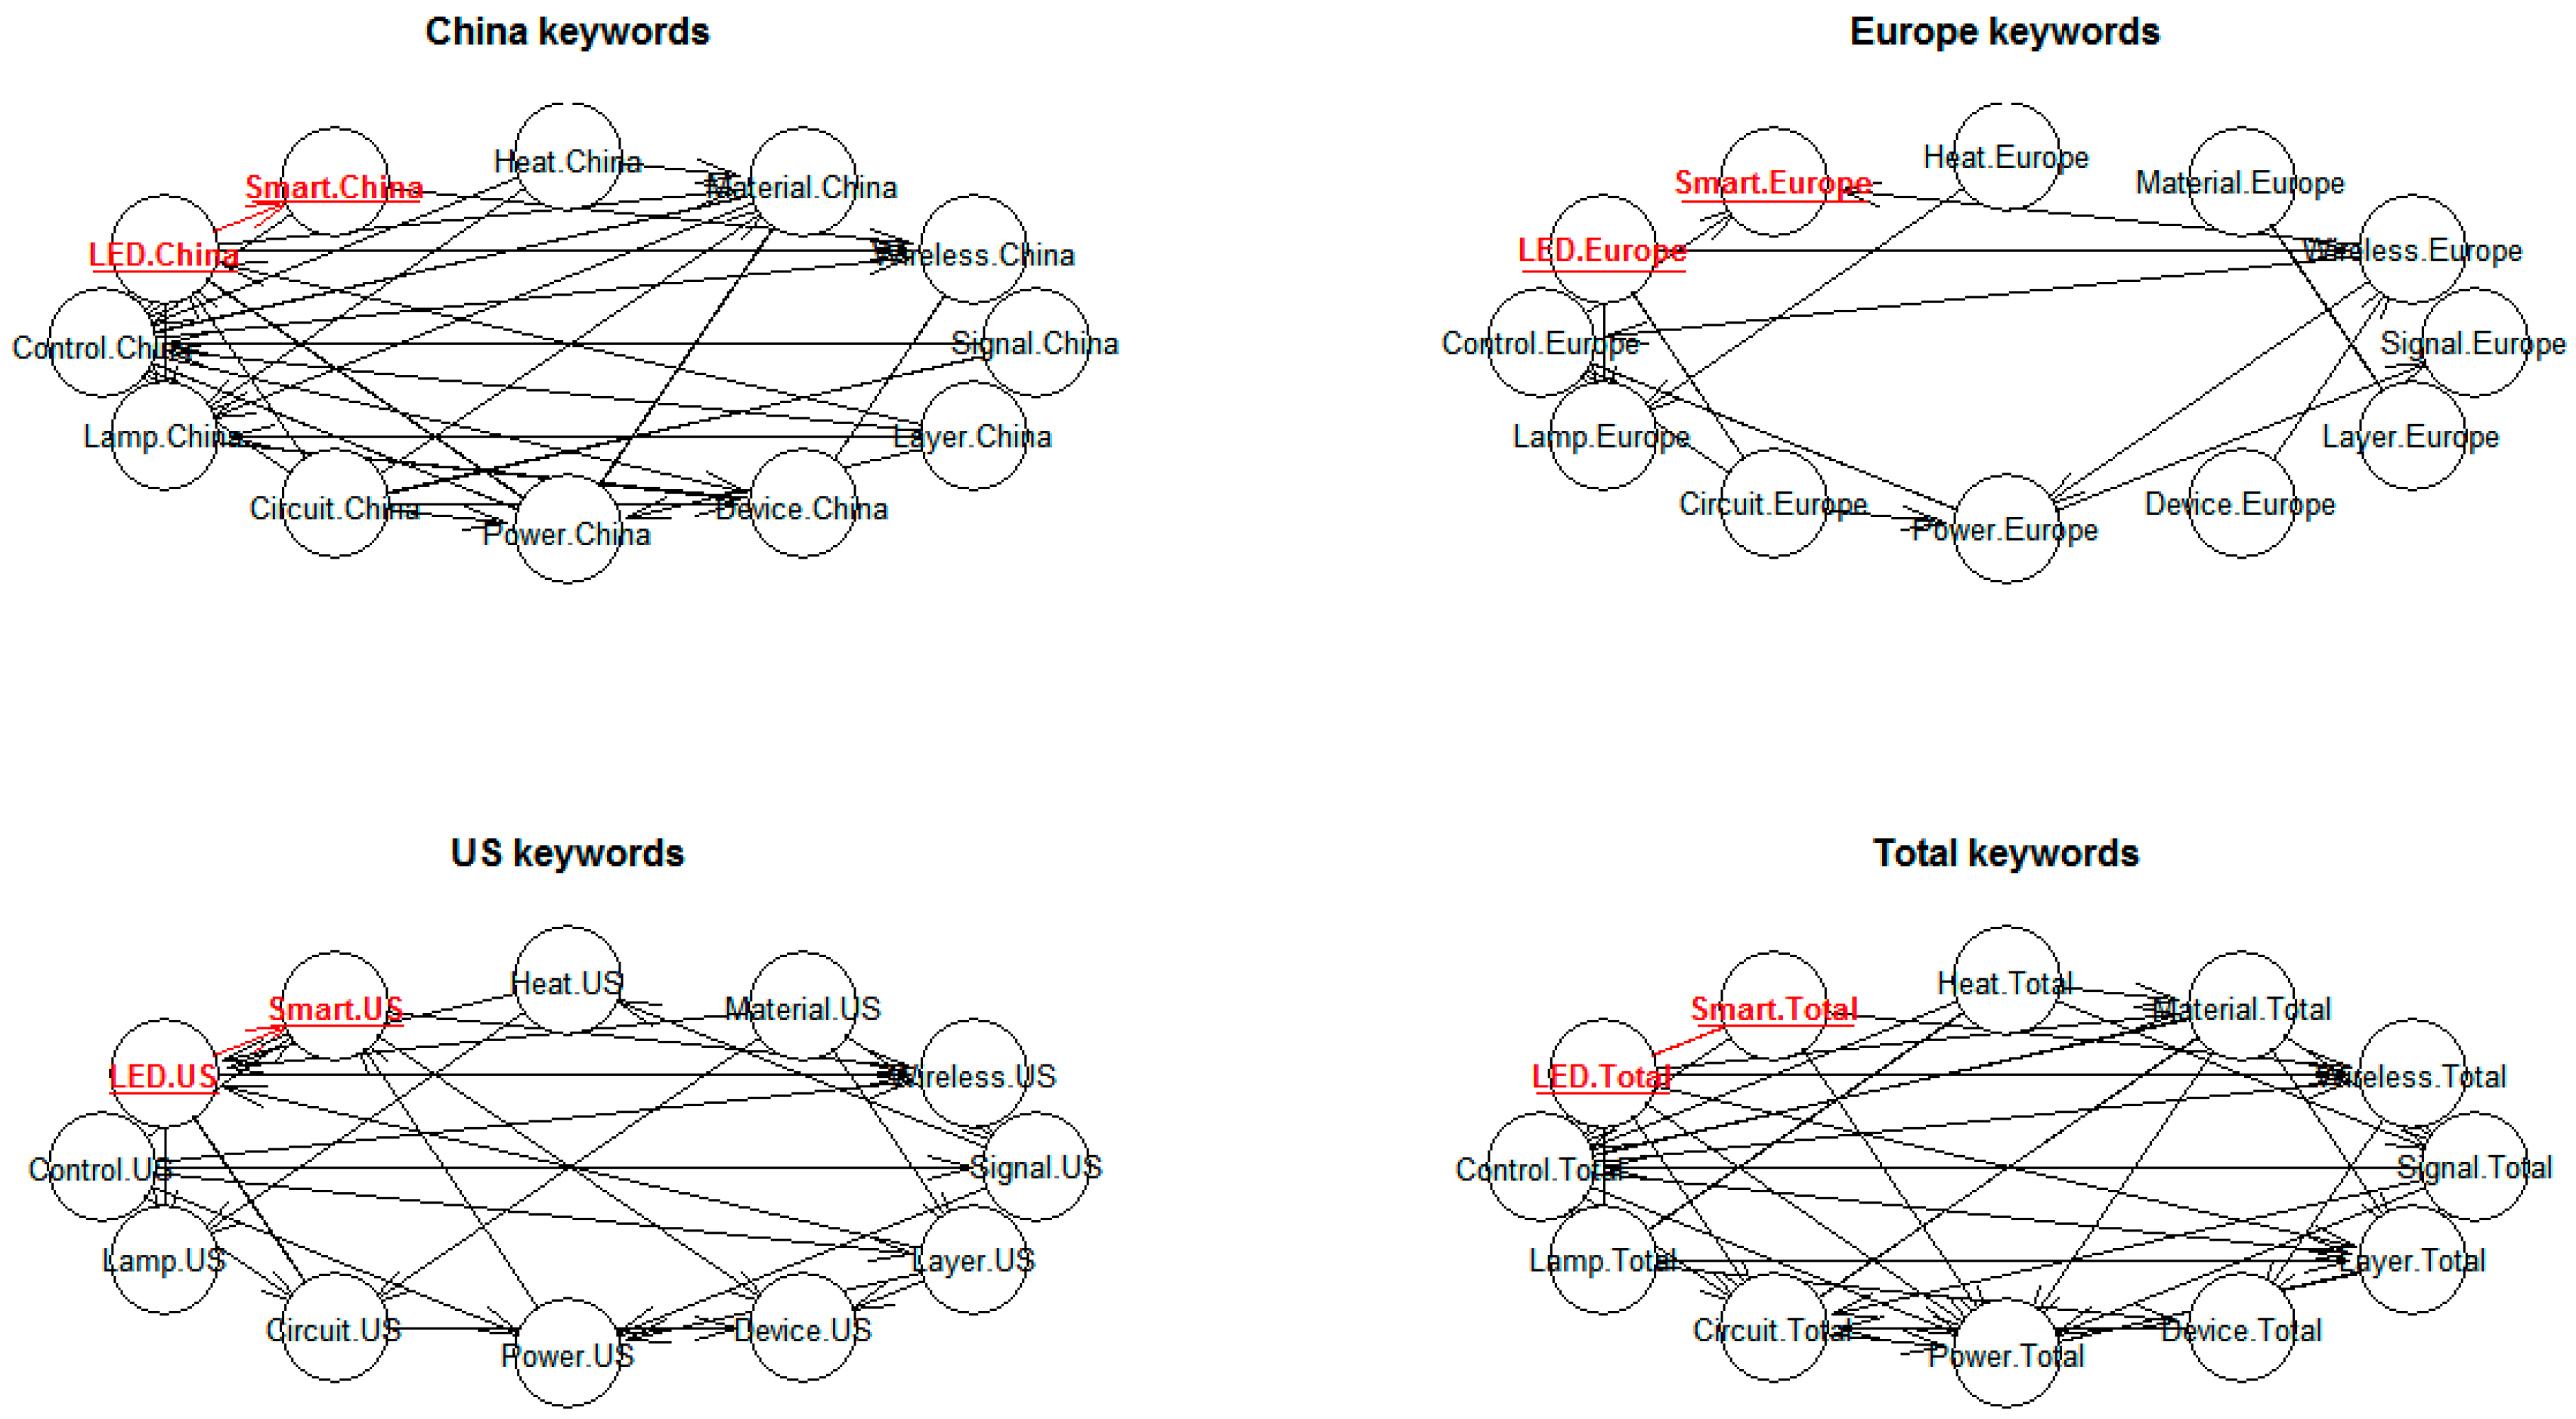
Figure 8 shows the results of visualization based on Bayesian networks based on keywords by regions.
As with the IPC code visualization results, China was the most active country in the visualization based on Bayesian networks of technology keywords. Moreover, it is possible to grasp the technology association between each keyword through the arrow connection of the visualization result. For example, in Europe, we see that technology for wireless and control directly affect smart technology. In addition, device technology indirectly influences smart technology through wireless technology. Thus, the ranking of the nations in creating sustainable smart LED technology can be determined as follows:
1st region: China
2nd region: US
3rd region: Europe
Finally, we performed conditional independence testing to establish the statistical significance of the results of visualization structures. In this paper, the tests were carried out by using keyword and IPC code as follows:
Keyword testing formula: Smart~LED|Control + Lamp + Circuit + Power + Device + Layer + Signal + Wireless + Material + Heat
IPC code testing formula: Smart~LED|H05B + H01L + F21S + F21V + G09G + G09F + F21K + G11B + C09K + G08B
Table 4 shows the test results of conditional independence of keywords and IPC codes according to region.
All of the results were statistically significant, apart from the case of keyword tests in Europe. Therefore, we confirmed that the results of the visualization based on Bayesian networks of this study are statistically significant. From the results of the count regression model and visualization based on Bayesian networks, we constructed the hierarchical technology structure for global sustainable technology in smart LED systems as
Figure 9.
Based on the four sustainable technologies extracted from the common technologies of China, US, and Europe, we have added China’s unique technologies to the global development structure of sustainable technology for smart LED systems. Thus, we integrated four sustainable technologies and the unique technologies of China to find global sustainable technologies for smart LED systems. In the field of smart LED systems, enterprises and research institutes should acquire the technologies of “electric devices of heating”, “lamp and electric lighting”, “functional structure combining lighting devices with wireless”, and “functional features related to layers and materials” for their technology sustainability. They also need to acquire Chinese technology related to “control, power, and signal” and the technologies related to the following five IPC codes [
45];
H01L—basic electric elements
F21S—non-portable lighting devices; systems
G09F—displaying, advertising, signs, labels or name-plates; seals
C09K—material for applications not otherwise provided for; applications of materials not otherwise provided for
G08B—signaling or calling systems; order telegraphs; alarm systems
Therefore, with the help from the smart LED technology experts of KISTA, we have derived the sustainable technology groups using the experimental results as follows.
Using these four technologies, companies that research and produce smart LED systems will be able to keep their global sustainability in the market. In addition, the KISTA expert group also confirmed the possibility of realizing this conclusion.
5. Conclusions
In this paper, we proposed a methodology based on statistical modeling for the technology analysis of smart LED systems. We considered a count regression model and visualization based on Bayesian networks. First, we collected patent documents related to smart LED systems and transformed them into a structured data matrix consisting of patent keywords and IPC codes. Each element of the matrix is the occurrence frequency of a keyword or IPC code in a patent document. To analyze the frequency value (count data), Poisson count data analysis was used, since the Poisson probability distribution is apt for count data. In addition, visualization networks of keywords and IPC codes was created, using Bayesian networks. From the results of the count data modeling, we identified the sustainable technologies for smart LED systems. The most active nation was also identified by using the results of visualization based on Bayesian networks. Furthermore, combining the results of count data modeling and visualization based on Bayesian networks, we showed the global sustainable technologies for smart LED networks. In other words, the smart LED technology maintains its technological sustainability based on the four sustainable technologies presented in this paper, obtained by adding China’s unique smart LED technologies.
The proposed method can be applied not only to smart LEDs, but to various other technical fields. This paper makes an important contribution toward identifying sustainable technology and the country with the most active research and development in the target technology field. In our future work, we will study various more advanced models, such as the Bayesian artificial intelligence approach, to undertake technology analysis in diverse fields.


