Planning Resilient and Sustainable Cities: Identifying and Targeting Social Vulnerability to Climate Change

1
State Key Laboratory of Pollution Control & Resource Reuse, School of the Environment, Nanjing University, Nanjing 210093, China
2
School of Transportation, Southeast University, Nanjing 210018, China
3
School of Chemistry and Life Science, Jinling College, Nanjing University, Nanjing 210093, China
*
Author to whom correspondence should be addressed.
Sustainability 2017, 9(8), 1394; https://doi.org/10.3390/su9081394
Submission received: 22 June 2017
/
Revised: 1 August 2017
/
Accepted: 3 August 2017
/
Published: 7 August 2017
Abstract
:This research offers a new framework for assessing social vulnerability to climate change. A social vulnerability assessment trial was carried out for Chinese coastal cities at the county level. First, the 10 factors having the most influence on social vulnerability were identified. They are “House with no lavatory”, “House with no bath facilities”, “Employees in primary industry”, “Houses with no tap water”, “GDP in primary sector”, “Children”, “House with no kitchen”, “Rate of natural increase (RNI), “Employees in management sector”, and “Highly educated”. Second, indexes of social vulnerability, exposure, sensitivity, and adaptability were evaluated and mapped to examine their spatial pattern. The results demonstrate that the distribution of exposure index (EI) is similar to that of social vulnerability index (SVI): many counties are categorized at the medium level while a few counties belong to the high or low categories. The distribution of adaptability proves that it should be paid more attention, as 30.14% of its counties belong to the lowest level. After calculating the Getis-Ord Gi* statistic of SVI, two cold spots and two hot spots are identified. Third, the relationship between urban development and social vulnerability are discussed. During urbanization, there are evident differences of SVI between urban and rural areas. Urbanization can help city districts reduce social vulnerability, while creating more social vulnerability in the coastal counties. For the districts, more adjustment strategies and work should be applied in the dimension of exposure during urbanization. For the counties, the prominent problem to be faced is an increase in sensitivity.
1. Introduction
Climate change is likely to bring higher temperatures, a rising sea level, melting glaciers, more intense rainstorms, flooding, droughts, and heat waves [1,2,3,4,5], which all pose threats to urban infrastructures and more specific needs for urban planning and emergency management [1,6]. For responding to the unavoidable adverse impacts of climate change, cities should pursue adaptation methods to create a more resilient world where future shocks and stresses can be absorbed to maintain essentially the same functions, structures, systems, and identity [7]. In light of this, vulnerability has become one of the central elements of sustainability research [8]. Understanding, measuring, and reducing vulnerability has been an important task in the transition to a more sustainable world [9]. China is vulnerable to the adverse impacts of climate change, even though it is one of the main emitters of greenhouse gases. In recent years, China has experienced an increasing frequency and intensity of extreme weather events. These extreme weather events have caused direct economic losses of 25 to 37.5 billion USD per year [10]. According to the Climate Change Vulnerability Index (CCVI) released by global risk analytics company Maplecroft in 2015, most parts of China fall into the “high risk” category, such as the coastal regions. Due to the flat and low landscape, these areas are extremely vulnerable to typhoons, storms, floods, and the rising sea level. As the engine of the whole country’s economic achievement, the booming coastal cities are becoming increasingly vulnerable due to high population densities and environmental degradation, combined with a lack of experience on how to balance the necessary adaptation needs for climate change with the increasing growth and development of the cities [11]. Developing the ability to measure the social vulnerability of such high-risk regions may help them buffer against climate risk and plan a sustainable future.
Hence, focusing on the heavily urbanized cities on the Chinese east coast, this paper aims to establish a social vulnerability index (SVI) at the county level with a composite index in the context of climate change. With this index, we examine the spatial pattern of SVI and target the hotspots of vulnerability. Then, by exploring the profile of social vulnerability at the city level and differences in SVI between urban and rural regions, we discuss the interaction between urbanization and climate change vulnerability.
1.1. Vulnerability Concepts
The professional use of the term “vulnerability” originated from geography and natural hazards research, and to date, it has been extended to various fields including environmental degradation, sustainability science, climate change, and so on [12,13]. Between 1967 and 2005, there have been 939 scientific articles related to research on vulnerability concerned with climate change [14]. In 1990, Liverman pointed out that the concept of vulnerability “has been related or equated to concepts such as resilience, marginality, susceptibility, adaptability, fragility, and risk” [15]. Later, the Intergovernmental Panel on Climate Change (IPCC) defined vulnerability in the climate change field as “the degree to which a system is susceptible to, or unable to cope with, adverse effects of climate change, including climate variability and extremes” [16]. With the extension of the research on vulnerability to climate change, traditional topics of natural ecosystems have continued to receive significant attention [17,18,19,20,21,22,23,24,25,26,27,28]. However, the themes on vulnerability to climate change have expanded to other new social topics such as livelihood [29,30,31,32,33], poverty [34,35], and development [36,37,38]. Such development in social topics related to climate change research has led to an agreement that the idea of vulnerability should be considered as a multidimensional problem which includes economic, political, and social structures, as well as environmental factors [9,39]. As such, vulnerability to climate change can be classified into biophysical vulnerability, social vulnerability, or an integrated vulnerability [40].
Social vulnerability indicates the inability of people, organizations, and society to withstand adverse impacts from multiple stressors (see Luis Flores Ballesteros, “What determines a disaster?” 54 Pesos Sep 2008: 54 Pesos 11 September 2008. Available http://54pesos.org/2008/09/11/what-determines-a-disaster/, 2008, unavailable now). In addition to affecting the way a society prepares for, experiences, and recovers from these stressors, social vulnerability is more like a pre-existing condition and an inherent state [41]. It relates to the various differences stemming from the socioeconomic status of people, demographic traits, social networks, access to resources, basic infrastructure, and political power [13,42]. In essence, social vulnerability is regarded as the product of social stratification, social inequalities among different groups of people, and different environmental locations [43].
1.2. Conceptual Frameworks and Methods
Several different conceptual frameworks have been proposed to explain and evaluate social vulnerability. The Pressure and Release (PAR) model takes disaster as the intersection between socioeconomic pressure and physical exposure [44]. However, it does not address the role of biophysical subsystems in shaping differential vulnerability. Furthermore, it tends to underemphasize feedback beyond the system of analysis [8]. The hazards of place (HOP) model proposes the idea of “place” to bridge the gap between biophysical vulnerability and social vulnerability [45]. Though it also provides a spatial perspective to help understand the dynamic nature of vulnerability, the concept of spatial scale is commonly implicit and is not formally incorporated into the model. The Vulnerability Framework for Sustainability Science (VFSS) model bridges the risk hazards, the political economy, and the political ecology traditions as different ways of conceptualizing vulnerability [8]. In this model, vulnerability emerges in a specific place, but is affected by human and environmental systems at regional and global levels [46]. For linking vulnerability analysis to sustainability science, the idea of “resilience” is explicitly embedded within this model.
Under these frameworks, a variety of methods have been developed to measure social vulnerability, such as the integrated assessment model [47] and household surveys [48,49,50]. In the 1990s, a new methodology was explored to estimate the social vulnerability index as a composition of related indicators [51]. Currently, this methodology has become prominent in social vulnerability research [52], and various approaches have been applied in indicator aggregation. The equal weighing (EW) approach, which gives all variables the same weight, is applied to aggregate indicators [53]. The statistical model of principal components analysis (PCA), which groups all variables according to their degree of correlation, was first used by Cutter in social vulnerability assessments and has become one of the classic models for evaluating social vulnerability in the fields of natural hazards and climate change [54,55,56,57,58,59,60,61]. Analytical hierarchy process (AHP), as a multi-criteria decision-making approach, is another method suitable for assessing social vulnerability to climate change [62,63,64,65,66]. With the data envelopment analysis method (DEA), Huang et al. explored multidimensional flood vulnerability [67]. Ge applied the projection pursuit cluster (PPC) method to quantify the social vulnerability of the Yangtze River Delta in China [13,52].
1.3. Research in China
In China, research on vulnerability to climate change began to emerge in the 1990s, and most of it studied the potential impact of climate change on agriculture, forest, water resources, and other natural ecosystems [68]. For example, Cai (1996) analyzed the vulnerability of agricultural systems to climate change [69]. Li (1996) introduced the concept of vulnerability to climate change and evaluated the distribution of forest vulnerability in China [70]. Lin (1994) identified six sensitive agricultural areas as well as five regions with high vulnerability to climate warming based on agriculture in China [71]. Since 2000, most studies on vulnerability to climate change have expanded to social fields. Themes such as livelihood, poverty, and agriculture were conducted in the less developed areas of North and Northwest China. Tan and Wang (2012) examined the vulnerability of rural livelihoods to climate change in the Yutian County of the Xinjiang Uyghur Autonomous Region [72]. Based on a social survey, Hu (2012) compared vulnerability and adaptability among rural households in the context of climate change in the Ningxia Hui Autonomous Region [50]. Tan et al. (2016) analyzed social vulnerability of herders to climate change in Inner Mongolia [73]. Zhang et al. (2016) analyzed the impacts of climate change on farmers’ livelihood vulnerability in Gannan Plateau with the multivariable linear regression model [49]. The eastern coastal area in China is a hotspot for studying the vulnerability of water resources and climate-related hazards. Yu and Pan (2012) analyzed the characteristics of vulnerability to climate change and related hazards, with a case study in Zhejiang Province [74]. Qiu et al. (2014) evaluated the vulnerability of estuarine and coastal areas in Shanghai under sea level rise and storm surge disaster scenarios [75]. Xia et al. (2015) measured the vulnerability of water resources in the eastern monsoon region of China [19]. In a word, the research conducted in China either focuses on the vulnerability of rural livelihoods or emphasizes biophysical vulnerability. Few of these studies have discussed the differences between urban and rural regions in terms of SVI, or explored the relationship between social vulnerability and urbanization.
This paper begins with a literature review in social vulnerability to climate change in section one. Section two proposes a modified social vulnerability framework based on the hazards of place (HOP) model in order to capture rural and urban differences. Then, a method of aggregating indicators with the projection pursuit cluster (PPC) model is used to evaluate the social vulnerability of coastline cities in China. Section three presents the study results, and section four gives conclusions and recommendations for social vulnerability reduction during urban development.
2. Materials and Methods
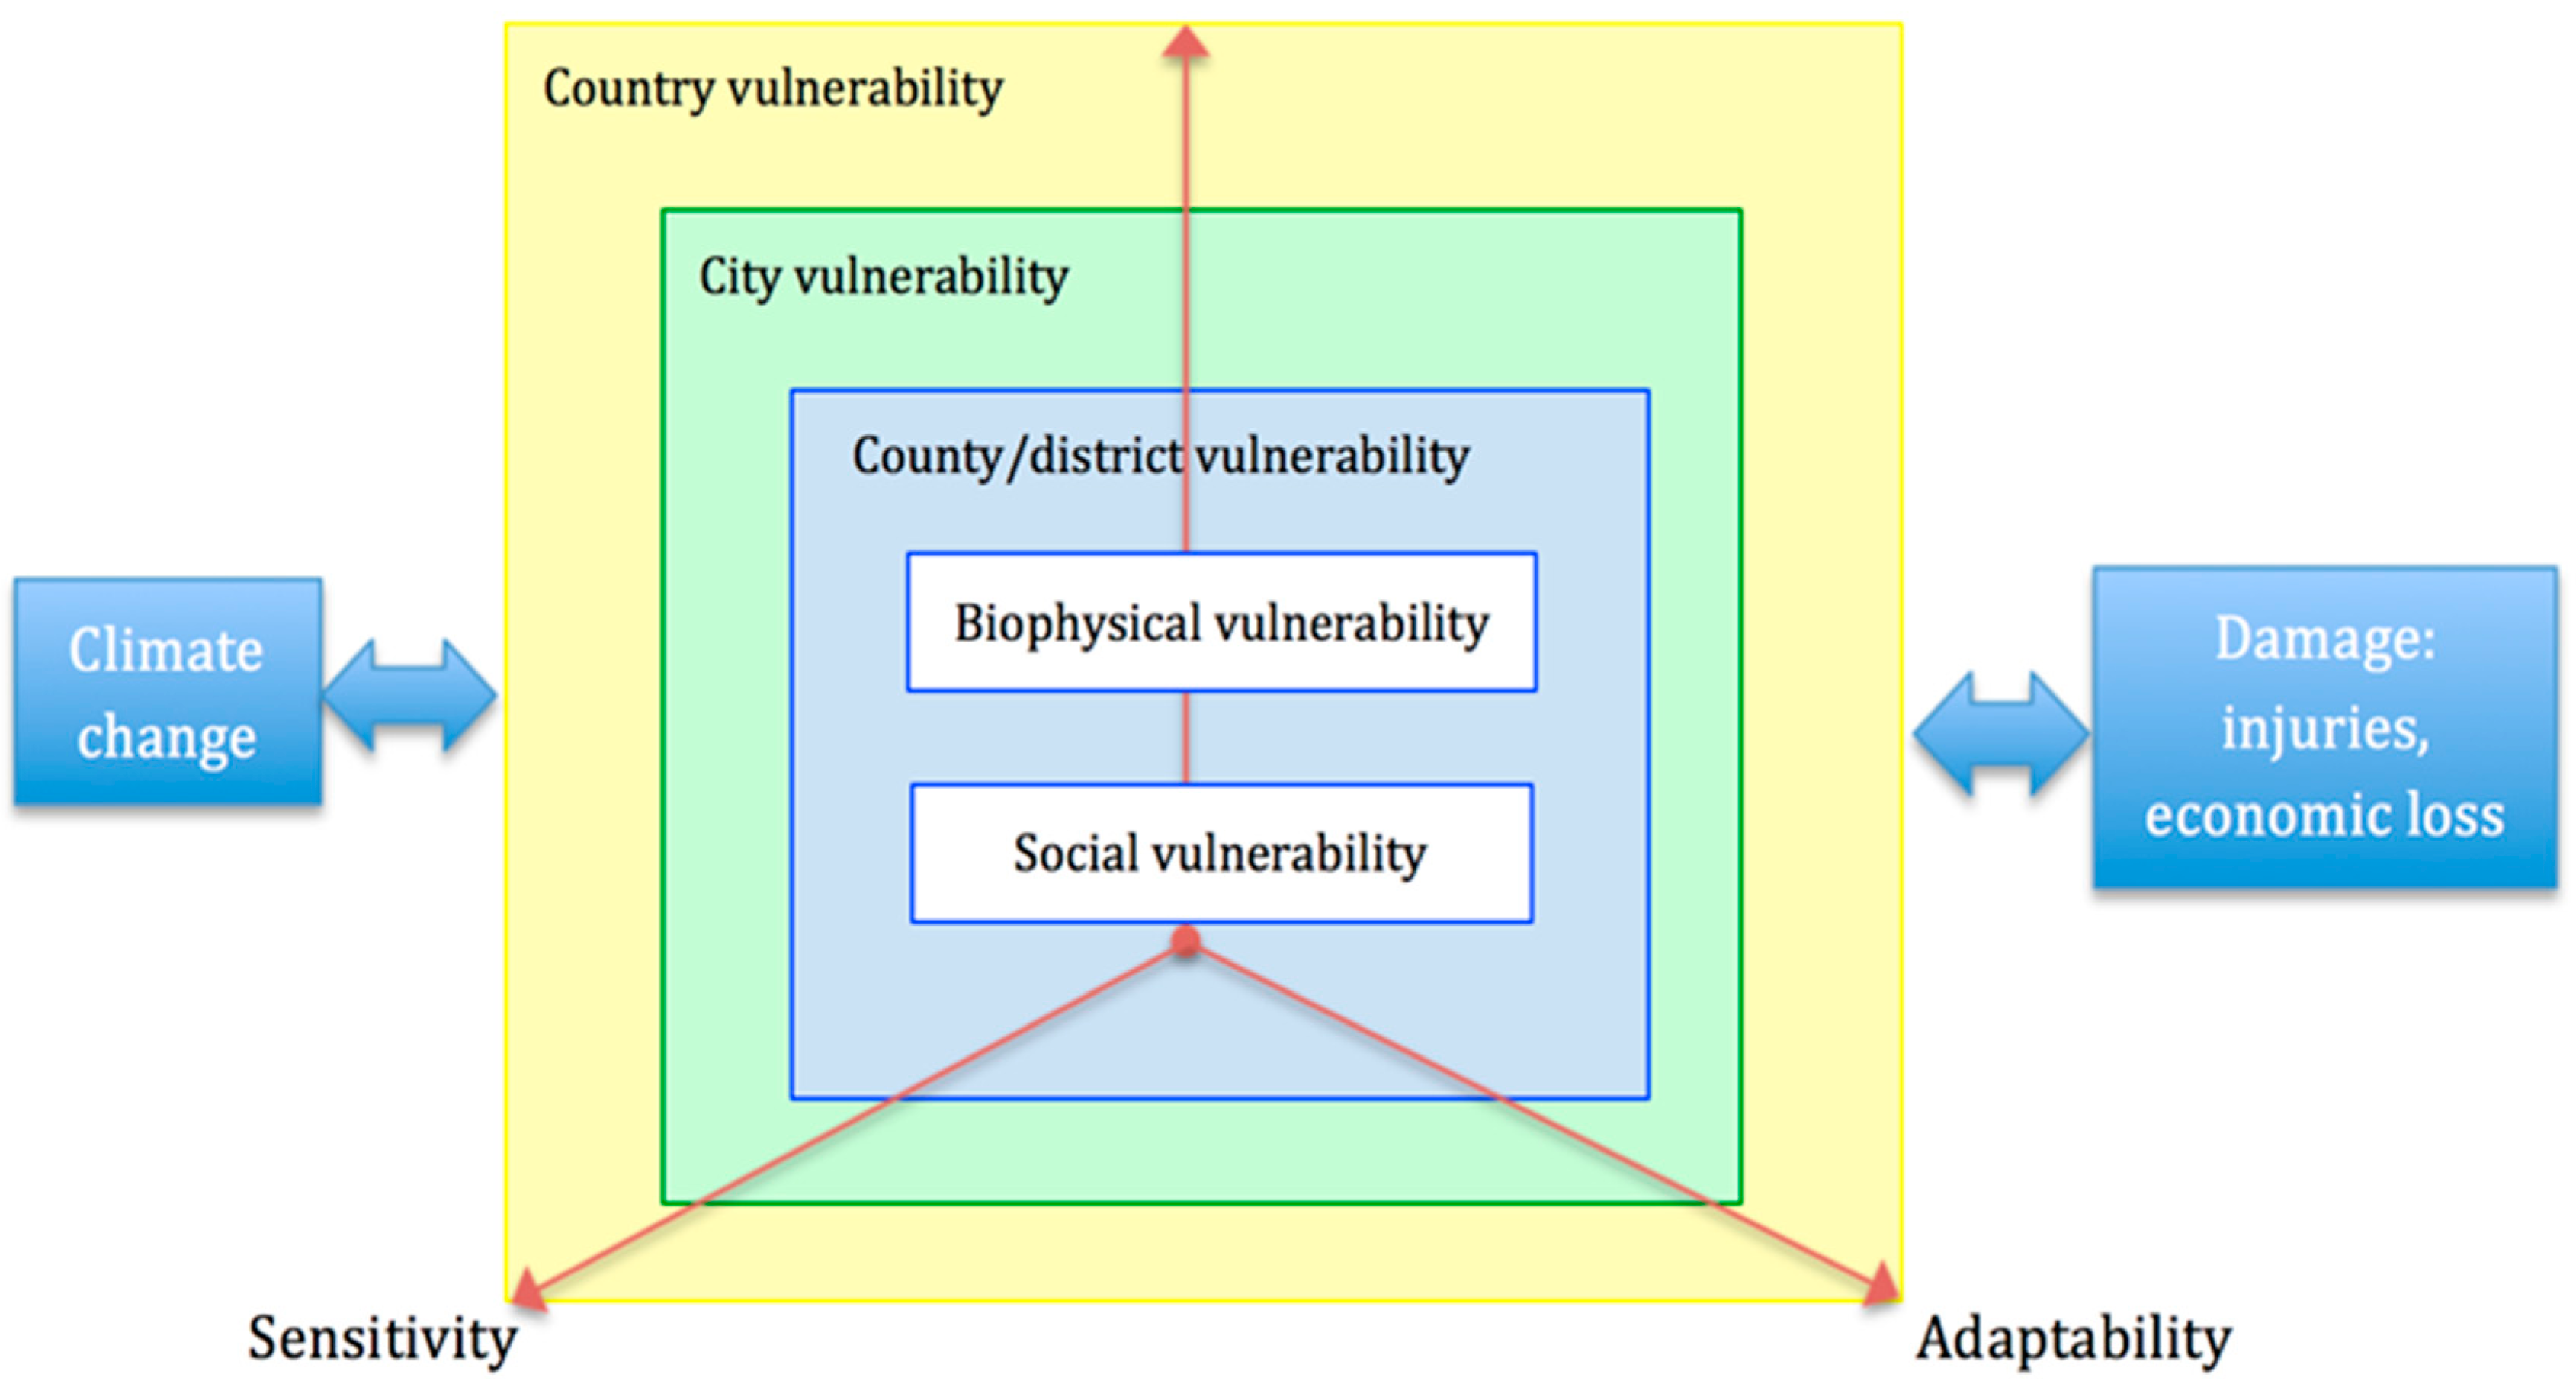
According to academic literature on vulnerability to climate change at multiple spatial scales [76,77,78,79], we developed a new conceptual framework for the social vulnerability assessment of coastal cities based on the hazards of place (HOP) model [45] (Figure 1). The concept of spatial scale is formally incorporated into the model and the idea of “adaptability” is substituted for “resilience” in order to link vulnerability analysis to climate change. In detail, climate change takes place on multiple scales: international, regional, national, and sub-national (e.g., city, county, or town), and climate threats transfer across these scales. Meanwhile, all adaptation and mitigation responses to climate change also function and interact on many scales. During transfers and interactions between these areas, all environmental, economic, and social factors influencing the vulnerability of a location on different scales will change and exhibit themselves in three dimensions: exposure, sensitivity, and adaptability. The process is complex and dynamic. After such transfers and interactions, vulnerability of different locations on different scales will be converted into damage, such as through injuries and economic losses. Damage, in turn, can affect the attributes of a place and moderate or enhance vulnerability to climate change. In this conceptual framework, vulnerability of place includes social vulnerability and biophysical vulnerability. In our study, we only discuss social vulnerability.
Under this framework, social vulnerability is regarded as a pre-existing ability of regions that spans multiple scales (e.g., county, city, or country) to withstand adverse impacts from the climate change to which they are exposed. Those socioeconomic and demographic features related to social vulnerability can be classified into three core categories: exposure, sensitivity, and adaptability. Exposure describes “the nature and degree to which a system is exposed to significant climatic variations” and it originates from a biophysical or social system [39]. In our study, we adopt the point of view that the term exposure goes beyond spatial exposure; it also involves social and institutional features which will increase the defenselessness of humans or assets and result in greater damage [9]. To avoid confusion with the exposure of biophysical vulnerability, this exposure can be called “latent exposure”. Sensitivity reflects the degree to which a system is affected by climate-related threats [6]. It is characterized by pre-existing inequalities within a region. Our work focuses on the inequalities in health, economy, and other social features between different groups that will increase their inequalities of access to useful resources and necessary services that help withstand climate hazards. Adaptability is defined as the system’s ability to respond, adjust, and cope with the adverse consequences of climate change in terms of behavior, resources, and technology [6,80]. In this paper, we only focus on regional socioeconomic status and medical services.
2.1. Selection of Indicators
Following our conceptual framework, major indicators shaping social vulnerability to climate change were identified in three dimensions: exposure (Noted as “latent exposure” above, but we abbreviate “latent exposure” to “exposure” in the following section), sensitivity, and adaptability.
In terms of exposure in our work, three kinds of factors associated with latent exposure were considered: population, economy, and housing. Regions experiencing rapid growth often lack available environmental resources and social services networks [52]. High population density also complicates evacuation and sheltering management [81]. In addition, employees in primary industries are similar to rural residents; they are more exposed to climate hazards and are expected to be affected severely due to lower incomes and greater dependence on locally based resource extraction economies (e.g., farming, fishing) [45]. Therefore, the indicators of “Population density”, “Rate of natural increase”, and “Employees in primary industry” were selected for “population exposure”.
High economic density and a high proportion of primary industry mean more potential losses or longer-term recovery after experiencing a climate-related event [45]. Hence, the indicators of “GDP in primary sector”, and “GDP density” were included in “economic exposure”. People living in poor housing conditions, for example, lacking sufficient living space or access to safe drinking water and sanitation, are more vulnerable to climate variability and change [82]. Thus, the indicators of “Houses with no bath facilities”, “Houses with no lavatory”, “Houses with no tap water”, and “Houses with no kitchen” were selected for the last factor, “house exposure”. All indicators related to exposure are shown in Table 1.
In terms of sensitivity, children and the elderly are the most vulnerable groups in a society. Children are more susceptible to climate change for their physiologic immaturity and developmental changes, while the elderly are more susceptible to disease and disability, which increases the burden on family members [45,83,84]. So, families with many dependents or single parent households often have limited finances and resources, which also reduces evacuation ability and adaptability to climate change and related hazards [45,83]. As caregivers, women may have a more difficult time and face more challenges during recovery due to their responsibilities and pressures [44,45]. Low-income individuals, such as the illiterate, unemployed, and renters, are more likely to be exposed to hazardous environmental changes and take fewer actions to protect themselves against climate change [85]. Moreover, compared to local residents, newcomers and ethnic minorities are more vulnerable to climate change given their limited ability to find or understand warning information, which is due to language and cultural barriers [45,83]. All indicators relating to sensitivity are listed in Table 1.
For adaptability, the indicators of “Higher education graduate” and “Educated year” were selected, because people with higher education usually have better employment prospects, better economic conditions, and more resources to take precaution against climate hazards [45,81,84]. Individual economic status implies having available resources to absorb, reduce, and recover from losses [84,86]. Herein, the indicator of “GDP per capita” was chosen as a substitute for “Per capita income”. Adequate healthcare infrastructures and management services can also help improve regional resilience and alleviate direct losses [86]. Hence, the indicators of “Beds in hospital per 1000 people”, “Physicians in hospital per 1000 people”, and “Employees in management sector” were selected.
The 28 indicators for all 407 coastal counties were collected from the 2010 China Civil Affairs Statistical Yearbook, the 2010 statistical yearbooks of each city published by the cities’ Statistical Bureaus, and the sixth national population census in 2010. Table 1 lists the datasets in detail. With these indicators, a composite score of social vulnerability can be evaluated. Because of a high correlation with other indicators, the indicators such as “Household size”, “Immigration from other provinces”, “Educated year”, and “Urban residents” were removed after correlation analysis. Ultimately, 24 indicators were selected for evaluating SVI in relation to climate change. Then the selected indicators were aggregated to construct an SVI for each county after they were properly normalized.
2.2. Case Study: The Coastal Region in China
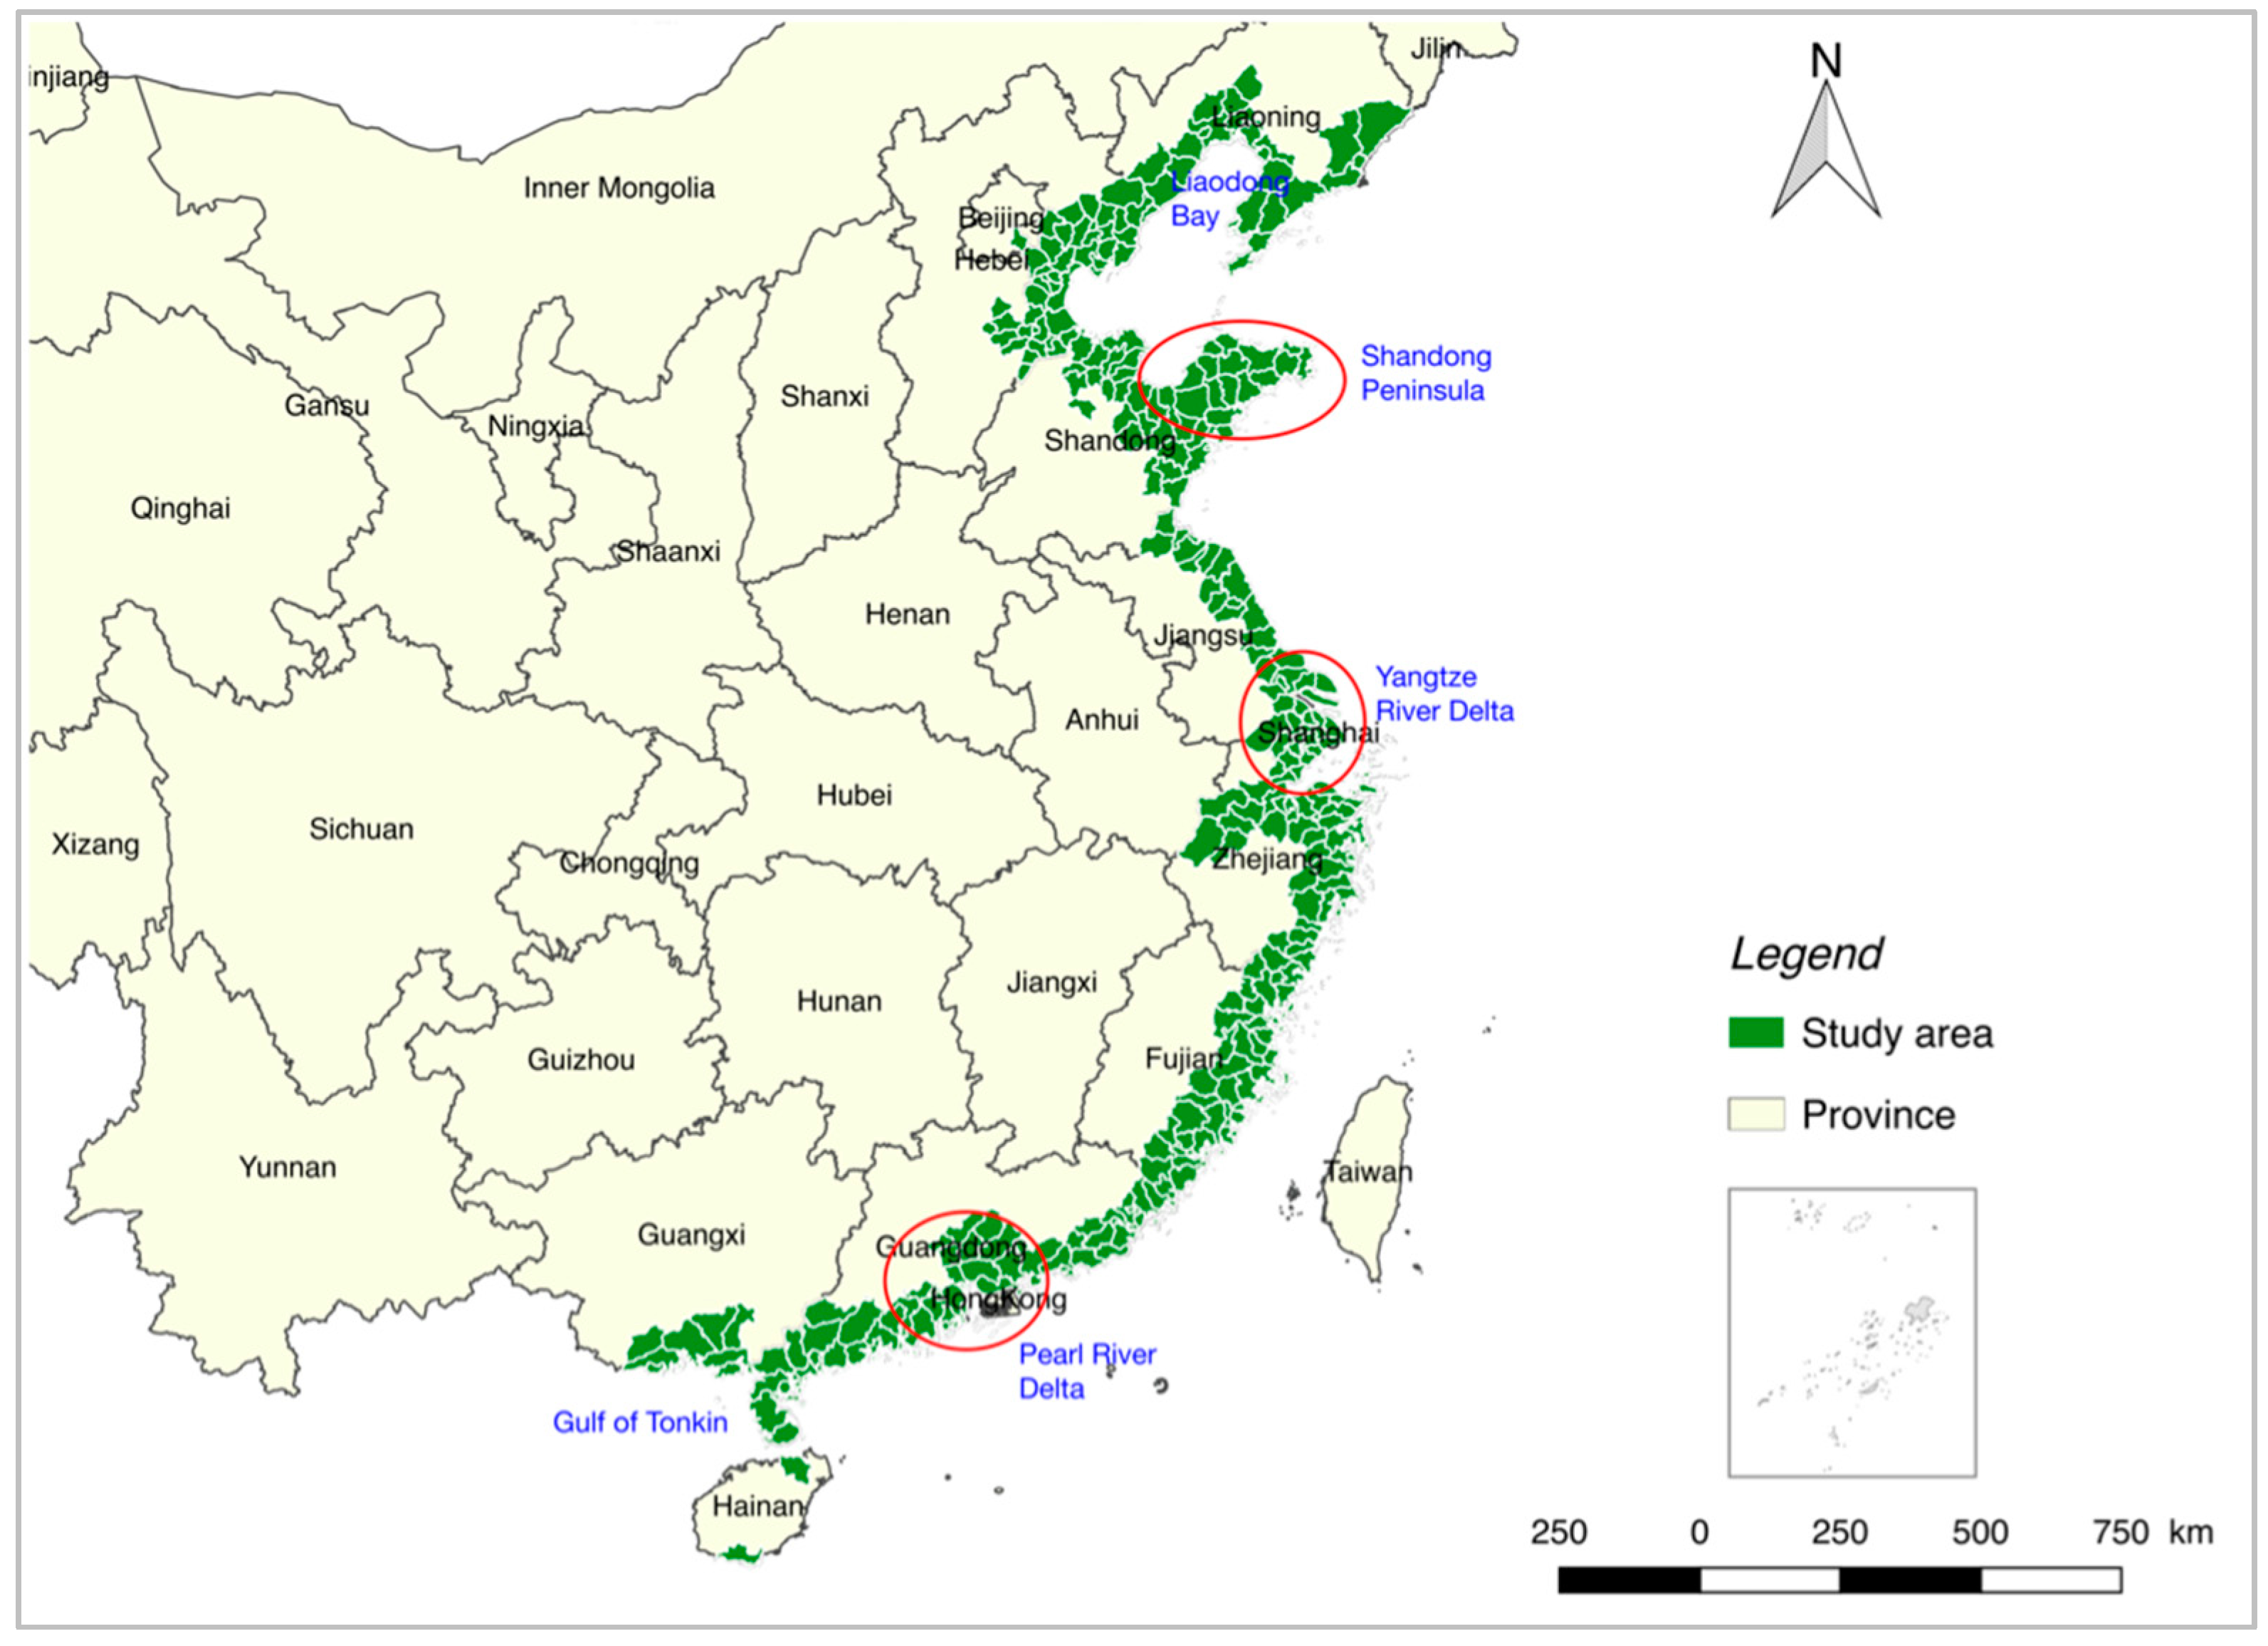
With a geographical extent from 108°20′59′′ E to 124°20′56′′ E, and from 18°15′16′′ N to 39°59′56′′ N, mainland China has a coastline of over 18,000 km from the Liaodong Bay in the north to the Gulf of Tonkin in the south [87] (Figure 2). In this coastal zone, there are 54 cities located in 11 provinces covering three climate zones: temperate, sub-tropical, and tropical. Six cities lie in Liaoning Province: Dandong, Dalian, Yingkou, Panjin, Jinzhou, and Huludao. Three cities are in Hebei Province: Qinghuangdao, Tangshan, and Cangzhou. Seven cities belong to Shandong Province: Binzhou, Dongying, Weifang, Yantai, Weihai, Qindao, and Rizhao. Four cities are in Jiangsu Province: Lianyungang, Yancheng, Nantong, and Suzhou. Seven cities lie in Zhejiang Province: Jiaxing, Hangzhou, Shaoxing, Ningbo, Taizhou, Wenzhou, and Zhoushan. Six cities are in Fujian Province: Ningde, Fuzhou, Putian, Quanzhou, Xiamen, and Zhangzhou. Fourteen cities belong to Guangdong Province: Chaozhou, Shantou, Jieyang, Shanwei, Huizhou, Shenzhen, Dongguan, Guangzhou, Zhongshan, Zhuhai, Jiangmen, Yangjiang, Maoming, and Zhanjiang. Three cities lie in Guangxi Province: Beihai, Qinzhou, and Fangchenggang. Two cities belong to Hainan Province: Haikou and Sanya. There are also two provincial-level municipalities: Tianjin and Shanghai. These 54 cities govern 407 county-level divisions containing counties, county-level cities, and city districts (Note that counties, county-level cities, and city districts are all in the third level of the Chinese administrative hierarchy. Counties and county-level cities govern towns and rural townships; city districts are the condensed central part of cities, both highly urbanized and populous). The coastal region covers only about 4.0% of China’s land area, but contributes up to 35% of the national GDP and accounts for 18% of the total population [87].
2.3. Research Method: the Projetion Pursuit Cluster (PPC) Model
The model of projection pursuit cluster (PPC) was used in this paper to weight indicators. Projection pursuit (PP) is a data reduction technique used to seek out a linear projection of multivariate data onto a lower dimensional space by means of optimizing the projection index [88]. According to the principle of projection pursuit, the projection pursuit cluster (PPC) model was developed by Friedman and Stuetzle as a new model for high-dimensional data exploratory analysis. Now, the PPC model is widely used in multifactor cluster and evaluation analysis [89]. The detailed procedure is as follows:
Step 1: Use the min–max rescaling transformation method to normalize the values of proxy indicators.
Step 2: Develop the index function Q(a)
The dataset of {x(i, j)|i = 1, 2, ..., n; j = 1, 2, ..., p} (n = 407, p = 24) is converted into a one-dimensional projection value z(i):
where a(j) is a p-dimensional unit vector corresponding to the projection direction taken as the weight of the indicator. The projection value dataset varies with the projection direction a(j). Thus, the index function Q(a) can be calculated as follows:
where E(z) is the mean of z(i); and R is the local density radius of the window. In this study, 0.1; r(i, j) is the distance between the samples: ; u(t) is the unit step function: u(t) = 1, if or u(t) = 0, if .
Step 3: Optimize the projection by maximizing the index function Q(a) based on the program for real-coded genetic algorithm implemented in PYTHON. This result represents the best suitable weights of social vulnerability indicators.
Step 4: Calculate the social vulnerability index. According to Equation (1), the aggregated value (), taken as the social vulnerability index, can be evaluated.
Step 5: Calculate the exposure, sensitivity, and adaptability indexes, according to Equation (1) and Table 1:
Step 6: Map all of the indexes (EI, SI, AI, and SVI) in QGIS, and classify them into five classes of “High”, “High-medium”, “Medium”, “Medium-low”, and “Low” with the “Natural Breaks (Jenks)” method [90].
3. Results
3.1. Weighting Values of Indicators
Table 2 shows the results in terms of the weight of each indicator. First of all, the indicator of “House with no lavatory” contributes the most to SVI, for its weight reaches a maximum at 0.377. The indicator “Immigration from other cities” contributes the least to SVI with a value of 0.035. Hence, in the context of climate change, “immigration from other cities”, within the same province, is not a key influencing factor.
Amongst all the indicators, the top 10 indicators are “House with no lavatory”, “House with no bath facilities”, “Employees in primary industry”, “Houses with no tap water”, “GDP in primary sector”, “Children”, “House with no kitchen”, “Rate of natural increase (RNI)”, “Employees in management sector”, and “Highly educated”. They make up 67.54% of the SVI, so they are important factors affecting social vulnerability. Amongst these, four indicators relate to housing conditions, indicating that coastal city governments should develop more infrastructure and services to support adequate housing, water, and sanitation. These services will efficiently reduce residents’ exposure to the unhealthy impacts of climate change. Two indicators concerning primary industry are also ranked in the top ten. As industry is strongly impacted by climate change, the structure and resiliency of primary industry needs to be improved.
In addition, there are seven indicators in the exposure dimension in the top 10, while eight indicators in the sensitivity dimension are listed in the bottom 10. This suggests that exposure strongly affects overall social vulnerability in the coastal areas, while sensitivity has little effect on social vulnerability.
3.2. Spatial Pattern of Social Vulnerability
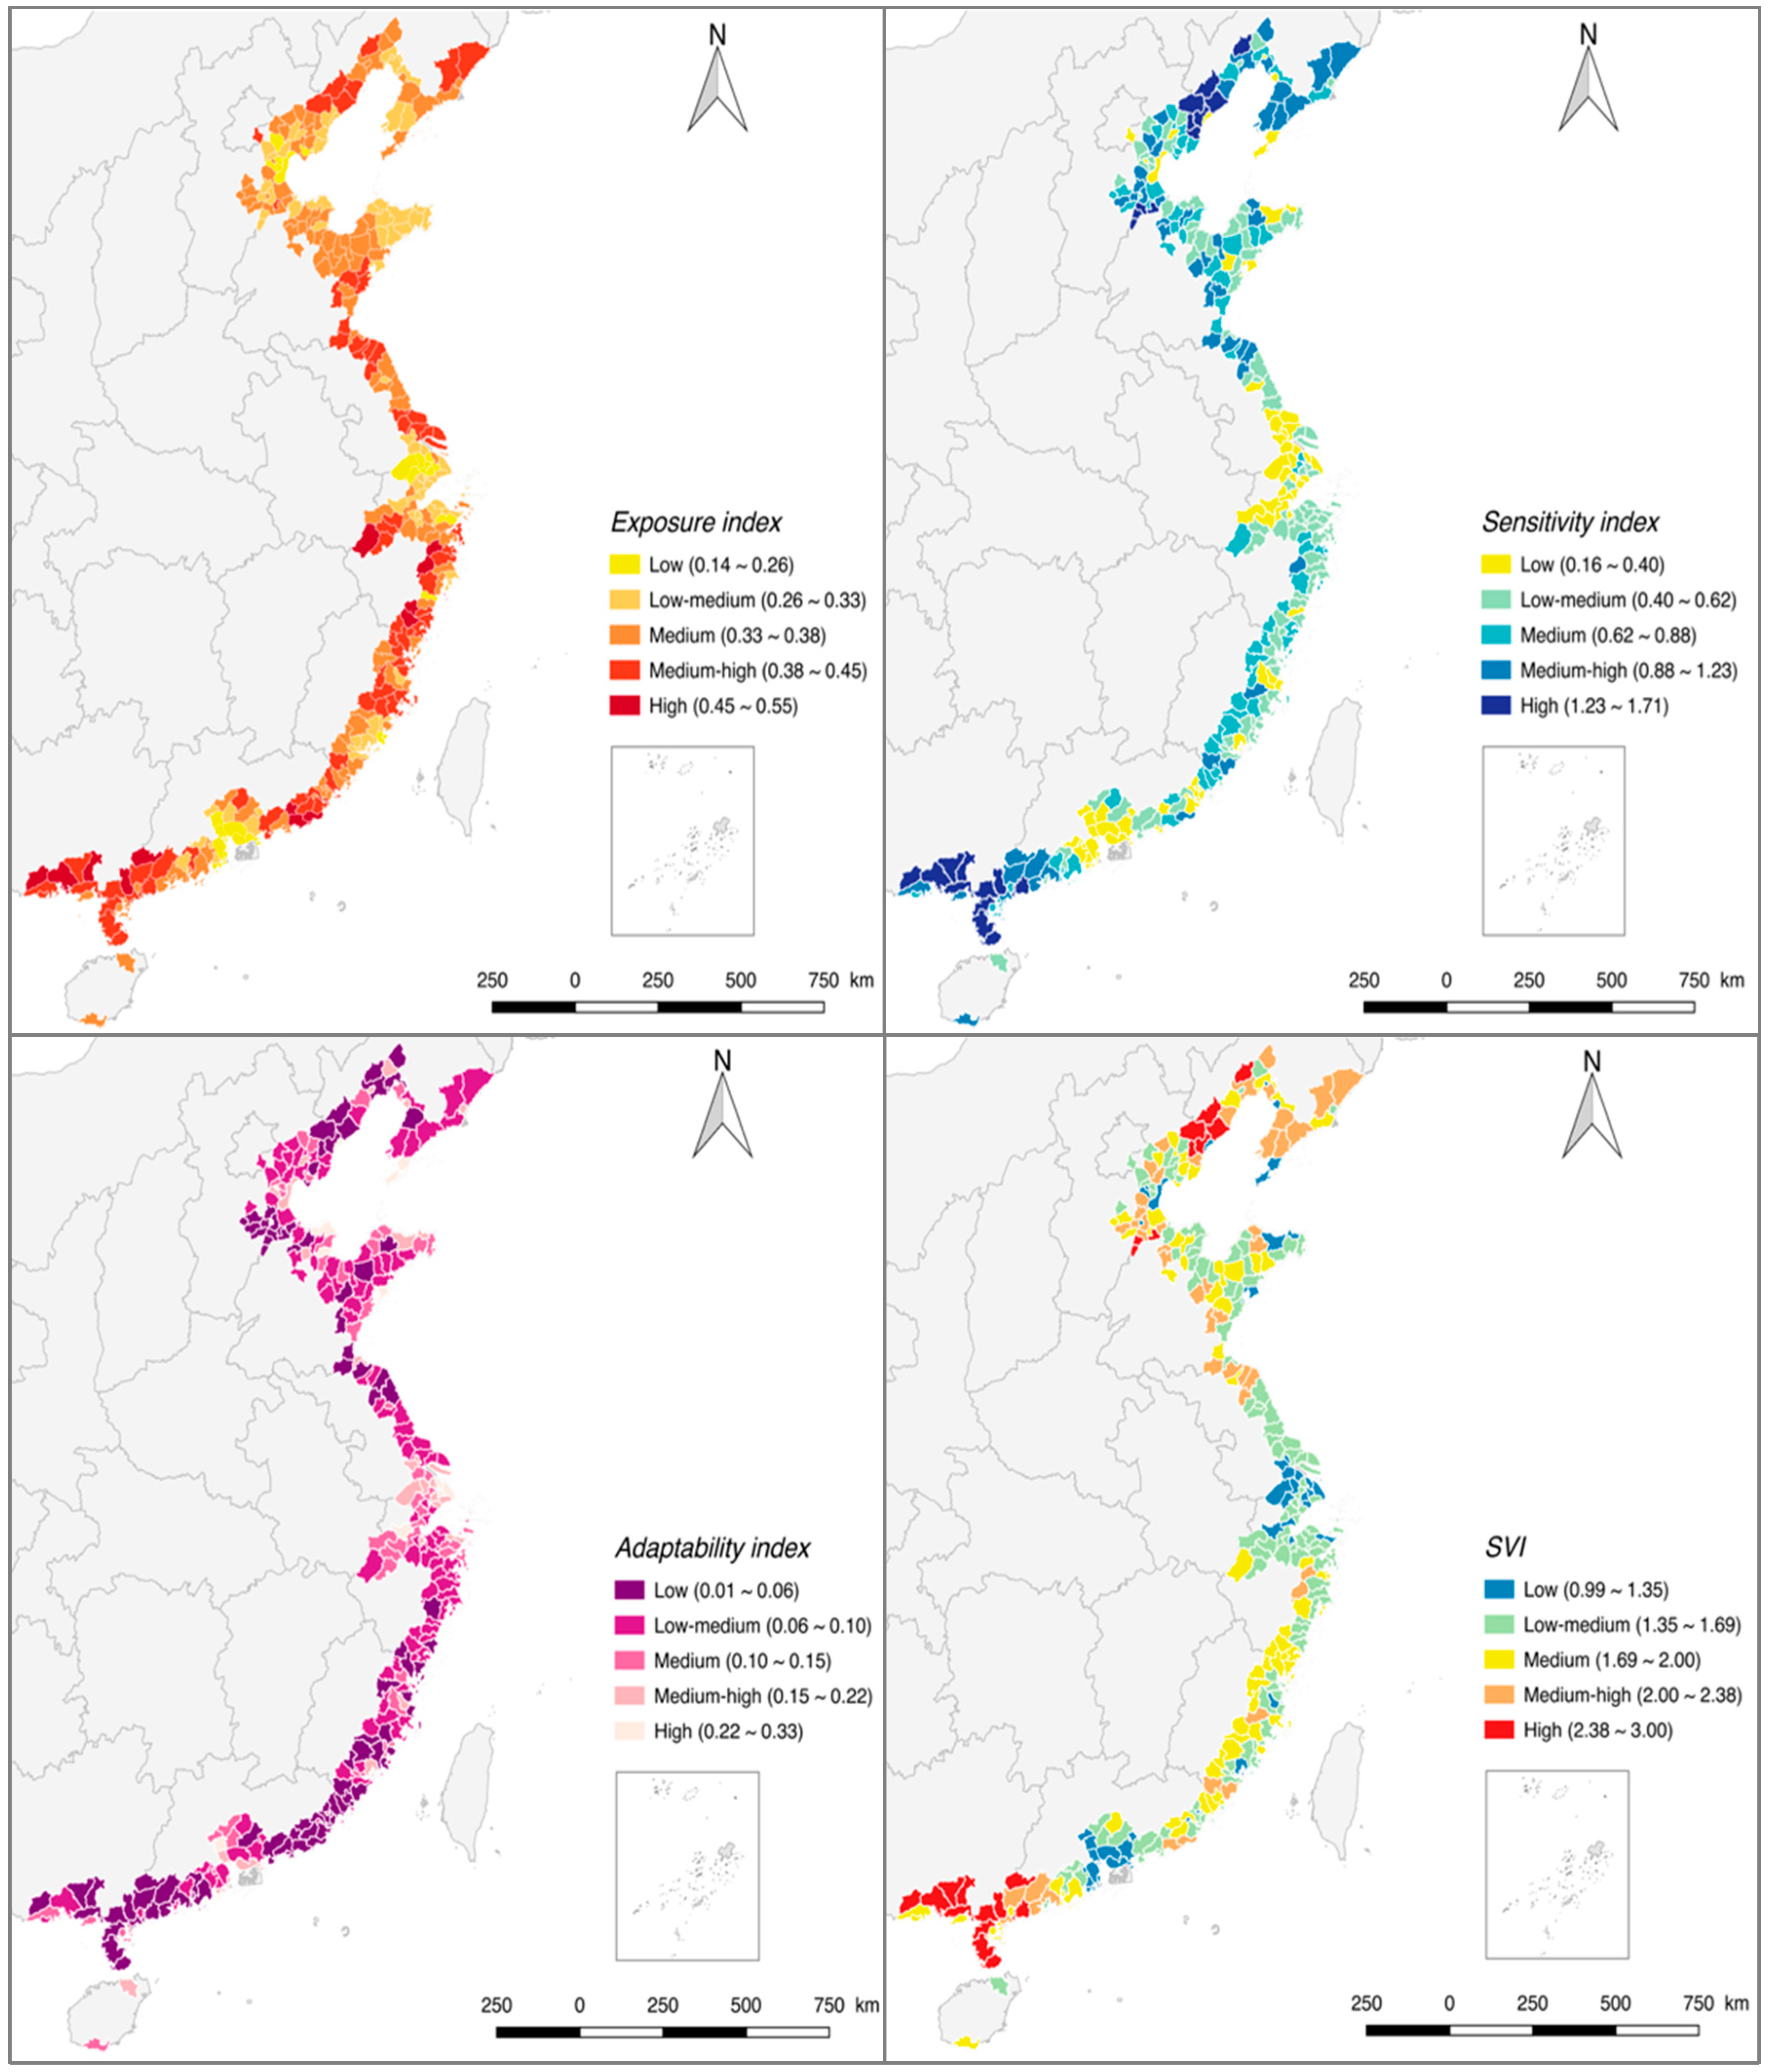
The spatial patterns of EI (exposure index), SI (sensitivity index), and SVI are roughly similar (Figure 3). For example, counties around Liaodong Bay and the Gulf of Tonkin exhibit the highest level of exposure, sensitivity, and social vulnerability. Counties in Shandong Peninsula demonstrated relatively high exposure, sensitivity, and social vulnerability. Counties in the eastern and southeastern regions are characterized by medium exposure, sensitivity, and social vulnerability. The spatial pattern of AI (adaptability index) is different from others: most counties tend to be less adaptable except in the Yangtze River Delta (YRD) and Pearl River Delta regions. Referring to Table 2, the relevant indicators of the adaptability index are: “Employees in management sector”, “Highly educated”, “Physicians in hospital”, “Beds in hospital”, and “GDP per capita”. Hence, more work should be done on the aspects of management, education, medical services, and local economy in these less adaptable coastal areas.
The ratios of counties in each level of SVI, EI, SI, and AI were calculated and are shown in Table 3. It was found that most counties belong to the categories of “medium” or “medium-low” for SVI, which indicates that the general social vulnerability to climate change in the study area is not very serious. The distribution of EI is similar to that of SVI: many counties are categorized at the medium level while a few counties belong to the high or low categories, just like the Gaussian distribution in shape. However, the distribution of SI is different: it resembles the Gaussian distribution but has heavier tails. The distribution of adaptability proves again that it should be paid more attention, because 30.14% of its counties belong to the lowest level.
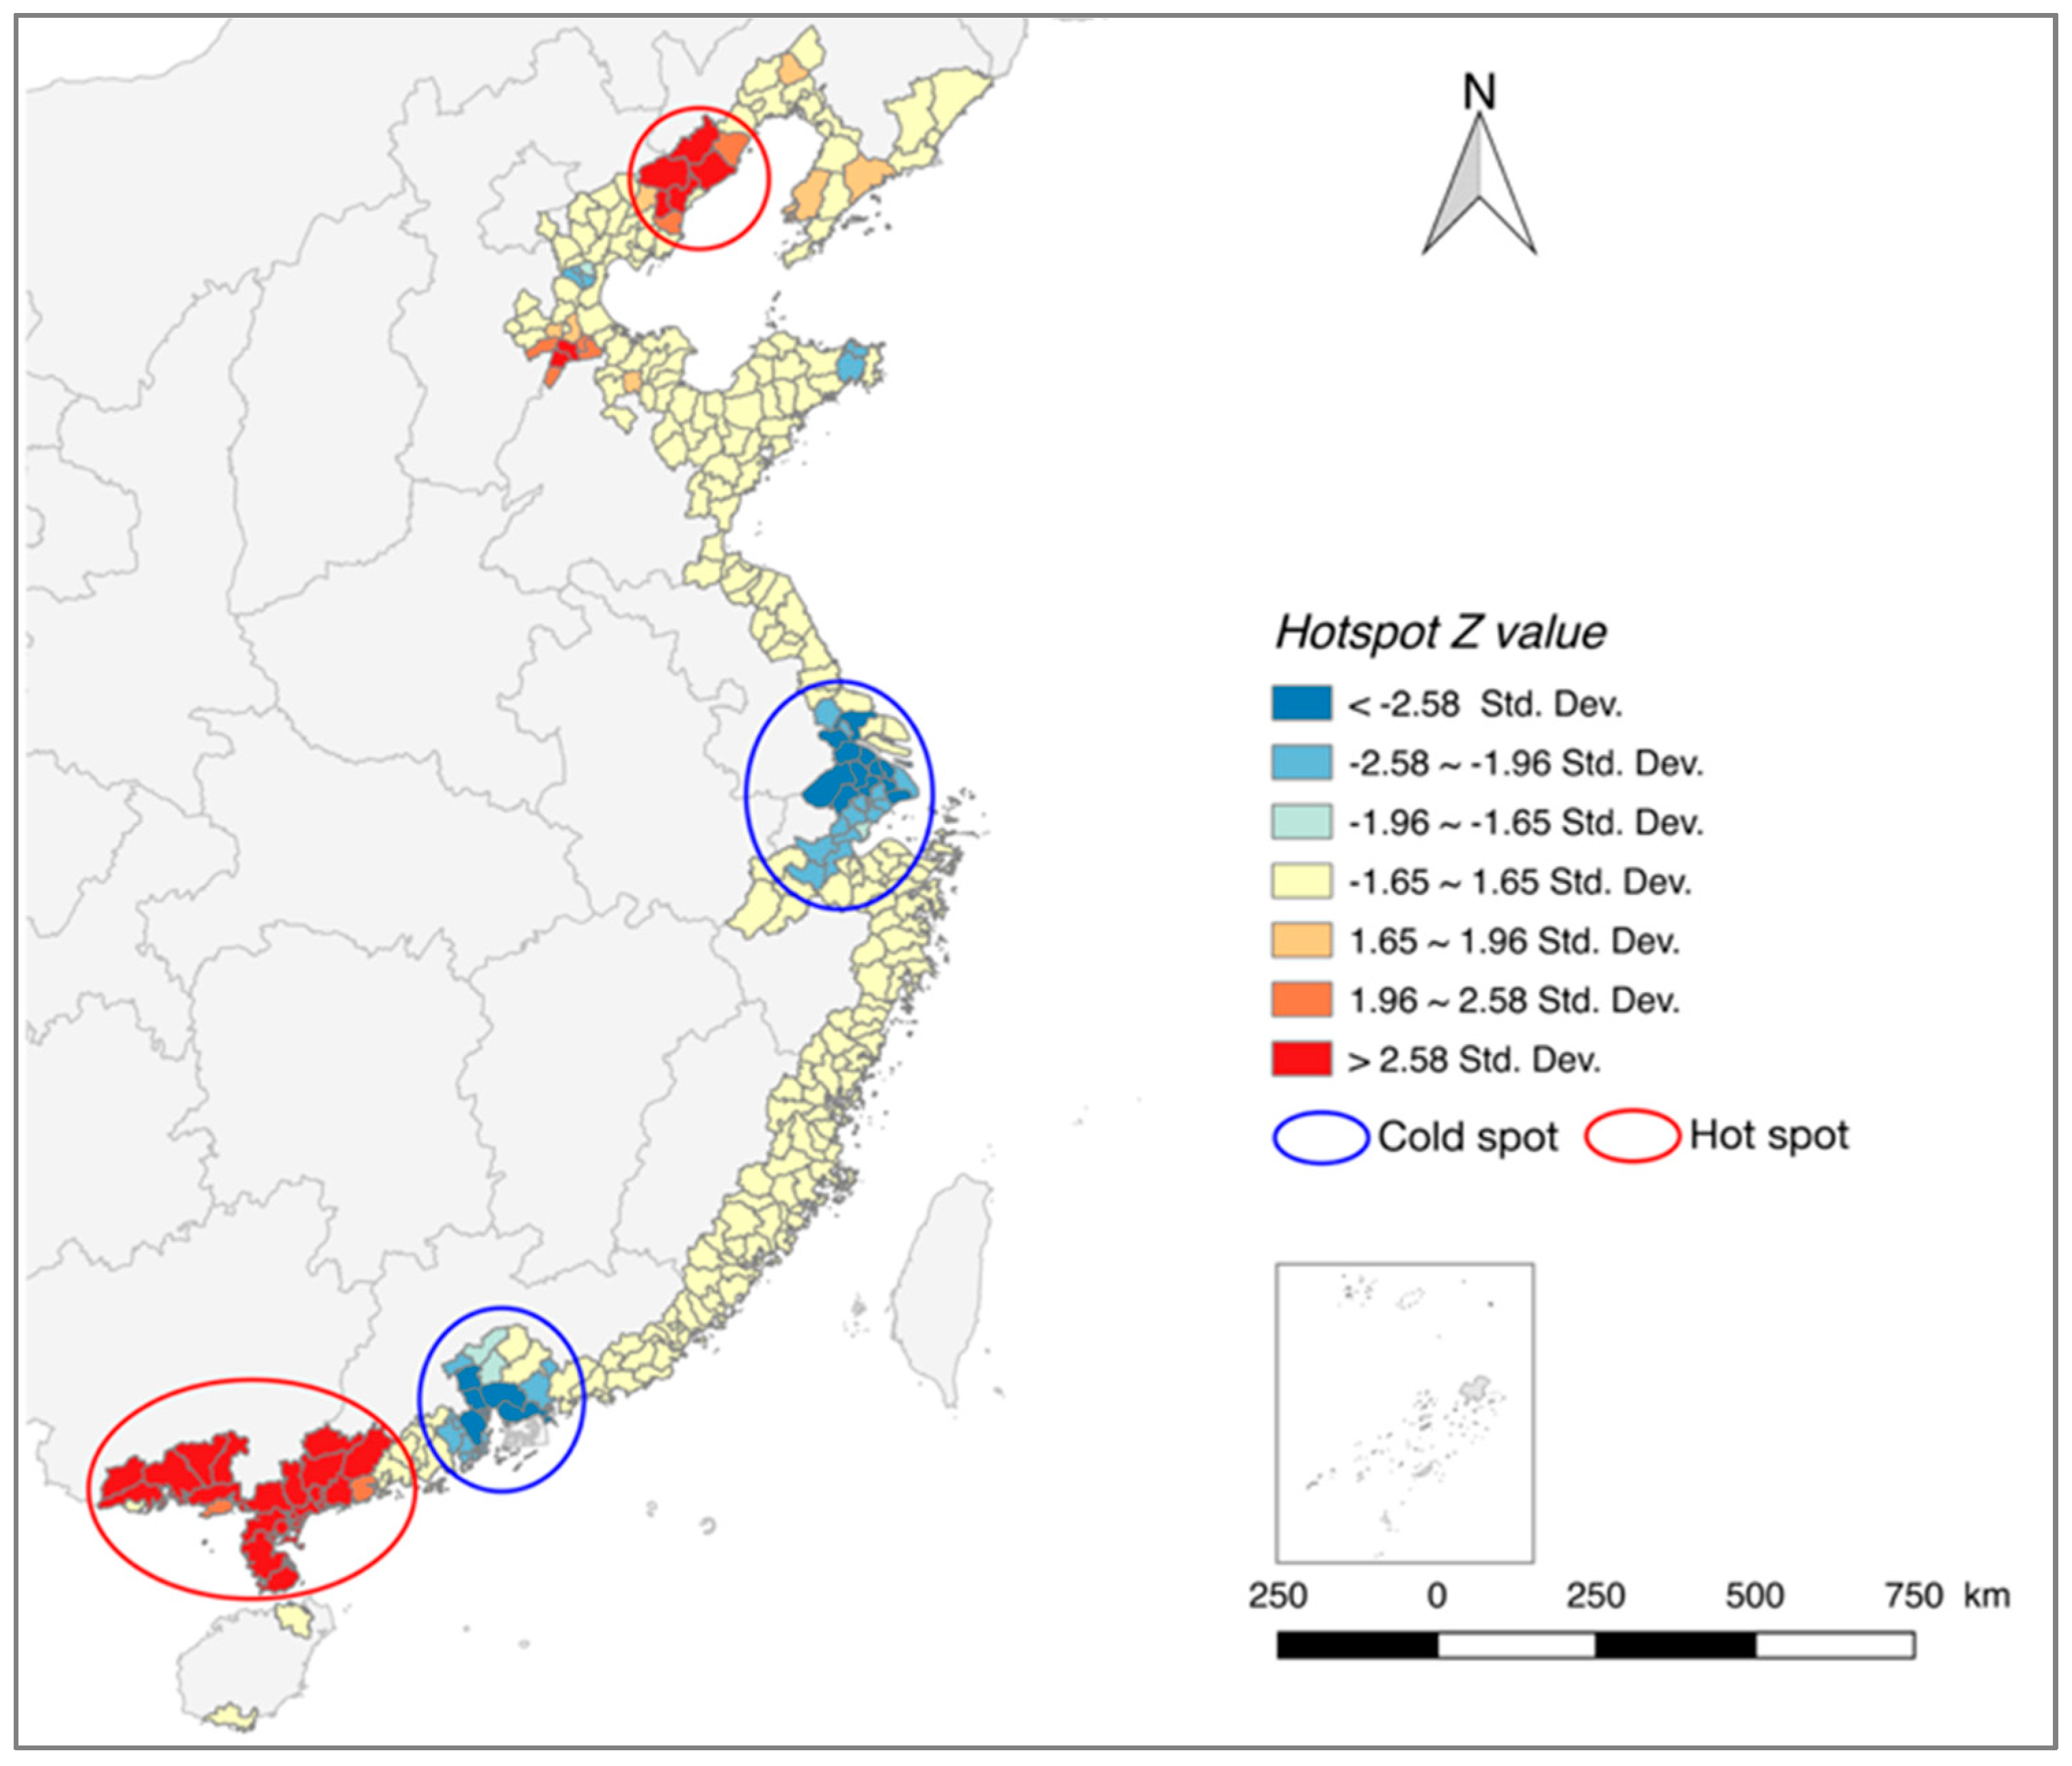
To identify statistically significant spatial clusters of high and low values of SVI, the Getis-Ord Gi* statistic of each area was calculated and mapped as shown in Figure 4. “The Getis-Ord Gi* statistic” is an emerging hotspot analysis tool that works by looking at each feature within the context of neighboring features. The Gi* statistic for each feature is a Z score. A high Z scores means the SVI of the area is high and its neighbors also hold high values of SVI, indicating a cluster of high values, considered to be hot spots. Accordingly, a low Z score means the SVI of the area is low and its neighbors also hold low values of SVI, indicating a cluster of low values, or cold spots.
Two cold spots and two hot spots were identified, ignoring several small ones. Hot spot one lies in Liaodong Bay which includes two cities: Huludao and Qinghuangdao. Hot spot two is along the Gulf of Tonkin and contains the cities of Fangchenggang, Qingzhou, Beihai, Zhanjiang, Maoming, and Yangjiang. Hot spots one and two are extremely vulnerable to climate change, characterized by high EI and high SI but low AI, which means their development will be high risk under the stress of climate change in the future. More adjustments should be developed and implemented in order to reduce their exposure and sensitivity, accompanied by improving their adaptability. Cold spot one lies in the YRD region, including the cities of Nantong, Suzhou, Shanghai, Jiaxing, and Hangzhou. Cold spot two lies in the Pearl River Delta region and includes the cities of Dongguan, Guangzhou, Huizhou, Shenzhen, Zhongshan, and Zhuhai. Both cold spots one and two are characterized by low SVI consisting of low EI, low SI, and medium-high AI. As is known, cold spots one and two are among the most developed and wealthiest regions in China in terms of economy, technology, and culture. They will face the lowest risk to climate variability given their resilient development.
3.3. Urban Development and Social Vulnerability
According to our conceptual framework (Figure 1), climate change takes place on many scales, and climate threats transfer across these scales. Meanwhile, all adaptation and mitigation responses also function and interact on multiple scales. Hence, with the county level results, the profile of SVI at the city level can be determined and the relationship between urban development and SVI to climate change can be explored. In this study, all the county level samples are grouped into two types: city districts and counties. The former represents urban areas and the latter represents rural areas.
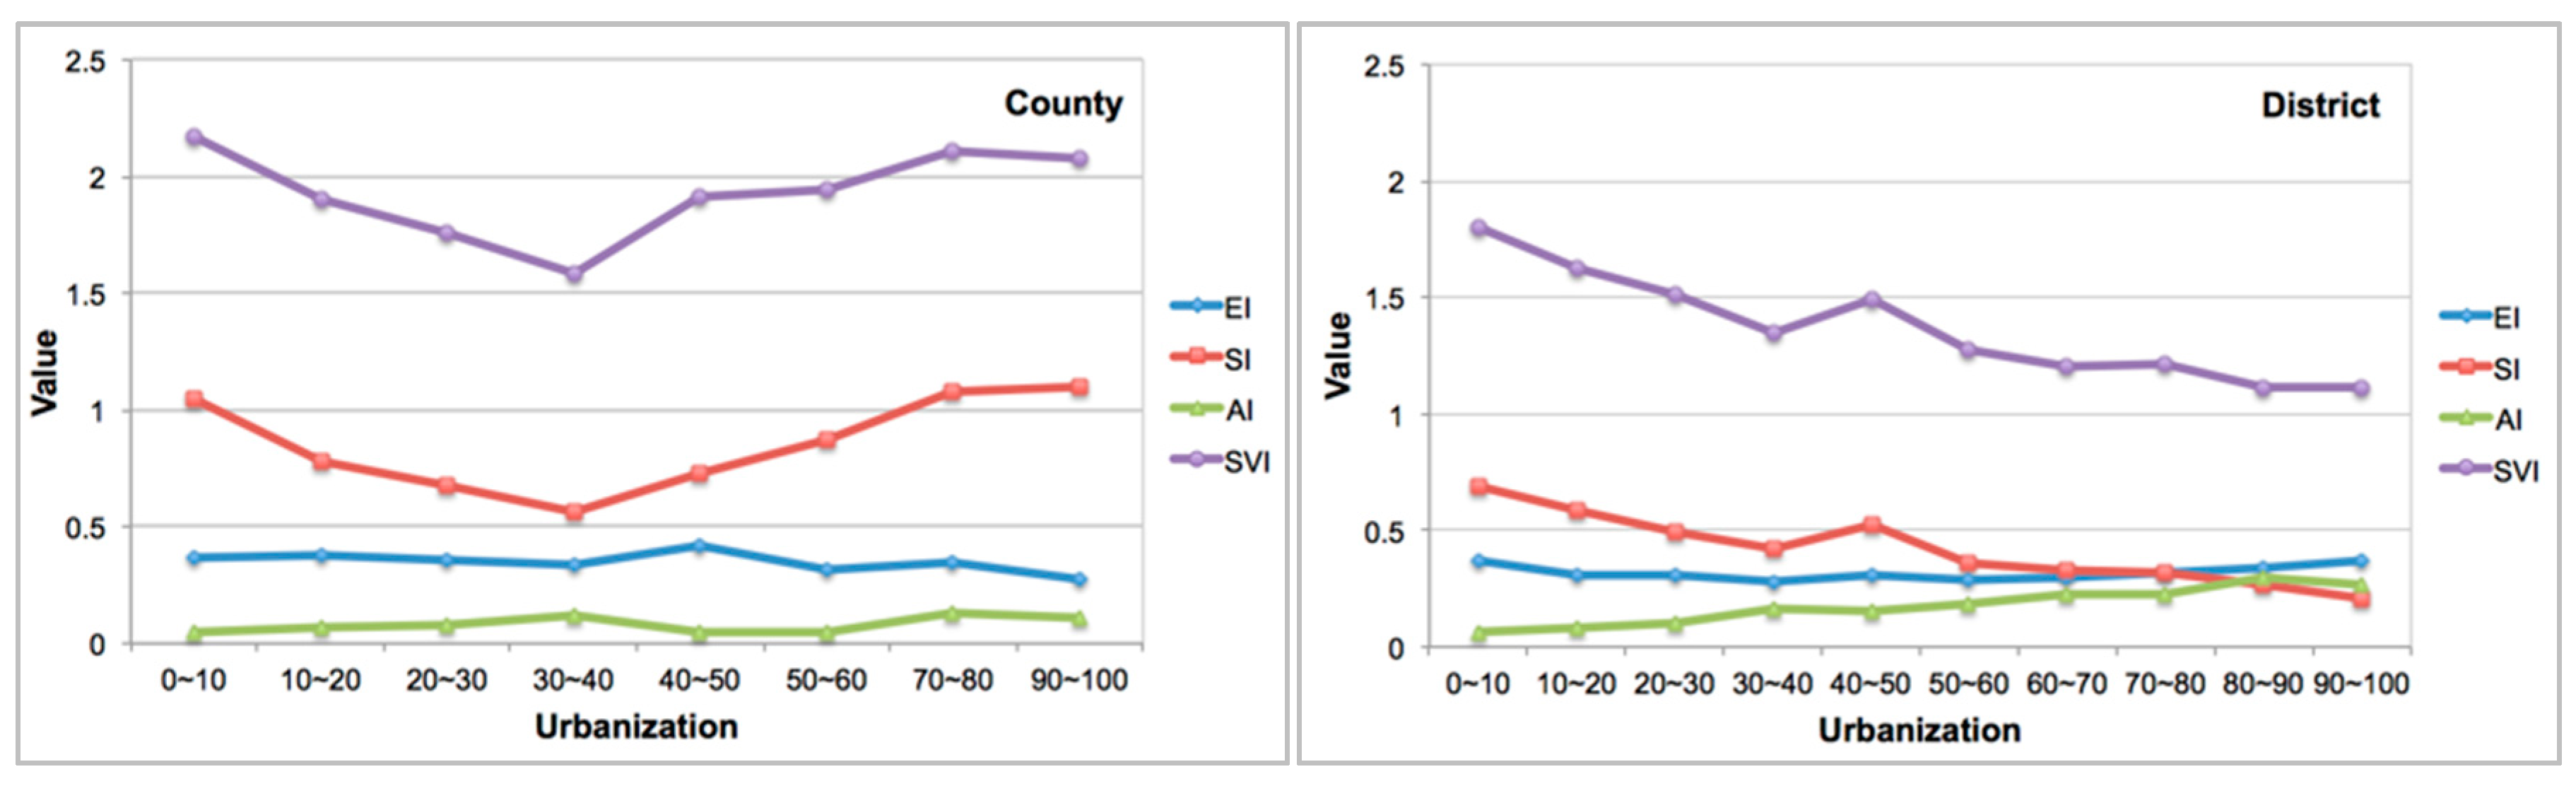
With the variable of “percentage of non-agriculture population” used to represent the rate of urbanization, differences and changes of each index between city districts and counties during urbanization are shown in Table 4 and Figure 5.
When the rate of urbanization is less than 40%, social vulnerability decreases with increasing adaptability, but exposure and sensitivity decrease in either city districts or counties. From the rate of 40% to 50%, EI and SI increase with decreasing AI, which leads to SVI increasing. Beyond a rate of 50%, evident differences were observed between districts and counties. In the districts, SI and SVI keep their decreasing trend but EI and AI increase slightly. As for the counties, EI decreases and AI increases slightly, while SI increases significantly. This ultimately made SVI in the counties increase sharply. During the same period of urbanization, SVI in counties was mostly higher than in the districts with higher EI, higher SI, and lower AI. Therefore, some conclusions can be drawn. Firstly, compared to coastal counties, urbanization in the districts is more appropriate for reducing social vulnerability to climate change. Therefore, coastal counties should be the focus of future risk management for city governments. Secondly, for the districts, more adjustment strategies and work should be applied in the dimension of exposure during urbanization. Thirdly, for the counties, the prominent problem is the increase in sensitivity. Considering that the top three indicators of sensitivity are “Young”, “Ethnic minorities”, and “Elderly”, more work on health and social care should be put toward these sensitive groups.
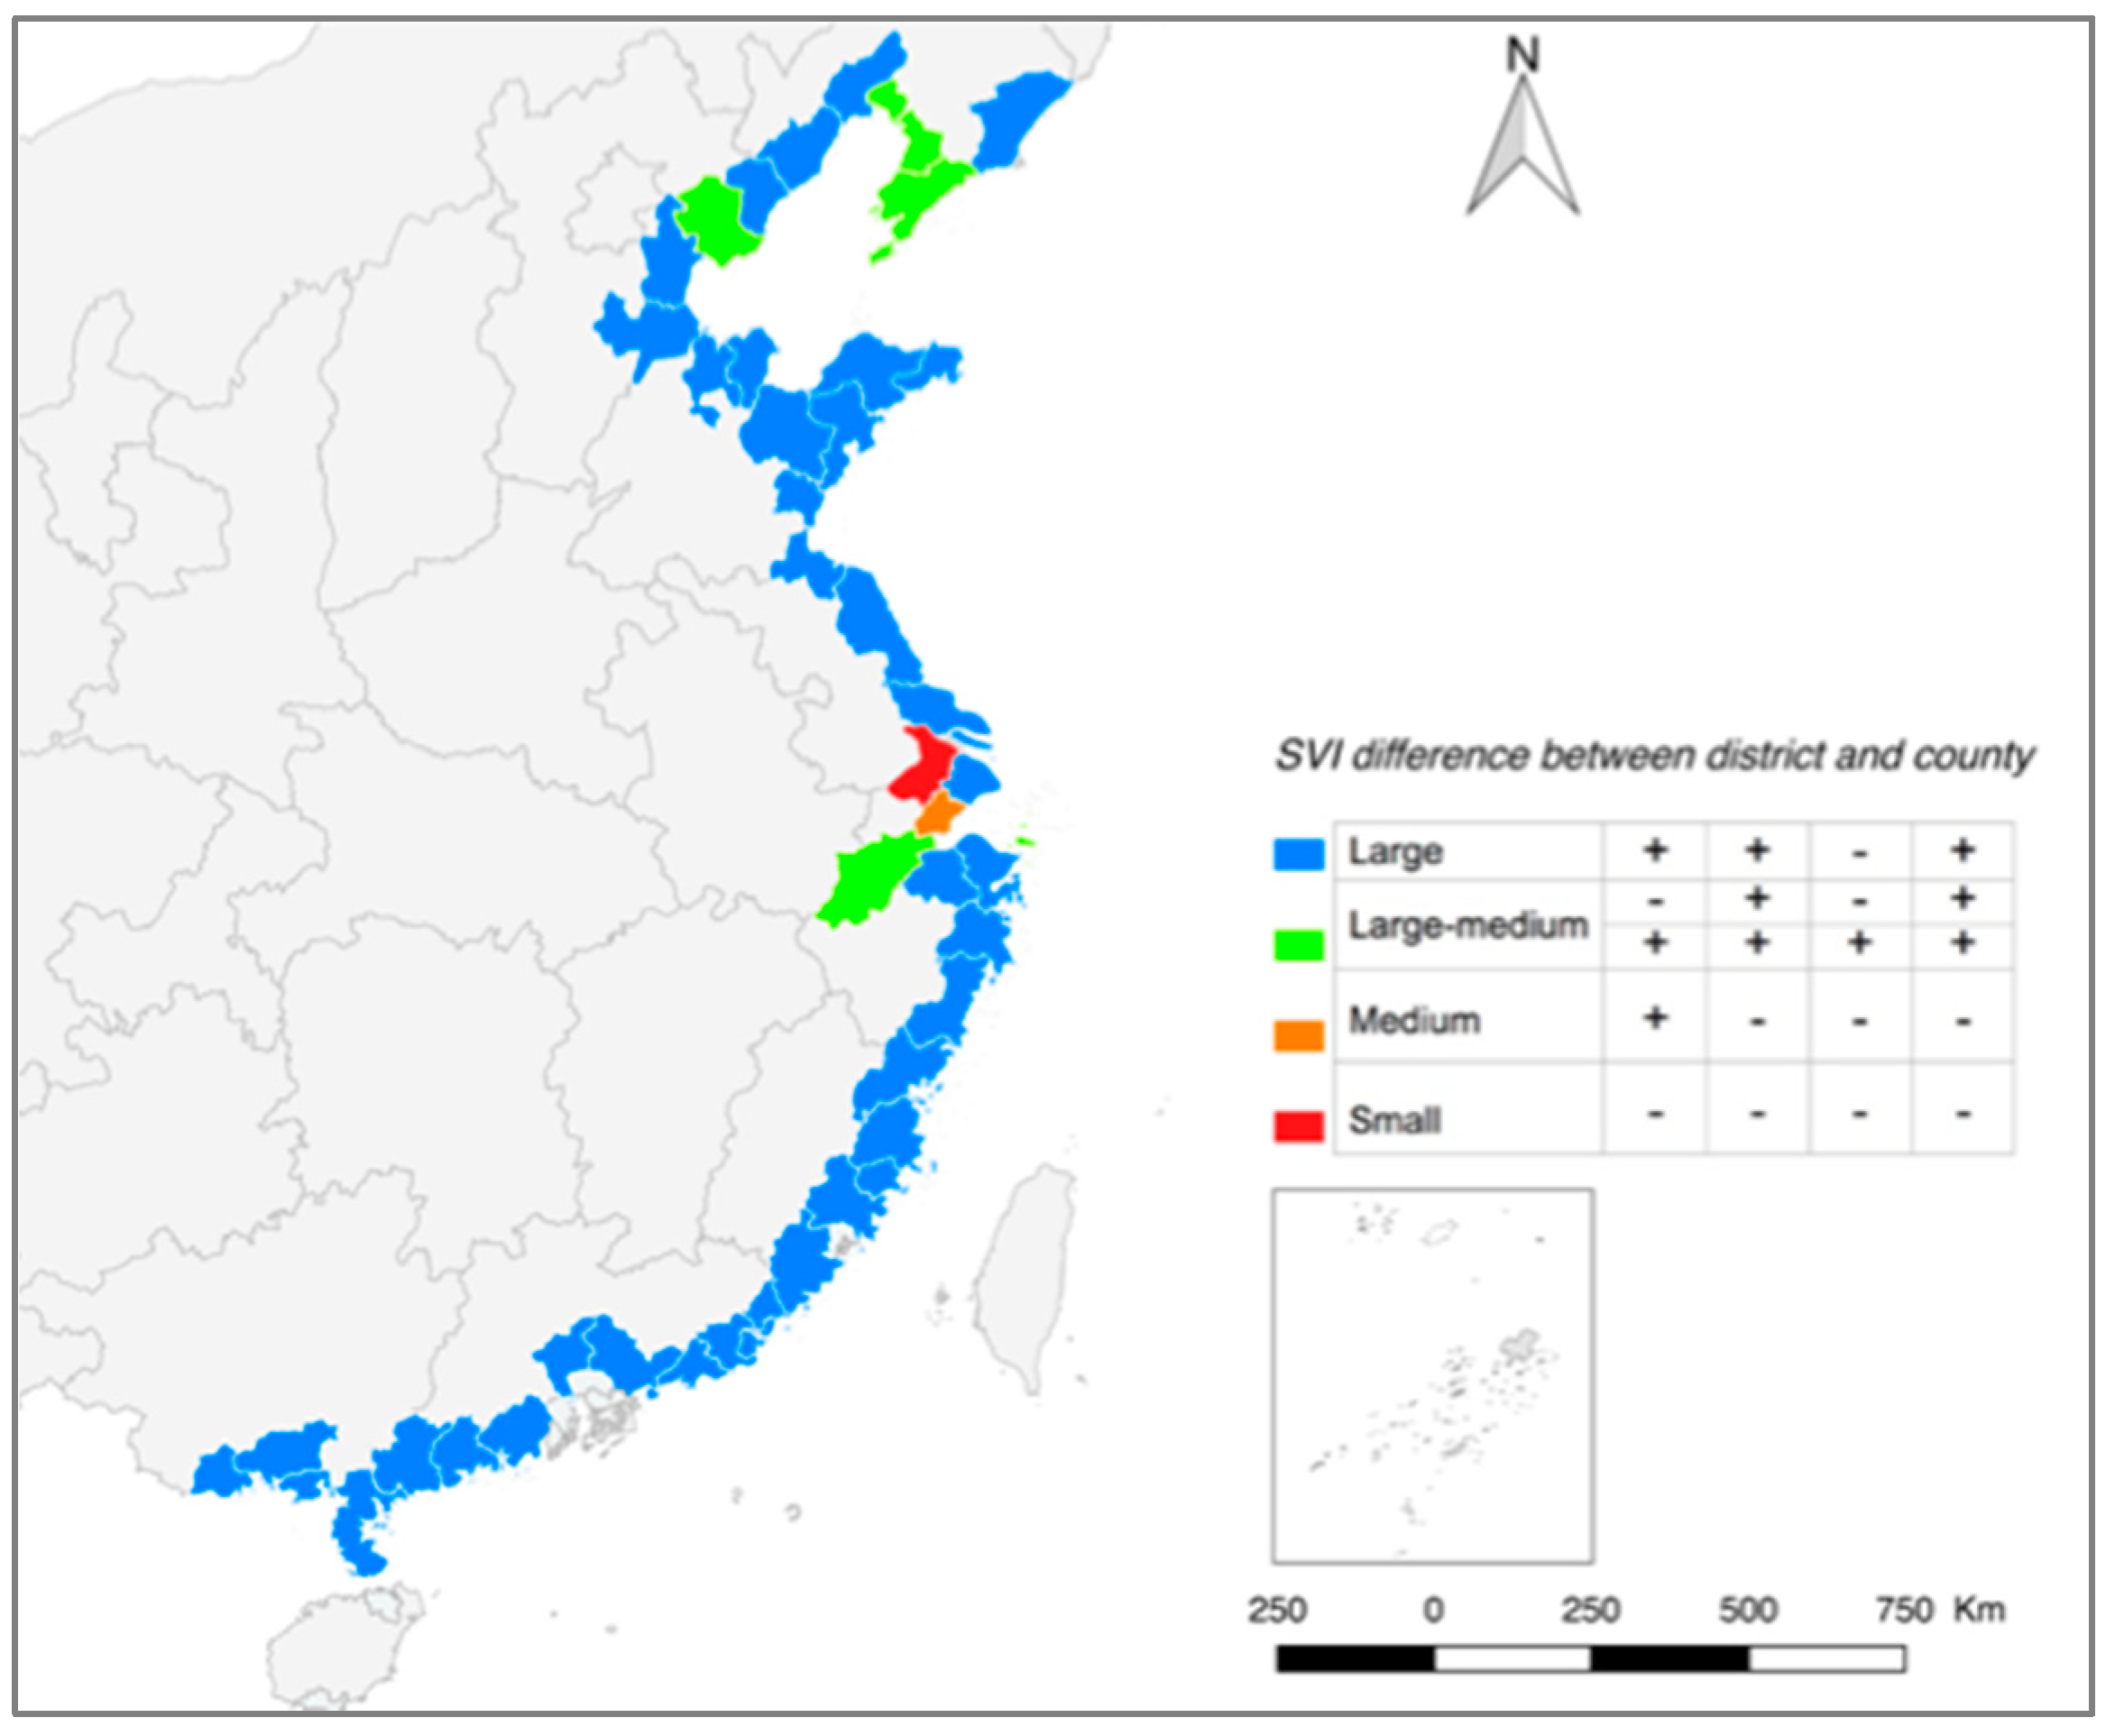
In order to explore the profile of SVI at the city level, the four index values were averaged out separately for each district and county in every city. Then a comparison was made between the counties and districts. Based on the conclusion drawn above that urbanization in the districts is more appropriate for reducing social vulnerability to climate change, the district was taken as a reference in the following analysis (Table 5). Then, five classes of SVI at the city level were identified in our study area (Table 5 and Figure 6).
Thirty-nine cities belong to Class 1. Compared to the districts, the SVI of the counties in these cities is higher, which consists of higher exposure, higher sensitivity, and lower adaptability. Therefore, there are four indexes opposite to the optimal profile, and the difference in social vulnerability between districts and counties is the largest of the study area. Counties in Class 1 are at the highest risk and should be given significant attention by city managers. We should allocate more resources and services to the cities belonging to Class 1 compared to other cities. This puts even more pressure on managers to seek optimal strategies for balancing city districts and counties for achieving win-win development. Class 2 and Class 3 are similar to Class 1; there are three indexes opposite to the optimal profile. Therefore, the differences between city districts and counties in Class 2 and Class 3 are smaller than those in Class 1, and both classes are considered “large-medium”. In Class 4, the SVI of the counties is lower than the districts, which consists of lower sensitivity, higher exposure, and lower adaptability. Hence, there are two indexes opposite to the optimal profile. Class 4 belongs to the classification of “medium”. Only one city, Suzhou, falls into Class 5. The SVI of the counties is lower than the districts with lower exposure, lower sensitivity, but lower adaptability. The difference between districts and counties in this class is the least with only one index opposite to the optimal profile, and they are considered “small”. Class 5 presents a reasonable growth route to reduce social vulnerability and pursue sustainable development in the context of climate change.
4. Discussion
Overall, five key findings can be drawn from our study. First, the top 10 factors that contribute the most to social vulnerability were discovered, which provided a benchmark reference for decision-makers to reduce social vulnerability: (1) developing basic infrastructures and services to support adequate housing, water, and sanitation will increase the adaptability of vulnerable residents and help them withstand the adverse impacts; (2) because primary industry is at high-risk due to climate change, it needs to have a more reasonable structure and be more resilient; (3) developing education and providing enough services for children also helps people to deal with the challenges of and living with climate change and risks; (4) for the coastal areas, the adverse impact from “exposure” is higher than that from “sensitivity”.
Second, the four indexes of SVI, EI, SI, and AI were calculated and mapped with QGIS 2.14.10. Their spatial distribution suggested: (1) most counties are considered “medium” or “medium-low” in terms of SVI, EI, SI, and AI, which indicates that the social vulnerability to climate change in this study area is not yet very serious; and (2) the spatial pattern of adaptability was different from others: most counties tend to be less adaptable, except in the Yangtze River Delta (YRD) and Pearl River Delta regions. This proves we should pay more attention to adaptability in coastal areas.
Third, two hot spots and two cold spots were detected using the Gi* statistic. Hot spot one lay in Liaodong Bay and hot spot two was along the Gulf of Tonkin. Both of them were extremely vulnerable to climate change characterized by high EI and SI, and a low AI. Cold spot one was in the YRD region and cold spot two lay in the Pearl River Delta region. They were characterized by low SVI with low EI, low SI, and medium-high AI.
Fourth, at the county level, evident differences of each index between the city districts and counties during urbanization indicates: (1) urbanization can help the coastal city districts reduce social vulnerability to climate change, while it will add more social vulnerability to the coastal counties. Therefore, planning resilient counties is more important than developing modern counties in China. (2) For districts, more adjustment strategies and further work should be done in the area of exposure during urbanization; and (3) for counties, more health and social care funding should be put toward these sensitive groups because their prominent problem is an increase in sensitivity.
Lastly, at the city level, five types of social vulnerability were explored and the differences between urban and rural areas were discussed. Among these, the differences between urban and rural in 39 cities were large except for in Suzhou. When threatened by climate change, the counties in these 39 cities will require more resources from the city districts and add risk to the city districts. Hence, how to balance the development between county and city districts is becoming an important issue with rapid Chinese urbanization. Suzhou may present a reasonable growth example for the reduction of social vulnerability and of sustainable development in the context of climate change.
Our study also has limitations. Until now, there was still a lack of a consistent set of metrics to measure social vulnerability to climate change. In China, data availability is usually the most crucial factor affecting indicator selection, especially at the county or town level. In order to obtain more indicators at the county level, we used data from 2010, which is the latest information we could obtain. Also, because of the data limitation, some indicators that would have been selected due to their ability to measure social vulnerability were not included in our study. For example, the indicator of “density of industrial commercial and industrial buildings” was not included, so the indicator of “GDP density” was used as a substitute. The “employment rate” indicator is also missing; the “higher education graduate” indicator was used as an indirect substitute for employment, making the assumption that higher education may imply better employment. Finally, 28 indicators were selected, including four that were not included due to being highly correlated. This number of indicators is sufficient to apply the PPC model and can provide enough information to evaluate social vulnerability of the coastal areas in China. In addition, using losses of extreme events as a validation of social vulnerability is a commonly suggested approach. However, this approach assumes that the damage is evenly distributed throughout the study area and that the more socially vulnerable human societies have more to lose, which is not the case [54]. The impacts of climate change on human society in China have a distinct geographic distribution [86]. Therefore, it is difficult to validate such social vulnerability. Though our results were not validated directly, they can be justified by the similar research conducted by Chen and Su [47,87]. Moreover, the results correspond to differentiated patterns of socioeconomic status and demographic changes in China.
5. Conclusions
Understanding and evaluating social vulnerability to climate change has become an imperative need for urban risk management and sustainable development. Though most studies of vulnerability to climate change in China have expanded to social fields, such as livelihood, agriculture, water resources, and so on, few of them explore the interaction between the social vulnerability of a location and urban development. Therefore, this paper established a social vulnerability index (SVI) at the county level with a composite index to climate change focusing on heavily urbanized cities on the Chinese east coast. With this index, we examined the spatial pattern of SVI and targeted the hotspots of SVI at the county level. Then, we explored the profile of social vulnerability at the city level, as well as differences in SVI between urban and rural regions. The results indicate that urbanization can help the coastal city districts reduce social vulnerability to climate change, while adding more social vulnerability to the coastal counties. Therefore, planning resilient counties is more important than developing modern counties in China. Balancing the development between the county and city districts is now becoming an important issue in rapid Chinese urbanization.
Future directions of our research may include exploring social vulnerability at the town level and evaluating the biophysical and social vulnerability of coastal areas to climate change.
Acknowledgments
This study was financially supported by the National Natural Science Foundation of China (Grant No. 41571488 and Grant No. 41401382). Special thanks to the reviewers and the editors for their critical comments that greatly helped in improving the quality of this article.
Author Contributions
Wen Dou analyzed the data; Yi Ge and Ning Liu contributed the materials; Yi Ge wrote the paper.
Conflicts of Interest
The authors declare no conflict of interest.
References
- Jabareen, Y. Planning the resilient city: Concepts and strategies for coping with climate change and environmental risk. Cities 2013, 31, 220–229. [Google Scholar] [CrossRef]
- Voskamp, I.M.; Van de Ven, F.H.M. Planning support system for climate adaptation: Composing effective sets of blue-green measures to reduce urban vulnerability to extreme weather events. Build. Environ. 2015, 83, 159–167. [Google Scholar] [CrossRef]
- Muis, S.; Verlaan, M.; Winsemius, H.C.; Aerts, J.C.J.H.; Ward, P.J. A global reanalysis of storm surges and extreme sea levels. Nat. Commun. 2016. [Google Scholar] [CrossRef] [PubMed]
- Vousdoukas, M.I.; Voukouvalas, E.; Annunziato, A.; Giardino, A.; Feyen, L. Projections of extreme storm surge levels along Europe. Clim. Dyn. 2016, 47, 3171–3190. [Google Scholar] [CrossRef]
- Vousdoukas, M.I.; Voukouvalas, E.; Mentaschi, L.; Dottori, F.; Giardino, A.; Bouziotas, D.; Bianchi, A.; Salamon, P.; Feyen, L. Developments in large-scale coastal flood hazard mapping. J. Nat. Hazards Earth Syst. Sci. 2016, 16, 1841–1853. [Google Scholar] [CrossRef]
- Intergovernmental Panel on Climate Change (IPCC). Climate change 2007. In The Physical Science Basis; Solomon, S., Qin, D., Manning, M., Chen, Z., Marquis, M., Averyt, K.B., Tignor, M., Miller, H.L., Eds.; Cambridge University Press: Cambridge, UK, 2007. [Google Scholar]
- Chu, E.; Anguelovski, I.; Roberts, D. Climate Adaptation as Strategic Urbanism: Assessing Opportunities and Uncertainties for Equity and Inclusive Development in Cities. Cities 2017, 60, 378–387. [Google Scholar] [CrossRef]
- Turner, B.L., II; Kasperson, R.E.; Matson, P.A.; Mccarthy, J.J.; Corell, R.W.; Christensen, L.; Eckley, N.; Kasperson, J.X.; Luers, A.; Martello, M.L.; et al. A framework for vulnerability analysis in sustainability science. Proc. Natl. Acad. Sci. USA 2003, 100, 8074–8079. [Google Scholar] [CrossRef] [PubMed]
- Birkmann, J. Measuring vulnerability to promote disaster-resilient societies: Conceptual frameworks and definitions. In Measuring Vulnerability; United Nations University: Tokyo, Japan, 2006; pp. 9–54. [Google Scholar]
- Joint Global Change Research Institute; Battelle Memorial Institute, Pacific Northwest Division. China: Impact of Climate Change to 2030—A Commissioned Research Report; Food and Agriculture Organization: Rome, Italy, 2009. [Google Scholar]
- Knapp, E.D.; Langill, J.T. Industrial Network Security; Elsevier: Amsterdam, The Netherlands, 2015. [Google Scholar]
- Füssel, H.-M. Vulnerability: A generally applicable conceptual framework for climate change research. Glob. Environ. Chang. 2007, 17, 155–167. [Google Scholar] [CrossRef]
- Ge, Y.; Zhang, H.; Dou, W.; Chen, W.; Liu, N.; Wang, Y.; Shi, Y.; Rao, W. Mapping Social Vulnerability to Air Pollution: A Case Study of the Yangtze River Delta Region, China. Sustainability 2017, 9, 109. [Google Scholar] [CrossRef]
- Janssen, M.A.; Schoon, M.L.; Ke, W.; Börner, K. Scholarly networks on resilience, vulnerability and adaptation within the human dimensions of global environmental change. Glob. Environ. Chang. 2006, 16, 240–252. [Google Scholar] [CrossRef]
- Liverman, D.M. Vulnerability to global environmental change. Underst. Glob. Environ. Chang. Contrib. Risk Anal. Manag. 1990, 27–44. [Google Scholar]
- Adger, N.; Aggarwal, P.; Agrawala, S.; Alcamo, J.; Allali, A.; Anisimov, O.; Arnell, N.; Boko, M.; Canziani, O.; Carter, T.; et al. Climate Change 2001: Impacts, Adaptation and Vulnerability; McCarthy, J.J., Canziani, O.F., Leary, N.A., Dokken, D.J., White, K.S., Eds.; Cambridge University Press: Cambridge, UK, 2001. [Google Scholar]
- Zhang, X.; Ma, X.; Zhu, X.; Tan, Z. A Study on Climate Change Vulnerability Assessment of Xishuangbanna Biodiversity Corridor Area. Environ. Sci. Surv. 2012, 31, 89–92. [Google Scholar]
- Song, J. Research Progress on Agricultural Climate Change Vulnerability and Governance. Ecol. Econ. 2016, 32, 164–168. [Google Scholar]
- Xia, J.; Luo, X.; Cao, J.; Chen, J.; Ning, L.; Hong, S. Impact and Assessment of Climate Change on the Water Resources Vulnerability in the Eastern China Monsoon Region. Progress. Inquis. Mutat. Clim. 2015, 11, 8–14. [Google Scholar]
- Tzilivakis, J.; Warner, D.J.; Green, A.; Lewis, K.A. Adapting to climate change: Assessing the vulnerability of ecosystem services in Europe in the context of rural development. Mitig. Adapt. Strategies Glob. Chang. 2015, 20, 547–572. [Google Scholar] [CrossRef] [Green Version]
- Mandal, S.; Satpati, L.N.; Choudhury, B.U.; Sadhu, S. Climate change vulnerability to agrarian ecosystem of small Island: Evidence from Sagar Island, India. Theor. Appl. Climatol. 2017. [Google Scholar] [CrossRef]
- Zhao, D.; Wu, S. Vulnerability of natural ecosystem in China under regional climate scenarios: An analysis based on eco-geographical regions. J. Geogr. Sci. 2014, 24, 237–248. [Google Scholar] [CrossRef]
- Wu, S.; Dai, E.; Mei, H.; Shao, X.; Li, S.; Tao, B. Ecosystem vulnerability of China under B2 climate scenario in the 21st century. Chin. Sci. Bull. 2007, 52, 1379–1386. [Google Scholar] [CrossRef]
- Zlatanov, T. Impact of climate change on vulnerability of forests and ecosystem service supply in Western Rhodopes Mountains. Reg. Environ. Chang. 2017, 17, 79–91. [Google Scholar] [CrossRef]
- Antle, J.M.; Capalbo, S.M.; Elliott, E.T.; Paustian, K.H. Adaptation, spatial heterogeneity, and the vulnerability of agricultural systems to climate change and CO2 fertilization: An integrated assessment approach. Clim. Chang. 2004, 64, 289–315. [Google Scholar] [CrossRef]
- Dixon, R.K.; Smith, J.; Guill, S. Life on the edge: Vulnerability and adaptation of african ecosystems to global climate change. Mitig. Adapt. Strateg. Glob. Chang. 2003, 8, 93–113. [Google Scholar] [CrossRef]
- Metzger, M.J.; Leemans, R.; Schro, D. A multidisciplinary multi-scale framework for assessing vulnerabilities to global change. Int. J. Appl. Earth Obs. Geoinf. 2005, 7, 253–267. [Google Scholar] [CrossRef]
- Metzger, M.J.; Schro, D.; Leemans, R.; Cramer, W. A spatially explicit and quantitative vulnerability assessment of ecosystem service change in Europe. Reg. Environ. Chang. 2008, 8, 91–107. [Google Scholar] [CrossRef]
- Amos, E.; Akpan, U.; Ogunjobi, K. Households’ perception and livelihood vulnerability to climate change in a coastal area of Akwa Ibom State. Environ. Dev. Sustain. 2015, 17, 887–908. [Google Scholar] [CrossRef]
- Alam, G.M.M. Livelihood Cycle and Vulnerability of Rural Households to Climate Change and Hazards in Bangladesh. Environ. Manag. 2017, 59, 777–791. [Google Scholar] [CrossRef] [PubMed]
- Panthi, J.; Aryal, S.; Dahal, P.; Bhandari, P. Livelihood vulnerability approach to assessing climate change impacts on mixed agro-livestock smallholders around the Gandaki River Basin in Nepal. Reg. Environ. Chang. 2016, 16, 1121–1132. [Google Scholar] [CrossRef]
- Singh, P.K.; Nair, A. Livelihood vulnerability assessment to climate variability and change using fuzzy cognitive mapping approach. Clim. Chang. 2014, 127, 475–491. [Google Scholar] [CrossRef]
- Himalaya, L.; Pandey, R.; Jha, S. Climate vulnerability index - measure of climate change vulnerability to communities: A case of rural. Mitig. Adapt. Strategies Glob. Chang. 2012, 17, 487–506. [Google Scholar]
- Maeda, C.; Tscherning, K. Assessing the determinants of poverty and vulnerability of smallholder farmers in a changing climate: The case of Morogoro region, Tanzania. Reg. Environ. Chang. 2015, 15, 1243–1258. [Google Scholar]
- Tucker, J.; Daoud, M.; Oates, N.; Matheson, S. Social vulnerability in three high-poverty climate change hot spots: What does the climate change literature tell us? Reg. Environ. Chang. 2015, 15, 783–800. [Google Scholar] [CrossRef]
- Garschagen, M.; Romero-lankao, P. Exploring the relationships between urbanization trends and climate change vulnerability. Clim. Chang. 2015, 133, 37–52. [Google Scholar] [CrossRef]
- Moore, T.L.; Gulliver, J.S.; Stack, L.; Simpson, M.H. Stormwater management and climate change: Vulnerability and capacity for adaptation in urban and suburban contexts. Clim. Chang. 2016, 138, 491–504. [Google Scholar] [CrossRef]
- Mccormick, S. Assessing climate change vulnerability in urban America: Stakeholder-driven approaches. Clim. Chang. 2016, 138, 397–410. [Google Scholar] [CrossRef]
- Fellmann, T. The assessment of climate change-related vulnerability in the agricultural sector: Reviewing conceptual frameworks. Build. Resil. Adapt. Clim. Chang. Agric. Sect. 2012, 10, 37–62. [Google Scholar]
- Ge, Y.; Liu, J.; Li, F.; Shi, P. Quantifying social vulnerability for flood disasters of insurance company. J. Southeast Univ. 2008, 24, 147–150. [Google Scholar]
- Neil, L.; Conde, C.; Kulkarni, J.; Nyong, A.; Pulbin, J. Climate Change and Vulnerability; Earthscan: London UK; Sterling, WI, USA, 2008. [Google Scholar]
- Wisner, B.; Blaikie, P.; Cannon, T.; Davis, I. At Risk: Natural Hazards, People’s Vulnerability, and Disasters, 2nd ed.; Routledge: London, UK, 2004. [Google Scholar]
- Yenneti, K.; Tripathi, S.; Wei, Y.D.; Chen, W.; Joshi, G. The truly disadvantaged? Assessing social vulnerability to climate change in urban India. Habitat Int. 2016, 56, 124–135. [Google Scholar] [CrossRef]
- Blaikie, P.; Cannon, T.; Davis, I.; Wisner, B. At Risk: Natural Hazards, People’s Vulnerability, and Disasters; Routledge: London, UK, 1994. [Google Scholar]
- Cutter, S.L. Vulnerability to environmental hazards. Prog. Hum. Geogr. 1996, 20, 529–539. [Google Scholar] [CrossRef]
- Bin Kashem, M.S. Moving Towards Disaster: Examining the Changing Patterns of Social Vulnerability in a Multi-Hazard Urban Environment. Ph.D. Thesis, University of Illinois at Urbana-Champaign, Champaign, IL, USA, 2015. [Google Scholar]
- Chen, W.; Cutter, S.L.; Emrich, C.T.; Shi, P. Measuring social vulnerability to natural hazards in the Yangtze River Delta region, China. Int. J. Disaster Risk Sci. 2013, 4, 169–181. [Google Scholar] [CrossRef]
- O’Brien, K.L.; Leichenko, R.; Kelkarc, U.; Venemad, H.; Aandahl, G.; Tompkins, H.; Javed, A.; Bhadwal, S.; Barg, S.; Nygaard, L.; et al. Mapping vulnerability to multiple stressors: Climate change and globalization in India. Glob. Environ. Chang. 2004, 14, 303–313. [Google Scholar] [CrossRef]
- Zhang, Q.; Zhao, X.; Luo, L.; Wang, Y.; Xue, B. Assessment of the impact of climate change on vulnerability of farmer households’livelihood in an ecologically vulnerable alpine region: Taking Gannan Plateau for example. Chin. J. Ecol. 2016, 35, 781–790. [Google Scholar]
- Hu, Y.; Xu, X.; Qi, G. Climate Change Aggravate Poverty and Adaptive Capacity—A Case Study of GT Village, Yanchi County, Ningxia Hui Autonomous Region. For. Econ. 2012, 12, 46–54. [Google Scholar]
- Dwyer, A.; Zoppou, C.; Nielsen, O.; Day, S.; Roberts, S. Quantifying Social Vulnerability: A Methodology for Identifying Those at Risk to Natural Hazards; Geoscience Australia: Canberra, Australia, 2004. [Google Scholar]
- Ge, Y.; Dou, W.; Gu, Z.; Qian, X. Assessment of social vulnerability to natural hazards in the Yangtze River Delta, China. Stoch. Environ. Res. Risk Assess. 2013, 27, 1899–1908. [Google Scholar] [CrossRef]
- Nardo, M.; Saisana, M.; Saltelli, A.; Tarantola, S. Handbook on Constructing Composite Indicators; OECD: Paris, France, 2008. [Google Scholar]
- Cutter, S.L.; Finch, C. Temporal and spatial changes in social vulnerability to natural hazards. Proc. Natl. Acad. Sci. USA 2008, 7, 2301–2306. [Google Scholar] [CrossRef] [PubMed]
- Stafford, S.; Abramowitz, J. An analysis of methods for identifying social vulnerability to climate change and sea level rise: A case study of Hampton Roads, Virginia. Nat. Hazards 2017, 85, 1089–1117. [Google Scholar] [CrossRef]
- Tierney, K. Social Inequality, Hazards, and Disasters. In On Risk and Disaster: Lessons from Hurricane Katrina; Daniels, R.J., Kettl, E.F., Kunreuther, H., Eds.; University of Pennsylvania Press: Philadephia, PA, USA, 2006; pp. 109–128. [Google Scholar]
- Wood, N.J.; Burton, C.G.; Cutter, S.L. Community variations in social vulnerability to Cascadia-related tsunamis in the U.S. Pacific Northwest. Nat. Hazards 2010, 52, 369–389. [Google Scholar] [CrossRef]
- Gbetibouo, G.; Ringler, C.; Hassan, R. Vulnerability of the South African farming sector to climate change and variability: An indicator approach. Nat. Resour. Forum. 2010, 34, 175–187. [Google Scholar] [CrossRef]
- Monterroso, A.; Conde, C.; Gay, C.; Gómez, D.; López, J. Two methods to assess vulnerability to climate change in the Mexican agricultural sector. Mitig. Adapt. Strategies Glob. Chang. 2014, 19, 445–461. [Google Scholar] [CrossRef]
- Nelson, R.; Kokic, P.; Crimp, S.; Meinke, H.; Howden, S.M. The vulnerability of Australian rural communities to climate variability and change: Part I—Conceptualising and measuring vulnerability. Environ. Sci. Policy 2010, 13, 8–17. [Google Scholar] [CrossRef]
- Piya, L.; Joshi, N.P.; Maharjan, K.L. Vulnerability of Chepang households to climate change and extremes in the Mid-Hills of Nepal. Clim. Chang. 2016, 135, 521–537. [Google Scholar] [CrossRef]
- Herslund, L.B.; Jalayer, F.; Jean-Baptiste, N.; Jørgensen, G.; Kabisch, S.; Kombe, W.; Lindley, S.; Nyed, P.K.; Pauleit, S.; Printz, A.; et al. A multi-dimensional assessment of urban vulnerability to climate change in Sub-Saharan Africa. Nat. Hazards 2015, 82, 149–172. [Google Scholar] [CrossRef]
- Li, Y.; Huang, H.; Ju, H.; Lin, E.; Xiong, W.; Han, X.; Wang, H.; Peng, Z.; Wang, Y.; Xu, J.; et al. Assessing vulnerability and adaptive capacity to potential drought for winter-wheat under the RCP 8.5 scenario in the Huang-Huai-Hai Plain. Agric. Ecosyst. Environ. 2015, 209, 125–131. [Google Scholar] [CrossRef]
- Noi, L.V.T.; Nitivattananon, V. Assessment of vulnerabilities to climate change for urban water and wastewater infrastructure management: Case study in Dong Nai river basin, Vietnam. Environ. Dev. 2015, 16, 119–137. [Google Scholar] [CrossRef]
- Liu, W.; Lei, X. Determination of Index And Weight of Climatological Frangibility for Agricultural Production. J. SHANXI Meteorol. 2002, 3, 32–35. [Google Scholar]
- Xu, T.; Xu, C.; Liu, Y. Research on Shanghai Comprehensive Vulnerability Assessment of Climate Change Based on PSR Model. Resour. Dev. Mark. 2015, 31, 288–292. [Google Scholar]
- Huang, D.; Zhang, R.; Huo, Z.; Mao, F.; E, Y.; Zheng, W. An assessment of multidimensional flood vulnerability at the provincial scale in China based on the DEA method. Nat. Hazards 2012, 64, 1575–1586. [Google Scholar] [CrossRef]
- Pan, H. An Overview of Domestic Researches on Assessment of Vulnerability of systems to Climate Change. Environ. Sci. Manag. 2008, 33, 30–35. [Google Scholar]
- Cai, Y.; Smit, B. Sensitivity and Adapatation of Chinese Agriculture under Global Climate Change. Acta Geogr. Sin. 1996, 51, 202–212. [Google Scholar]
- Li, K.; Chen, Y. Analysis of Vulnerability of Forest in China Responsed to Global Climate Change. Acta Geogr. Sin. 1996, 51, 40–49. [Google Scholar]
- Lin, E.; Wang, J. The sensitivily and vulnerability of China’s agriculture to global warming. Rural Eco-Enivron. 1994, 10, 1–5. [Google Scholar]
- Tan, L.; Wang, G. Spatial Analysis on Family-livelihood Vulnerability Affected by Climate Change in Arid Area: An Example of Yu-tian in XinJiang. Chin. J. Popul. Sci. 2012, 2, 67–77. [Google Scholar]
- Tan, S.; Tan, W.; Li, T.; Zhu, Y.; Zhang, Q.; Liu, B. Social Vulnerability Analysis of Herders under the Pressure of Climate Change. Chin. Rural Econ. 2016, 7, 67–80. [Google Scholar]
- Yu, Y.; Pan, H. Climate Change, Geological Disaster and Construction of Urban Disaster Prevention and Mitigation. Ecol. Secur. 2012, 6, 146–149. [Google Scholar]
- Qiu, B.; Xu, C.; Liu, Y.; Xu, T. Vulnerability Assessment of the Impact of Sea-level Rise and Storm Surges on Shanghai. Resour. Environ. Yangtze Basin 2014, 23, 149–158. [Google Scholar]
- Adger, W.; Brooks, N.; Bentham, G.; Agnew, M.; Eriksen, S. New Indicators of Vulnerability and Adaptive Capacity; Tyndall Centre for Climate Change Research: Norwich, UK, 2004. [Google Scholar]
- Balica, S. Flood vulnerability indices at varying spatial scales. Water Sci. Technol. 2009, 60, 2571–2580. [Google Scholar] [CrossRef] [PubMed]
- Lioubimtseva, E. A multi-scale assessment of human vulnerability to climate change in the Aral Sea basin. Environ. Earth Sci. 2015, 73, 719–729. [Google Scholar] [CrossRef]
- Brien, K.O.; Sygna, L.; Haugen, J.A.N.E. Vulnerable or resilient? A multi-scale assessment of climate impacts and vulnerability in Norway. Clim. Chang. 2004, 64, 193–225. [Google Scholar] [CrossRef]
- Brooks, N. A Conceptual Framework Vulnerability, Risk and Adaptation: A Conceptual Framework; Tyndall Centre for Climate Change Research: Norwich, UK, 2003. [Google Scholar]
- Holand, I.S.; Lujala, P.; Rød, J.K. Social vulnerability assessment for Norway: A quantitative approach. Nor. Geogr. Tidsskr. Nor. J. Geogr. 2011, 65, 1–17. [Google Scholar] [CrossRef]
- Feroz, R.A. Climate Change Vulnerability Assessment for Sustainable Urban Development: A Study on Slum Population of Kota, India Water and Environmental Studies. Master’s Thesis, Linköping University, Linköping, Sweden, 2012. [Google Scholar]
- Frigerio, I.; De Amicis, M. Mapping social vulnerability to natural hazards in Italy: A suitable tool for risk mitigation strategies. Environ. Sci. Policy 2016, 63, 187–196. [Google Scholar] [CrossRef]
- Morrow, B.H. Identifying and Mapping Community Vulnerability. Disasters 1999, 23, 1–18. [Google Scholar] [CrossRef] [PubMed]
- Mildrexler, D.; Yang, Z.; Cohen, W.B.; Bell, D.M. A forest vulnerability index based on drought and high temperatures. Remote Sens. Environ. 2015, 173, 314–325. [Google Scholar] [CrossRef]
- Zhou, Y.; Li, N.; Wu, W.; Wu, J.; Shi, P. Local spatial and temporal factors influencing population and societal vulnerability to natural disasters. Risk Anal. 2014, 34, 614–639. [Google Scholar] [CrossRef] [PubMed]
- Su, S.; Pi, J.; Wan, C.; Li, H.; Xiao, R.; Li, B. Categorizing social vulnerability patterns in Chinese coastal cities. Ocean Coast. Manag. 2015, 116, 1–8. [Google Scholar] [CrossRef]
- Sarkar, A.; Vulimiri, A.; Bose, S.; Paul, S.; Ray, S.S. Unsupervised hyperspectral image analysis with projection pursuit and MRF segmentation approach. In Proceedings of the International Conference on Artificial Intelligence and Pattern Recognition, AIPR 2008, Orlando, FL, USA, 7–10 July 2008; pp. 120–127. [Google Scholar]
- Wang, S.; Zhang, X. Projection Pursuit Dynamic Cluster Model and its Application to Water Resources Carrying Capacity Evaluation. J. Water Resour. Prot. 2010, 2, 449–454. [Google Scholar] [CrossRef]
- Quantum GIS Development Team. Quantum GIS Geographic Information System. Available online: http://qgis.org/en/site/ (accessed on 31 December 2009).
Figure 1.
Conceptual framework for social vulnerability to climate change in coastal cities.

Figure 2.
Location of the study area (the coastal region) in mainland China.

Figure 3.
Spatial patterns of the exposure index, sensitivity index, adaptability index, and SVI. (Note: Limited by available data, only two cities in Hainan Province were included in this paper).
Figure 3.
Spatial patterns of the exposure index, sensitivity index, adaptability index, and SVI. (Note: Limited by available data, only two cities in Hainan Province were included in this paper).

Figure 4.
Spatial cluster analysis (Getis-Ord Gi*) of SVI to climate change.

Figure 5.
Changes of EI, SI, AI, and SVI at the county level during urbanization.

Figure 6.
Spatial pattern of SVI differences between city districts and counties to climate change.


Table 1.
Indicators for assessing social vulnerability index (SVI) to climate change.
| No. | Indicator | Factor | Dimension of SVI | Impact to SVI | Included |
|---|---|---|---|---|---|
| 1 | Population density | People exposure | Exposure | + | ✓ |
| 2 | Rate of natural increase (RNI) | + | ✓ | ||
| 3 | Employees in primary industry | + | ✓ | ||
| 4 | GDP in primary sector | Economic exposure | + | ✓ | |
| 5 | GDP density | + | ✓ | ||
| 6 | Houses with no bath facilities | House exposure | + | ✓ | |
| 7 | Houses with no lavatory | + | ✓ | ||
| 8 | Houses with no tap water | + | ✓ | ||
| 9 | Houses with no kitchen | + | ✓ | ||
| 10 | Children | People sensitivity | Sensitivity | + | ✓ |
| 11 | Elderly | + | ✓ | ||
| 12 | Household size | Family sensitivity | + | × | |
| 13 | Single parent households | + | ✓ | ||
| 14 | Female | Vulnerable group | + | ✓ | |
| 15 | Illiterate | + | ✓ | ||
| 16 | Unemployed | + | ✓ | ||
| 17 | Renter | + | ✓ | ||
| 18 | Ethnic minorities | + | ✓ | ||
| 19 | Immigration from other counties | Immigration | + | ✓ | |
| 20 | Immigration from other cities | + | ✓ | ||
| 21 | Immigration from other provinces | + | × | ||
| 22 | GDP per capita | Economic adaptability | Adaptability | − | ✓ |
| 23 | Higher education graduate | Individual adaptability | − | ✓ | |
| 24 | Educated year | − | × | ||
| 25 | Urban residents | − | × | ||
| 26 | Beds in hospital per 1000 people | Health care infrastructures | − | ✓ | |
| 27 | Physicians in hospital per 1000 people | − | ✓ | ||
| 28 | Employees in management sector | Management services | − | ✓ |
Note: “+” indicates the indicator tends to increase social vulnerability; “−” indicates the indicator tends to decrease social vulnerability, “✓” means the indicator was selected for this study, and “×” means the indicator was excluded from the SVI calculation.
Table 2.
Weighting values for SVI at the county level in the coastal areas.
| No. | Indicator | Weighting Values | Dimension | No. | Indicator | Weighting Values | Dimension |
|---|---|---|---|---|---|---|---|
| 1 | House with no lavatory | 0.37528 | E | 13 | Beds in hospital | 0.12294 | A |
| 2 | House with no bath facilities | 0.36641 | E | 14 | Ethnic minorities | 0.12271 | S |
| 3 | Employees in primary industry | 0.33666 | E | 15 | GDP per capita | 0.12145 | A |
| 4 | Houses with no tap water | 0.32098 | E | 16 | Elderly | 0.11635 | S |
| 5 | GDP in primary sector | 0.29614 | E | 17 | Single parent households | 0.10807 | S |
| 6 | Young | 0.29186 | S | 18 | Unemployed | 0.10239 | S |
| 7 | House with no kitchen | 0.23247 | E | 19 | Female | 0.09319 | S |
| 8 | Rate of natural increase (RNI) | 0.21444 | E | 20 | Immigration from other counties | 0.07198 | S |
| 9 | Employees in management sector | 0.20641 | A | 21 | Illiterate | 0.06463 | S |
| 10 | Highly educated | 0.19688 | A | 22 | GDP density | 0.05134 | E |
| 11 | Physicians in hospital | 0.16131 | A | 23 | Renter | 0.03627 | S |
| 12 | Population density | 0.15618 | E | 24 | Immigration from other cities | 0.03507 | S |
Note: “E” represents the SVI dimension of “Exposure”, “S” represents the SVI dimension of “Sensitivity” and “A” represents the SVI dimension of “Adaptability”.
Table 3.
Statistics for each level for social vulnerability index (SVI), exposure index (EI), sensitivity index (SI), and adaptability index (AI) at the county level.
Table 3.
Statistics for each level for social vulnerability index (SVI), exposure index (EI), sensitivity index (SI), and adaptability index (AI) at the county level.
| Level | SVI | Dimension 1 | Dimension 2 | Dimension 3 |
|---|---|---|---|---|
| Exposure | Sensitivity | Adaptability | ||
| High | 7.53% | 4.79% | 7.88% | 4.11% |
| High-medium | 15.75% | 25.34% | 16.44% | 10.62% |
| Medium | 23.38% | 38.01% | 21.92% | 17.12% |
| Medium-low | 39.4% | 23.97% | 32.53% | 38.01% |
| Low | 14.04% | 7.88% | 21.23% | 30.14% |
Table 4.
Differences in SVI between city districts and counties.
| Urbanization (%) | District | County | ||||||||
|---|---|---|---|---|---|---|---|---|---|---|
| Count | EI | SI | AI | SVI | Count | EI | SI | AI | SVI | |
| 0~10 | 8 | 0.37 | 0.69 | 0.06 | 1.80 | 21 | 0.36 | 1.04 | 0.04 | 2.17 |
| 10~20 | 21 | 0.31 | 0.59 | 0.08 | 1.62 | 111 | 0.38 | 0.78 | 0.07 | 1.90 |
| 20~30 | 27 | 0.31 | 0.50 | 0.11 | 1.51 | 58 | 0.36 | 0.67 | 0.08 | 1.76 |
| 30~40 | 24 | 0.28 | 0.42 | 0.17 | 1.35 | 15 | 0.33 | 0.56 | 0.12 | 1.58 |
| 40~50 | 22 | 0.31 | 0.53 | 0.15 | 1.49 | 1 | 0.42 | 0.73 | 0.05 | 1.91 |
| 50~60 | 25 | 0.29 | 0.36 | 0.18 | 1.28 | 1 | 0.31 | 0.87 | 0.05 | 1.94 |
| 60~70 | 21 | 0.30 | 0.33 | 0.23 | 1.20 | 0 | 0 | 0 | 0 | 0 |
| 70~80 | 16 | 0.32 | 0.31 | 0.23 | 1.22 | 1 | 0.35 | 1.08 | 0.13 | 2.11 |
| 80~90 | 26 | 0.34 | 0.26 | 0.30 | 1.12 | 0 | 0 | 0 | 0 | 0 |
| 90~100 | 8 | 0.37 | 0.21 | 0.27 | 1.11 | 1 | 0.27 | 1.10 | 0.11 | 2.08 |
Table 5.
Profile of social vulnerability at the city level to climate change.
| Types | EI | SI | AI | SVI | Difference between Urban and County | City Name | |
|---|---|---|---|---|---|---|---|
| District | |||||||
| 0 | − | − | + | − | optimal | / | |
| 1 | County | + | + | − | + | Large | Tianjin, Qinhuangdao, Cangzhou, Dandong, Jinzhou, Huludao, Shanghai, Nantong, Lianyungang, Yancheng, Ningbo, Wenzhou, Shaoxing, Taizhou, Fuzhou, Putian, Quanzhou, Zhangzhou, Ningde, Qingdao, Dongying, Yantai, Weifang, Weihai, Rizhao, Binzhou, Guangzhou, Shantou, Jiangmen, Zhenjiang, Maoming, Huizhou, Shanwei, Yangjiang, Chaozhou, Jieyang, Beihai, Fangchenggang, and Qinzhou |
| 2 | − | + | − | + | Large-medium | Tanshan, Dalian, Yingkou, Panjin, and Zhoushan | |
| 3 | + | + | + | + | Hangzhou | ||
| 4 | + | − | − | − | Medium | Jiaxing | |
| 5 | − | − | − | − | Small | Suzhou | |
Note: “+” shows that the average value of the counties is higher than that of the districts; “−” shows that the average value of the counties is lower than that of the districts. If there is only one index opposite to the optimal profile, the difference is classified as “small”. If there are two indexes opposite to the optimal profile, the difference is classified as “medium”. If there are three indexes opposite to the optimal profile, the difference is classified as “large-medium”. If there are four indexes opposite to the optimal profile, the difference is classified as “large”.
© 2017 by the authors. Licensee MDPI, Basel, Switzerland. This article is an open access article distributed under the terms and conditions of the Creative Commons Attribution (CC BY) license (http://creativecommons.org/licenses/by/4.0/).
Share and Cite
MDPI and ACS Style
Ge, Y.; Dou, W.; Liu, N. Planning Resilient and Sustainable Cities: Identifying and Targeting Social Vulnerability to Climate Change. Sustainability 2017, 9, 1394. https://doi.org/10.3390/su9081394
AMA Style
Ge Y, Dou W, Liu N. Planning Resilient and Sustainable Cities: Identifying and Targeting Social Vulnerability to Climate Change. Sustainability. 2017; 9(8):1394. https://doi.org/10.3390/su9081394
Chicago/Turabian StyleGe, Yi, Wen Dou, and Ning Liu. 2017. "Planning Resilient and Sustainable Cities: Identifying and Targeting Social Vulnerability to Climate Change" Sustainability 9, no. 8: 1394. https://doi.org/10.3390/su9081394
Note that from the first issue of 2016, this journal uses article numbers instead of page numbers. See further details here.