Heatstroke Risk Predictions for Current and Near-Future Summers in Sendai, Japan, Based on Mesoscale WRF Simulations


1
Department of Architecture and Building Science, Graduate School of Engineering, Tohoku University, Sendai 980-8579, Japan
2
Department of Architecture and Building Engineering, School of Environment and Society, Tokyo Institute of Technology, Yokohama 226-8502, Japan
3
Department of Geography, College of Letters, Ritsumeikan University, Kyoto 603-8577, Japan
*
Author to whom correspondence should be addressed.
Sustainability 2017, 9(8), 1467; https://doi.org/10.3390/su9081467
Submission received: 30 June 2017
/
Revised: 13 August 2017
/
Accepted: 14 August 2017
/
Published: 18 August 2017
(This article belongs to the Special Issue Urban Heat Island)
Abstract
:The incidence of heatstroke has been increasing in Japan, and future climate change is likely to increase heatstroke risk. We therefore developed a method to quantify the spatial distribution of outdoor heatstroke risk and predicted future changes in this risk considering the predicted climate change in Sendai, Japan. Heatstroke risk was quantified by assessing hazard, vulnerability and exposure. Daily maximum wet-bulb globe temperature (WBGT) was selected as the hazard index. The distribution of WBGT was predicted by mesoscale meteorological simulations using the Weather Research and Forecasting (WRF) model. The relationship between daily maximum WBGT and the daily incidence rate was approximated by analyzing emergency transport data. This relationship was selected as the vulnerability index. Using the hazard and vulnerability indices, a spatial distribution of the monthly incidence rate was obtained. Finally, the total number of heatstroke patients per month was estimated by multiplying the monthly incidence rate by the population density. The outdoor heatstroke risk for August was then estimated for current (2000s) and near-future (2030s) climatic conditions in Sendai. WBGT at coastal areas in the 2030s increased owing to increases in humidity, while WBGT at inland areas increased owing to increases in air temperature. This increase in WBGT drove increases in heatstroke risk.
1. Introduction
Urban areas are subject to increasing temperatures due to urbanization and global warming. The Intergovernmental Panel on Climate Change (IPCC) has concluded that warming of 0.3 to 4.8 °C by the end of the 21st century is probable [1]. Global warming and urban heat island effects cause serious problems, including increases in energy demands for cooling indoor spaces. A working group on future standard weather predictions using a global climate model (GCM) at the Architectural Institute of Japan has developed a method for constructing standard weather data for building-thermal-load calculations [2,3]. The group used data from a GCM, the Model for Interdisciplinary Research on Climate version 4 (MIROC4h) [4], as initial and boundary conditions for a regional climate model (RCM), and the Weather Research and Forecasting (WRF) model as an RCM. MIROC4h data were physically downscaled using the WRF model. Using the WRF simulation results, standard weather data were constructed for the near future (2030s) for major cities in Japan such as Tokyo, Osaka, Nagoya and Sendai.
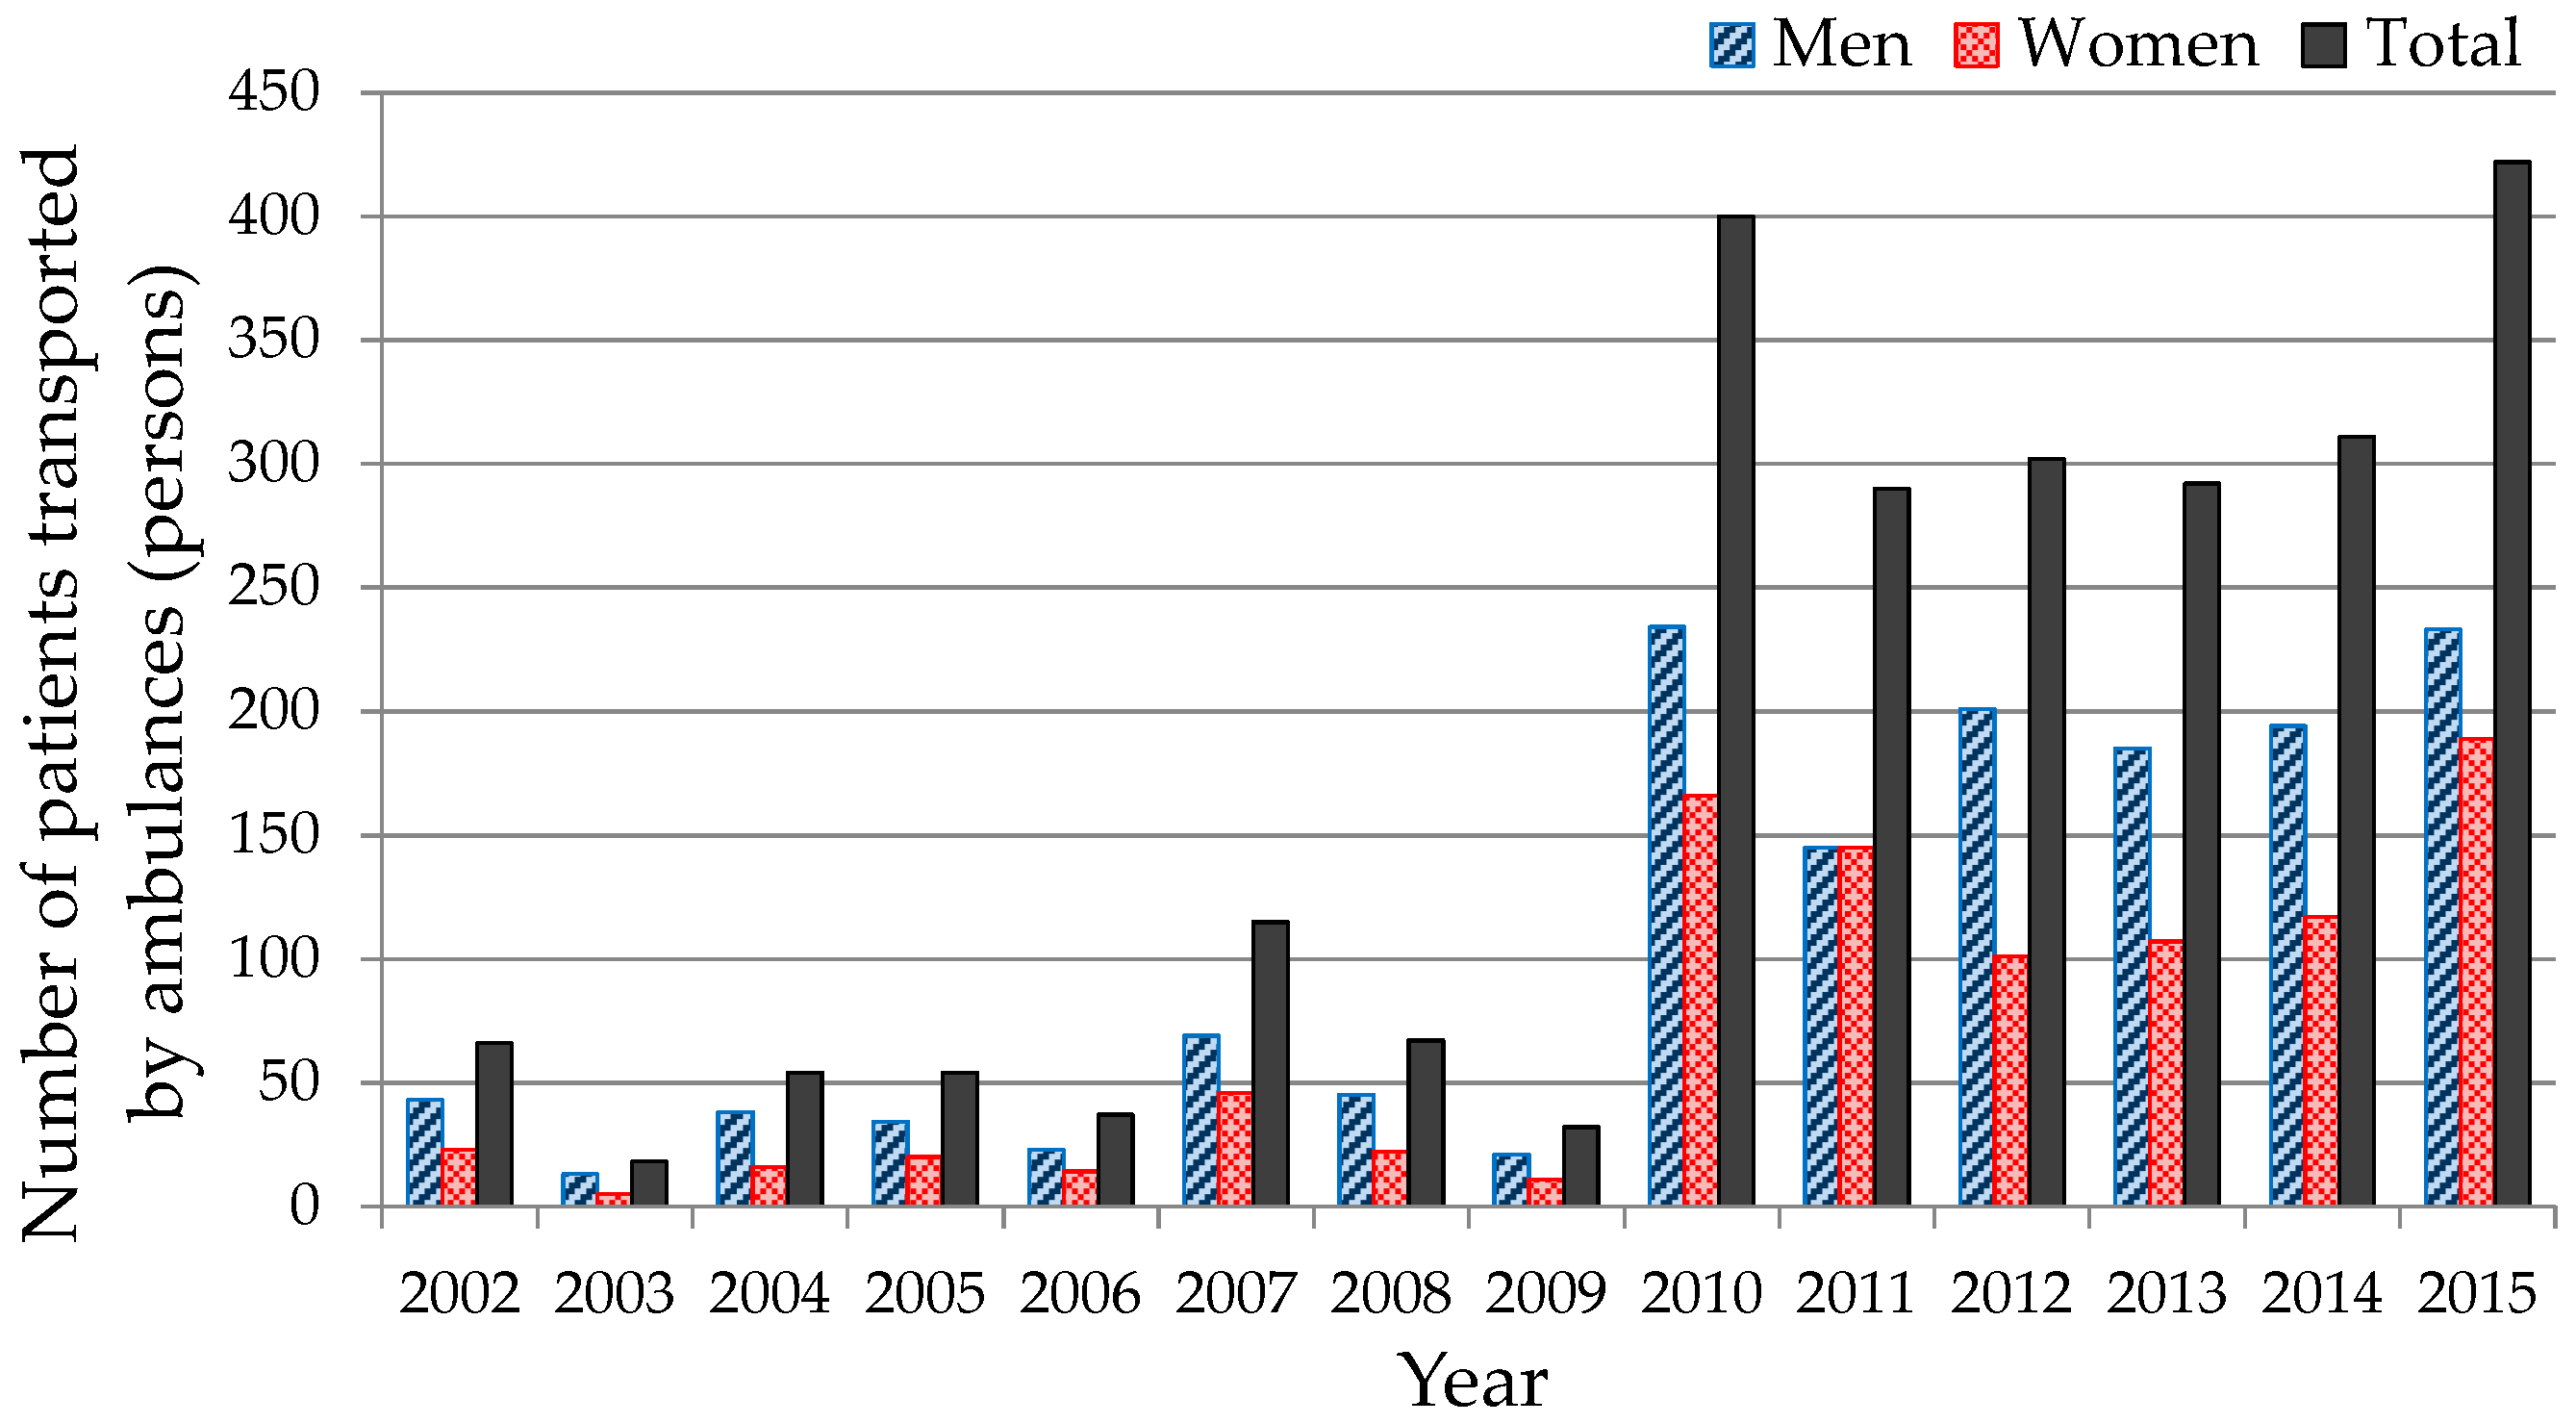
Urbanization causes temperature increases in urban areas, aggravating the increases caused by climate change. The incidence of heatstroke in Sendai, which is located about 300 km north of Tokyo, has been rapidly increasing. Figure 1 shows the number of heatstroke patients transported by ambulances during July and August 2002–2015, in Sendai [5]. During the summer of 2010, Japan experienced a serious heat wave, and the number of heatstroke patients transported by ambulances in Sendai jumped to about ten times that of previous years. Since 2010, the number of heatstroke patients has remained elevated.
To mitigate the urban heat island effect and adapt to urban warming, various countermeasures have been proposed and assessed [6,7,8,9,10,11,12,13,14,15]. Yumino et al. assessed the impact of greening and highly reflective materials on vertical walls from the viewpoints of both mitigation and adaptation [10]. Morini et al. investigated the effectiveness of albedo increase as a strategy to mitigate the urban heat island with WRF as an example in Terni, Italy [15].
Previous research has assessed the mesoscale thermal environment from a human biometeorological point of view for various regions, based on thermal indices, including the physiological equivalent temperature, weather suitability index, humidex, and wet-bulb globe temperature (WBGT) (e.g., [16,17,18]). The Ministry of Health, Labor and Welfare of Japan established a heatstroke prevention guideline with WBGT [19], by following International Organization for Standardization (ISO) 7243 [20]. Moreover, several previous studies have estimated the risk of heatstroke in summer using WBGT as a thermal index [21,22,23]. Kusaka et al. conducted dynamical downscaling using the WRF model and the pseudo-global-warming data for the 2000s and 2070s [21]. They estimated the WBGT for some major Japanese cities from WRF outputs to provide a thermal index for the assessment of heat stress on humans, and concluded that daytime safe hours for strenuous exercise will be frequently lost in the future because of increases in the WBGT. Ohashi et al. showed that the incidence rate of heatstroke increased rapidly when the WBGT exceeded 27–28 °C [22]. They used the simulated daily maximum WBGT as an index for outdoor heat stress and estimated the heatstroke risk for Tokyo, Japan, in 2010. However, the accuracy of the method used to estimate the risk was not validated. Kikumoto et al. estimated both the current and near-future incidence rates of heatstroke in the Tokyo metropolitan area [23], and predicted that the incidence rate in August would increase by 63% from the 2000s to the 2030s. However, the effects of population distribution were not discussed, and thus the total number of heatstroke patients in summer was not assessed. The total number of heatstroke patients should be evaluated in Sendai where the average temperature in August from 2000–2009 was approximately 3.5 °C lower than Tokyo, because the heatstroke risk may possibly increase in the future.
This study proposed a method for estimating the heatstroke risk index, which is here defined as the total number of outdoor heatstroke patients transported by ambulances per square kilometer per month. To validate the proposed method, the number of heatstroke patients in Sendai was estimated for 2010 and compared with recorded observation data. Then, the impact of climate change on heatstroke risk in Sendai was quantitatively evaluated by applying the proposed method for current (2000s) and near-future (2030s) climatic conditions.
2. Materials and Methods
2.1. Method for Heatstroke Risk Estimation
2.1.1. Conceptual Model for Disaster Risk Evaluation
We developed a method to evaluate the heatstroke risk by following the conceptual model used to evaluate disaster risks in the field of disaster prevention [24].
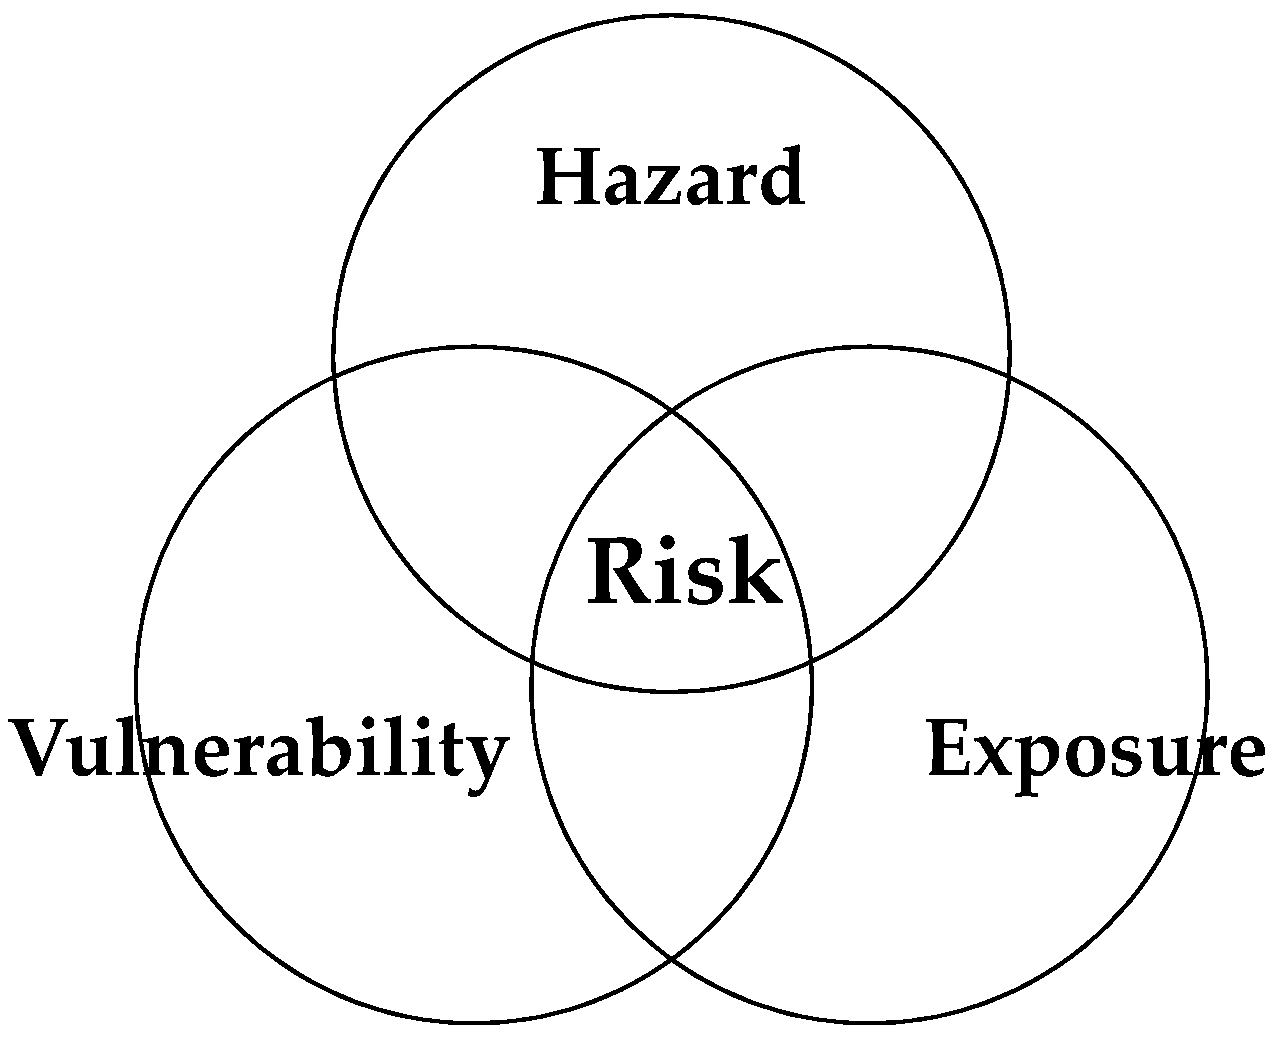
Figure 2 illustrates the conceptual model for disaster risk evaluation. In the field of disaster prevention, the risk of disasters, such as earthquakes, hurricanes or floods, is largest for locations where the hazard, vulnerability and exposure intersect [24]. The term “hazard” incorporates dangerous factors that can cause natural disasters, and “vulnerability” represents potential weaknesses that increase the disaster risk for a region. Vulnerability is often considered to comprise two factors: physical and social vulnerability. Physical, or technological, vulnerability increases with weaknesses in urban structures, foundations or infrastructure. Social vulnerability increases with the high average age of the population, lack of experience with a given disaster, and any collapse in community cohesion. The term “exposure” represents the presence of people in places that could be adversely affected by a hazard, and is generally quantified as the population in the region of interest.
2.1.2. Development of a Method for Quantitatively Estimating the Heatstroke Risk
In this study, the heatstroke risk was defined as the number of outdoor heatstroke patients transported by ambulances for a given location and time period. The risk was estimated based on the disaster risk evaluation concept described above. The three indices of hazard, vulnerability and exposure were defined as the daily maximum WBGT, the daily heatstroke incidence rate in daytime population per 1,000,000 persons (IRday), which is a function of the daily maximum WBGT, and the daytime population density, respectively.
The WBGT is an empirical index widely used to evaluate the heat stress for outdoor activities in hot or humid weather [25]. The daily maximum WBGT was selected as the hazard index for calculating the heatstroke risk because of the strong relationship between the maximum WBGT on a given day and the number of heatstroke patients. The outdoor WBGT is calculated from Equation (1) [26,27]:
where Ta is the dry-bulb temperature (°C), Tw is the wet-bulb temperature (°C), and Tg is the globe temperature (°C).
WBGT = 0.1Ta + 0.7Tw + 0.2Tg
Figure 3 shows the flowchart for WBGT calculations using the outputs from the WRF model. Ta was set to 2-m air temperature, which was obtained directly from the WRF simulations. Tw and Tg were estimated from several WRF outputs. Several models for estimating Tw have been proposed. The Ministry of the Environment in Japan estimated Tw using the equations proposed by Iribarne and Godson [28]. Kikumoto et al. employed the Sprung formula to estimate Tw using the outputs from the WRF model and calculated the WBGT [23]. In this study, Tw was estimated using the same equations employed by the Ministry of the Environment in Japan, using air temperature, absolute humidity, and atmospheric pressure [28,29]. Similarly, some models for estimating Tg have also been developed [30,31]. In this study, Equation (2), which was proposed by Tonouchi and Murayama [30], was selected to estimate Tg. Equation (2) is an empirical formula analyzed from measurement data recorded at meteorological stations in Japan:
where S is global solar radiation (W/m2) and v is wind velocity (m/s). Equation (2) was employed by Kikumoto et al. to estimate Tg with WRF simulation outputs [23]. The solar radiation to the ground surface and the horizontal wind velocity at 10 m were obtained from WRF simulations and used for S and v, respectively. Finally, hourly estimates of the WBGT were calculated and the daily maximum WBGT was used as the hazard index for heatstroke risk evaluations.
To define the vulnerability index, the relationship between the observed daily maximum WBGT and the actual number of heatstroke patients transported by ambulance was analyzed. Emergency transport data were provided by the fire departments in five major Japanese cities: Tokyo, Nagoya, Osaka, Fukuoka and Sendai. The data included the transport date and incidence location for each heatstroke patient. The data period was from January to December, 2010–2012, for all cities except Tokyo, where data were only available from May to September, 2010–2011. We extracted all outdoor cases from the transport data to estimate the vulnerability index in each city. The daily maximum WBGT for each city was estimated using hourly meteorological observation data from automated meteorological data acquisition systems (AMeDAS) at each district meteorological observatory provided by the Japanese Meteorological Agency. The relationship between the daily maximum WBGT and the number of heatstroke patients transported by ambulances in each city was then obtained. Furthermore, to normalize the number of heatstroke patients transported by ambulance to the number of heatstroke patients per one million people, the daytime population data were estimated based on the Population Census of 2010 [32] and the Economic Census of 2009 [33]. The IRday value for a given daily maximum WBGT (IRday(Wmax,o)) is expressed in Equation (3):
where Wmax,o is the daily maximum WBGT at 1 °C interval, Nα(Wmax,o) is the total recorded number of outdoor heatstroke patients transported by ambulances in a given period when the observed daily maximum WBGT was between (Wmax,o − 0.5 °C) and (Wmax,o + 0.5 °C) (persons), Nt(Wmax,o) is the number of days in a given period for which the daily maximum WBGT is between (Wmax,o − 0.5 °C) and (Wmax,o + 0.5 °C) (days), and Np is the daytime population in a given area (persons). Figure 4 illustrates the emergency transport rates for heatstroke cases for five major cities as a function of the daily maximum WBGT. The figure indicates that people living in Sendai are more vulnerable to heatstroke compared with people in other cities. This may be due to a lack of acclimatization to severe hot weather in Sendai’s population. Among the five cities, Sendai lies in the highest latitude region, and the average temperature in Sendai in August from 2000 to 2009 was 3.5 °C lower than in Tokyo. The threshold value of the daily maximum WBGT, i.e., the values at which the number of heatstroke patients increased most rapidly, was 28.5 °C in Sendai.
Figure 5 illustrates the spatial distribution of the daytime population density per square kilometer in Miyagi prefecture (where Sendai is located) based on the Population Census of 2010 [32] and the Economic Census of 2009 [33]. These data were used to obtain the exposure index. To analyze only the impact of climate change on the future heatstroke risk, a constant population density was used. Therefore, the same daytime population density distribution was used as the exposure index in both current and near-future estimations.
2.1.3. Procedure for Estimating Heatstroke Risk
The heatstroke risk index is given by the absolute number of heatstroke patients, which was estimated as follows:
where Wmax is the estimated daily maximum WBGT using the WRF model (°C), IRmonth is the monthly incidence rate (cases/(1,000,000 persons)/month), Risk is the number of heatstroke patients transported by ambulances per square kilometer per month (persons/km2/month), and PD is the daytime population density for a given computational mesh (persons/km2). Equation (4) is the linear approximation of the risk curve for Sendai, which was obtained in this study by analyzing the actual emergency transport data and meteorological observation data as shown in Figure 4. Equation (5) means that the monthly incidence rate can be obtained by summing IRday over a month. Then, the monthly total number of heatstroke patients can be calculated by multiplying IRmonth by daytime population density using Equation (6).
In this study, the daily maximum WBGT for each day and each computational mesh was estimated from the WRF simulation output. By substituting the daily maximum WBGT into Equation (4), the incidence rate for each day (IRday) was obtained. IRmonth for August was then calculated by substituting IRday into Equation (5). Finally, the monthly total number of heatstroke patients transported by ambulances per square kilometer was estimated by substituting IRmonth and the daytime population density into Equation (6).
2.2. Outline of Mesoscale Meteorological Simulations Using the WRF Model
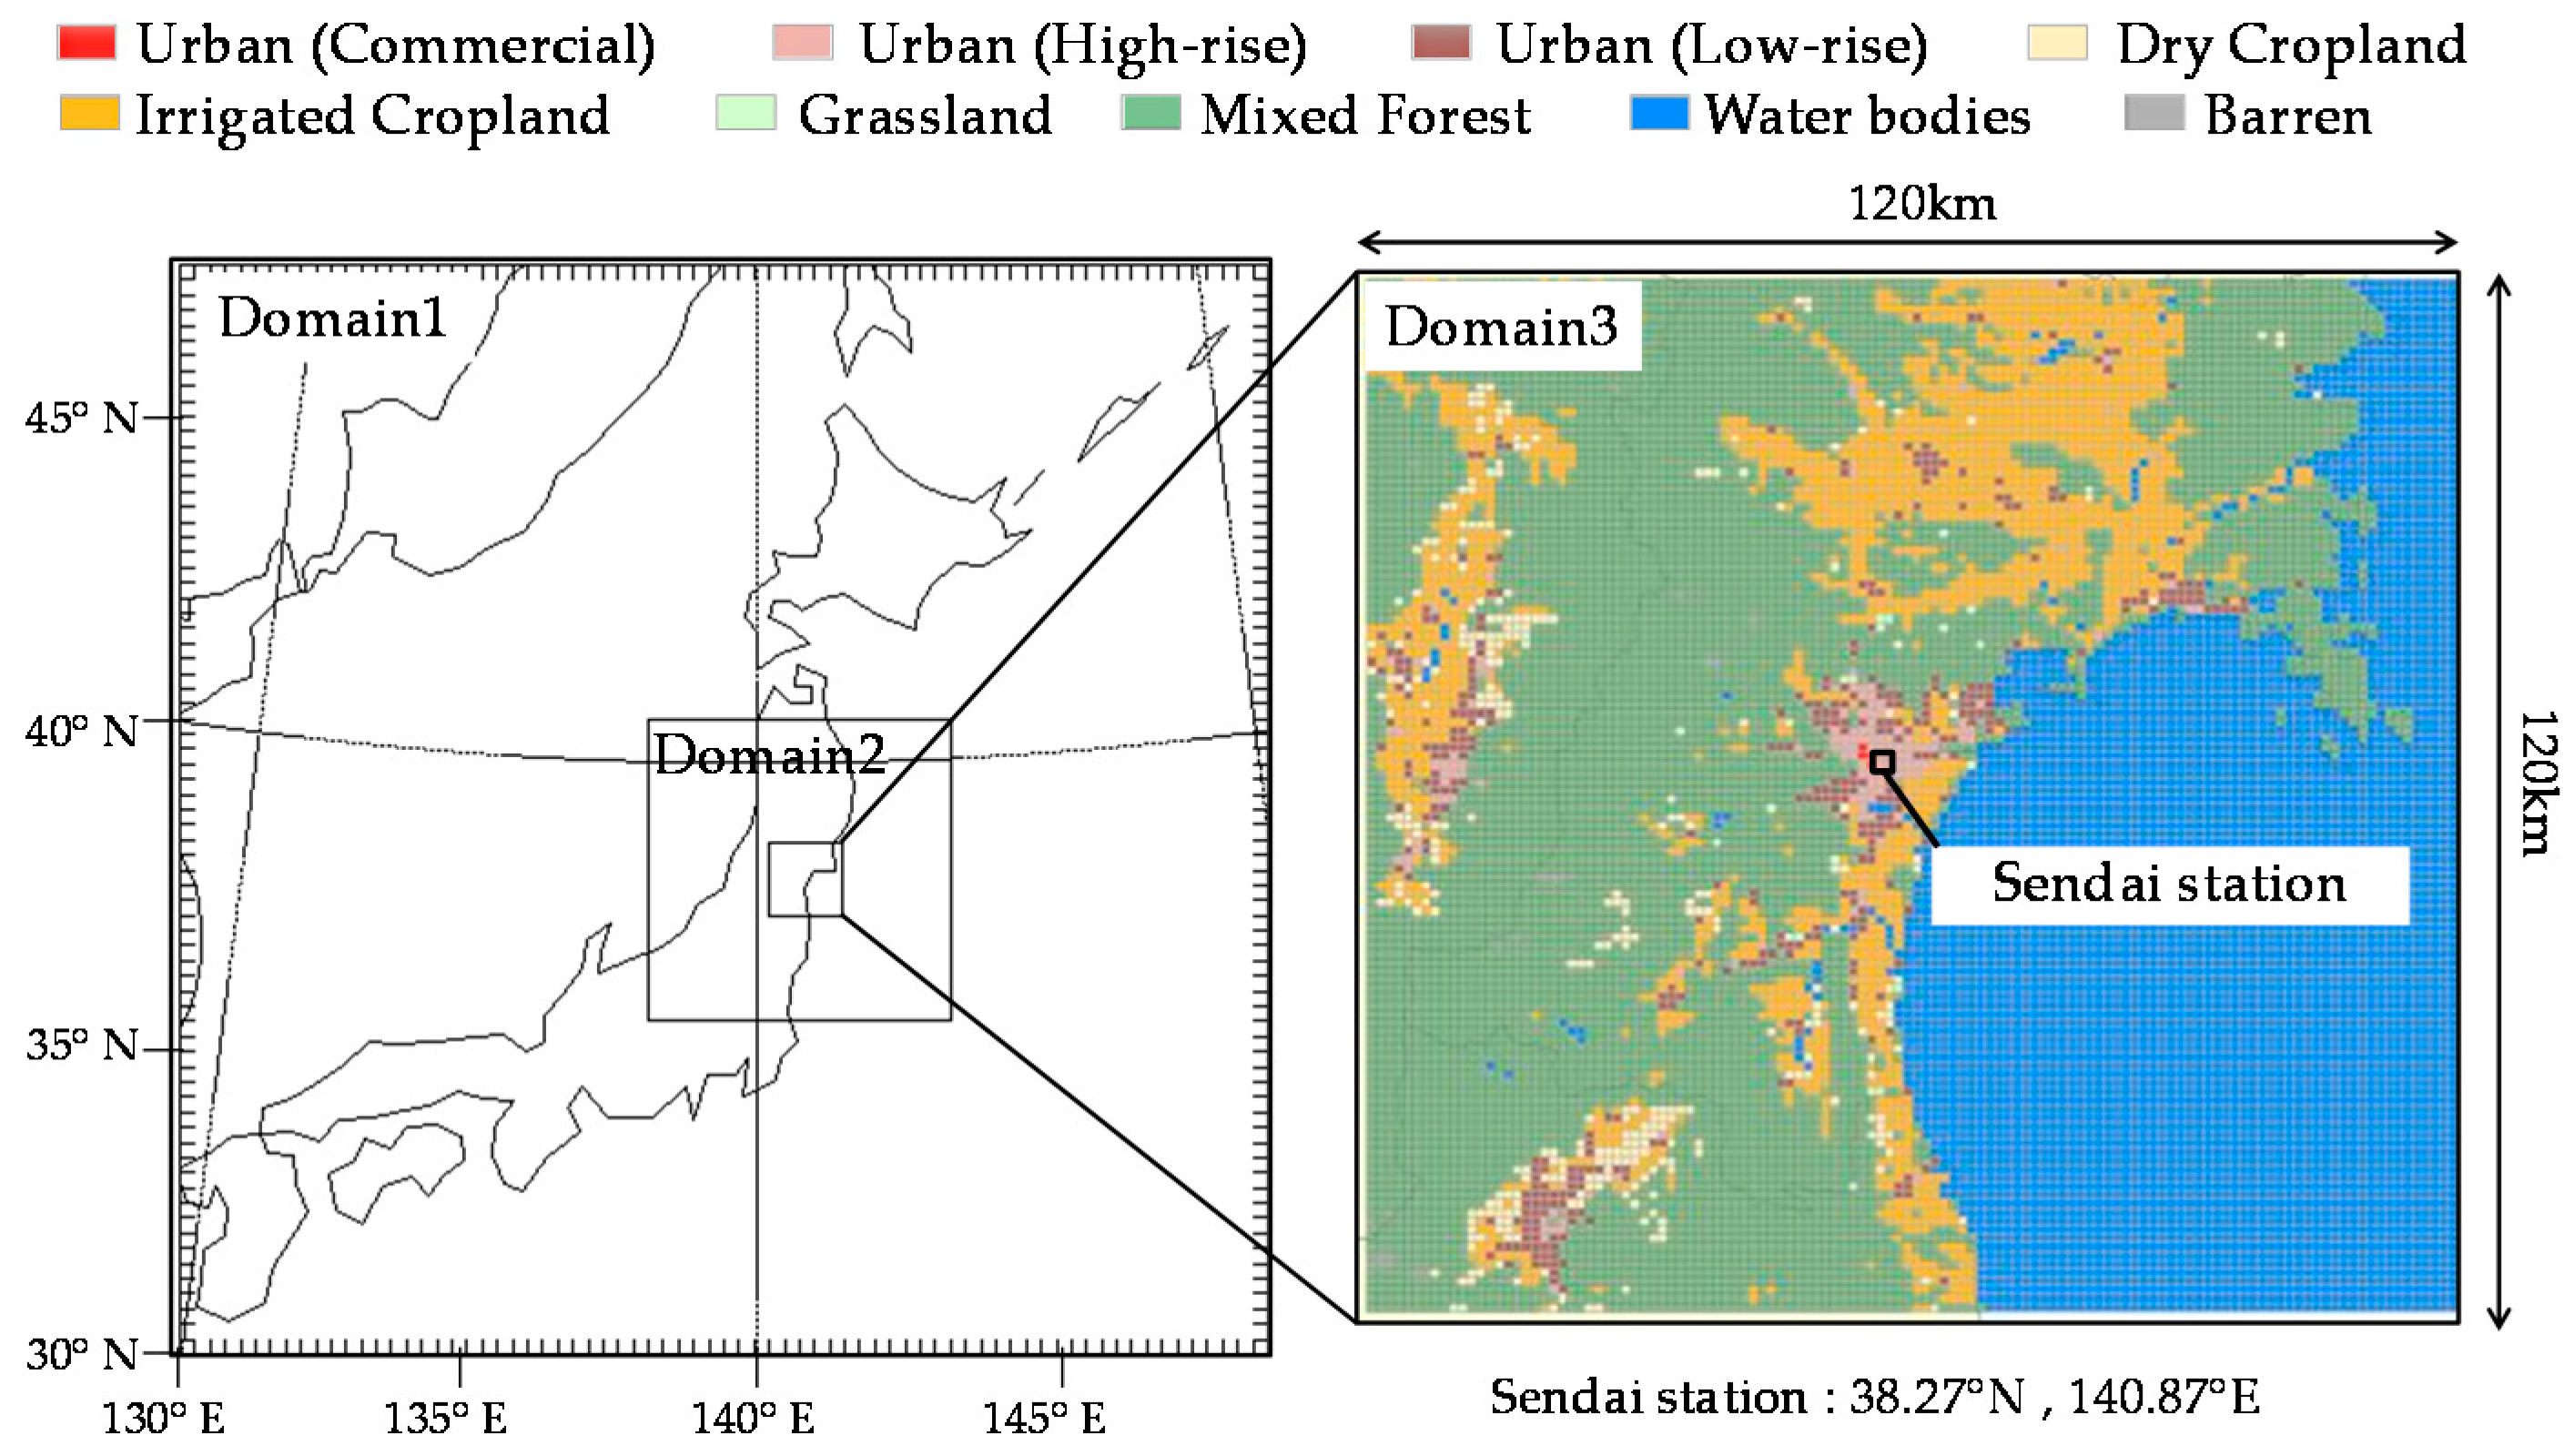
Mesoscale meteorological simulations were performed using the WRF model to obtain distributions of the daily maximum WBGT (the hazard index). Figure 6 shows the computational domains. A system of three nested grids was used in this study. The target area was Sendai, located in Miyagi Prefecture in the Tohoku region, with a population of around a million. Sendai is located approximately 300 km north of Tokyo. The east side of Sendai faces the Pacific Ocean, and the center of Sendai is 10 km from the coast.
Detailed conditions used for the domain settings are summarized in Table 1. The horizontal resolution of the smallest domain, namely Domain 3, was set to 1 km. Figure 6 shows the land-use distribution in Domain 3 used for WRF simulations. Land-use data for Domain 3 were taken from the National Land Numerical Information for Japan [34], which provides more accurate and higher resolution land-use data than the U.S. Geological Survey (USGS) land-use data employed for Domains 1 and 2.
First, we validated the accuracy of the proposed method for evaluating the heatstroke risk, as detailed in Section 3.1. A WRF simulation was run to reproduce the actual summer conditions of 2010, using the National Centers for Environmental Prediction (NCEP) Final (FNL) Operational Global Analysis data [35] as the initial conditions in all computational domains and as the boundary conditions for the largest domain.
Second, we estimated the heatstroke risk under current (2000s) and future (2030s) climatic conditions based on the proposed method, as detailed in Section 3.2 and Section 3.3. We selected MIROC4h, which follows the representative concentration pathways (RCP) 4.5 scenario [36], as the GCM. The horizontal resolution of MIROC4h data is approximately 60 km × 60 km, which cannot provide detailed distributions of the thermal environment on an urban scale. Hence, we used the WRF model to conduct simulations with a finer grid resolution to dynamically downscale MIROC4h data to predict climatic conditions on an urban scale. In this study, August 2007 and August 2034 of MIROC4h data were selected to represent current (2000s) and near-future (2030s) summer climates, respectively.
3. Results and Discussions
3.1. Method Validation for Heatstroke Risk Estimation in an Actual Situation
To validate the accuracy of the proposed method for estimating the heatstroke risk, a meteorological simulation was conducted using the WRF model with the NCEP FNL Operational Global Analysis data to reproduce actual conditions for Sendai in August 2010.
Figure 7 shows the average diurnal variations of air temperature and absolute humidity, which are important meteorological factors affecting WBGT calculations, at Sendai station in August 2010. The error bars in Figure 7 show standard deviations. The WRF simulation produced diurnal variations of air temperature that were similar to the observed data. Although the average temperature for nighttime predicted by WRF was 1 °C smaller than that by AMeDAS at the Sendai District Meteorological Observatory near Sendai station, the diurnal peak around noon predicted by WRF corresponded well with the observed value. In the morning, humidity predicted by the WRF was slightly lower than that by AMeDAS. However, data from both models showed very good agreement in the afternoon.
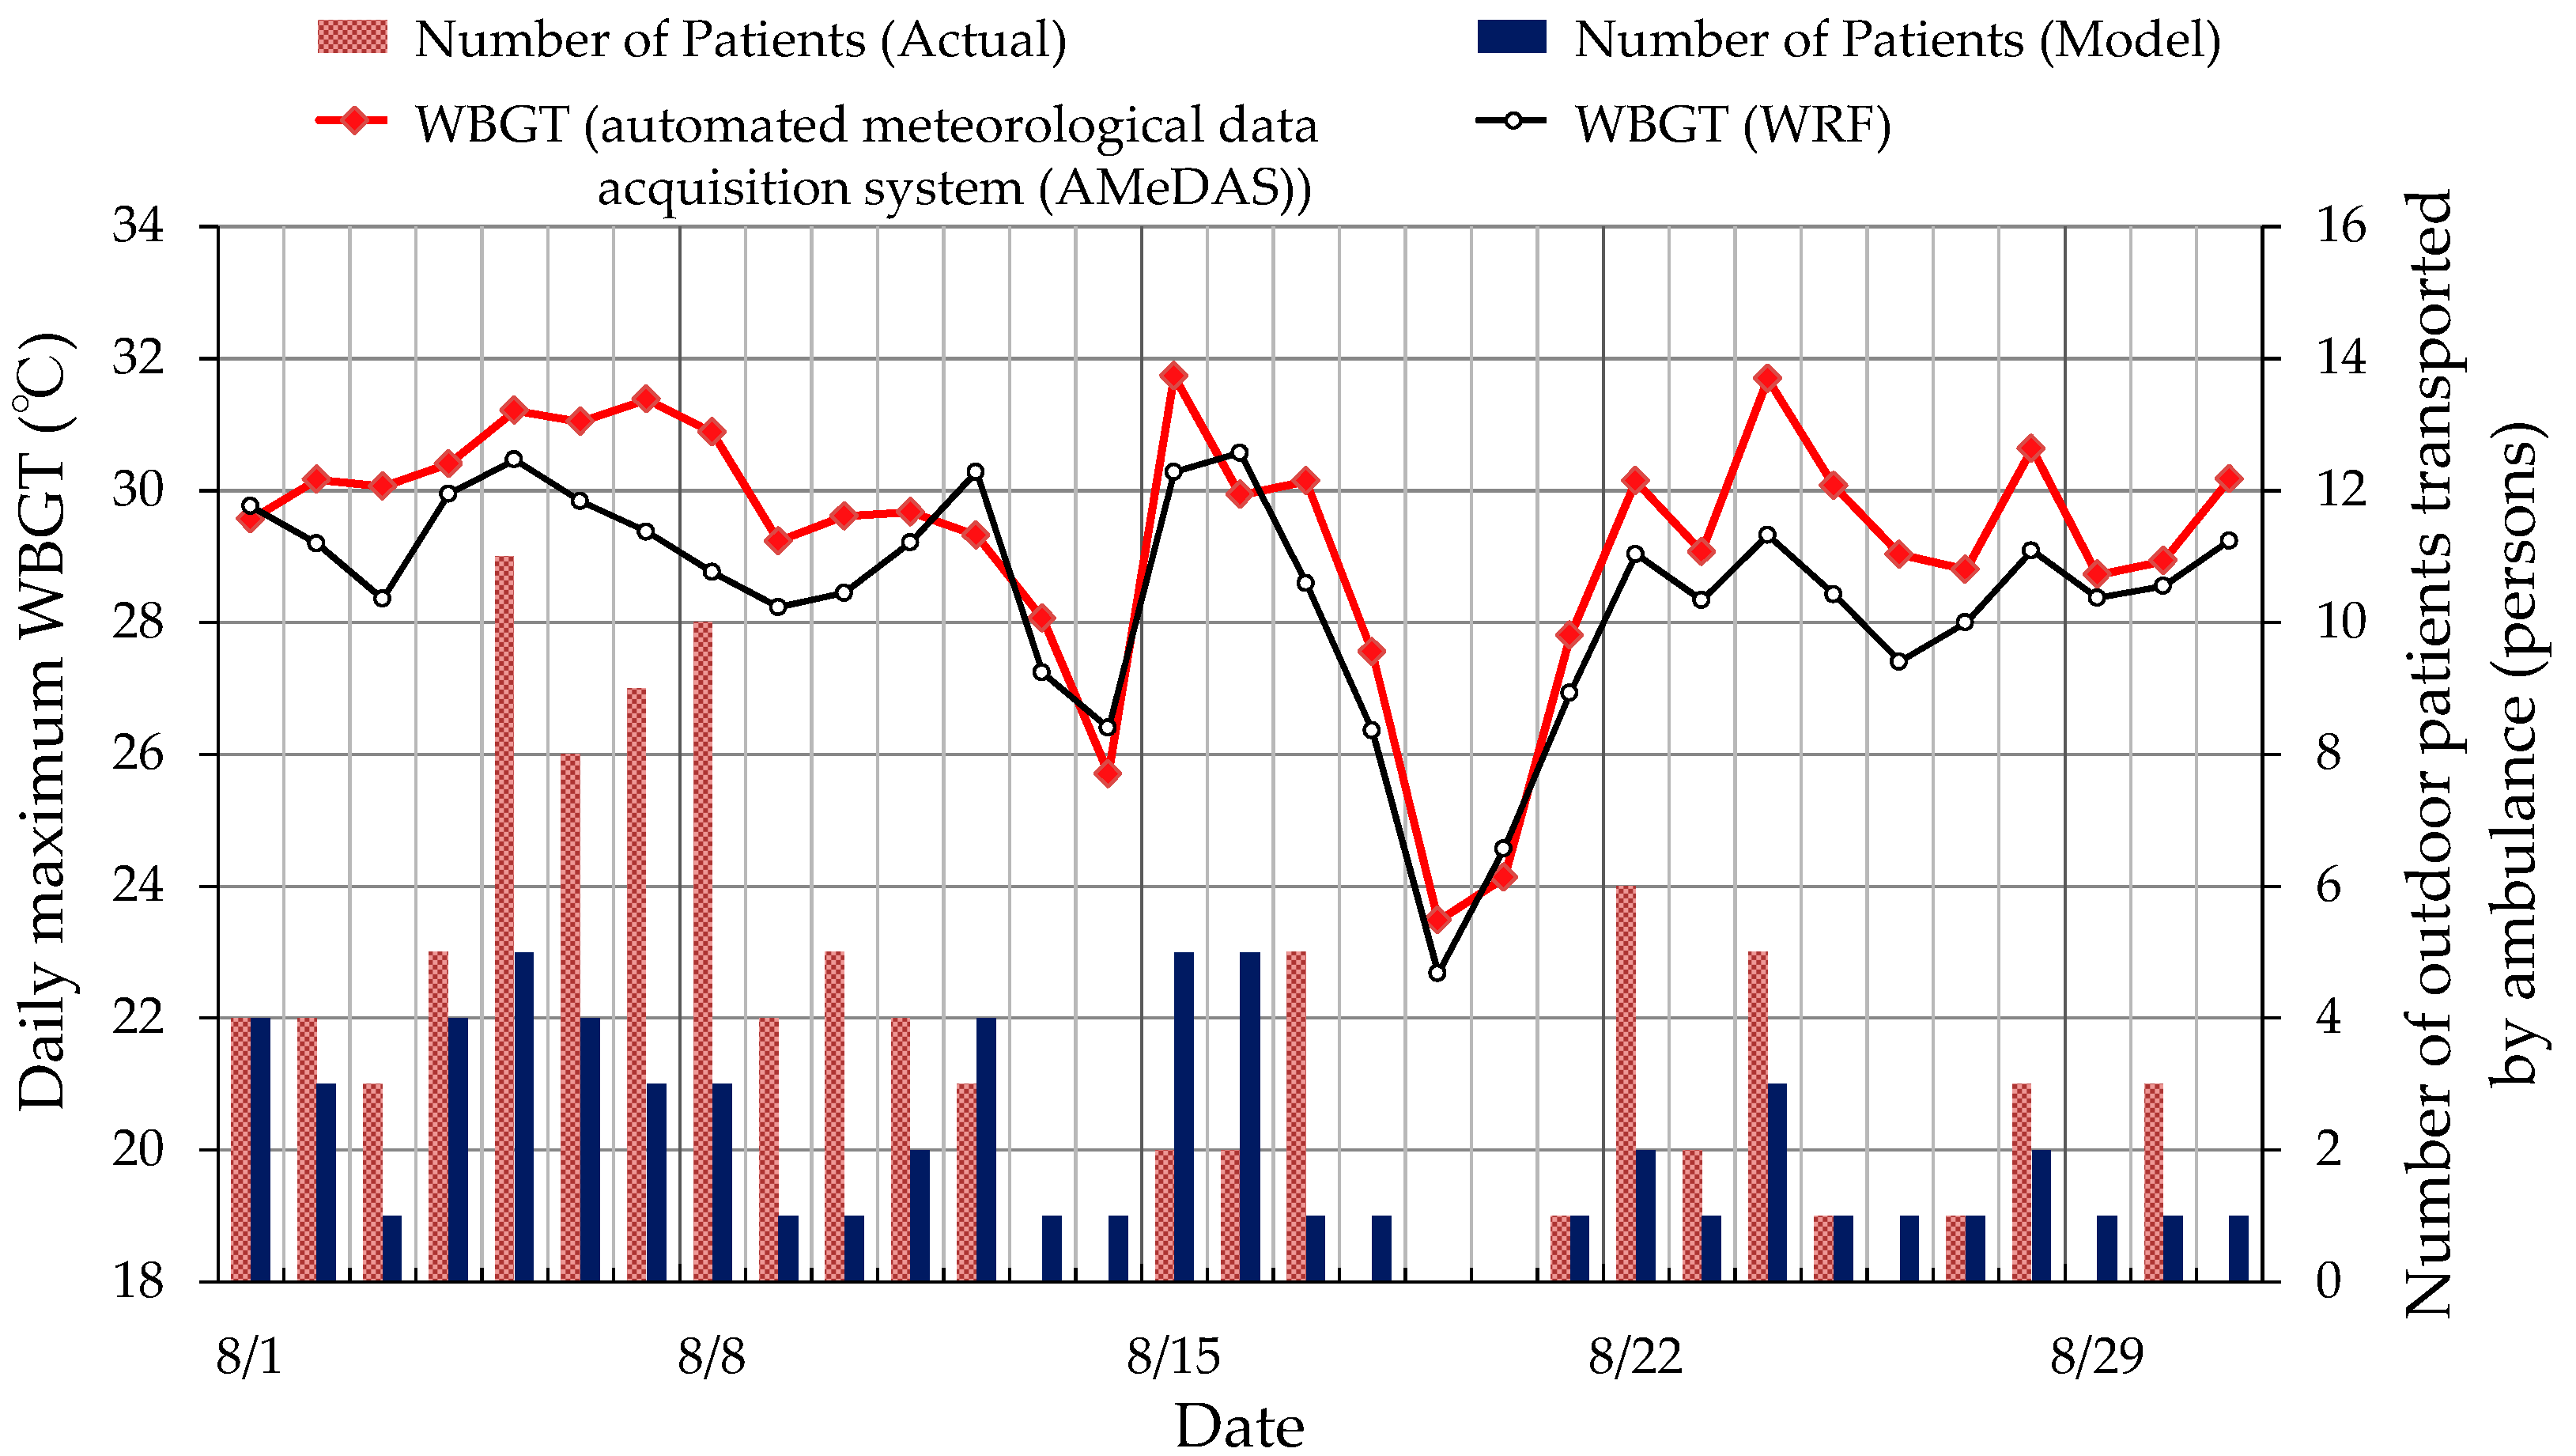
Figure 8 illustrates daily variations in the daily maximum WBGT at the Sendai District Meteorological Observatory and the total number of outdoor heatstroke patients transported by ambulance in Sendai city for August 2010. Although the monthly average value of the daily maximum WBGT from the WRF simulation is 0.9 °C lower than that from AMeDAS, the trend in the daily maximum WBGT variations predicted by the WRF model corresponds well with that calculated from AMeDAS data.
The total number of outdoor heatstroke patients predicted by the proposed method for August 2010 in Sendai was 64 persons, approximately 40% less than the observed total number. This difference was mainly caused by a gross underestimation of the number of heatstroke patients from 5 August to 11 August. However, the trend of the number of heatstroke patients obtained from WRF well reproduced the actual recorded number except for several special days. One of the biggest summer festivals in Sendai was held from 5 August to 8 August. Over two million people participated in this festival during the period, in contrast to the usual population of one million. As a result, the daytime population was doubled. Therefore, the value of exposure index might be larger than that used in this model for this period. In addition, the underestimation of the number of heatstroke patients could be attributed to the fact that the accumulation of heat stress over many days was not considered in our estimation method. In the early part of August, hot days—when the daily maximum WBGT value exceeded 28.5 °C (the threshold value for heatstroke risk in Sendai)—continued for around two weeks. Although our proposed method could not well reproduce the number of outdoor heatstroke patients from 5 August to 11 August, it accounted for 90% of the actual number of heatstroke patients for the remaining periods. Thus, we confirm that our proposed method is useful for heatstroke risk evaluation.
3.2. Results of Current and Near-Future Meteorological Simulations
To understand the impact of climate change on the heatstroke risk, we conducted a downscaling simulation for the MIROC4h data using the WRF model for current and near-future climatic conditions.
3.2.1. Meteorological Factors
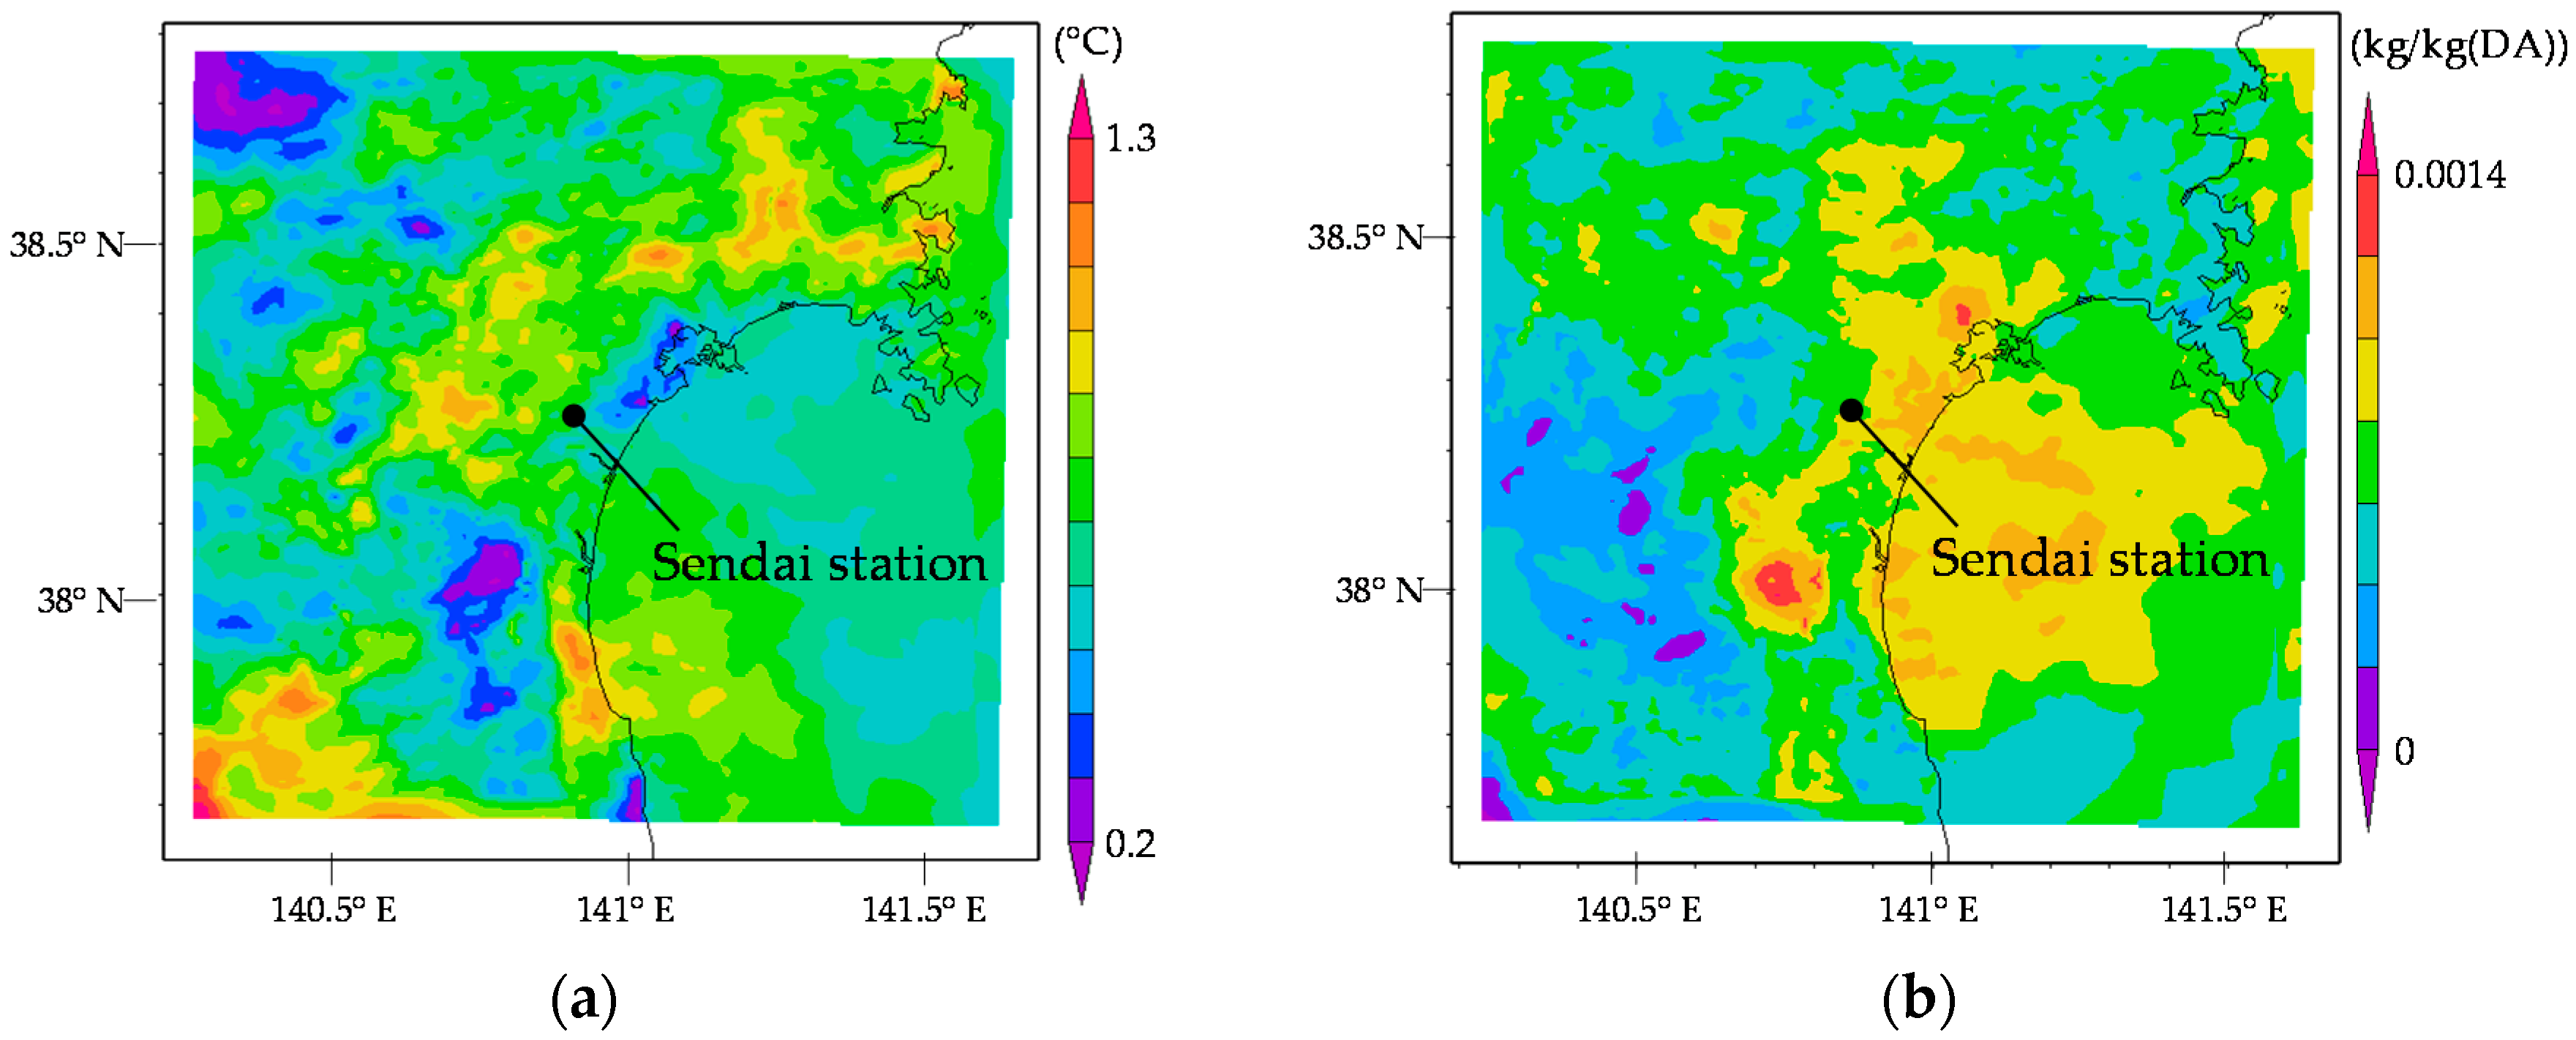
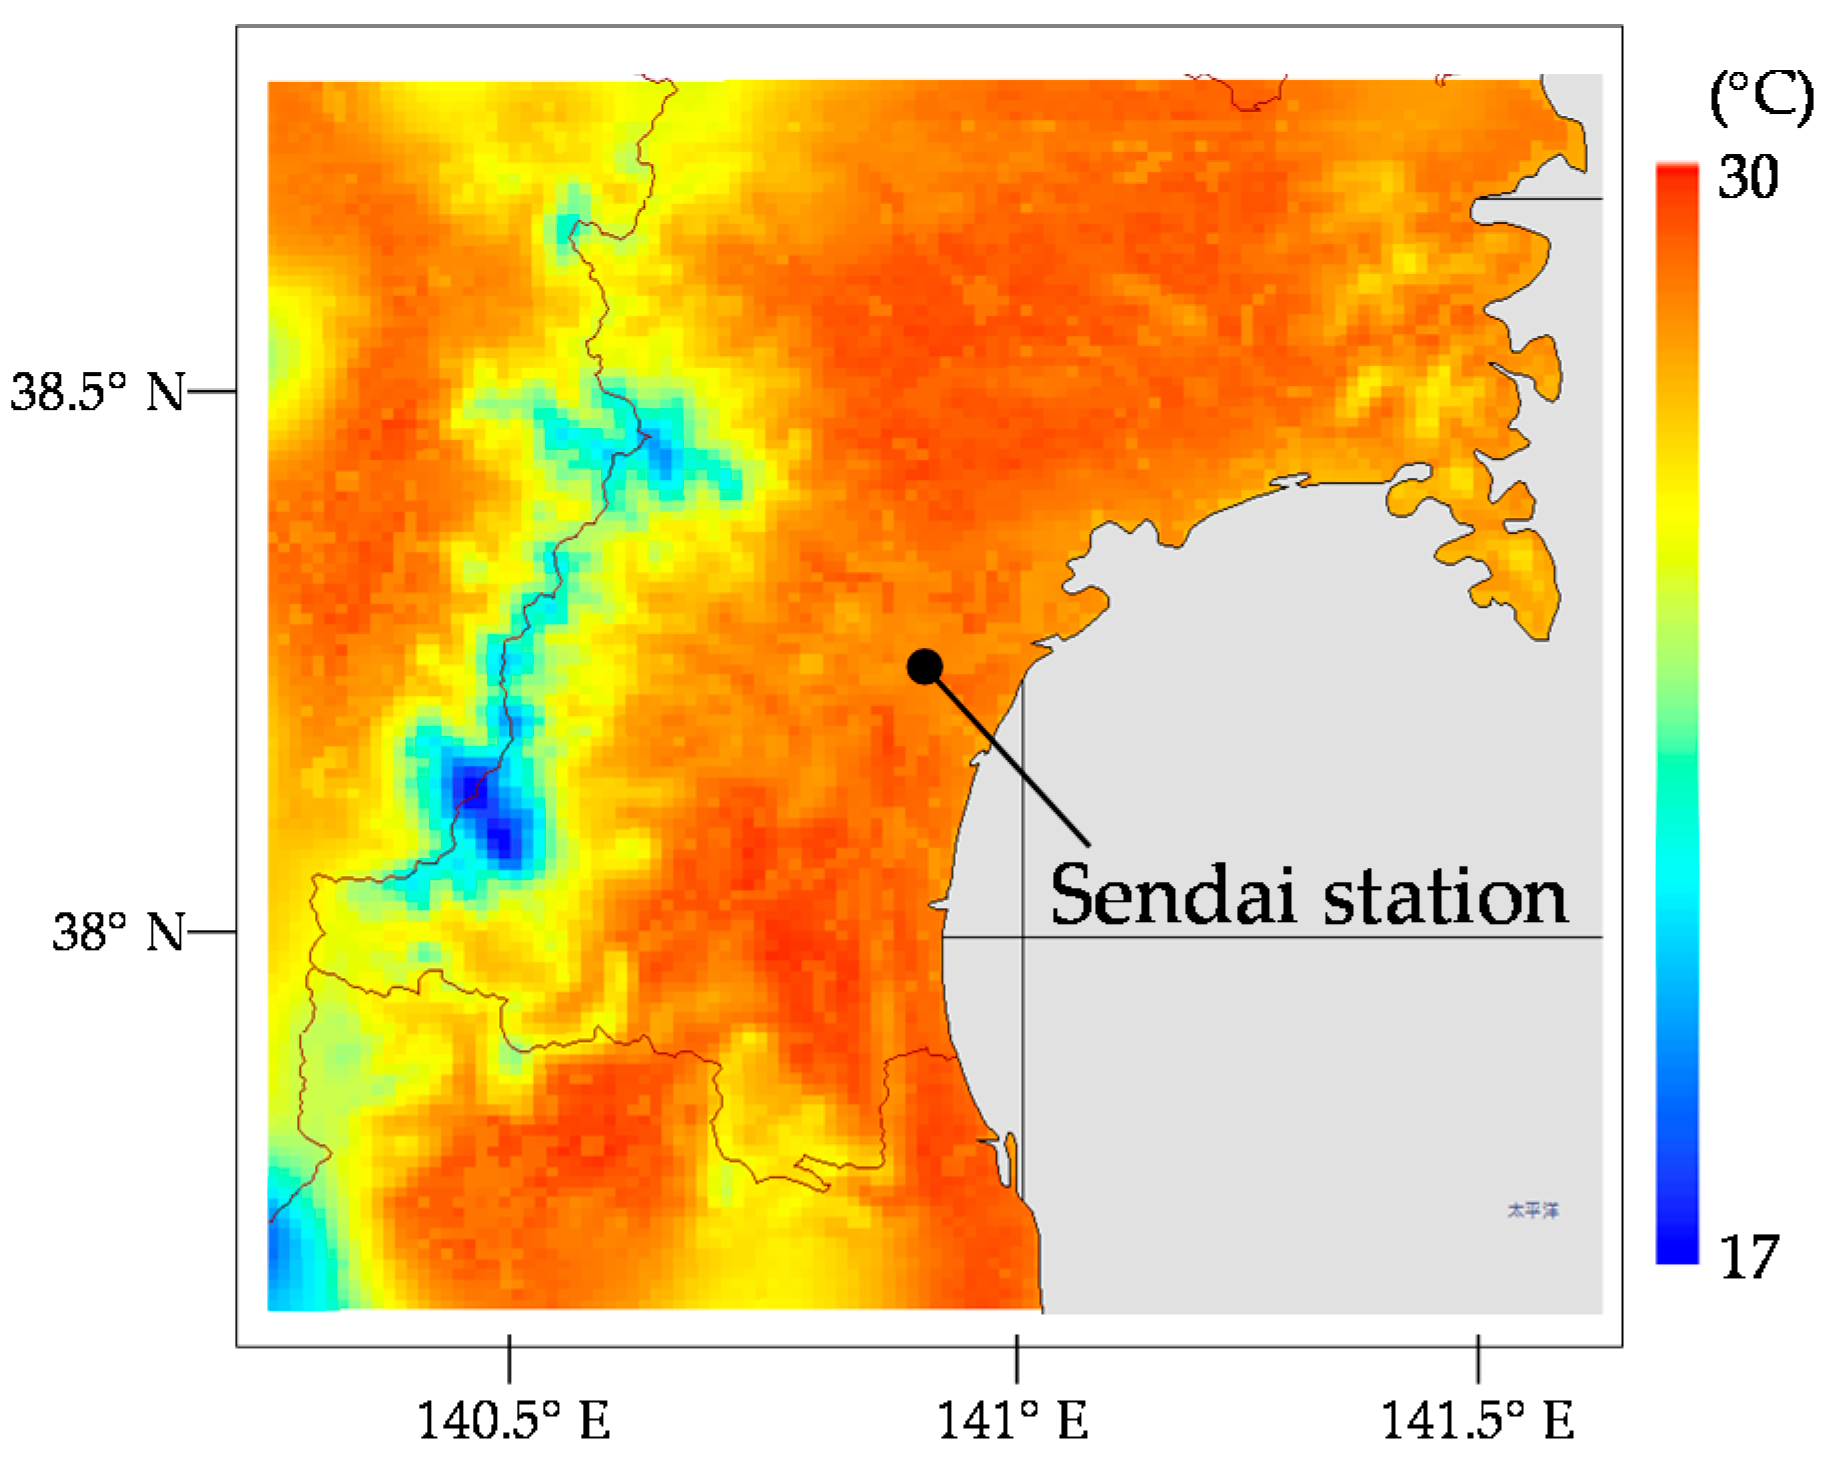
Some meteorological factors, such as temperature and humidity, were obtained from the WRF simulations. Figure 9 illustrates the spatial distribution for the monthly average 2-m air temperature and absolute humidity in Domain 3 at 12:00 p.m. Japan Standard Time (JST) in 2034. The distributions of the differences between 2007 and 2034 (2034 data minus 2007 data) for monthly average 2-m air temperature and humidity are shown in Figure 10.
Figure 9a indicates that the average air temperature in all areas exceeded 28 °C at 12:00 p.m. (JST) in August 2034, except for the mountainous western area of Sendai. Temperatures in the central part of Sendai were higher than those on the eastern coast. In the future scenario, air temperature was higher for the entire area compared with 2007. In particular, temperatures of both the inland and coastal areas of Sendai increased by about 1 °C, as shown in Figure 10a.
Humidity in the central part of Sendai was lower than in the surrounding areas (Figure 9b). As the land use in this area was categorized as “urban (commercial),” the amount of transpiration from plants may be lower than in other areas owing to a lower proportion of green spaces. In contrast, humidity in the coastal area was much higher than in the central part of Sendai. This is probably because sea breezes from the southeast (the daytime prevailing wind-direction in summer) transport moisture from the sea. However, wind velocity around coastal and inland areas decreased in the future scenario, and the absolute humidity increased, especially along the eastern coast and to the north of Sendai (Figure 10b). This increase in humidity was mainly caused by an increase in evaporation due to increased sea surface temperatures.
3.2.2. Outdoor WBGT
Figure 11 and Figure 12 illustrate the distribution of the monthly average outdoor WBGT for 12:00 p.m. (JST) in August 2034, and changes in WBGTs between 2007 and 2034, respectively.
In Figure 11, areas where WBGT exceeded 28.5 °C (the threshold value for heatstroke risk in Sendai) were found in the northern and southern inland areas of Sendai. However, WBGT in central Sendai was slightly lower than in the surrounding areas. This is because humidity was lower in central Sendai compared with the surrounding areas, even though the air temperatures were almost equal. In the future scenario, the predicted WBGT increased in almost all areas, as shown in Figure 12. Compared with 2007, the predicted WBGT was more than 1 °C higher at coastal areas, where a large increase in humidity occurred between 2007 and 2034. On the other hand, the increases in WBGT at inland areas, such as the western part of Sendai station, were mainly caused by increases in air temperature. The effects of increased air temperature and humidity area are much stronger than the effects of decreased wind velocity. These results indicate influential meteorological factors on WBGT in each region. Such information can be used to select an appropriate countermeasure to effectively decrease WBGT for each region.
3.3. Estimation of the Outdoor Incidence Rate and Risk of Heatstroke
Figure 13 illustrates the spatial distribution of the monthly incidence rate per 1,000,000 persons (IRmonth) for 2034. The potential risk for heatstroke was very high in the northern inland and southern areas of Sendai, whereas IRmonth in central Sendai was relatively low. These results confirm that IRmonth is predominantly affected by the WBGT distribution. Moreover, IRmonth increased in many places in 2034 compared with 2007 (Figure 14). In particular, the number of heatstroke patients is predicted to increase by five or more persons per million in August 2034 compared with that in August 2007, in the coastal areas, and in the northern and southern inland areas, of Sendai, where the WBGT increase rate was the highest.
The distribution of the monthly absolute number of heatstroke patients transported by ambulances (Risk (persons/km2/month)) for 2034 was obtained by multiplying IRmonth by the daytime population density in each computational mesh (Figure 15). In addition, the change in Risk values between 2007 and 2034 is shown in Figure 16. By comparing Figure 15 and Figure 5, Risk was found to be most affected by population density, with the largest number of heatstroke patients transported by ambulances observed in urban areas. Furthermore, Figure 16 shows that the predicted Risk values in urban areas increased by more than 0.1 persons/km2 in 2034. Owing to the combination of increased IRmonth and a high population density, the increases in Risk values were highest in urban areas. Some northern and southern inland areas also had relatively high Risk values due to large increases in IRmonth.
4. Conclusions
In this study, the increase in the number of heatstroke patients caused by extremely hot summer conditions was regarded as a disaster, and a method for evaluating the outdoor heatstroke risk was developed based on the concept that disasters occur when hazard, vulnerability and exposure intersect. The accuracy of the proposed method was confirmed by comparing predictions for the number of heatstroke patients estimated with the actual number of patients recorded in August 2010, in Sendai.
Following model validation, heatstroke risks for current (August 2007) and near-future (August 2034) climatic conditions in Sendai, Japan, were estimated using WRF simulations to dynamically downscale MIROC4h output data. Comparisons of the predicted results from the WRF simulations in both years showed that changes in climatic conditions were predominantly associated with increased WBGTs. The monthly average air temperature at 12:00 p.m. (JST) in August increased by 0.8 °C in central Sendai between 2007 and 2034. A larger temperature increase of 1.0 °C was observed for the inland area northwest of central Sendai, and for the coastal areas to the south. The temperature increases are driven by decreases in wind velocity for the Pacific Ocean. The absolute humidity increased between 2007 and 2034, especially along the eastern coastal and northern areas of Sendai. Alongside these climate changes, the monthly average WBGT at 12:00 p.m. (JST) in August 2034 increased for almost all areas. In particular, WBGTs around central Sendai increased by more than 1 °C owing to the combined effect of increases in humidity and temperature.
The outdoor heatstroke incidence rate in 2034 was larger than in 2007, especially in the north central and east coastal areas of Sendai. In these regions, WBGTs increased with increasing humidity and air temperature in 2034. Therefore, changes in meteorological factors caused increases in WBGTs and in the incidence rate of heatstroke. The total number of heatstroke patients increased in central Sendai, where the population density is high. The total number of heatstroke patients also increased in some parts of the northern and southern inland areas of Sendai, owing to large increases in the heatstroke incidence rate.
Acknowledgments
The authors are deeply grateful to Masahide Kimoto at the Atmosphere and Ocean Research Institute, the University of Tokyo, who provided MIROC4h data. The authors would like to thank the fire departments of Sendai, Tokyo, Nagoya, Osaka and Fukuoka for providing emergency transport data. The authors also thank the members of the working group on future standard weather prediction using GCM (Project general manager: Ryozo Ooka) for discussions on future standard climate data. This study was supported by the JSPS Grant-in-Aid for Scientific Research (B) (Grant Number 17H03349, project general manager: Akashi Mochida).
Author Contributions
All four authors significantly contributed to the scientific study and writing. Masataka Kasai performed the WRF simulations, analyzed the data, and wrote the manuscript. Tsubasa Okaze contributed to the research planning, helped with the simulation and discussion on the analyzed data from an urban climate perspective. Akashi Mochida contributed to the overall idea, research planning, and discussion of the results. Kazumasa Hanaoka prepared the population data and discussed the results from a human geography perspective.
Conflicts of Interest
The authors declare no conflict of interest.
References
- Intergovernmental Panel on Climate Change. Climate Change 2013: The Physical Science Basis; Contribution of Working Group I to the Fifth Assessment Report of the IPCC; Intergovernmental Panel on Climate Change: Geneva, Switzerland, 2013.
- Working Group for Future Standard Weather Data Using GCM Results, Sub-committee on Urban and Climate Adaptation, Research Committee on Global Environment. The near future weather data for building energy simulation using dynamical downscaling of results from global climate model. AIJ J. Technol. Des. 2014, 20, 1041–1046. [Google Scholar] [CrossRef]
- Arima, Y.; Ooka, R.; Kikumoto, H.; Yamanaka, T. Effect of climate change on building cooling loads in Tokyo in the summers of the 2030s using dynamically downscaled GCM data. Energy Build. 2016, 114, 123–129. [Google Scholar] [CrossRef]
- Sakamoto, T.T.; Komuro, Y.; Nishimura, T.; Ishii, M.; Tatebe, H.; Shiogama, H.; Hasegawa, A.; Toyoda, T.; Mori, M.; Suzuki, T.; et al. MIROC4h—A new high-resolution atmosphere-ocean coupled general circulation model. J. Meteorol. Soc. Jpn. 2012, 90, 325–359. [Google Scholar] [CrossRef]
- National Institute for Environmental Studies. Bulletin Report on Heatstroke Patients. Available online: http://www.nies.go.jp/gaiyo/archiv/risk8/ (accessed on 16 June 2017).
- Akbari, H.; Cartalis, C.; Kolokotsa, D.; Muscio, A.; Pisello, A.L.; Rossi, F.; Santamouris, M.; Synnefa, A.; Wong, N.H.; Zinzi, M. Local climate change and urban heat island mitigation techniques—The state of the art. J. Civ. Eng. Manag. 2016, 22, 1–16. [Google Scholar] [CrossRef]
- Akbari, H.; Pomerantz, M.; Taha, H. Cool surfaces and shade trees to reduce energy use and improve air quality in urban areas. Sol. Energy 2001, 70, 295–310. [Google Scholar] [CrossRef]
- Takebayashi, H.; Moriyama, M. Surface heat budget on green roof and high reflection roof for mitigation of urban heat island. Build. Environ. 2007, 42, 2971–2979. [Google Scholar] [CrossRef]
- Santamouris, M. On the energy impact of urban heat island and global warming on buildings. Energy Build. 2014, 82, 100–113. [Google Scholar] [CrossRef]
- Yumino, S.; Uchida, T.; Sasaki, K.; Kobayashi, H.; Mochida, A. Total assessment for various environmentally conscious techniques from three perspectives: Mitigation of global warming, mitigation of UHIs, and adaptation to urban warming. Sustain. Cities Soc. 2015, 19, 236–249. [Google Scholar] [CrossRef]
- Xuan, Y.; Yang, G.; Li, Q.; Mochida, A. Outdoor thermal environment for different urban forms under summer conditions. Build. Simul. 2016, 9, 281–296. [Google Scholar] [CrossRef]
- Rossi, F.; Morini, E.; Castellani, B.; Nicolini, A.; Bonamente, E.; Anderini, E.; Cotana, F. Beneficial effects of retroreflective materials in urban canyons: Results from seasonal monitoring campaign. J. Phys. 2015, 655, 012012. [Google Scholar] [CrossRef]
- Yoshida, S.; Yumino, S.; Uchida, T.; Mochida, A. Numerical analysis of the effects of windows with heat ray retro-reflective film on the outdoor thermal environment within a two-dimensional square cavity-type street canyon. Procedia Eng. 2016, 169, 384–391. [Google Scholar] [CrossRef]
- Kusaka, H.; Kimura, F.; Hirakuchi, H.; Mizutori, M. The effects of land-use alteration on the sea breeze and daytime heat island in the Tokyo metropolitan area. J. Meteorol. Soc. Jpn. 2000, 78, 405–420. [Google Scholar] [CrossRef]
- Morini, E.; Touchaei, A.G.; Castellani, B.; Rossi, F.; Cotana, F. The impact of albedo increase to mitigate the urban heat island in Terni (Italy) using the WRF model. Sustainability 2016, 8, 999. [Google Scholar] [CrossRef]
- Błażejczyk, K.; Matzarakis, A. Assessment of bioclimatic differentiation of Poland based on the human heat balance. Geogr. Pol. 2007, 80, 63–82. [Google Scholar]
- Kershaw, S.E.; Millward, A.A. A spatio-temporal index for heat vulnerability assessment. Environ. Monit. Assess. 2012, 184, 7329–7342. [Google Scholar] [CrossRef] [PubMed]
- Kjellstrom, T.; Lemke, B.; Matthias, O. Mapping occupational heat exposure and effects in South-East Asia: Ongoing time trends 1980–2011 and future estimates to 2050. Ind. Health 2013, 51, 56–67. [Google Scholar] [CrossRef] [PubMed]
- Ministry of Health, Labor and Welfare. Utilization of WBGT in Heatstroke Prevention. Available online: http://www.mhlw.go.jp/bunya/roudoukijun/anzeneisei05/ (accessed on 1 August 2017).
- International Standards Organization (ISO 7243). Hot Environments; Estimation of the Heat Stress on Working Man, Based on the WBGT-Index (Wet Bulb Globe Temperature); International Organization for Standardization: Geneva, Switzerland, 1989.
- Kusaka, H.; Masayuki, H.; Takane, Y. Urban climate projection by the WRF model at 3-km horizontal grid increment: Dynamical downscaling and predicting heat stress in the 2070’s August for Tokyo, Osaka, and Nagoya metropolises. J. Meteorol. Soc. Jpn. 2012, 90, 47–63. [Google Scholar] [CrossRef]
- Ohashi, Y.; Kikegawa, Y.; Ihara, T.; Sugiyama, N. Numerical simulations of outdoor heat stress index and heat disorder risk in the 23 wards of Tokyo. J. Appl. Meteorol. Climatol. 2014, 53, 583–597. [Google Scholar] [CrossRef]
- Kikumoto, H.; Ooka, R.; Arima, Y. A study of urban thermal environment in Tokyo in summer of the 2030s under influence of global warming. Energy Build. 2016, 114, 54–61. [Google Scholar] [CrossRef]
- Intergovernmental Panel on Climate Change. Climate Change 2014: Impacts, Adaptation, and Vulnerability 2014; Contribution of Working Group II to the Fifth Assessment Report of the IPCC; Intergovernmental Panel on Climate Change: Geneva, Switzerland, 2014.
- Epstein, Y.; Moran, D.S. Thermal comfort and the heat stress indices. Ind. Health 2006, 44, 388–398. [Google Scholar] [CrossRef] [PubMed]
- Yaglou, C.P.; Minaed, D. Control of heat casualties at military training centers. AMA Arch. Ind. Health 1957, 16, 302–316. [Google Scholar] [PubMed]
- Budd, G.M. Wet-bulb globe temperature (WBGT)—Its history and its limitations. J. Sci. Med. Sport 2008, 11, 20–32. [Google Scholar] [CrossRef] [PubMed]
- Iribarne, J.V.; Godson, W.L. Atmospheric Thermodynamics; Springer: Berlin, Germany, 2012; Volume 6. [Google Scholar]
- Tetens, O. Uber einige meteorologische Begriffe. Z. Geophys. 1930, 6, 297–309. [Google Scholar]
- Tonouchi, M.; Murayama, K. Regional characteristics for the risk of heatstroke and HWDI. Jpn. J. Biometeor. 2008, 45, S62. [Google Scholar]
- Takaichi, M.; Hosono, T.; Kurosaki, H.; Watanabe, S.; Kawashima, H.; Nakano, Y. Estimation of Wet Bulb Globe Temperature (WBGT) and Evaluation of Safe Working Time and Space in Cultivation Facility. Available online: http://www.naro.affrc.go.jp/project/results/laboratory/vegetea/2003/vegetea03-24.html (accessed on 7 August 2017).
- Ministry of Internal Affairs and Communications. National Census 2010. Available online: http://www.stat.go.jp/data/kokusei/2010/index.htm (accessed on 16 June 2017).
- Ministry of Internal Affairs and Communications. Results of Economic Census 2009. Available online: http://www.stat.go.jp/data/e-census/2009/index.htm (accessed on 16 June 2017).
- Ministry of Land, Infrastructure, Transport and Tourism. National Land Numerical Information Download Service. Available online: http://nlftp.mlit.go.jp/ksj/ (accessed on 16 June 2017).
- Kalnay, E.; Kanamitsu, M.; Kistler, R.; Collins, W.; Deaven, D.; Gandin, L.; Iredell, M.; Saha, S.; White, G.; Woollen, J.; et al. The NCEP/NCAR 40-year reanalysis project. Bull. Am. Meteorol. Soc. 1996, 77, 437–471. [Google Scholar] [CrossRef]
- Moss, R.H.; Edmonds, J.A.; Hibbard, K.A.; Manning, M.R.; Rose, S.T.; van Vuuren, D.P.; Carter, T.M.; Emoril, S.; Kainuma, M.; Kram, T.; et al. The next generation of scenarios for climate change research and assessment. Nature 2010, 463, 747–756. [Google Scholar] [CrossRef] [PubMed]
- Hong, S.Y.; Lim, J.O.J. The WRF single-moment 6-class microphysics scheme (WSM6). J. Korean Meteorol. Soc. 2006, 42, 129–151. [Google Scholar]
- Dudhia, J. Numerical study of convection observed during the winter monsoon experiment using a mesoscale two-dimensional model. J. Atmos. Sci. 1989, 46, 3077–3107. [Google Scholar] [CrossRef]
- Mlawer, E.J.; Taubman, S.J.; Brown, P.D.; Iacono, M.J.; Clough, S.A. Radiative transfer for inhomogeneous atmospheres: RRTM, a validated correlated-k model for the longwave. J. Geophys. Res. Atmos. 1997, 102, 16663–16682. [Google Scholar] [CrossRef]
- Chen, F.; Dudhia, J. Coupling an advanced land surface–hydrology model with the Penn State–NCAR MM5 modeling system. Part I: Model implementation and sensitivity. Mon. Weather Rev. 2001, 129, 569–585. [Google Scholar] [CrossRef]
- Kusaka, H.; Kimura, F. Coupling a single-layer urban canopy model with a simple atmospheric model: Impact on urban heat island simulation for an idealized case. J. Meteorol. Soc. Jpn. 2004, 82, 67–80. [Google Scholar] [CrossRef]
- Kusaka, H.; Kondo, H.; Kikegawa, Y.; Kimura, F. A simple single-layer urban canopy model for atmospheric models: Comparison with multi-layer and slab models. Bound. Layer Meteorol. 2001, 101, 329–358. [Google Scholar] [CrossRef]
- Hong, S.Y.; Noh, Y.; Dudhia, J. A new vertical diffusion package with an explicit treatment of entrainment processes. Mon. Weather Rev. 2006, 134, 2318–2341. [Google Scholar] [CrossRef]
- Kain, J.S. The Kain–Fritsch convective parameterization: An update. J. Appl. Meteorol. 2004, 43, 170–181. [Google Scholar] [CrossRef]
Figure 1.
Annual variations in the number of heatstroke patients transported by ambulances in Sendai from 2002 to 2015.
Figure 1.
Annual variations in the number of heatstroke patients transported by ambulances in Sendai from 2002 to 2015.

Figure 2.
Conceptual model for disaster risk evaluations [24].
Figure 2.
Conceptual model for disaster risk evaluations [24].

Figure 3.
Flowchart for outdoor wet-bulb globe temperature (WBGT) calculations.

Figure 4.
Relationship between the daily maximum WBGT and the daily heatstroke incidence rate (IRday).
Figure 4.
Relationship between the daily maximum WBGT and the daily heatstroke incidence rate (IRday).

Figure 5.
Distribution of the daytime population in Miyagi prefecture based on the Population Census of 2010 [32] and the Economic Census of 2009 [33].

Figure 6.
Calculation domains for Weather Research and Forecasting (WRF) simulations and the land-use map for Domain 3 made using data in 2009 [34].
Figure 6.
Calculation domains for Weather Research and Forecasting (WRF) simulations and the land-use map for Domain 3 made using data in 2009 [34].

Figure 7.
Mean diurnal variations of meteorological factors at Sendai station for August 2010, (a) air temperature; (b) absolute humidity.
Figure 7.
Mean diurnal variations of meteorological factors at Sendai station for August 2010, (a) air temperature; (b) absolute humidity.

Figure 8.
Daily variations in the number of outdoor heatstroke patients transported by ambulances and the daily maximum WBGT for August 2010.
Figure 8.
Daily variations in the number of outdoor heatstroke patients transported by ambulances and the daily maximum WBGT for August 2010.

Figure 9.
Monthly means for meteorological factors at 12:00 p.m. Japan Standard Time (JST) in August 2034, (a) air temperature at 2-m height; (b) absolute humidity at 2-m height.
Figure 9.
Monthly means for meteorological factors at 12:00 p.m. Japan Standard Time (JST) in August 2034, (a) air temperature at 2-m height; (b) absolute humidity at 2-m height.

Figure 10.
Differences in the monthly means of meteorological factors at 12:00 p.m. (JST) in August (2034 data minus 2007 data), (a) air temperature at 2-m height; (b) absolute humidity at 2-m height.
Figure 10.
Differences in the monthly means of meteorological factors at 12:00 p.m. (JST) in August (2034 data minus 2007 data), (a) air temperature at 2-m height; (b) absolute humidity at 2-m height.

Figure 11.
Monthly mean WBGT at 12:00 p.m. (JST) in August 2034.

Figure 12.
Difference in monthly mean WBGTs at 12:00 p.m. (JST) in August (2034 data minus 2007 data).
Figure 12.
Difference in monthly mean WBGTs at 12:00 p.m. (JST) in August (2034 data minus 2007 data).

Figure 13.
Monthly incidence rate (IRmonth) in August 2034.

Figure 14.
Difference in monthly incidence rates (IRmonth) in August (2034 data minus 2007 data).

Figure 15.
Number of heatstroke patients (Risk) in August 2034.

Figure 16.
Differences in the number of heatstroke patients (Risk) (2034 data minus 2007 data).


Table 1.
Domain settings for the WRF simulations.
| Domain Size (X × Y) | Grid Arrangement (X × Y × Z) | Grid Size (X × Y) | |
|---|---|---|---|
| Domain 1 | 1800 km × 1800 km | 72 × 72 × 34 | 25 km × 25 km |
| Domain 2 | 750 km × 750 km | 150 × 150 × 34 | 5 km × 5 km |
| Domain 3 | 120 km × 120 km | 120 × 120 × 34 | 1 km × 1 km |
Table 2.
Calculation conditions for the WRF simulations.
| Items | Content |
|---|---|
| Date | 21:00 (JST) 15 July to 21:00 1 September |
| Number of Vertical Grids | 34 (from the surface to the 50 hPa level) |
| Time Interval | Domain 1: 90 s; Domain 2: 30 s; Domain 3: 6 s |
| Topographic Data | Domains 1 and 2: U.S. Geological Survey |
| Domain 3: Japanese National Land Numerical Information [34] | |
| Nesting | One-way nesting |
Table 3.
Physics schemes for the WRF simulations.
| Items | Content |
|---|---|
| Microphysics | WRF single-moment six-class scheme [37] |
| Shortwave Radiation | Dudhia scheme [38] |
| Longwave Radiation | Rapid radiative transfer model scheme [39] |
| Land Surface | Noah land surface model [40] |
| + Single-layer urban canopy model [41,42] | |
| Planetary Boundary Layer | Yonsei University scheme [43] |
| Cumulus Parameterization | Domains 1 and 2: Kain-Fritsch (new Eta) scheme [44] |
| Domain 3: None |
© 2017 by the authors. Licensee MDPI, Basel, Switzerland. This article is an open access article distributed under the terms and conditions of the Creative Commons Attribution (CC BY) license (http://creativecommons.org/licenses/by/4.0/).
Share and Cite
MDPI and ACS Style
Kasai, M.; Okaze, T.; Mochida, A.; Hanaoka, K. Heatstroke Risk Predictions for Current and Near-Future Summers in Sendai, Japan, Based on Mesoscale WRF Simulations. Sustainability 2017, 9, 1467. https://doi.org/10.3390/su9081467
AMA Style
Kasai M, Okaze T, Mochida A, Hanaoka K. Heatstroke Risk Predictions for Current and Near-Future Summers in Sendai, Japan, Based on Mesoscale WRF Simulations. Sustainability. 2017; 9(8):1467. https://doi.org/10.3390/su9081467
Chicago/Turabian StyleKasai, Masataka, Tsubasa Okaze, Akashi Mochida, and Kazumasa Hanaoka. 2017. "Heatstroke Risk Predictions for Current and Near-Future Summers in Sendai, Japan, Based on Mesoscale WRF Simulations" Sustainability 9, no. 8: 1467. https://doi.org/10.3390/su9081467
Note that from the first issue of 2016, this journal uses article numbers instead of page numbers. See further details here.