A Comprehensive Evaluation of Sustainable Development Ability and Pathway for Major Cities in China


Abstract
:1. Introduction
2. Literature and Theoretical Background
3. Methodology
3.1. SBM with Undesirable Outputs
3.2. Stratification Procedure in CD-DEA: Determining Performance Levels
- Step1:
- Set l = 1 to evaluate all DMUs by model (3) to obtain the best-practice frontier that formed by (benchmarks at 1st performance level).
- Step2:
- Use to remove the DMUs on the upper frontier, if , then algorithm stop.
- Step3:
- Evaluate new subset by model (3) to obtain the sub-frontier that formed by (benchmarks at lower (l + 1th) performance level).
- Step4:
- Let . Go to step2.
3.3. Progress Measure in CD-DEA: Constructing the Benchmark-Learning Pathway
4. Empirical Application on Constructing SD Pathway for Major Cities
4.1. Sample
4.2. Results
5. Discussion
6. Summaries and Conclusions
Acknowledgments
Author Contributions
Conflicts of Interest
References
- Shen, L.; Peng, Y.; Zhang, X.; Wu, Y. An alternative model for evaluating sustainable urbanization. Cities 2012, 29, 32–39. [Google Scholar] [CrossRef]
- Steurer, R.; Langer, M.E.; Konrad, A.; Martinuzzi, A. Corporations, stakeholders and sustainable development I: A theoretical exploration of business-society relations. J. Bus. Ethnics 2005, 61, 263–281. [Google Scholar] [CrossRef]
- Hutchins, M.J.; Sutherland, J.W. An exploration of measures of social sustainability and their application to supply chain decisions. J. Clean. Prod. 2008, 16, 1688–1698. [Google Scholar] [CrossRef]
- Balmford, A.; Bruner, A.; Cooper, P.; Costanza, R.; Farber, S.; Green, R.; Jenkins, M.; Jefferiss, P.; Jessamy, V.; Madden, J.; et al. Economic reasons for conserving wild nature. Science 2002, 297, 950–953. [Google Scholar] [CrossRef] [PubMed]
- Pahl-Wostl, C.; Tàbara, D.; Bouwen, R.; Craps, M.; Dewulf, A.; Mostert, E.; Dagmar, R.; Taillieu, T. The importance of social learning and culture for sustainable water management. Ecol. Econ. 2008, 64, 484–495. [Google Scholar] [CrossRef]
- Gibbs, D. Regional development agencies and sustainable development. Reg. Stud. 1998, 32, 365–368. [Google Scholar] [CrossRef]
- Lu, W.M.; Lo, S.F. A Benchmark-Learning Roadmap for Regional Sustainable Development in China. J. Oper. Res. Soc. 2007, 58, 841–849. [Google Scholar] [CrossRef]
- Sueyoshi, T.; Yuan, Y. China’s regional sustainability and diversified resource allocation: DEA environmental assessment on economic development and air pollution. Energy Econ. 2015, 49, 239–256. [Google Scholar] [CrossRef]
- Zhou, P.; Ang, B.W. Linear programming models for measuring economy-wide energy efficiency performance. Energy Policy 2008, 36, 2911–2916. [Google Scholar] [CrossRef]
- Wang, K.; Wei, Y.M.; Zhang, X. Energy and emission efficiency patterns of Chinese regions: A multi-directional efficiency analysis. Appl. Energy 2013, 104, 105–116. [Google Scholar] [CrossRef]
- Tao, X.; Wang, P.; Zhu, B. Measuring the interprovincial CO2 emissions considering electric power dispatching in china: From production and consumption perspectives. Sustainability 2016, 8, 506. [Google Scholar] [CrossRef]
- Chen, Y.; Cook, W.D.; Du, J.; Hu, H.; Zhu, J. Bounded and discrete data and Likert scales in data envelopment analysis: Application to regional energy efficiency in China. Ann. Oper. Res. 2017, 255, 347–366. [Google Scholar] [CrossRef]
- Yang, Q.; Wan, X.; Ma, H. Assessing green development efficiency of municipalities and provinces in China integrating models of super-efficiency DEA and malmquist index. Sustainability 2015, 7, 4492–4510. [Google Scholar] [CrossRef]
- Charnes, A.; Cooper, W.W.; Li, S. Using data envelopment analysis to evaluate efficiency in the economic performance of Chinese cities. Socio-Econ. Plan. Sci. 1989, 23, 325–344. [Google Scholar] [CrossRef]
- Zhu, J. Data envelopment analysis with preference structure. J. Oper. Res. Soc. 1996, 47, 136–150. [Google Scholar] [CrossRef]
- Yuan, X.; Wang, Q.; Wang, K.; Wang, B.; Jin, J.; Wei, Y. China’s regional vulnerability to drought and its mitigation strategies under climate change: Data envelopment analysis and analytic hierarchy process integrated approach. Mitig. Adapt. Strateg. Glob. Chang. 2015, 20, 341. [Google Scholar] [CrossRef]
- Yang, W.; Lee, Y.; Hu, J. Urban sustainability assessment of taiwan based on data envelopment analysis. Renew. Sustain. Energy Rev. 2016, 61, 341–353. [Google Scholar] [CrossRef]
- Li, X.; Xu, X.; Chen, H. Temporal and spatial changes of urban efficiency in the 1990s. Acta Geogr. Sin. 2005, 60, 615–625. [Google Scholar]
- Honma, S.; Hu, J. Total-factor energy efficiency of regions in japan. Energy Policy 2008, 36, 821–833. [Google Scholar] [CrossRef]
- Storto, C.L. Ecological efficiency based ranking of cities: A combined DEA cross-efficiency and shannon’s entropy method. Sustainability 2016, 8, 124. [Google Scholar] [CrossRef]
- Mega, V. Our city, our future: Towards sustainable development in European cities. Environ. Urban. 1996, 8, 133–154. [Google Scholar] [CrossRef]
- Charnes, A.; Cooper, W.W.; Rhodes, E. Measuring the efficiency of decision making units. Eur. J. Oper. Res. 1978, 2, 429–444. [Google Scholar] [CrossRef]
- Tone, K. Slacks-based measure of efficiency in data envelopment analysis. Eur. J. Oper. Res. 2001, 130, 498–509. [Google Scholar] [CrossRef]
- Zhou, P.; Ang, B.W.; Poh, K.L. Slacks-based efficiency measures for modeling environmental performance. Ecol. Econ. 2006, 60, 111–118. [Google Scholar] [CrossRef]
- Zhu, Z.; Miao, J.; Cui, W. Measuring regional eco-efficiency: A non-oriented slacks-based measure analysis. Int. J. Earth Sci. Eng. 2014, 6, 2520–2527. [Google Scholar]
- Seiford, L.M.; Zhu, J. Context-dependent data envelopment analysis—Measuring attractiveness and progress. Omega 2003, 31, 397–408. [Google Scholar] [CrossRef]
- Lim, S.; Bae, H.; Lee, L.H. A study on the selection of benchmarking paths in DEA. Expert Syst. Appl. 2011, 38, 7665–7673. [Google Scholar] [CrossRef]
- Wu, J.; Zhu, Q.; Liang, L. CO2 emissions and energy intensity reduction allocation over provincial industrial sectors in china. Appl. Energy 2016, 166, 282–291. [Google Scholar] [CrossRef]
- Bi, G.; Song, W.; Wu, J. A clustering method for evaluating the environmental performance based on slacks-based measure. Comput. Ind. Eng. 2014, 72, 169–177. [Google Scholar] [CrossRef]
- Park, J.; Sung, S. Integrated approach to construction of benchmarking network in DEA-based stepwise benchmark target selection. Sustainability 2016, 8, 600. [Google Scholar] [CrossRef]
- Morita, H.; Hirokawa, K.; Zhu, J. A slack-based measure of efficiency in context-dependent data envelopment analysis. Omega 2005, 33, 357–362. [Google Scholar] [CrossRef]
- Li, L.B.; Hu, J.L. Ecological total-factor energy efficiency of regions in China. Energy Policy 2012, 46, 216–224. [Google Scholar] [CrossRef]
- Cooper, W.W.; Seiford, L.M.; Tone, K. Data Envelopment Analysis: A Comprehensive Text with Models, Applications, References and DEA-Solver Software, 2nd ed.; Springer: New York, NY, USA, 2007. [Google Scholar]
- Shiu, A.; Lam, P. A data envelopment analysis of the efficiency of China’s thermal power generation. Util. Policy 2001, 10, 75–83. [Google Scholar]
- Zhang, N.; Lior, N.; Jin, H. The energy situation and its sustainable development strategy in China. Energy 2011, 36, 3639–3649. [Google Scholar] [CrossRef]
- Wang, K.; Wei, Y. China’s regional industrial energy efficiency and carbon emissions abatement costs. Appl. Energy 2014, 130, 617. [Google Scholar] [CrossRef]
- Hu, J.; Wang, S. Total-factor energy efficiency of regions in China. Energy Policy 2006, 34, 3206–3217. [Google Scholar] [CrossRef]
- Zhang, B.; Bi, J.; Fan, Z.; Yuan, Z.; Ge, J. Eco-efficiency analysis of industrial system in China: A data envelopment analysis approach. Ecol. Econ. 2008, 68, 306–316. [Google Scholar] [CrossRef]
- Wu, X.; Tan, L.; Guo, J.; Wang, Y.; Liu, H.; Zhu, W. A study of allocative efficiency of PM2.5 emission rights based on a zero sum gains data envelopment model. J. Clean. Prod. 2016, 113, 1024–1031. [Google Scholar] [CrossRef]
- Saunders, P.; Shang, X. Social security reform in China’s transition to a market economy. Soc. Policy Adm. 2001, 35, 274–289. [Google Scholar] [CrossRef]
- Cai, F.; Chan, K.W. The global economic crisis and unemployment in China. Eurasian Geogr. Econ. 2009, 50, 513–531. [Google Scholar] [CrossRef]
- Banister, D. Barriers to the implementation of urban sustainability. Int. J. Environ. Pollut. 1998, 10, 65–83. [Google Scholar] [CrossRef]


| Maximum | Minimum | Mean | Std. Dev. | N | |
|---|---|---|---|---|---|
| Inputs | |||||
| Electricity consumption (billion kwh) | 1369.02 | 60.32 | 404.55 | 280.36 | 34 |
| Labors (10 thousand) | 1696.94 | 103.87 | 527.15 | 350.25 | 34 |
| Fixed investments (RMB$100 million) | 13,223.75 | 824.57 | 4589.67 | 2750.10 | 34 |
| Outputs | |||||
| GDP (RMB$100 million) | 23,567.70 | 1065.78 | 7379.71 | 5649.60 | 34 |
| SEEE (10 thousand) | 5,090,079.00 | 208,848.00 | 1,162,733.71 | 1,332,142.40 | 34 |
| Unemployment rate | 4.20 | 1.31 | 2.86 | 0.74 | 34 |
| Air Pollution Index | 8.80 | 2.49 | 5.83 | 1.55 | 34 |
| PM2.5 (ug/m3) | 96.00 | 22.00 | 55.94 | 18.01 | 34 |
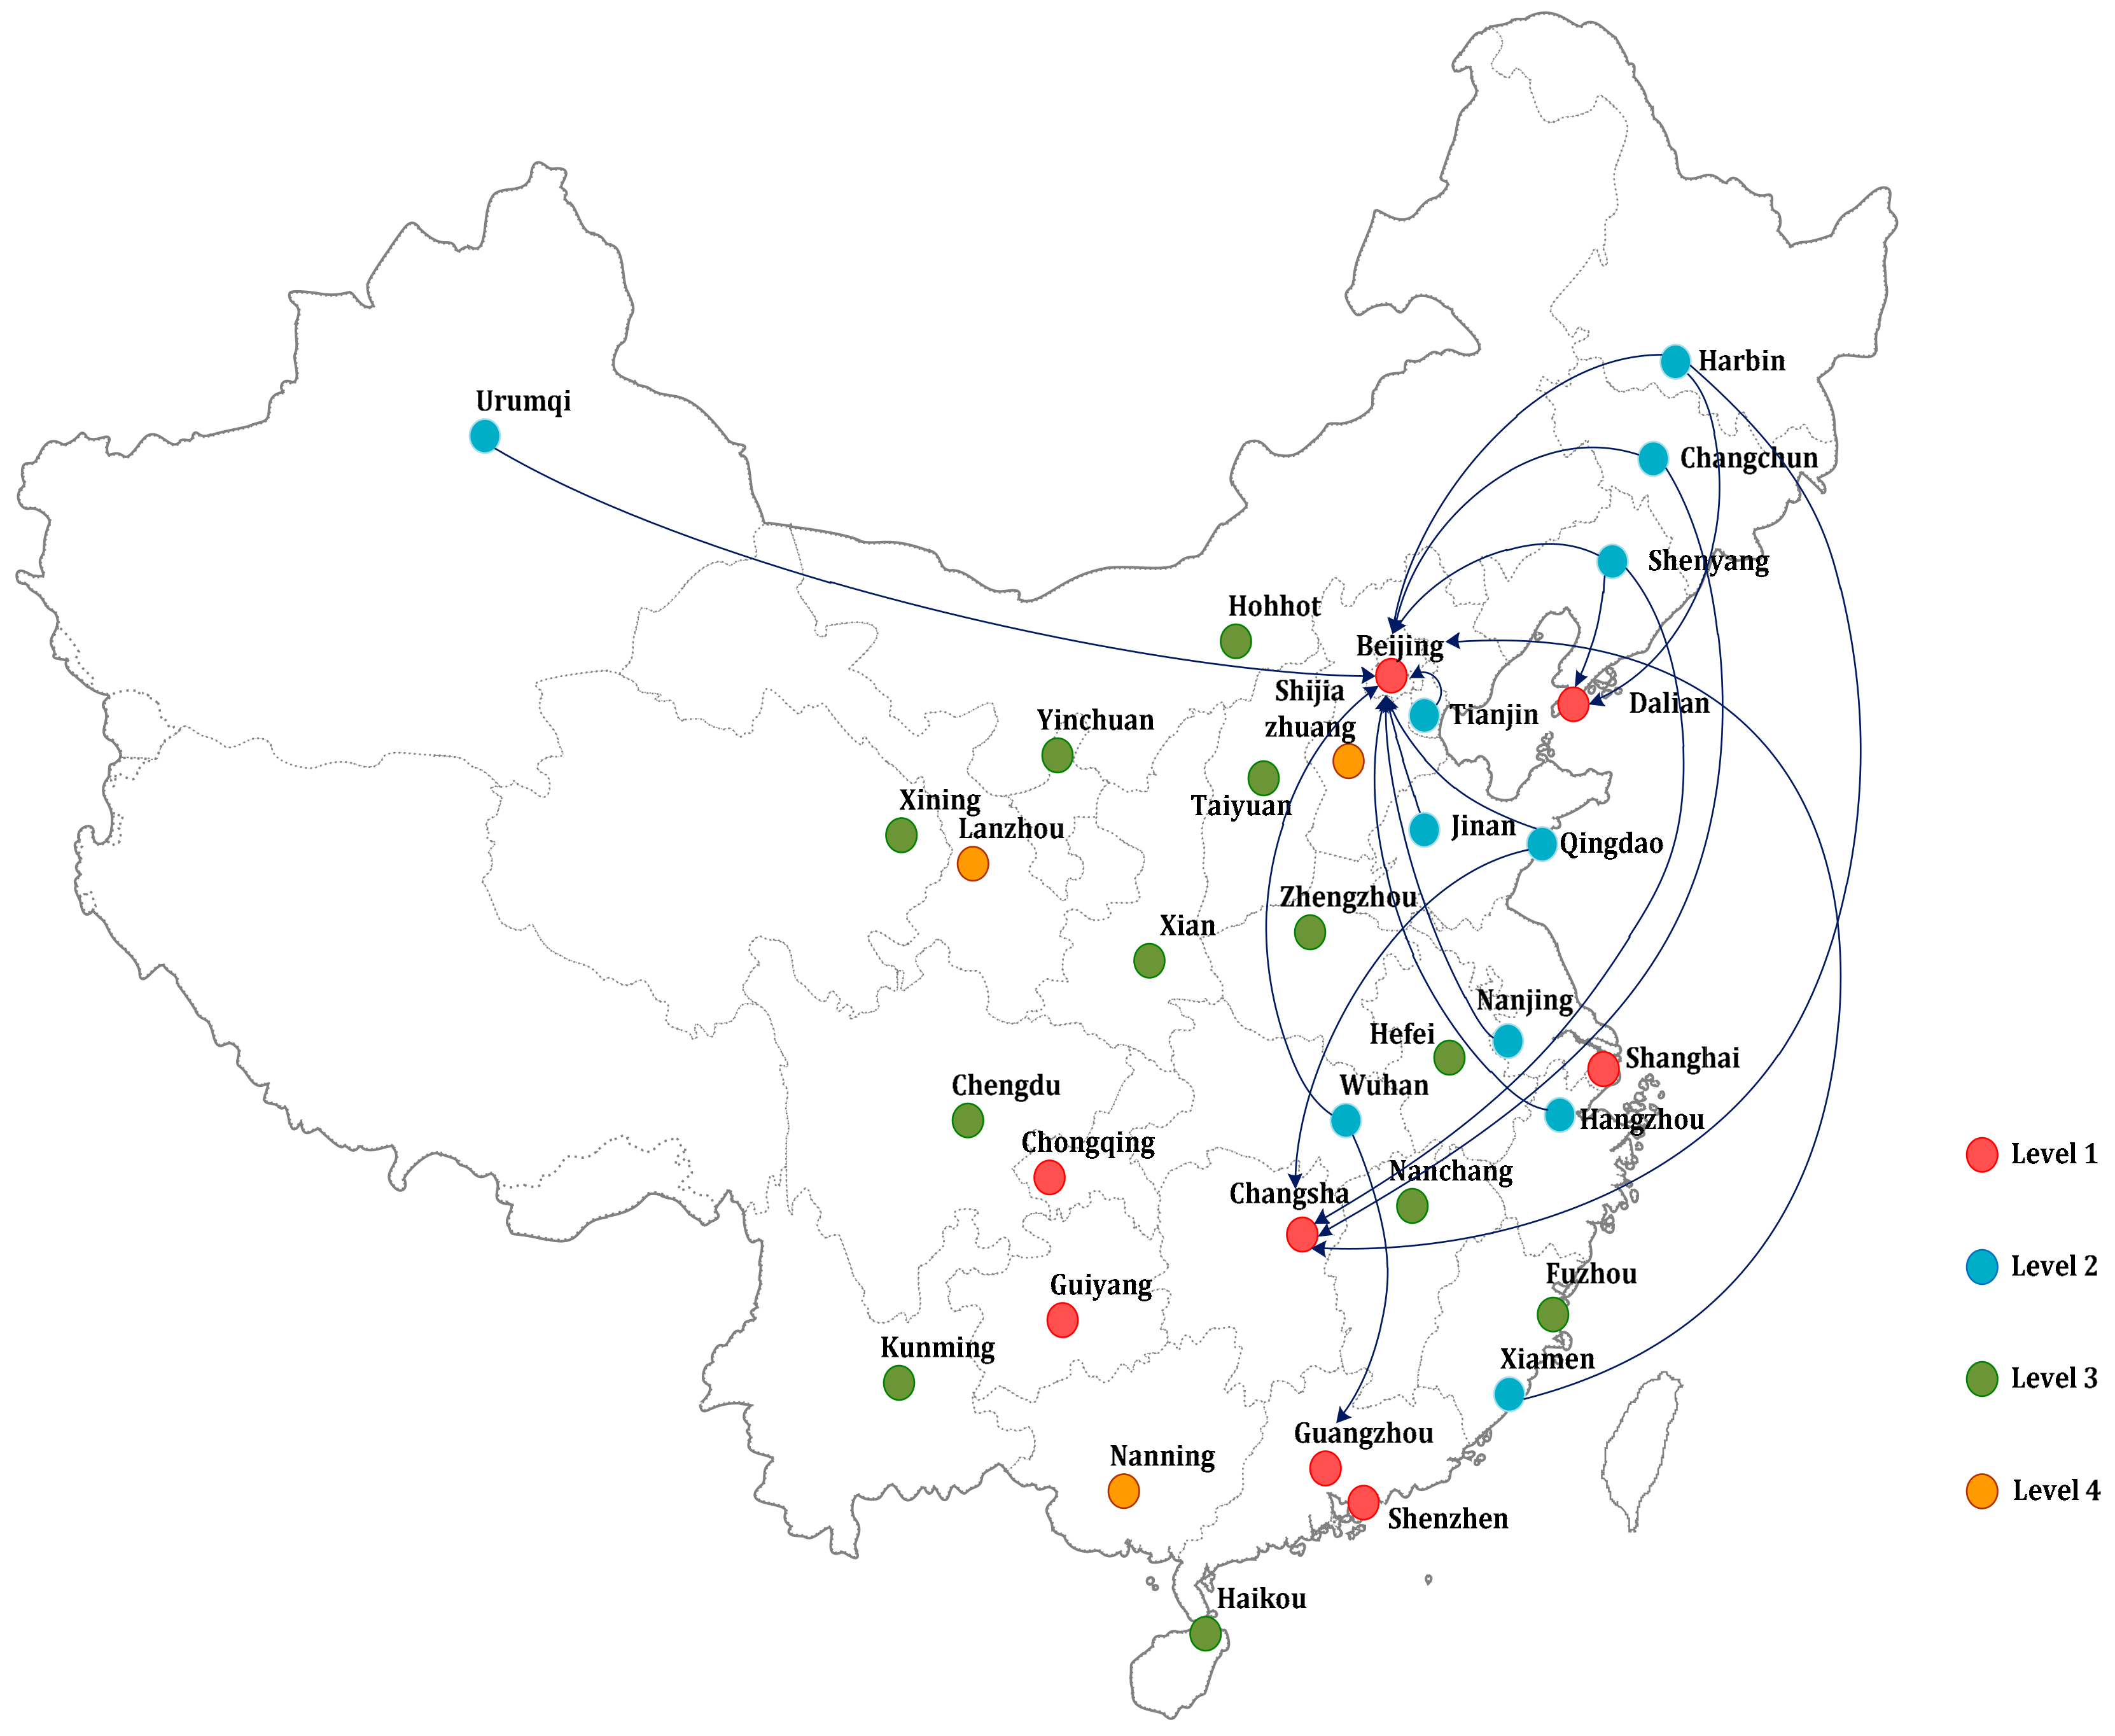
| Major Cities | Score | Rank | Benchmarks | Major Cities | Score | Rank | Benchmarks |
|---|---|---|---|---|---|---|---|
| Beijing | 1.000 | 1 | Beijing | Wuhan | 0.593 | 11 | Beijing |
| Changsha | 1.000 | 1 | Changsha | Xiamen | 0.416 | 12 | Changsha |
| Dalian | 1.000 | 1 | Dalian | Chengdu | 0.416 | 13 | Dalian |
| Guangzhou | 1.000 | 1 | Guangzhou | Fuzhou | 0.333 | 14 | Guangzhou |
| Guiyang | 1.000 | 1 | Guiyang | Haikou | 0.345 | 15 | Guiyang |
| Shanghai | 1.000 | 1 | Shanghai | Hefei | 0.374 | 16 | Shanghai |
| Shenzhen | 1.000 | 1 | Shenzhen | Hohhot | 0.417 | 17 | Shenzhen |
| Chongqing | 1.000 | 1 | Chongqing | Kunming | 0.331 | 18 | Chongqing |
| Changchun | 0.640 | 2 | Beijing, Changsha | Nanchang | 0.428 | 19 | Beijing, Changsha |
| Harbin | 0.633 | 3 | Beijing, Changsha, Dalian | Taiyuan | 0.324 | 20 | Beijing, Changsha, Dalian |
| Hangzhou | 0.474 | 4 | Beijing | Xian | 0.379 | 21 | Beijing |
| Jinan | 0.340 | 5 | Beijing | Xining | 0.195 | 22 | Beijing |
| Nanjing | 0.500 | 6 | Beijing | Yinchuan | 0.322 | 23 | Beijing |
| Qingdao | 0.619 | 7 | Beijing, Changsha | Zhengzhou | 0.328 | 24 | Beijing, Changsha |
| Shenyang | 0.571 | 8 | Beijing, Changsha, Dalian | Lanzhou | 0.238 | 25 | Beijing, Changsha, Dalian |
| Tianjin | 0.590 | 9 | Beijing | Nanning | 0.328 | 26 | Beijing |
| Urumqi | 0.478 | 10 | Beijing | Shijiazhuang | 0.260 | 27 | Beijing |
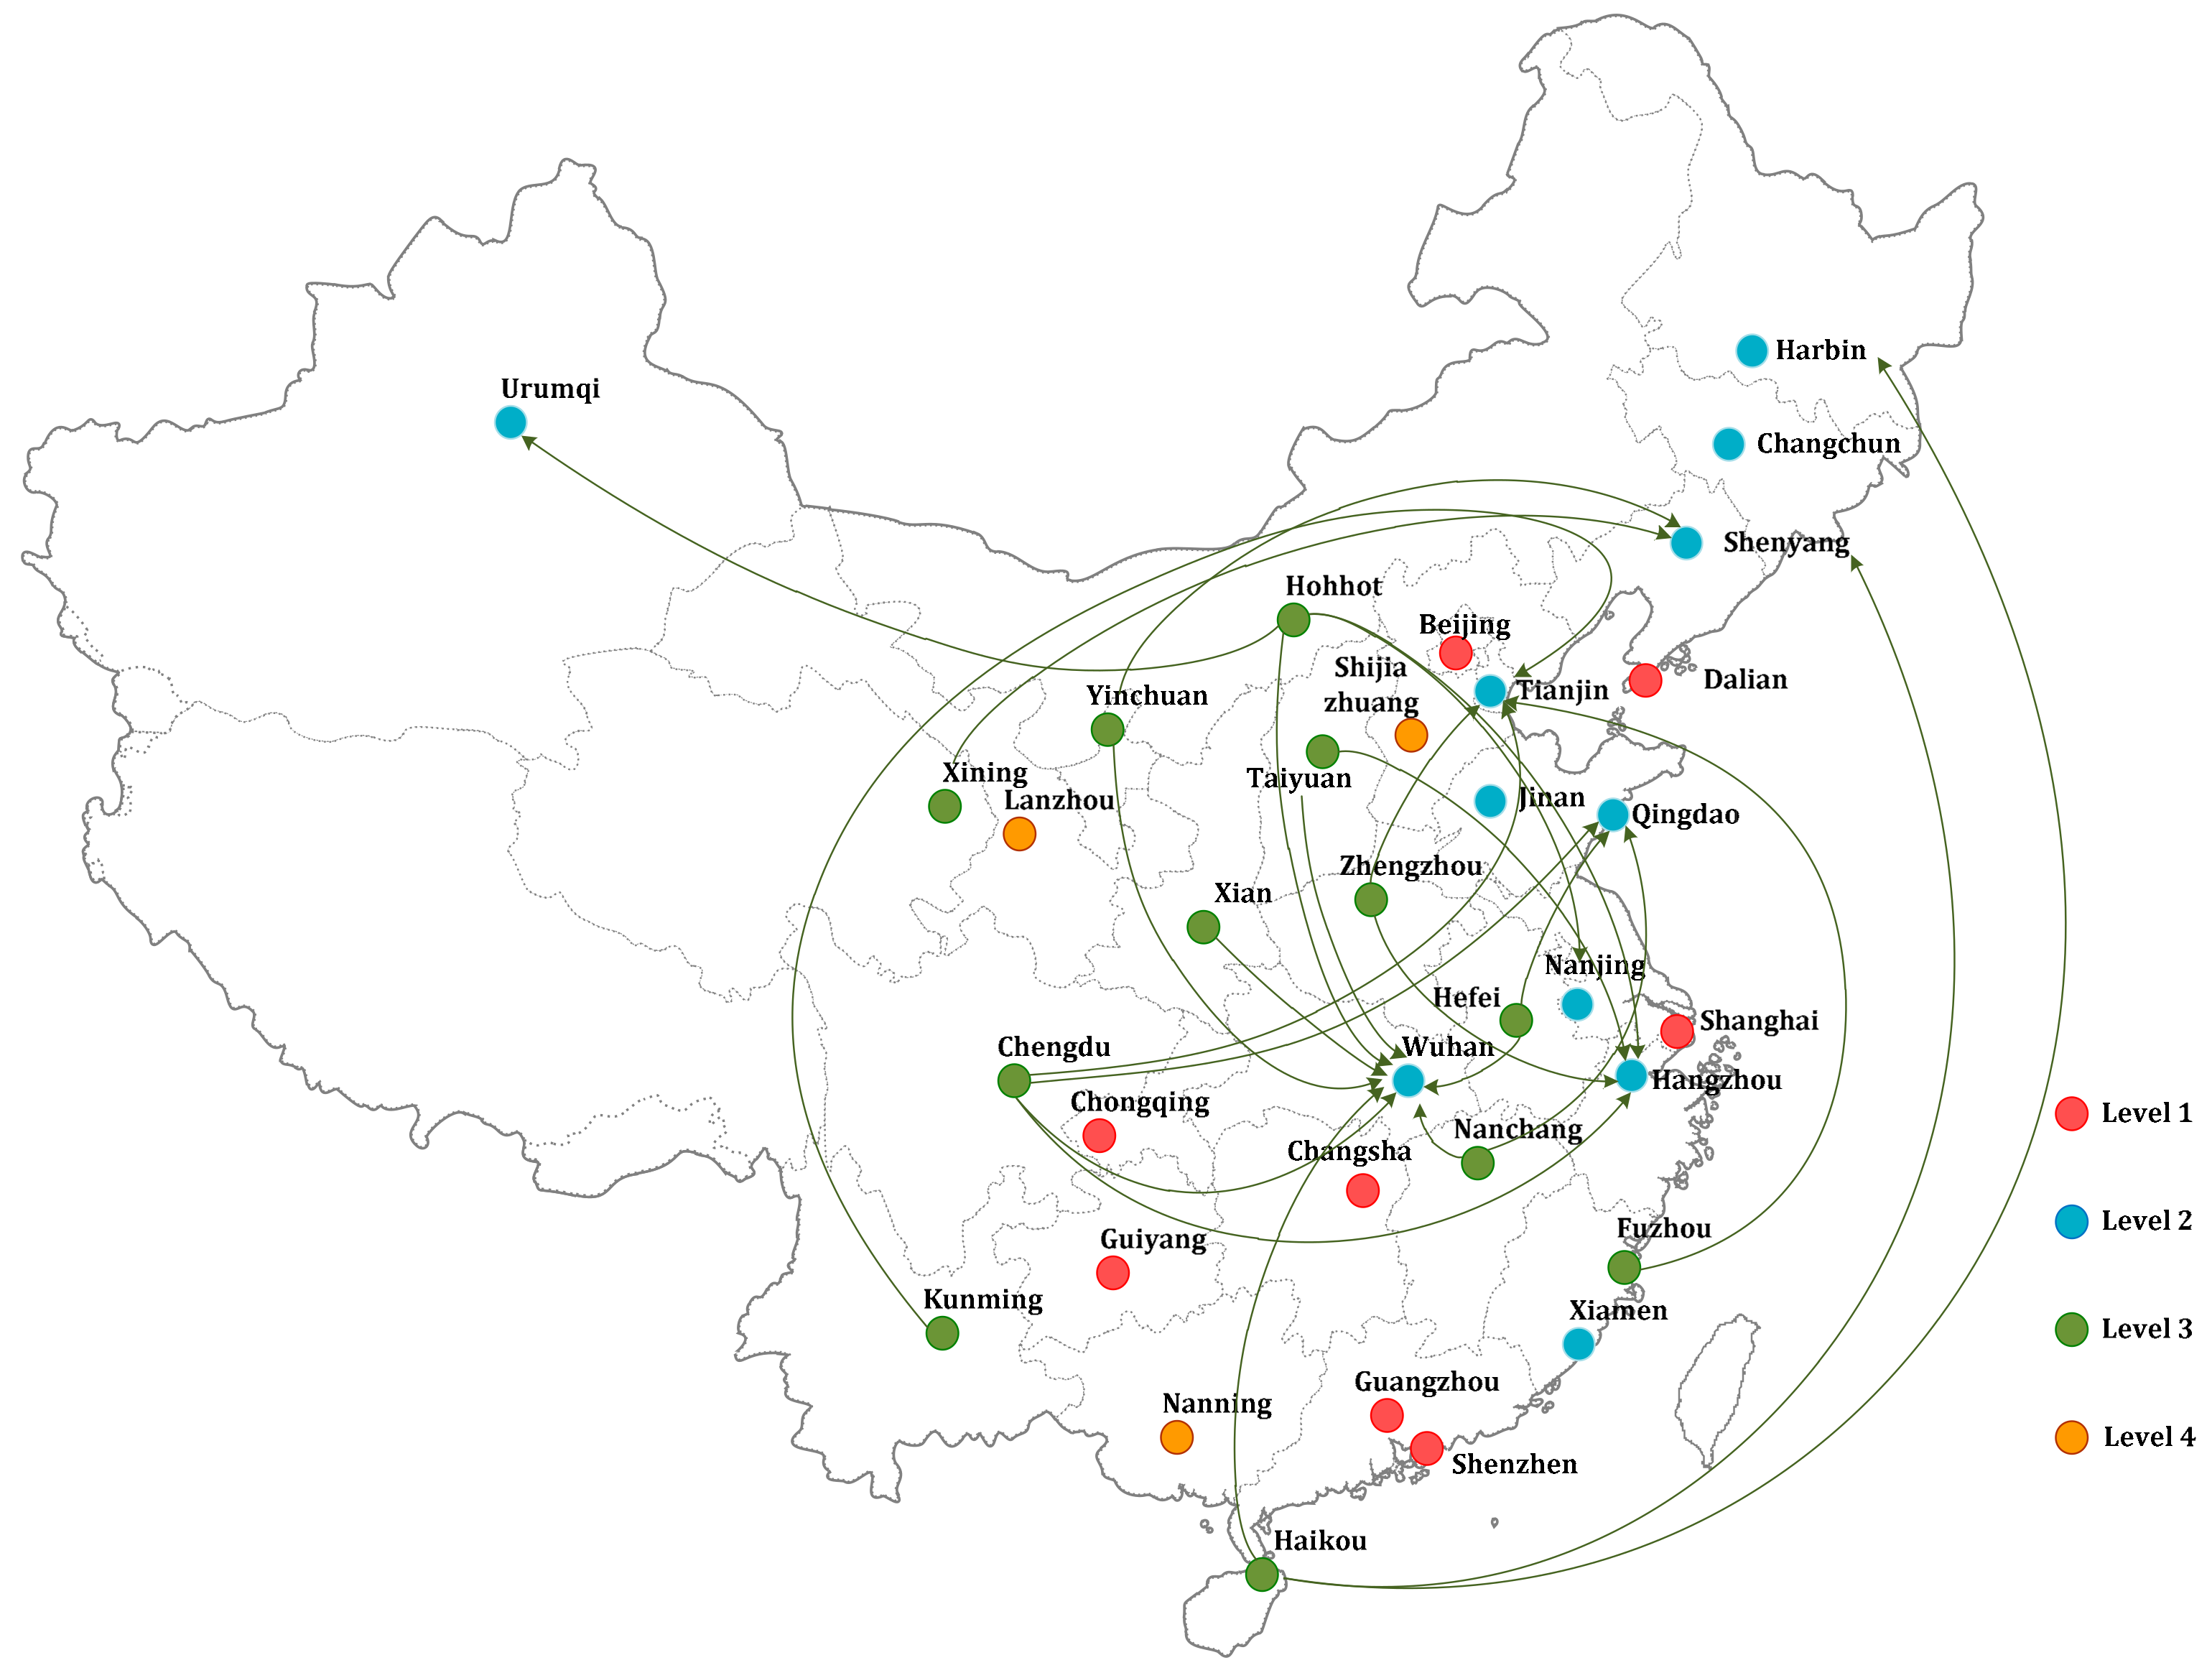
| Major Cities | Level | ||||
|---|---|---|---|---|---|
| Shanghai | 1.000 | - | - | - | Level 1 |
| Dalian | 1.000 | - | - | - | Level 1 |
| Guangzhou | 1.000 | - | - | - | Level 1 |
| Beijing | 1.000 | - | - | - | Level 1 |
| Changsha | 1.000 | - | - | - | Level 1 |
| Chongqing | 1.000 | - | - | - | Level 1 |
| Shenzhen | 1.000 | - | - | - | Level 1 |
| Guiyang | 1.000 | - | - | - | Level 1 |
| Tianjin | 0.590 | 1.000 | - | - | Level 2 |
| Changchun | 0.640 | 1.000 | - | - | Level 2 |
| Shenyang | 0.571 | 1.000 | - | - | Level 2 |
| Hangzhou | 0.474 | 1.000 | - | - | Level 2 |
| Wuhan | 0.593 | 1.000 | - | - | Level 2 |
| Qingdao | 0.619 | 1.000 | - | - | Level 2 |
| Nanjing | 0.500 | 1.000 | - | - | Level 2 |
| Harbin | 0.633 | 1.000 | - | - | Level 2 |
| Jinan | 0.340 | 1.000 | - | - | Level 2 |
| Xiamen | 0.416 | 1.000 | - | - | Level 2 |
| Urumqi | 0.478 | 1.000 | - | - | Level 2 |
| Taiyuan | 0.324 | 0.474 | 1.000 | - | Level 3 |
| Hefei | 0.374 | 0.547 | 1.000 | - | Level 3 |
| Chengdu | 0.416 | 0.792 | 1.000 | - | Level 3 |
| Xining | 0.195 | 0.373 | 1.000 | - | Level 3 |
| Xian | 0.379 | 0.545 | 1.000 | - | Level 3 |
| Hohhot | 0.417 | 0.666 | 1.000 | - | Level 3 |
| Kunming | 0.331 | 0.517 | 1.000 | - | Level 3 |
| Nanchang | 0.428 | 0.598 | 1.000 | - | Level 3 |
| Haikou | 0.345 | 0.547 | 1.000 | - | Level 3 |
| Yinchuan | 0.322 | 0.424 | 1.000 | - | Level 3 |
| Fuzhou | 0.333 | 0.540 | 1.000 | - | Level 3 |
| Zhengzhou | 0.328 | 0.618 | 1.000 | - | Level 3 |
| Shijiazhuang | 0.260 | 0.386 | 0.527 | 1.000 | Level 4 |
| Nanning | 0.328 | 0.478 | 0.778 | 1.000 | Level 4 |
| Lanzhou | 0.238 | 0.359 | 0.565 | 1.000 | Level 4 |
| Major Cities | No. | SD Pathway | Electricity Consumption | Labors | Fixed Investments | GDP | SEEE | Unemployment Rate | Air Pollution Index | PM2.5 | |
|---|---|---|---|---|---|---|---|---|---|---|---|
| Shanghai | (11) | L1 | - | 0.00% | 0.00% | 0.00% | 0.00% | 0.00% | 0.00% | 0.00% | 0.00% |
| Dalian | (12) | L1 | - | 0.00% | 0.00% | 0.00% | 0.00% | 0.00% | 0.00% | 0.00% | 0.00% |
| Guangzhou | (13) | L1 | - | 0.00% | 0.00% | 0.00% | 0.00% | 0.00% | 0.00% | 0.00% | 0.00% |
| Beijing | (14) | L1 | - | 0.00% | 0.00% | 0.00% | 0.00% | 0.00% | 0.00% | 0.00% | 0.00% |
| Changsha | (15) | L1 | - | 0.00% | 0.00% | 0.00% | 0.00% | 0.00% | 0.00% | 0.00% | 0.00% |
| Chongqing | (16) | L1 | - | 0.00% | 0.00% | 0.00% | 0.00% | 0.00% | 0.00% | 0.00% | 0.00% |
| Shenzhen | (17) | L1 | - | 0.00% | 0.00% | 0.00% | 0.00% | 0.00% | 0.00% | 0.00% | 0.00% |
| Guiyang | (18) | L1 | - | 0.00% | 0.00% | 0.00% | 0.00% | 0.00% | 0.00% | 0.00% | 0.00% |
| Tianjin | (21) | L2 → L1 | {(14)} | −14.04% | −2.78% | −52.16% | 0.00% | 44.59% | −73.17% | −20.37% | −14.69% |
| Changchun | (22) | L2 → L1 | {(14),(15)} | 0.00% | −10.15% | −27.57% | 0.00% | 5.28% | −68.73% | −57.03% | −52.37% |
| Shenyang | (23) | L2 → L1 | {(12),(14),(15)} | 0.00% | −9.04% | −54.25% | 0.00% | 0.00% | −73.43% | −61.59% | −56.40% |
| Hangzhou | (24) | L2 → L1 | {(14)} | −27.11% | −23.77% | −34.10% | 0.00% | 102.93% | −69.27% | −44.50% | −38.67% |
| Wuhan | (25) | L2 → L1 | {(13),(14)} | −0.03% | 0.00% | −50.92% | 0.00% | 25.07% | −75.32% | −49.27% | −49.87% |
| Qingdao | (26) | L2 → L1 | {(14),(15)} | 0.00% | −17.69% | −29.49% | 0.00% | 84.88% | −52.52% | −28.71% | −14.27% |
| Nanjing | (27) | L2 → L1 | {(14)} | −17.96% | −2.16% | −42.73% | 0.00% | 122.08% | −78.33% | −49.53% | −41.24% |
| Harbin | (28) | L2 → L1 | {(12),(14),(15)} | 0.00% | −38.82% | −9.94% | 0.00% | 0.00% | −58.38% | −50.24% | −52.59% |
| Jinan | (29) | L2 → L1 | {(14)} | −36.02% | −18.87% | −33.22% | 0.00% | 391.58% | −84.18% | −77.14% | −75.65% |
| Xiamen | (20) | L2 → L1 | {(14)} | −31.57% | −37.85% | −26.22% | 0.00% | 103.73% | −93.36% | −65.28% | −57.14% |
| Urumqi | (2a) | L2 → L1 | {(14)} | −28.13% | −19.23% | −14.05% | 0.00% | 62.28% | −95.82% | −87.77% | −85.84% |
| Taiyuan | (31) | L3 → L2 | {(24),(25)} | −55.25% | −37.93% | 0.00% | 0.00% | 0.97% | −77.01% | −76.77% | −71.73% |
| Hefei | (32) | L3 → L2 | {(25),(26)} | 0.00% | −45.30% | −33.42% | 0.00% | 45.36% | −44.72% | −37.44% | −46.23% |
| Chengdu | (33) | L3 → L2 | {(21),(24),(25),(26)} | 0.00% | −26.66% | 0.00% | 0.00% | 70.95% | −0.50% | −4.03% | 0.00% |
| Xining | (34) | L3 → L2 | {(23)} | −89.31% | −43.20% | −0.26% | 19.08% | 0.00% | −78.24% | −77.10% | −73.73% |
| Xian | (35) | L3 → L2 | {(25)} | −11.79% | −45.71% | −35.30% | 0.00% | 3.20% | −49.46% | −46.43% | −34.17% |
| Hohhot | (36) | L3 → L2 | {(24),(25),(27),(2a)} | −20.71% | 0.00% | 0.00% | 0.00% | 0.00% | −77.73% | −66.66% | −54.72% |
| Kunming | (37) | L3 → L2 | {(21)} | −31.89% | −48.90% | −12.32% | 0.00% | 2.07% | −63.68% | −56.52% | −44.91% |
| Nanchang | (38) | L3 → L2 | {(25),(26)} | 0.00% | −34.07% | −27.09% | 0.00% | 7.68% | −65.88% | −47.71% | −44.35% |
| Haikou | (39) | L3 → L2 | {(23),(25),(28)} | −24.66% | −52.92% | 0.00% | 0.00% | 0.00% | −63.64% | −60.51% | −53.08% |
| Yinchuan | (30) | L3 → L2 | {(23),(25)} | −36.87% | −40.54% | −30.55% | 0.00% | 0.00% | −87.81% | −85.98% | −81.03% |
| Fuzhou | (3a) | L3 → L2 | {(21)} | −27.17% | −40.37% | −13.49% | 0.00% | 67.42% | −51.11% | −36.21% | −20.66% |
| Zhengzhou | (3b) | L3 → L2 | {(21),(24) | −19.10% | −13.12% | −29.90% | 0.00% | 31.35% | 0.00% | −52.89% | −57.26% |
| Shijiazhuang | (41) | L4 → L3 | {(33),(35)} | −44.95% | −15.79% | −27.79% | 0.00% | 0.00% | −52.78% | −56.73% | −59.79% |
| Nanning | (42) | L4 → L3 | {(33),(35),(37),(39)} | 0.00% | −38.33% | 0.00% | 0.00% | 0.00% | −33.34% | −10.07% | −17.05% |
| Lanzhou | (43) | L4 → L3 | {(33),(37)} | −58.53% | −4.20% | −4.83% | 0.00% | 0.00% | −40.66% | −72.87% | −71.76% |
© 2017 by the authors. Licensee MDPI, Basel, Switzerland. This article is an open access article distributed under the terms and conditions of the Creative Commons Attribution (CC BY) license (http://creativecommons.org/licenses/by/4.0/).
Share and Cite
Yu, S.-H.; Gao, Y.; Shiue, Y.-C. A Comprehensive Evaluation of Sustainable Development Ability and Pathway for Major Cities in China. Sustainability 2017, 9, 1483. https://doi.org/10.3390/su9081483
Yu S-H, Gao Y, Shiue Y-C. A Comprehensive Evaluation of Sustainable Development Ability and Pathway for Major Cities in China. Sustainability. 2017; 9(8):1483. https://doi.org/10.3390/su9081483
Chicago/Turabian StyleYu, Shih-Heng, Yu Gao, and Yih-Chearng Shiue. 2017. "A Comprehensive Evaluation of Sustainable Development Ability and Pathway for Major Cities in China" Sustainability 9, no. 8: 1483. https://doi.org/10.3390/su9081483
APA StyleYu, S.-H., Gao, Y., & Shiue, Y.-C. (2017). A Comprehensive Evaluation of Sustainable Development Ability and Pathway for Major Cities in China. Sustainability, 9(8), 1483. https://doi.org/10.3390/su9081483