The Role of Green and Traditional Supplier Attributes on Business Performance


 ,
, 
Abstract
:1. Introduction
1.1. Supplier Evaluation Techniques
1.2. Traditional Attributes for Supplier Selection
1.3. Green Attributes in Supplier Selection
1.4. Production Process Benefits from Supplier Selection
1.5. Commercial Benefits Gained from Supplier Selection
2. Methodology
2.1. Stage 1. Questionnaire Design and Administration
2.2. Stage 2. Database Creation and Screening
2.3. Stage 3. Statistical Validation
2.4. Stage 4. Descriptive Analysis
2.4.1. Descriptive Analysis of the Sample
2.4.2. Descriptive Analysis of Items
2.5. Stage 5. Structural Equations Modelling
3. Results
3.1. Latent Variables Validation
3.2. Descriptive Analysis of the Sample
3.3. Descriptive Analysis of Items
3.4. Structural Equations Model
- Average path coefficient (APC) = 0.378, p < 0.001
- Average R-squared (ARS) = 0.489, p < 0.001
- Average adjusted R-squared (AARS) = 0.485, p < 0.001
- Average block VIF (AVIF) = 1.733, acceptable if ≤5, ideally ≤3.3
- Average full collinearity VIF (AFVIF) = 2.577, acceptable if ≤5, ideally ≤3.3
- Tenenhaus GoF (GoF) = 0.554, small ≥ 0.1, medium ≥ 0.25, large ≥ 0.36
3.5. Direct Effects
3.6. Sum of Indirect Effects
- Latent variable Traditional Attributes has an indirect effect on Production Process Benefits through Green Attributes. This effect equals 0.284 units (p < 0.001), it is statistically significant at a 95% confidence level, and the former latent variable explains 11.9% of the variability of the latter, since the effect size (ES) equals 0.119 units.
- The same latent variable, Traditional Attributes, also has an indirect effect on Commercial Benefits through Green Attributes and Production Process Benefits. In this case, the indirect effect equals 0.284 (p < 0.001), it is statistically significant at a 95% confidence level, and Traditional Attributes explain up to 11.4% of the variability of Commercial Benefits, since ES = 0.114.
- Latent variable Traditional Attributes has an indirect effect on Commercial Benefits through Green Attributes. The effect equals 0.194 units (p < 0.001), it is statistically significant at a 95% confidence level and can be tracked following three segments. In addition, in this indirect effect, Traditional Attributes explain 7.8% of the variability of Commercial Benefits, since ES = 0.078.
- Latent variable Green Attributes has an indirect effect on Commercial Benefits through Production Process Benefits. The effect equals 0.292 units (p < 0.001), it is statistically significant at a 95% confidence level, and can be tracked following two segments. In addition, in this effect, Green Attributes explain 17.4% of the variability of Commercial Benefits, since ES = 0.174.
3.7. Total Effects
4. Conclusions and Industrial Implications
Author Contributions
Conflicts of Interest
References
- Rezaei, J.; Nispeling, T.; Sarkis, J.; Tavasszy, L. A supplier selection life cycle approach integrating traditional and environmental criteria using the best worst method. J. Clean. Prod. 2016, 135, 577–588. [Google Scholar] [CrossRef]
- Gurel, O.; Acar, A.Z.; Onden, I.; Gumus, I. Determinants of the green supplier selection. Procedia Soc. Behav. Sci. 2015, 181, 131–139. [Google Scholar] [CrossRef]
- Genovese, A.; Lenny Koh, S.C.; Bruno, G.; Esposito, E. Greener supplier selection: State of the art and some empirical evidence. Int. J. Prod. Res. 2013, 51, 2868–2886. [Google Scholar] [CrossRef]
- Shen, L.; Olfat, L.; Govindan, K.; Khodaverdi, R.; Diabat, A. A fuzzy multi criteria approach for evaluating green supplier’s performance in green supply chain with linguistic preferences. Resour. Conserv. Recycl. 2013, 74, 170–179. [Google Scholar] [CrossRef]
- Cabral, I.; Grilo, A.; Cruz-Machado, V. A decision-making model for lean, agile, resilient and green supply chain management. Int. J. Prod. Res. 2012, 50, 4830–4845. [Google Scholar] [CrossRef]
- Wang, K.-Q.; Liu, H.-C.; Liu, L.; Huang, J. Green supplier evaluation and selection using cloud model theory and the qualiflex method. Sustainability 2017, 9, 688. [Google Scholar] [CrossRef]
- Mendoza Fong, J.R.; García-Alcaraz, J.L.; Maldonado-Macías, A.A.; Sánchez Ramírez, C.; Martínez Loya, V. The impact of green attributes from suppliers on supply chain performance. In Green Marketing and Environmental Responsibility in Modern Corporations; IGI Global: Hershey, PA, USA, 2017; pp. 101–121. [Google Scholar]
- Sharma, V.K.; Chandna, P.; Bhardwaj, A. Green supply chain management related performance indicators in agro industry: A review. J. Clean. Prod. 2017, 141, 1194–1208. [Google Scholar] [CrossRef]
- Chin, T.A.; Tat, H.H.; Sulaiman, Z. Green supply chain management, environmental collaboration and sustainability performance. Procedia CIRP 2015, 26, 695–699. [Google Scholar] [CrossRef]
- Fahimnia, B.; Sarkis, J.; Davarzani, H. Green supply chain management: A review and bibliometric analysis. Int. J. Prod. Econ. 2015, 162, 101–114. [Google Scholar] [CrossRef]
- Tseng, M.-L. Green supply chain management with linguistic preferences and incomplete information. Appl. Soft Comput. 2011, 11, 4894–4903. [Google Scholar] [CrossRef]
- Hu, Z.; Rao, C.; Zheng, Y.; Huang, D. Optimization decision of supplier selection in green procurement under the mode of low carbon economy. Int. J. Comput. Intell. Syst. 2015, 8, 407–421. [Google Scholar] [CrossRef]
- Akman, G. Evaluating suppliers to include green supplier development programs via fuzzy c-means and vikor methods. Comput. Ind. Eng. 2015, 86, 69–82. [Google Scholar] [CrossRef]
- Lee, K.-H.; Wu, Y. Integrating sustainability performance measurement into logistics and supply networks: A multi-methodological approach. Br. Account. Rev. 2014, 46, 361–378. [Google Scholar] [CrossRef]
- Mendoza Fong, J.R.; García-Alcaraz, J.L.; Sánchez Ramírez, C.; Alor-Hernández, G. The impact of supplier’s administrative attributes on production process and marketing benefits. In Ethics and Sustainability in Global Supply Chain Management; IGI Global: Hershey, PA, USA, 2017; pp. 73–91. [Google Scholar]
- Cheaitou, A.; Khan, S.A. An integrated supplier selection and procurement planning model using product predesign and operational criteria. Int. J. Interact. Des. Manuf. 2015, 9, 213–224. [Google Scholar] [CrossRef]
- Pitchipoo, P.; Venkumar, P.; Rajakarunakaran, S. Fuzzy hybrid decision model for supplier evaluation and selection. Int. J. Prod. Res. 2013, 51, 3903–3919. [Google Scholar] [CrossRef]
- Keskin, G.A. Using integrated fuzzy dematel and fuzzy c: Means algorithm for supplier evaluation and selection. Int. J. Prod. Res. 2015, 53, 3586–3602. [Google Scholar] [CrossRef]
- Singh, A. Supplier evaluation and demand allocation among suppliers in a supply chain. J. Purch. Supply Manag. 2014, 20, 167–176. [Google Scholar] [CrossRef]
- Kuo, R.J.; Lin, Y.J. Supplier selection using analytic network process and data envelopment analysis. Int. J. Prod. Res. 2011, 50, 2852–2863. [Google Scholar] [CrossRef]
- Kar, A.K. Revisiting the supplier selection problem: An integrated approach for group decision support. Expert Syst. Appl. 2014, 41, 2762–2771. [Google Scholar] [CrossRef]
- Ho, W.; Xu, X.; Dey, P.K. Multi-criteria decision making approaches for supplier evaluation and selection: A literature review. Eur. J. Oper. Res. 2010, 202, 16–24. [Google Scholar] [CrossRef]
- Mafakheri, F.; Breton, M.; Ghoniem, A. Supplier selection-order allocation: A two-stage multiple criteria dynamic programming approach. Int. J. Prod. Econ. 2011, 132, 52–57. [Google Scholar] [CrossRef]
- Tseng, M.-L.; Chiu, A.S.F. Evaluating firm’s green supply chain management in linguistic preferences. J. Clean. Prod. 2013, 40, 22–31. [Google Scholar] [CrossRef]
- Shaw, K.; Shankar, R.; Yadav, S.S.; Thakur, L.S. Supplier selection using fuzzy ahp and fuzzy multi-objective linear programming for developing low carbon supply chain. Expert Syst. Appl. 2012, 39, 8182–8192. [Google Scholar] [CrossRef]
- Büyüközkan, G.; Çifçi, G. A novel hybrid mcdm approach based on fuzzy dematel, fuzzy anp and fuzzy topsis to evaluate green suppliers. Expert Syst. Appl. 2012, 39, 3000–3011. [Google Scholar] [CrossRef]
- Yeung, K.; Lee, P.K.C.; Yeung, A.C.L.; Cheng, T.C.E. Supplier partnership and cost performance: The moderating roles of specific investments and environmental uncertainty. Int. J. Prod. Econ. 2013, 144, 546–559. [Google Scholar] [CrossRef]
- Terziovski, M. Innovation practice and its performance implications in small and medium enterprises (SMEs) in the manufacturing sector: A resource-based view. Strateg. Manag. J. 2010, 31, 892–902. [Google Scholar] [CrossRef]
- Cao, H. The study of the suppliers evaluating and choosing strategies based on the green supply chain management. In Proceedings of the 2011 International Conference on Business Management and Eletronic Information (BMEI), Guangzhou, China, 13–15 May 2011. [Google Scholar]
- Büyüközkan, G.; Çifçi, G. A novel fuzzy multi-criteria decision framework for sustainable supplier selection with incomplete information. Comput. Ind. 2011, 62, 164–174. [Google Scholar] [CrossRef]
- Kumar, P.; Singh, R.K.; Vaish, A. Suppliers’ green performance evaluation using fuzzy extended electre approach. Clean Technol. Environ. Policy 2017, 19, 809–821. [Google Scholar] [CrossRef]
- Bruno, G.; Esposito, E.; Genovese, A.; Simpson, M. Applying supplier selection methodologies in a multi-stakeholder environment: A case study and a critical assessment. Expert Syst. Appl. 2016, 43, 271–285. [Google Scholar] [CrossRef]
- Stefanelli, N.O.; Jabbour, C.J.C.; Jabbour, A.B.L.d.S. Green supply chain management and environmental performance of firms in the bioenergy sector in Brazil: An exploratory survey. Energy Policy 2014, 75, 312–315. [Google Scholar] [CrossRef]
- Mendoza-Fong, J.R.; García-Alcaraz, J.L.; Ochoa-Domínguez, H.d.J.; Cortes-Robles, G. Green production attributes and its impact in company’s sustainability. In New Perspectives on Applied Industrial Tools and Techniques; Garcia-Alcaraz, J.L., Alor-Hernandez, G., Maldonado-Macias, A.A., Sanchez-Ramirez, C., Eds.; Springer: Cham, Switzerland, 2017; pp. 23–46. [Google Scholar]
- Mirhedayatian, S.M.; Azadi, M.; Farzipoor Saen, R. A novel network data envelopment analysis model for evaluating green supply chain management. Int. J. Prod. Econ. 2014, 147, 544–554. [Google Scholar] [CrossRef]
- Guo, Z.; Liu, H.; Zhang, D.; Yang, J. Green supplier evaluation and selection in apparel manufacturing using a fuzzy multi-criteria decision-making approach. Sustainability 2017, 9, 650. [Google Scholar]
- Kerkhoff, G.M.C.; Schafer, D.; Jager, G.; Heidbreder, C.; Kreienbrink, O.; Penning, S.; Rüter, M. Einkaufsagenda 2020; Wiley-VCH: Weinheim, Germany, 2010. [Google Scholar]
- Winter, S.; Lasch, R. Environmental and social criteria in supplier evaluation—Lessons from the fashion and apparel industry. J. Clean. Prod. 2016, 139, 175–190. [Google Scholar] [CrossRef]
- Azadi, M.; Jafarian, M.; Farzipoor Saen, R.; Mirhedayatian, S.M. A new fuzzy dea model for evaluation of efficiency and effectiveness of suppliers in sustainable supply chain management context. Comput. Oper. Res. 2015, 54, 274–285. [Google Scholar] [CrossRef]
- Hashemi, S.H.; Karimi, A.; Tavana, M. An integrated green supplier selection approach with analytic network process and improved grey relational analysis. Int. J. Prod. Econ. 2015, 159, 178–191. [Google Scholar] [CrossRef]
- Govindan, K.; Rajendran, S.; Sarkis, J.; Murugesan, P. Multi criteria decision making approaches for green supplier evaluation and selection: A literature review. J. Clean. Prod. 2015, 98, 66–83. [Google Scholar] [CrossRef]
- Kannan, D.; Jabbour, A.B.L.d.S.; Jabbour, C.J.C. Selecting green suppliers based on gscm practices: Using fuzzy topsis applied to a Brazilian electronics company. Eur. J. Oper. Res. 2014, 233, 432–447. [Google Scholar] [CrossRef]
- Jabbour, C.J.C.; de Sousa Jabbour, A.B.L. Green human resource management and green supply chain management: Linking two emerging agendas. J. Clean. Prod. 2016, 112, 1824–1833. [Google Scholar] [CrossRef]
- Kannan, D.; Govindan, K.; Rajendran, S. Fuzzy axiomatic design approach based green supplier selection: A case study from Singapore. J. Clean. Prod. 2015, 96, 194–208. [Google Scholar] [CrossRef]
- Dubey, R.; Gunasekaran, A.; Samar Ali, S. Exploring the relationship between leadership, operational practices, institutional pressures and environmental performance: A framework for green supply chain. Int. J. Prod. Econ. 2015, 160, 120–132. [Google Scholar] [CrossRef]
- Bai, C.; Sarkis, J.; Dou, Y. Corporate sustainability development in china: Review and analysis. Ind. Manag. Data Syst. 2015, 115, 5–40. [Google Scholar] [CrossRef]
- Charmondusit, K.; Gheewala, S.H.; Mungcharoen, T. Green and sustainable innovation for cleaner production in the asia-pacific region. J. Clean. Prod. 2016, 134, 443–446. [Google Scholar] [CrossRef]
- Zailani, S.; Govindan, K.; Iranmanesh, M.; Shaharudin, M.R.; Sia Chong, Y. Green innovation adoption in automotive supply chain: The Malaysian case. J. Clean. Prod. 2015, 108, 1115–1122. [Google Scholar] [CrossRef]
- Amindoust, A.; Ahmed, S.; Saghafinia, A.; Bahreininejad, A. Sustainable supplier selection: A ranking model based on fuzzy inference system. Appl. Soft Comput. 2012, 12, 1668–1677. [Google Scholar] [CrossRef]
- Su, C.-M.; Horng, D.-J.; Tseng, M.-L.; Chiu, A.S.F.; Wu, K.-J.; Chen, H.-P. Improving sustainable supply chain management using a novel hierarchical grey-dematel approach. J. Clean. Prod. 2016, 134, 469–481. [Google Scholar] [CrossRef]
- Scott, J.; Ho, W.; Dey, P.K.; Talluri, S. A decision support system for supplier selection and order allocation in stochastic, multi-stakeholder and multi-criteria environments. Int. J. Prod. Econ. 2015, 166, 226–237. [Google Scholar] [CrossRef]
- Ağan, Y.; Kuzey, C.; Acar, M.F.; Açıkgöz, A. The relationships between corporate social responsibility, environmental supplier development, and firm performance. J. Clean. Prod. 2016, 112, 1872–1881. [Google Scholar] [CrossRef]
- Galankashi, M.R.; Chegeni, A.; Soleimanynanadegany, A.; Memari, A.; Anjomshoae, A.; Helmi, S.A.; Dargi, A. Prioritizing green supplier selection criteria using fuzzy analytical network process. Procedia CIRP 2015, 26, 689–694. [Google Scholar] [CrossRef]
- Wu, C.; Barnes, D. An integrated model for green partner selection and supply chain construction. J. Clean. Prod. 2016, 112, 2114–2132. [Google Scholar] [CrossRef]
- Govindan, K.; Khodaverdi, R.; Jafarian, A. A fuzzy multi criteria approach for measuring sustainability performance of a supplier based on triple bottom line approach. J. Clean. Prod. 2013, 47, 345–354. [Google Scholar] [CrossRef]
- Evans, A.; Sawyer, J.K. An investigation into the social and environmental responsibility behaviours of regional small businesses in relation to their impact on the local community and immediate environment. Australas. J. Reg. Stud. 2010, 16, 253–265. [Google Scholar]
- Villanueva Ponce, R.D. Encuesta de atributos en la selección de proveedores; Academic Press: Juarez, Mexico, 2014. [Google Scholar]
- Rajesh, R.; Ravi, V. Supplier selection in resilient supply chains: A grey relational analysis approach. J. Clean. Prod. 2015, 86, 343–359. [Google Scholar] [CrossRef]
- Shang, K.-C.; Lu, C.-S.; Li, S. A taxonomy of green supply chain management capability among electronics-related manufacturing firms in Taiwan. J. Environ. Manag. 2010, 91, 1218–1226. [Google Scholar] [CrossRef] [PubMed]
- Awasthi, A.; Chauhan, S.S.; Goyal, S.K. A fuzzy multicriteria approach for evaluating environmental performance of suppliers. Int. J. Prod. Econ. 2010, 126, 370–378. [Google Scholar] [CrossRef]
- Amin, S.H.; Zhang, G. An integrated model for closed-loop supply chain configuration and supplier selection: Multi-objective approach. Expert Syst. Appl. 2012, 39, 6782–6791. [Google Scholar] [CrossRef]
- Merschmann, U.; Thonemann, U.W. Supply chain flexibility, uncertainty and firm performance: An empirical analysis of german manufacturing firms. Int. J. Prod. Econ. 2011, 130, 43–53. [Google Scholar] [CrossRef]
- Govindan, K.; Azevedo, S.G.; Carvalho, H.; Cruz-Machado, V. Impact of supply chain management practices on sustainability. J. Clean. Prod. 2014, 85, 212–225. [Google Scholar] [CrossRef]
- Villanueva-Ponce, R.; Garcia-Alcaraz, J.; Cortes-Robles, G.; Romero-Gonzalez, J.; Jiménez-Macías, E.; Blanco-Fernández, J. Impact of suppliers’ green attributes in corporate image and financial profit: Case maquiladora industry. Int. J. Adv. Manuf. Technol. 2015, 80, 1277–1296. [Google Scholar] [CrossRef]
- Büyüközkan, G. An integrated fuzzy multi-criteria group decision-making approach for green supplier evaluation. Int. J. Prod. Res. 2011, 50, 2892–2909. [Google Scholar] [CrossRef]
- Caniëls, M.C.J.; Gehrsitz, M.H.; Semeijn, J. Participation of suppliers in greening supply chains: An empirical analysis of German automotive suppliers. J. Purch. Supply Manag. 2013, 19, 134–143. [Google Scholar] [CrossRef]
- Hair, J.F., Jr.; Black, W.C.; Babin, B.J.; Anderson, R.E. Multivariate Data Analysis, 7th ed.; Pretince Hall: River, NJ, USA, 2013. [Google Scholar]
- Lynch, S.M. Introduction to Applied Bayesian Statistics and Estimation for Social Scientists; Springer Science & Business Media: New York, NY, USA, 2007; pp. 1–335. [Google Scholar]
- Kohler, M.; Müller, F.; Walk, H. Estimation of a regression function corresponding to latent variables. J. Stat. Plan. Inference 2015, 162, 88–109. [Google Scholar] [CrossRef]
- Leys, C.; Ley, C.; Klein, O.; Bernard, P.; Licata, L. Detecting outliers: Do not use standard deviation around the mean, use absolute deviation around the median. J. Exp. Soc. Psychol. 2013, 49, 764–766. [Google Scholar] [CrossRef]
- Kock, N. Advanced mediating effects tests, multi-group analyses, and measurement model assessments in PLS-based SEM. Int. J. e-Collab. 2014, 10, 1–13. [Google Scholar] [CrossRef]
- Green, K.W.; Inman, R.A.; Birou, L.M.; Whitten, D. Total JIT (T-JIT) and its impact on supply chain competency and organizational performance. Int. J. Prod. Econ. 2014, 147, 125–135. [Google Scholar] [CrossRef]
- Kock, N. Warppls 5.0 User Manual; ScriptWarp Systems: Laredo, TX, USA, 2015. [Google Scholar]


| Traditional Attributes | Green Attributes |
| Economic Stability [15,58] | Green Image [4,40] |
| Green Manufacturing [42,59] | |
| Production Process Flexibility [40,55] | Green Design [7,41] |
| Just in Time (JIT) Implementation [29,44] | Recycling System [31,49] |
| Product Cost [31,55] | Green Certification [39,60] |
| Business Experience [11,30] | Environmental Costs [38,44] |
| Previous Contracts [38,55] | Control of Pollutant Emissions [40,61] |
| Employee Capacity Building [15,58] | Social Responsibility [26,29] |
| Clean Production [24,31] | |
| Problem Solving Capacity [29,49] | Green Process Management [4,58,61] |
| Production Process Benefits | Commercial Benefits |
| Decreased Quality Problems [40,62] | Market Expansion to Local Areas [15,42] |
| Waste Minimization [2,26] | Green Corporate Image [20,63] |
| Market Expansion to National Areas [15,26] | |
| Shorter Delivery Times [2,15] | Increased Economic Earnings [41,64] |
| Decreased Customer Complaints [41,65] | Economic Earnings [41,66] |
| Supply Chain Improvements [58,65] |
| Latent Variable Coefficients | Traditional Attributes | Green Attributes | Production Process Benefits | Commercial Benefits |
|---|---|---|---|---|
| R-Squared | 0.442 | 0.279 | 0.746 | |
| Adj. R-Squared | 0.440 | 0.273 | 0.743 | |
| Q-Squared | 0.443 | 0.281 | 0.690 | |
| Composite reliability | 0.864 | 0.941 | 0.914 | 0.939 |
| Cronbach’s alpha | 0.820 | 0.930 | 0.874 | 0.922 |
| AVE | 0.544 | 0.616 | 0.727 | 0.720 |
| Full collinearity VIF | 1.839 | 2.320 | 2.911 | 3.238 |
| Items | Median | IQR | |
|---|---|---|---|
| Traditional Attributes | |||
| Economic Stability | 4.180 | 1.501 | |
| Just in Time (JIT) Implementation | 4.426 | 1.289 | |
| Product Cost | 4.277 | 1.414 | |
| Business Experience | 4.188 | 1.493 | |
| Production Process Flexibility | 4.028 | 1.541 | |
| Previous Contracts | 3.245 | 1.683 | |
| Employee Capacity Building | 4.034 | 1.502 | |
| Problem-Solving Capacity | 4.160 | 1.493 | |
| Green Attributes | |||
| Green Image | 3.561 | 1.803 | |
| Green Manufacturing | 3.525 | 1.786 | |
| Green Design | 3.473 | 1.870 | |
| Recycling System | 3.803 | 1.830 | |
| Green Certification | 4.119 | 1.698 | |
| Environmental Costs | 3.796 | 1.735 | |
| Control of Pollutant Emissions | 3.786 | 1.766 | |
| Social Responsibility | 3.910 | 1.582 | |
| Clean Production | 3.987 | 1.582 | |
| Green Process Management | 3.613 | 1.950 | |
| Production Process Benefits | |||
| Decreased Quality Problems | 3.052 | 1.849 | |
| Waste Minimization | 2.833 | 1.853 | |
| Shorter Delivery Times | 3.051 | 1.873 | |
| Decreased Customer Complaints | 2.674 | 1.890 | |
| Commercial Benefits | |||
| Market Expansion to Local Areas | 2.452 | 1.620 | |
| Corporate Image | 2.642 | 1.798 | |
| Market Expansion to National Areas | 2.468 | 1.824 | |
| Increased Economic Earnings | 2.727 | 1.772 | |
| Economic Earnings | 2.695 | 1.810 | |
| Supply Chain Improvements | 2.649 | 1.826 | |
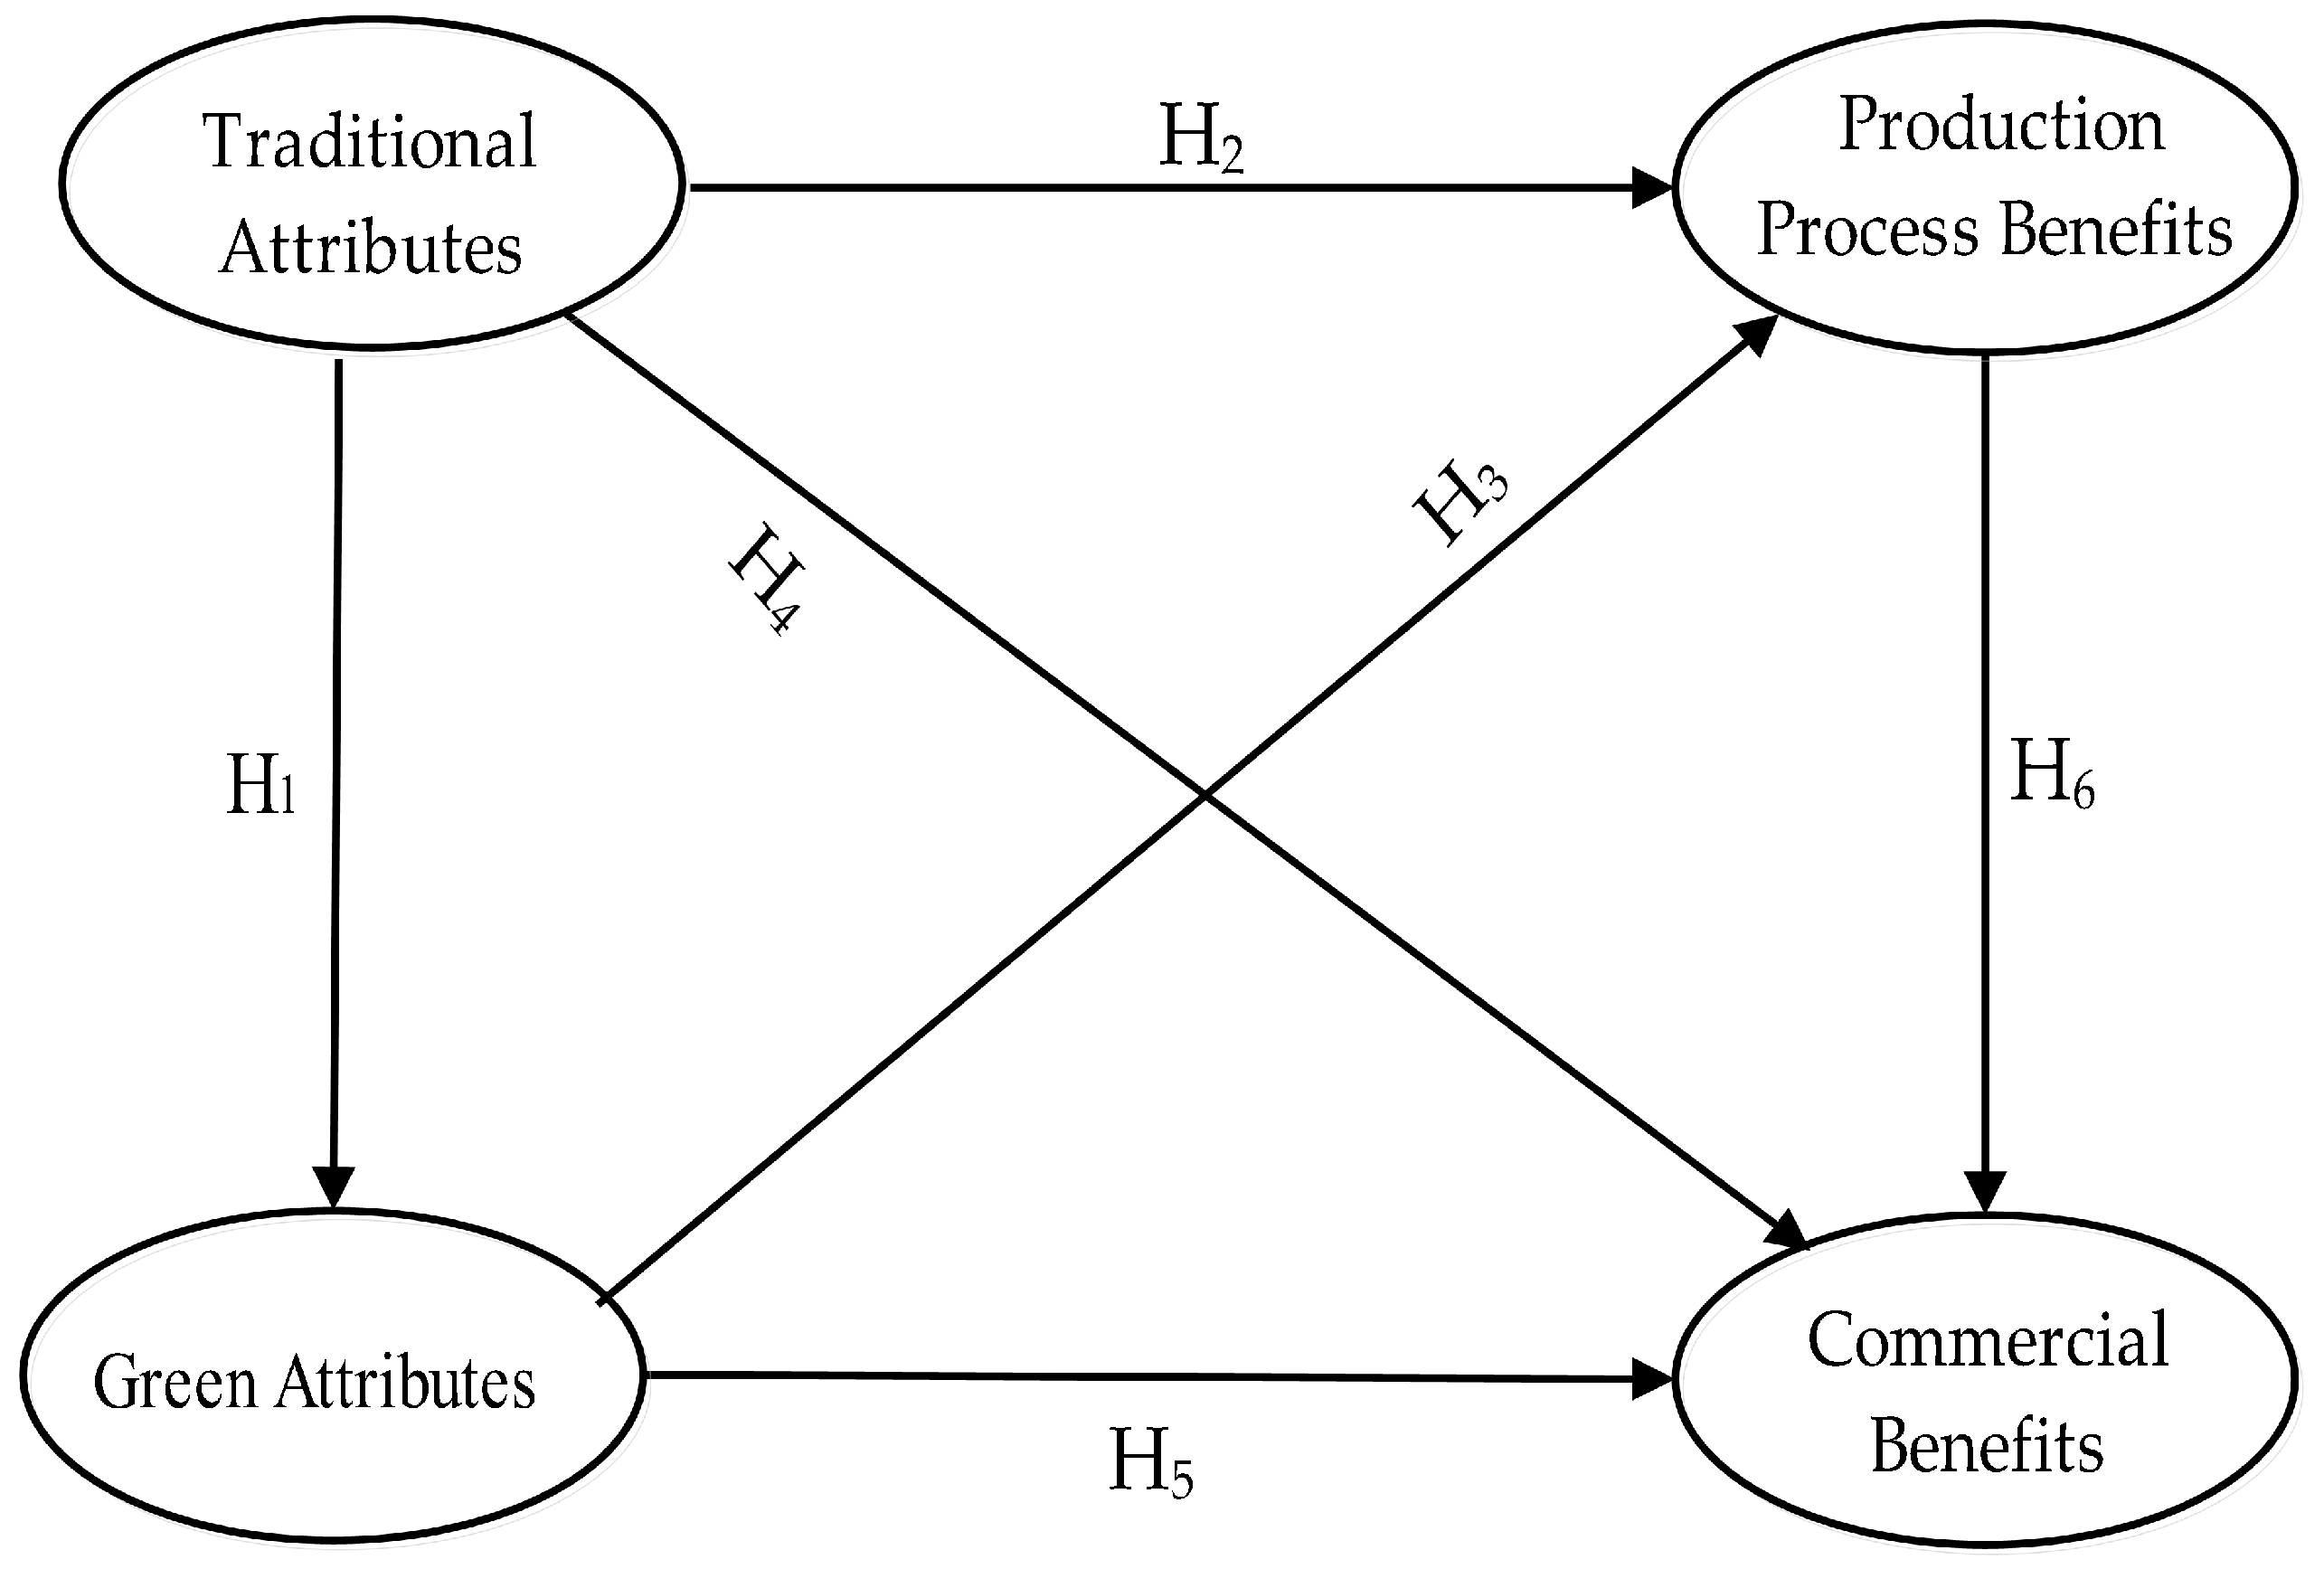
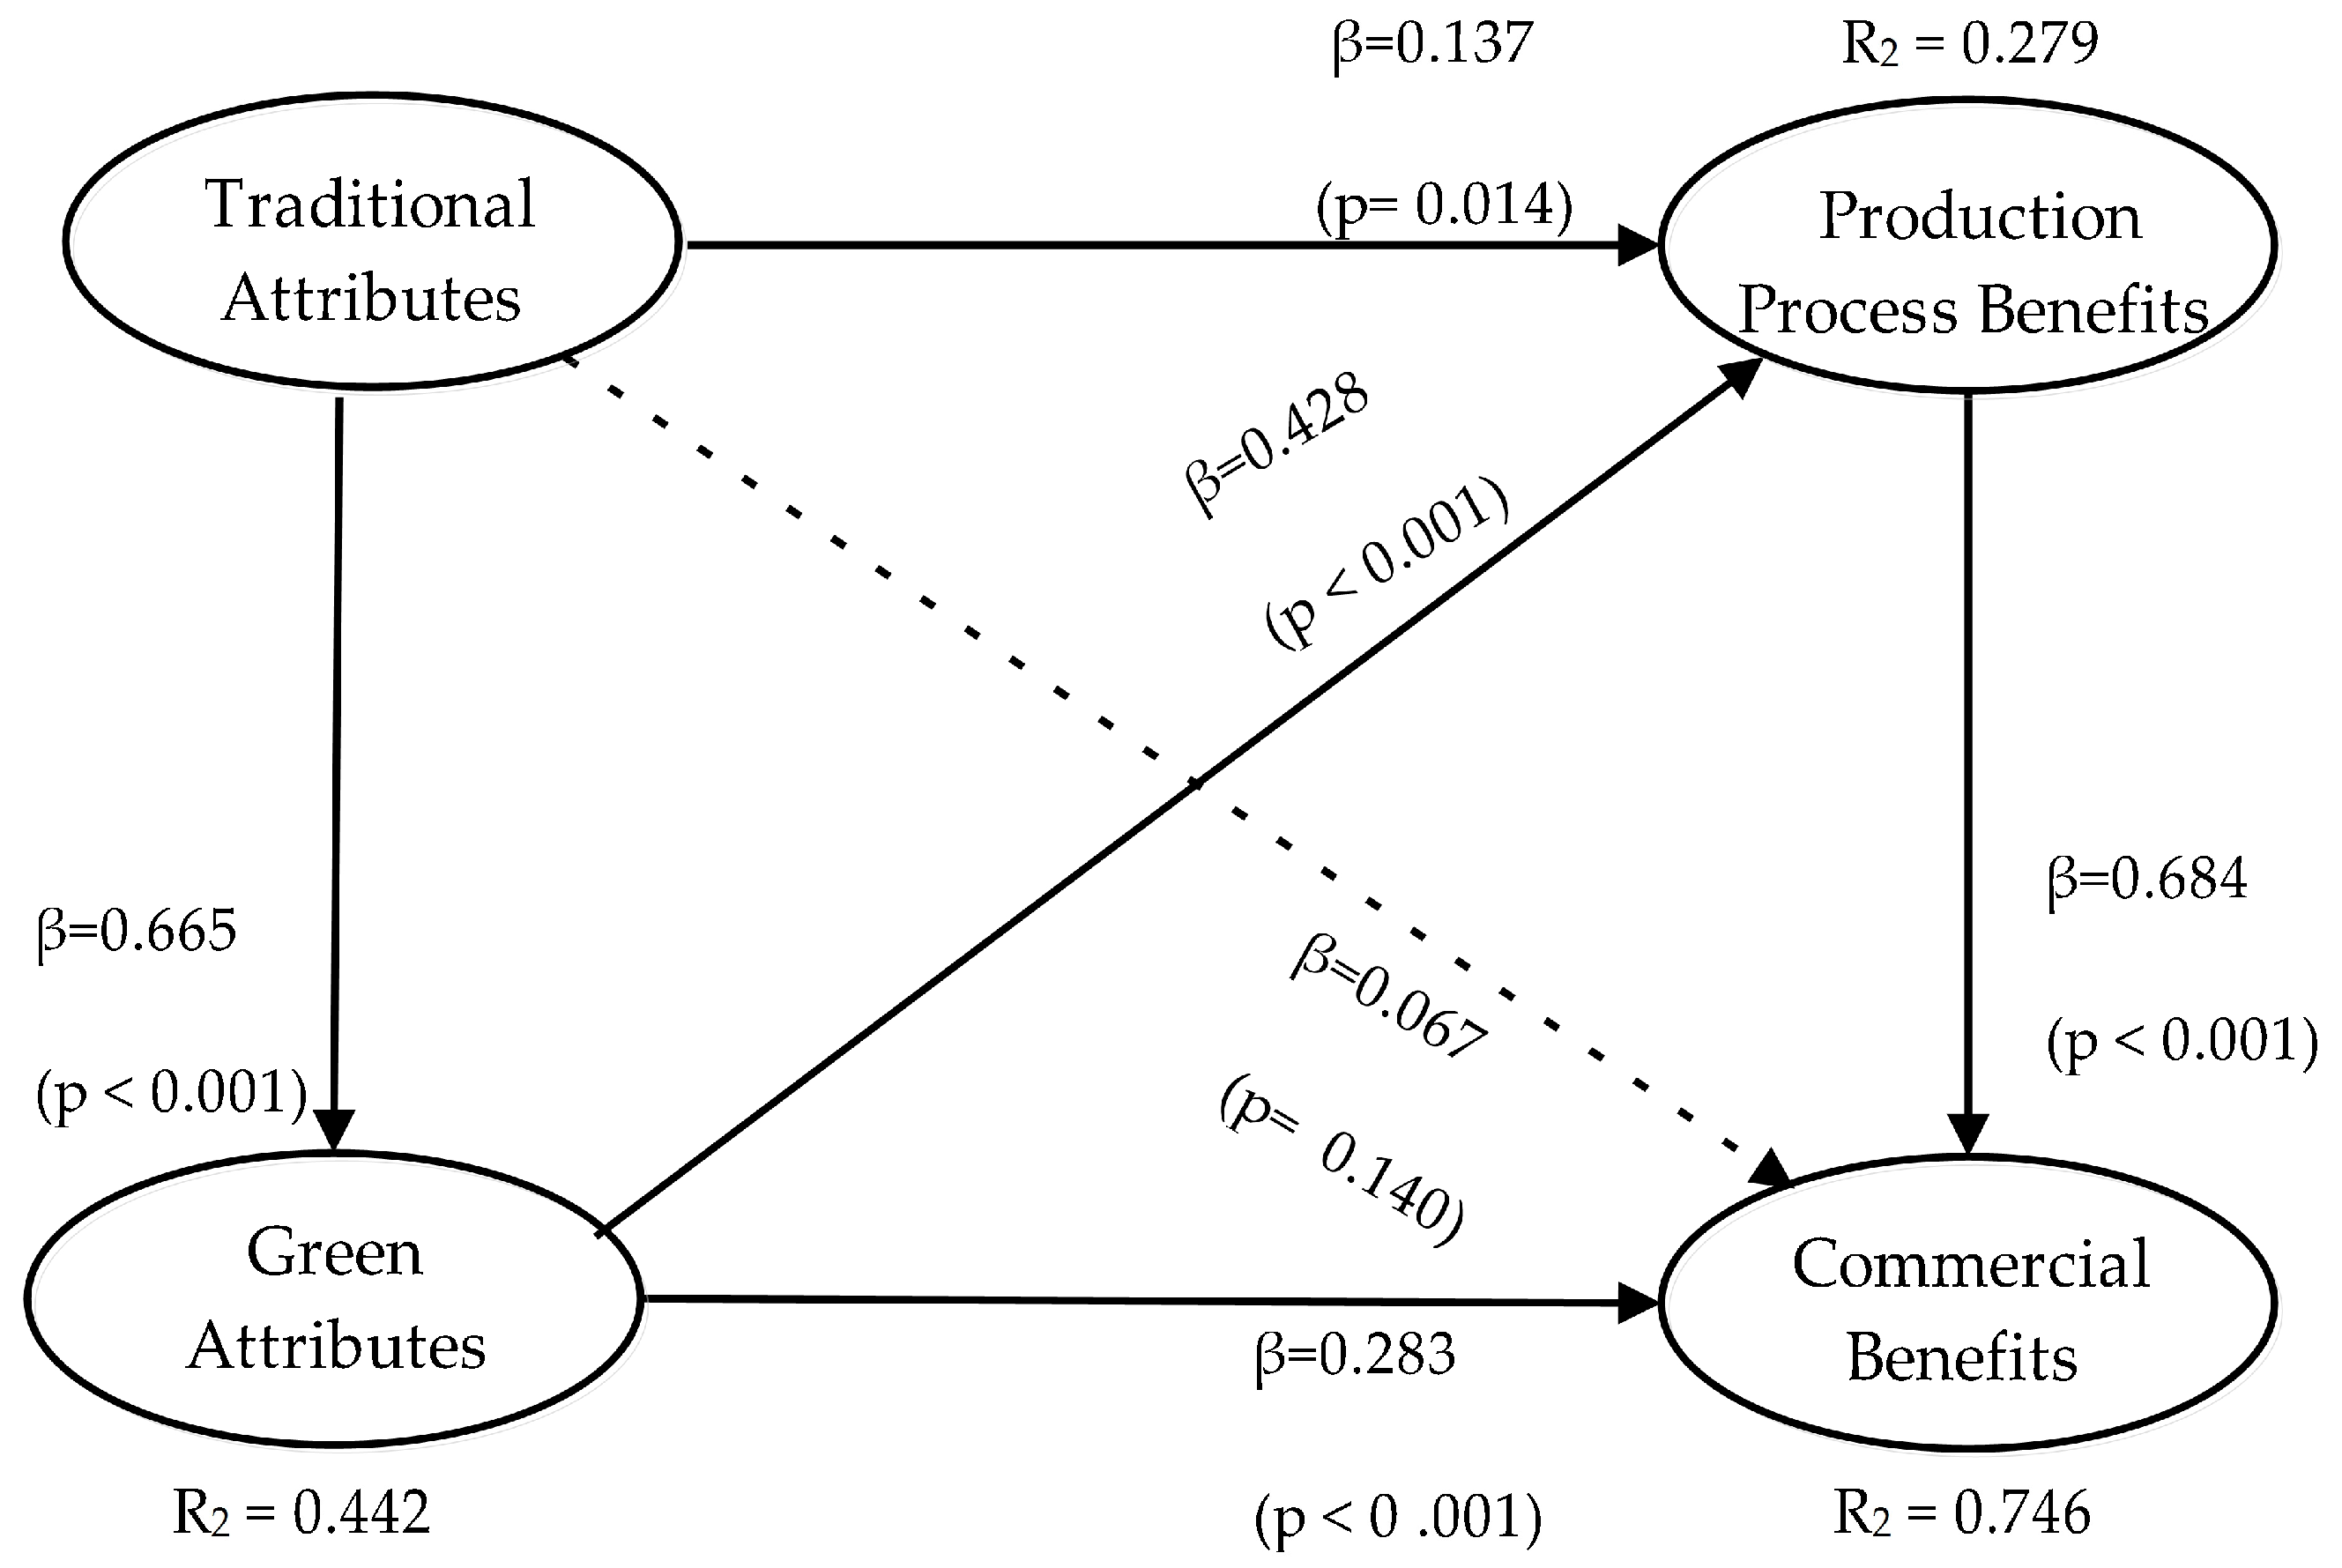
| Hypothesis | VI | VD | β | p-Value | Decision |
|---|---|---|---|---|---|
| H1 | TA | GA | 0.665 | p < 0.001 | Accepted |
| H2 | TA | PPB | 0.137 | p = 0.014 | Accepted |
| H3 | GA | PPB | 0.428 | p < 0.001 | Accepted |
| H4 | TA | CB | 0.067 | p = 0.140 * | Rejected |
| H5 | GA | CB | 0.286 | p < 0.001 | Accepted |
| H6 | PPB | CB | 0.684 | p < 0.001 | Accepted |
| To | From | |
|---|---|---|
| Traditional Attributes | Green Attributes | |
| Commercial Benefits | 0.478 (p < 0.001) ES = 0.193 | |
| Production Process Benefits | 0.284 (p < 0.001) ES = 0.119 | 0.292 (p < 0.001) ES = 0.174 |
| To | From | ||
|---|---|---|---|
| Traditional Attributes | Green Attributes | Production Process Benefits | |
| Green Attributes | 0.665 (p < 0.001) ES = 0.442 | ||
| Commercial Benefits | 0.545 (p < 0.001) ES = 0.220 | 0.579 (p < 0.001) ES = 0.343 | 0.684 (p < 0.001) ES = 0.549 |
| Production Process Benefits | 0.421 (p < 0.001) ES = 0.177 | 0.428 (p < 0.001) ES = 0.222 | |
© 2017 by the authors. Licensee MDPI, Basel, Switzerland. This article is an open access article distributed under the terms and conditions of the Creative Commons Attribution (CC BY) license (http://creativecommons.org/licenses/by/4.0/).
Share and Cite
Mendoza-Fong, J.R.; García-Alcaraz, J.L.; Díaz-Reza, J.R.; Sáenz Diez Muro, J.C.; Blanco Fernández, J. The Role of Green and Traditional Supplier Attributes on Business Performance. Sustainability 2017, 9, 1520. https://doi.org/10.3390/su9091520
Mendoza-Fong JR, García-Alcaraz JL, Díaz-Reza JR, Sáenz Diez Muro JC, Blanco Fernández J. The Role of Green and Traditional Supplier Attributes on Business Performance. Sustainability. 2017; 9(9):1520. https://doi.org/10.3390/su9091520
Chicago/Turabian StyleMendoza-Fong, José Roberto, Jorge Luis García-Alcaraz, José Roberto Díaz-Reza, Juan Carlos Sáenz Diez Muro, and Julio Blanco Fernández. 2017. "The Role of Green and Traditional Supplier Attributes on Business Performance" Sustainability 9, no. 9: 1520. https://doi.org/10.3390/su9091520
APA StyleMendoza-Fong, J. R., García-Alcaraz, J. L., Díaz-Reza, J. R., Sáenz Diez Muro, J. C., & Blanco Fernández, J. (2017). The Role of Green and Traditional Supplier Attributes on Business Performance. Sustainability, 9(9), 1520. https://doi.org/10.3390/su9091520