4.1. Land Cover Regions Deriving from POIs
Land cover classification results of POIs are shown in
Table 4. One million five hundred eleven thousand, three hundred and eight (1,511,308) of a total 1,528,104 POIs are considered as artificial surfaces, occupying 98.90% of all POIs. Water bodies contain 2496 POIs, which only covers 0.16% of total POIs. Cultivated land and forest/grassland contain 1830 and 815 POIs, relatively, with the proportion of 0.11% and 0.05% of total POI number. The remaining 11,655 POIs are unclassified, taking up 0.76% of all POIs. This indicates that the largest proportion of POIs belongs to artificial surfaces. Further, POIs corresponding to non-artificial surfaces (namely cultivated land, forest/grassland, water bodies, and unclassified class) take up only no more than 2% of all data.
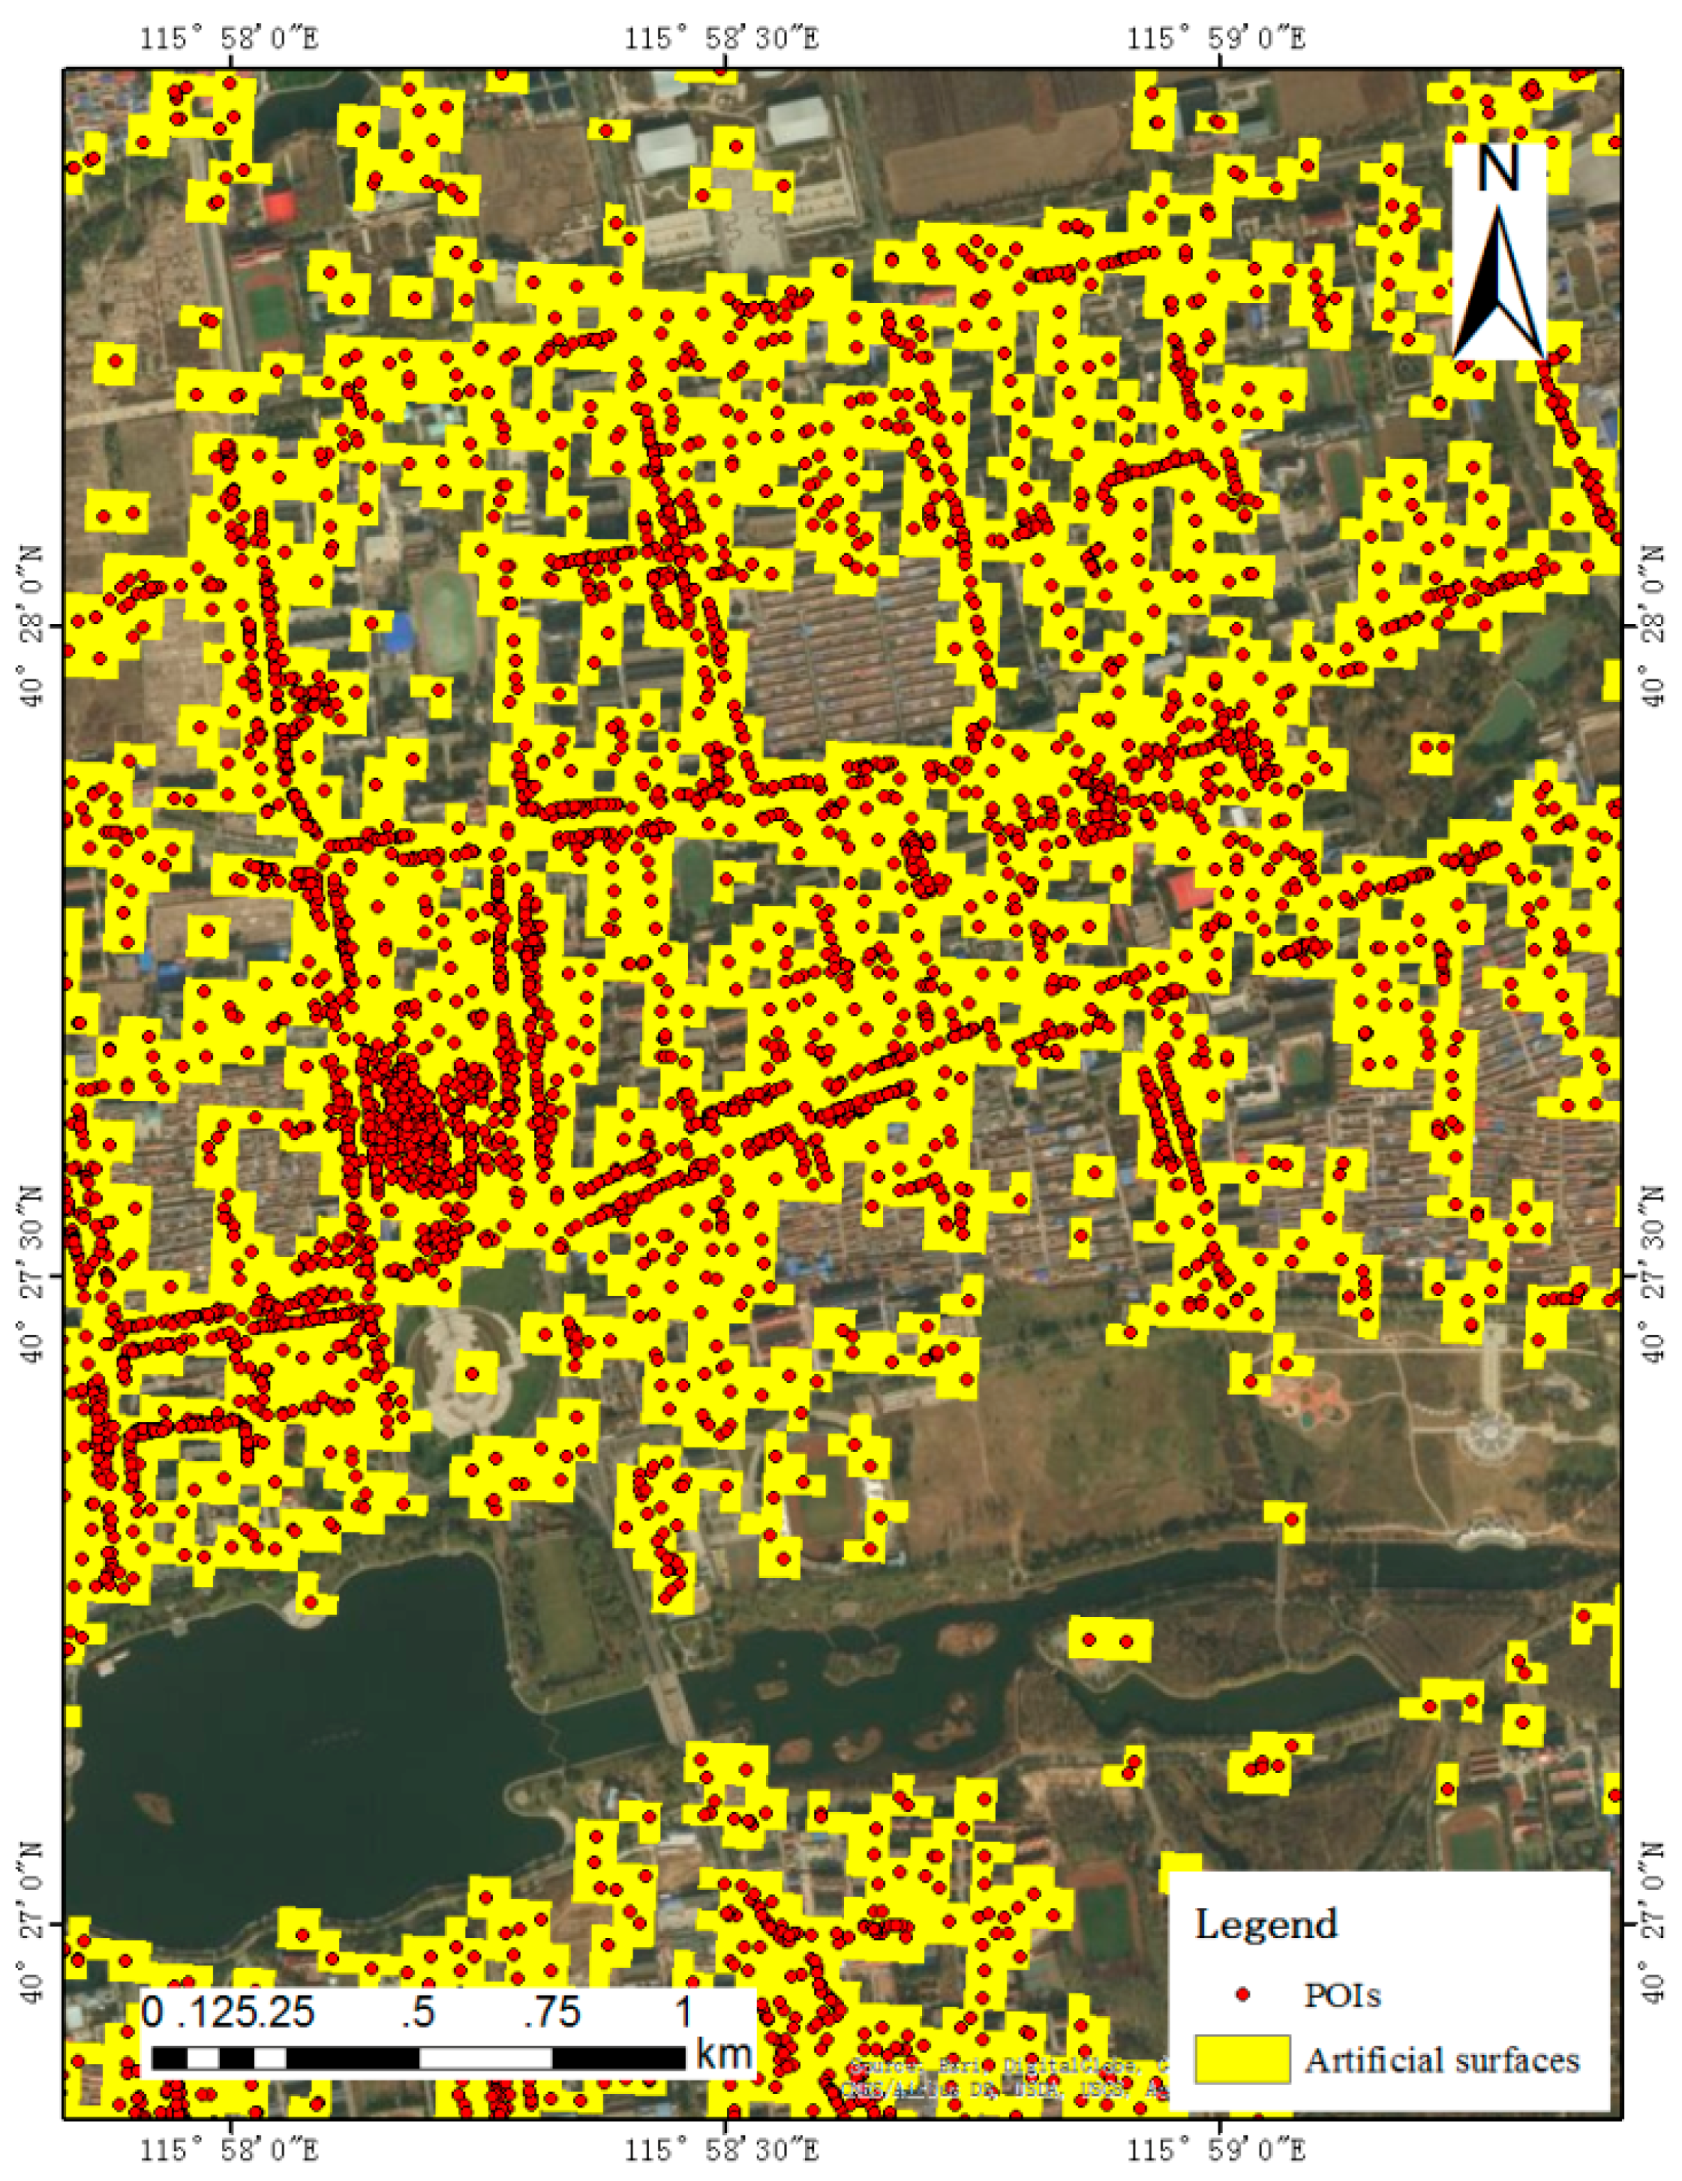
Based on the POI classification in
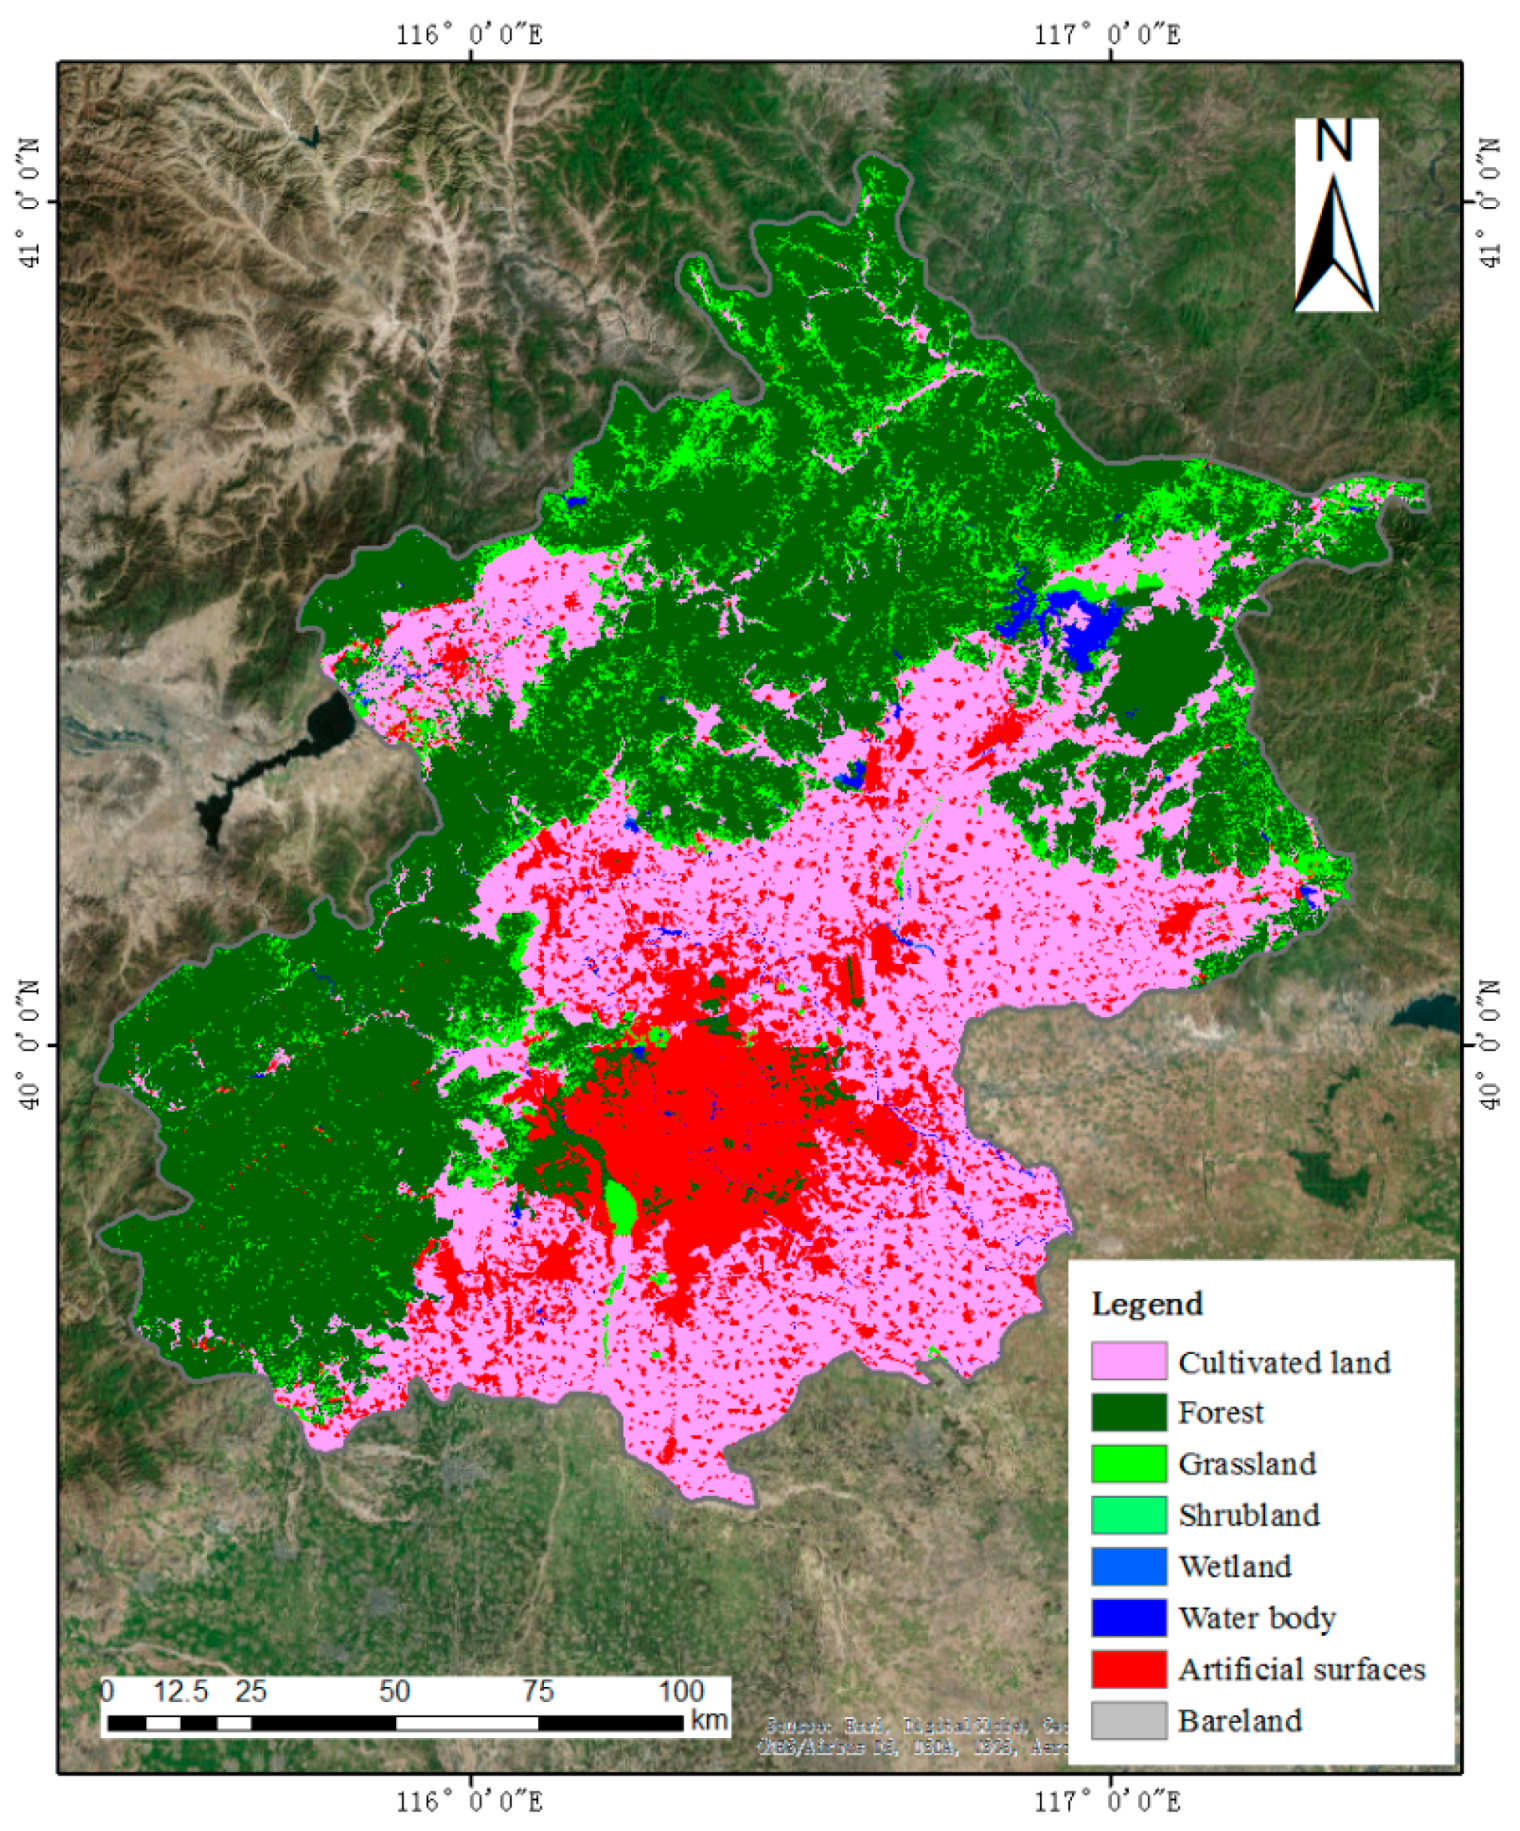
Table 3, land cover regions are generated from POIs, and the results are shown in
Figure 6. Most of the areas belong to artificial surfaces, which is consistent with the proportion of POIs classified as the same class. For the regions of cultivated land, forest/grassland, and water bodies, they occupied much smaller proportions of areas because of the relatively low number of POIs.
A detailed analysis is displayed in
Table 5 In total, 96,128.28 ha were generated from the classified POIs, with 1,068,092 grids (each grid was 30 m × 30 m). Among these land cover classes, artificial surfaces occupy the largest areas, with 95,035.5 ha, which take up 98.86% of the total 96,128.28 ha area. Five thousand nine hundred and seventy-three (5973) grids are classified as water bodies with areas of 537.57 ha, about 0.56% of all areas. Only 4089 grids refer to cultivated land, which occupies 368.01 ha in total generated areas. Forest/grassland takes up the smallest areas and totals 187.2 ha with the percentage of 0.19%.
4.2. Accuracy Evaluation
Table 6 shows the confusion matrix between land cover regions generated from POIs and reference points. The result indicates that an overall accuracy of 89.20% is achieved in this area. In terms of producer’s accuracy (PA), a value of 94.23% is achieved in the artificial surfaces class. The accuracy of cultivated land and forest/grassland are 80.36% and 81.48%, respectively. As for the class of water bodies, the user’s accuracy (UA) is much lower, with the value of 72.00%, while the value 100% is achieved in producer’s accuracy. Visual inspection of the low user’s accuracy in water bodies show that several points are actually located in cultivated land and forest/grassland, and a few of them are distributed in artificial surfaces. Forest/grassland shows a user’s accuracy of 88.00%, which is much higher than that of producer’s accuracy. Cultivated land and artificial surfaces achieved an UA value of 90.00% and 98.00%, respectively, with an increasing value of approximately 10% and 4% compared with producer’s accuracy.
In general, the classification accuracy in
Table 6 indicates that the land cover regions in 2016 generated from POIs are reliable in the application of land cover changes detection. It is worth noting that the user’s accuracy of water bodies is relatively low. Therefore, future work will investigate other land cover classification approaches in order to improve the classification accuracy. Further, the classification of Globeland30 in 2010 shows an accuracy of approximately 80% [
21]. Based on the above analysis, it shows that GlobeLand30 and regions generated from POIs can be used to detect land cover changes from 2010 to 2016.
4.3. Rapid LCC Detection Using POIs
We proposed a post-classification method with land cover regions generated by POIs in 2016 and GlobeLand30 in 2010. Based on the POIs classification and the corresponding land cover regions above, four kinds of unchanged land cover classes and 18 kinds of changed classes were detected during this period. However, since the POI classification accuracy of water bodies in
Table 2 is relatively low, LCC that is from other land cover classes to water bodies is considered as the unchanged original land cover. On the other hand, LCC that is from artificial surfaces or water bodies to other land cover classes is regarded as unchanged artificial surfaces. This is due to the fact that artificial surfaces and water bodies are not likely to be transitioned to other classes. Moreover, as
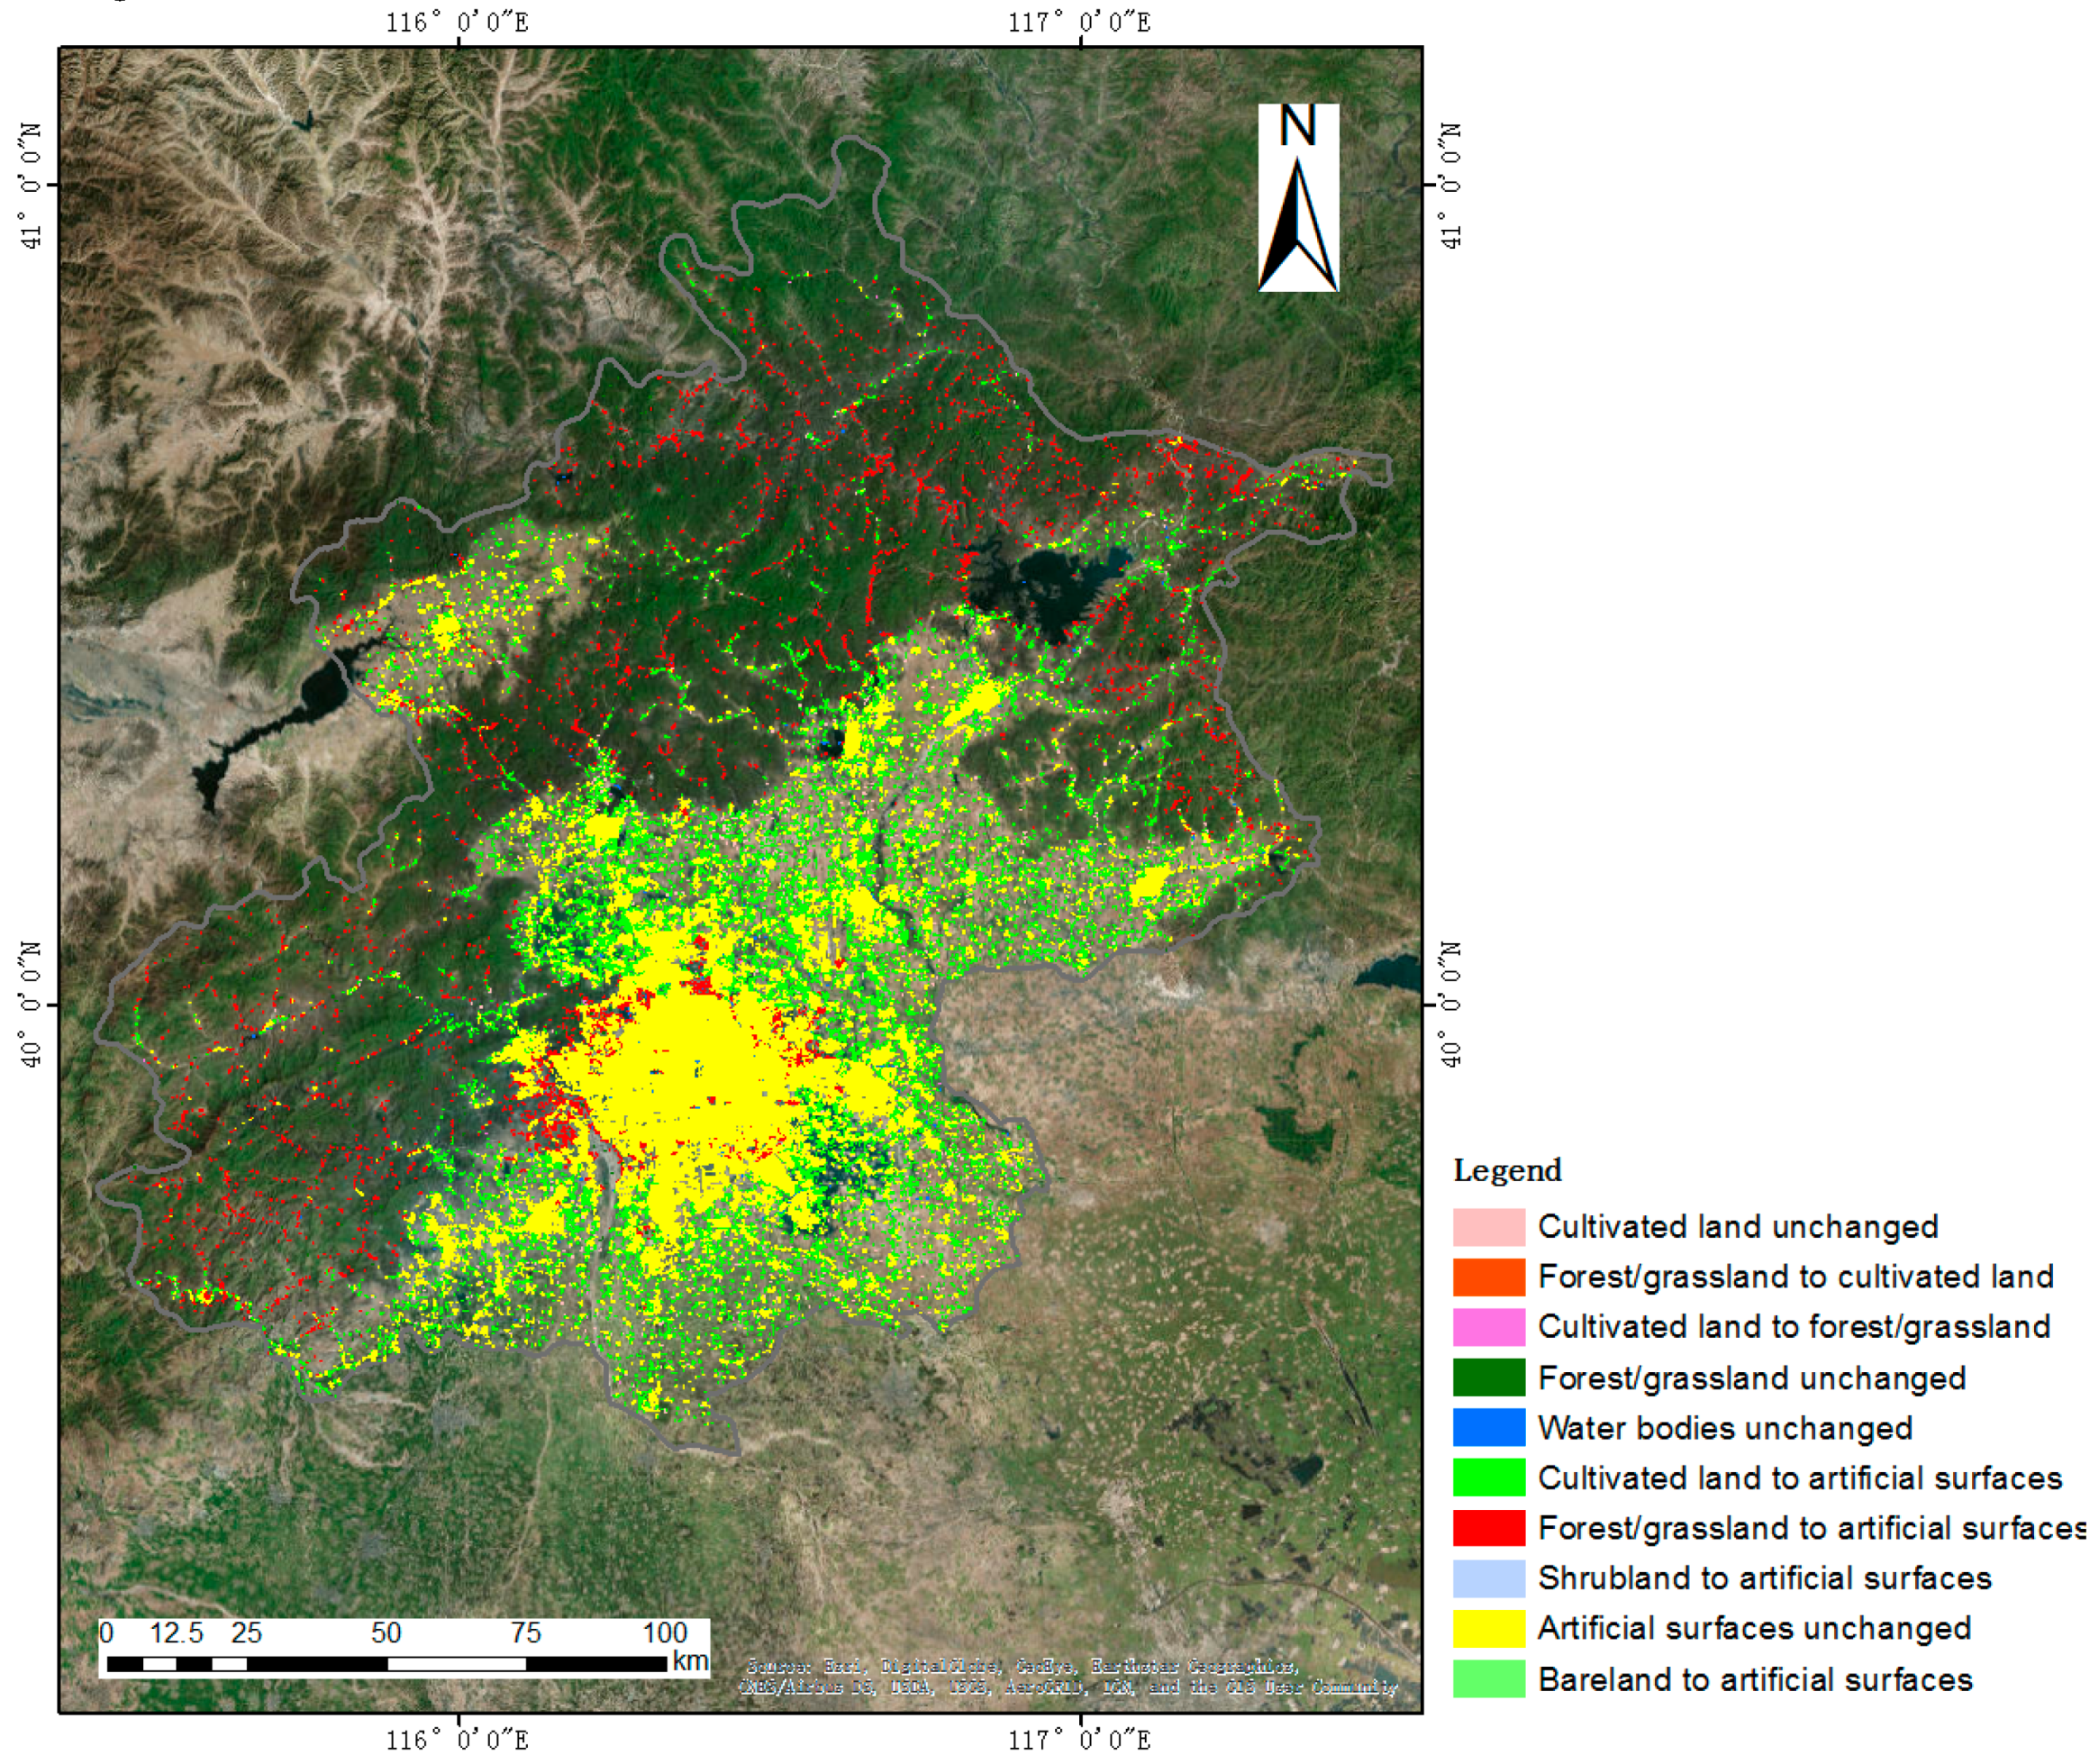
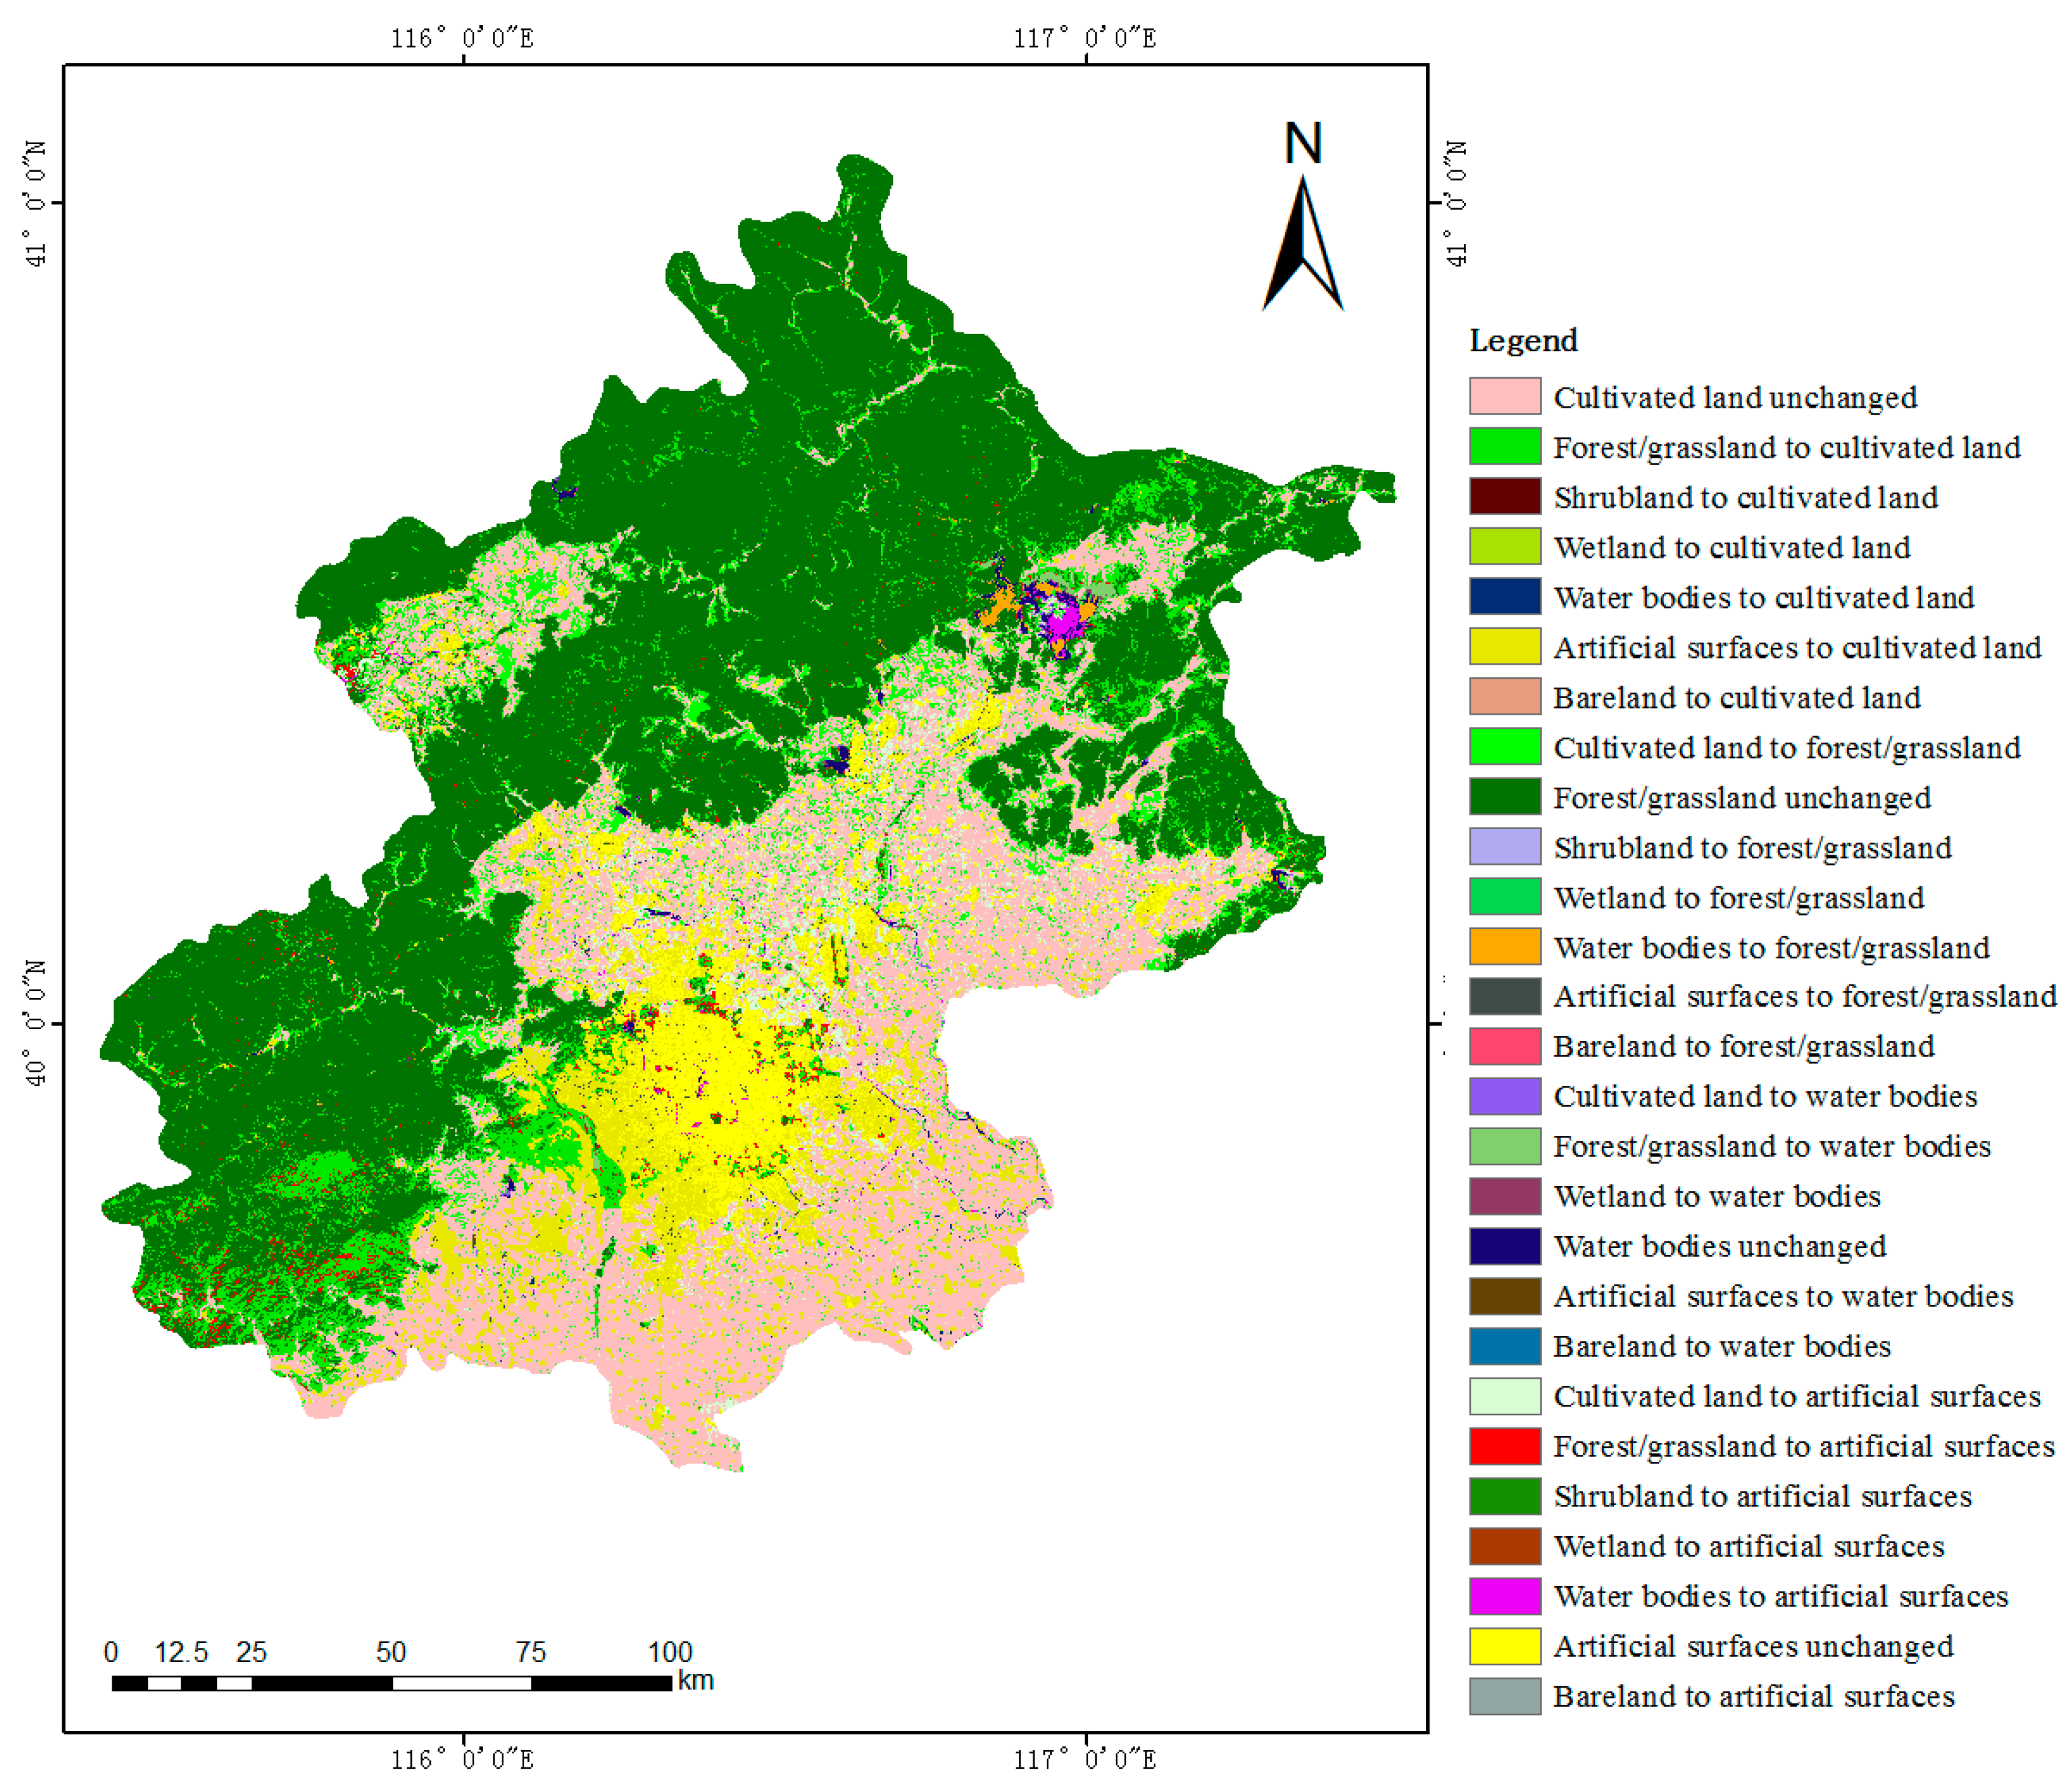
Table 5 indicates that cultivated land, forest/grassland, and water bodies only collectively contain a small proportion of areas, they are less able to be fully used in LCC detection. As a result, four kinds of unchanged classes and six kinds of changed classes are represented in
Figure 7. Changes from forest/grassland to cultivated land, cultivated land to forest/grassland, cultivated land to artificial surfaces, forest/grassland to artificial surfaces, shrubland to artificial surfaces, and bareland to artificial surfaces are detected in this area. For a visual overview of land cover changes in Beijing, artificial surfaces remain the largest areas among four unchanged classes. Other unchanged classes including cultivated land, forest/grassland, and water bodies only occupy a small proportion of the total areas. Both LCC from cultivated land and forest/grassland to artificial surfaces have a high percentage increase among the changed land cover regions, while other changes occupy fewer regions due to the limited number of POIs.
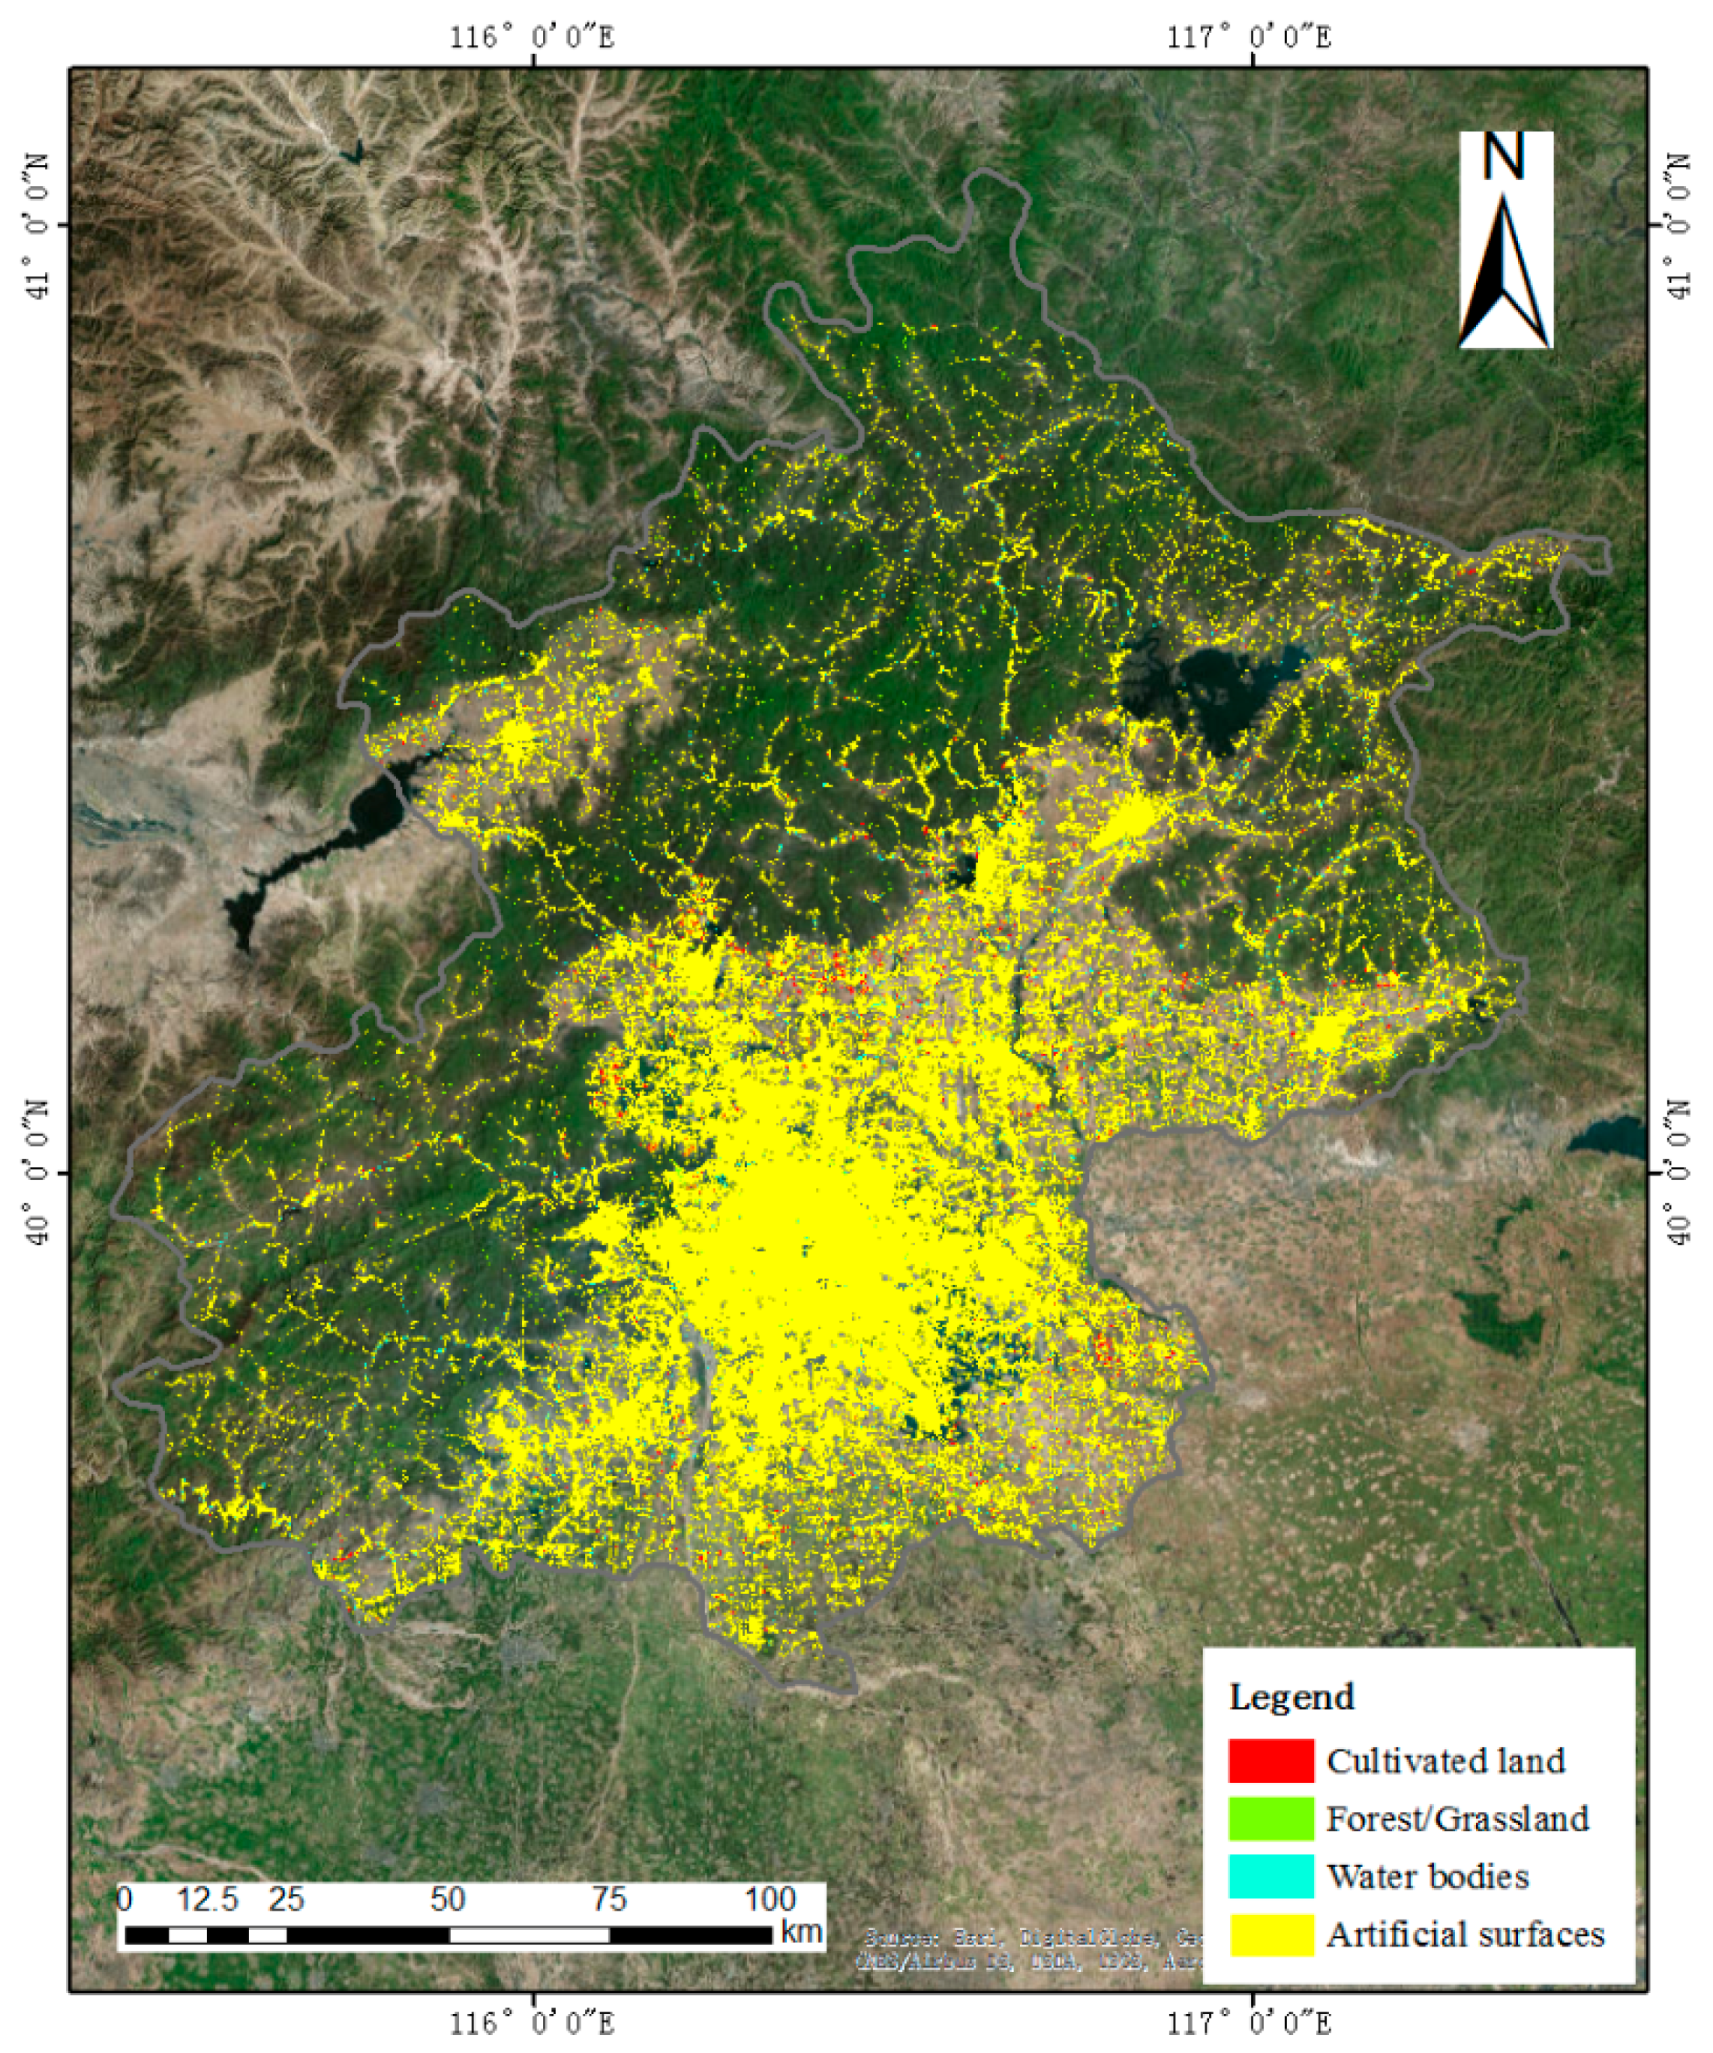
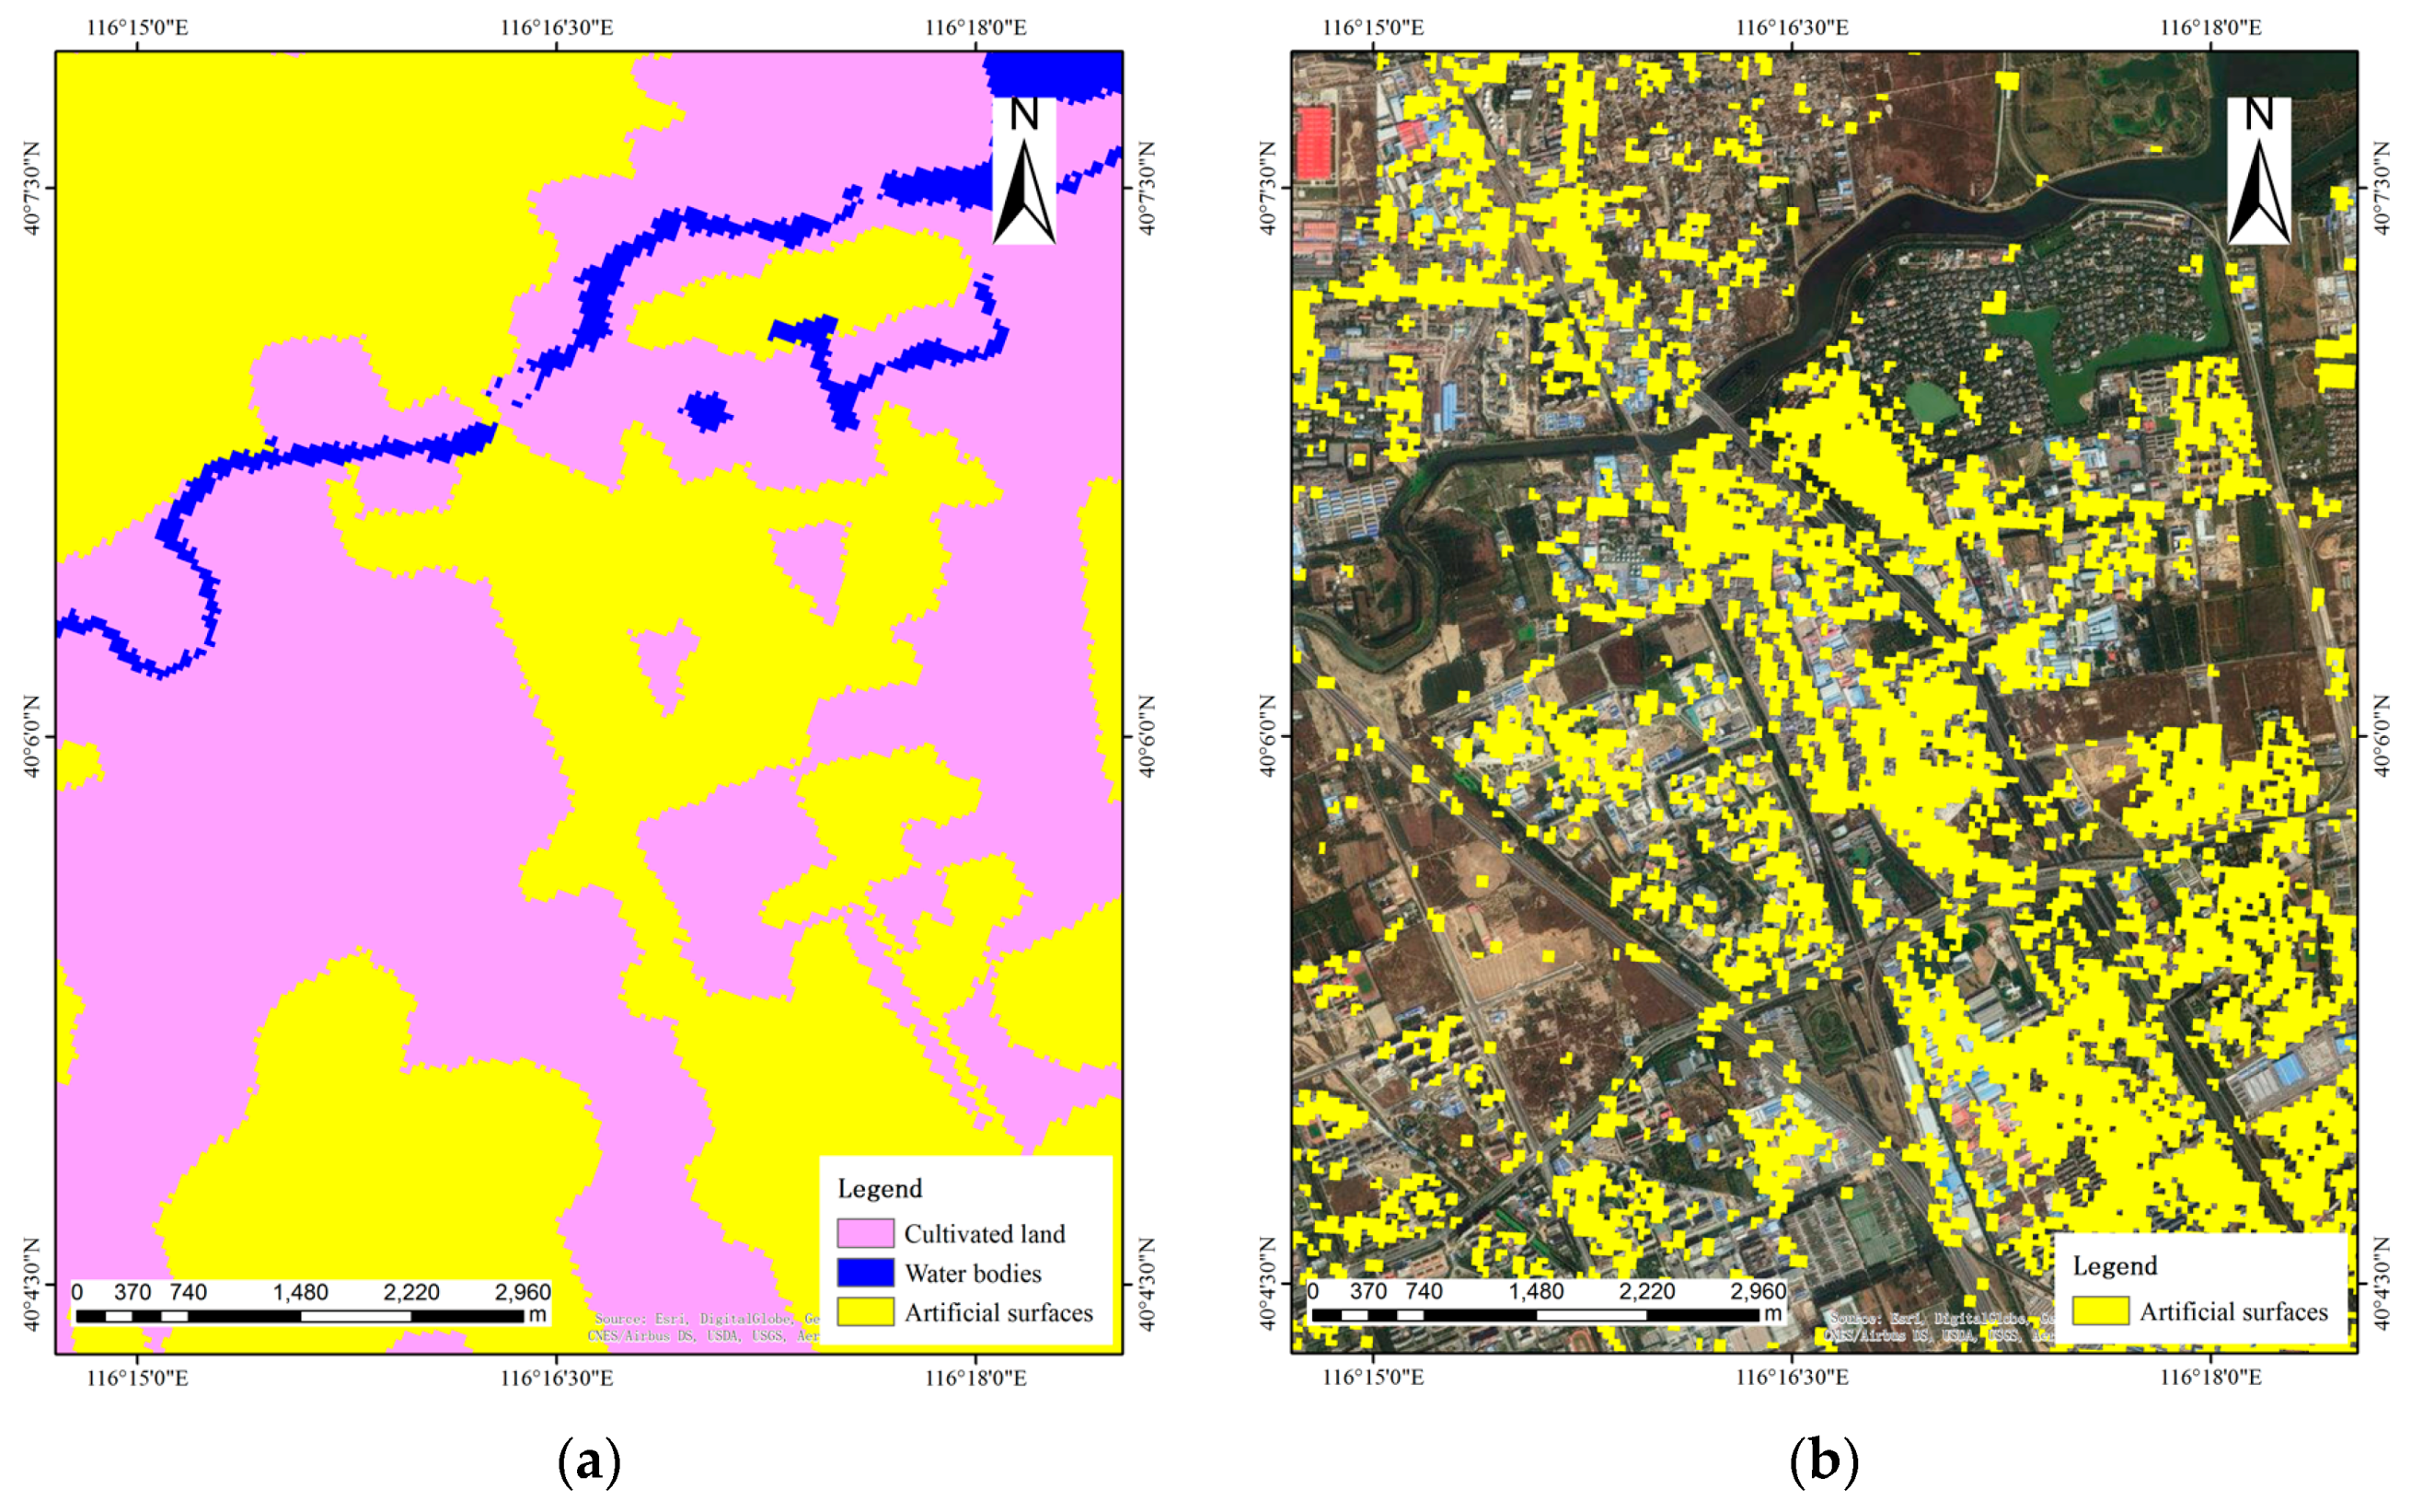
In detail, LCC can be shown in both rural and urban regions.
Figure 8 displays land cover transition from cultivated land to artificial surfaces in rural regions. Areas in yellow represent artificial surfaces. Compared with the artificial surfaces in 2010 in
Figure 8a, areas in 2016 in
Figure 8b have a much wider distribution. This indicates that a large number of areas of cultivated land are replaced by artificial surfaces in the period of 2010 to 2016. We highlight these changes in
Figure 8c with green areas. These changes can be validated visually by referring to the images provided by Esri, one of which is shown in
Figure 8d. This shows that an expansion of built-up areas replace cultivated land during this period.
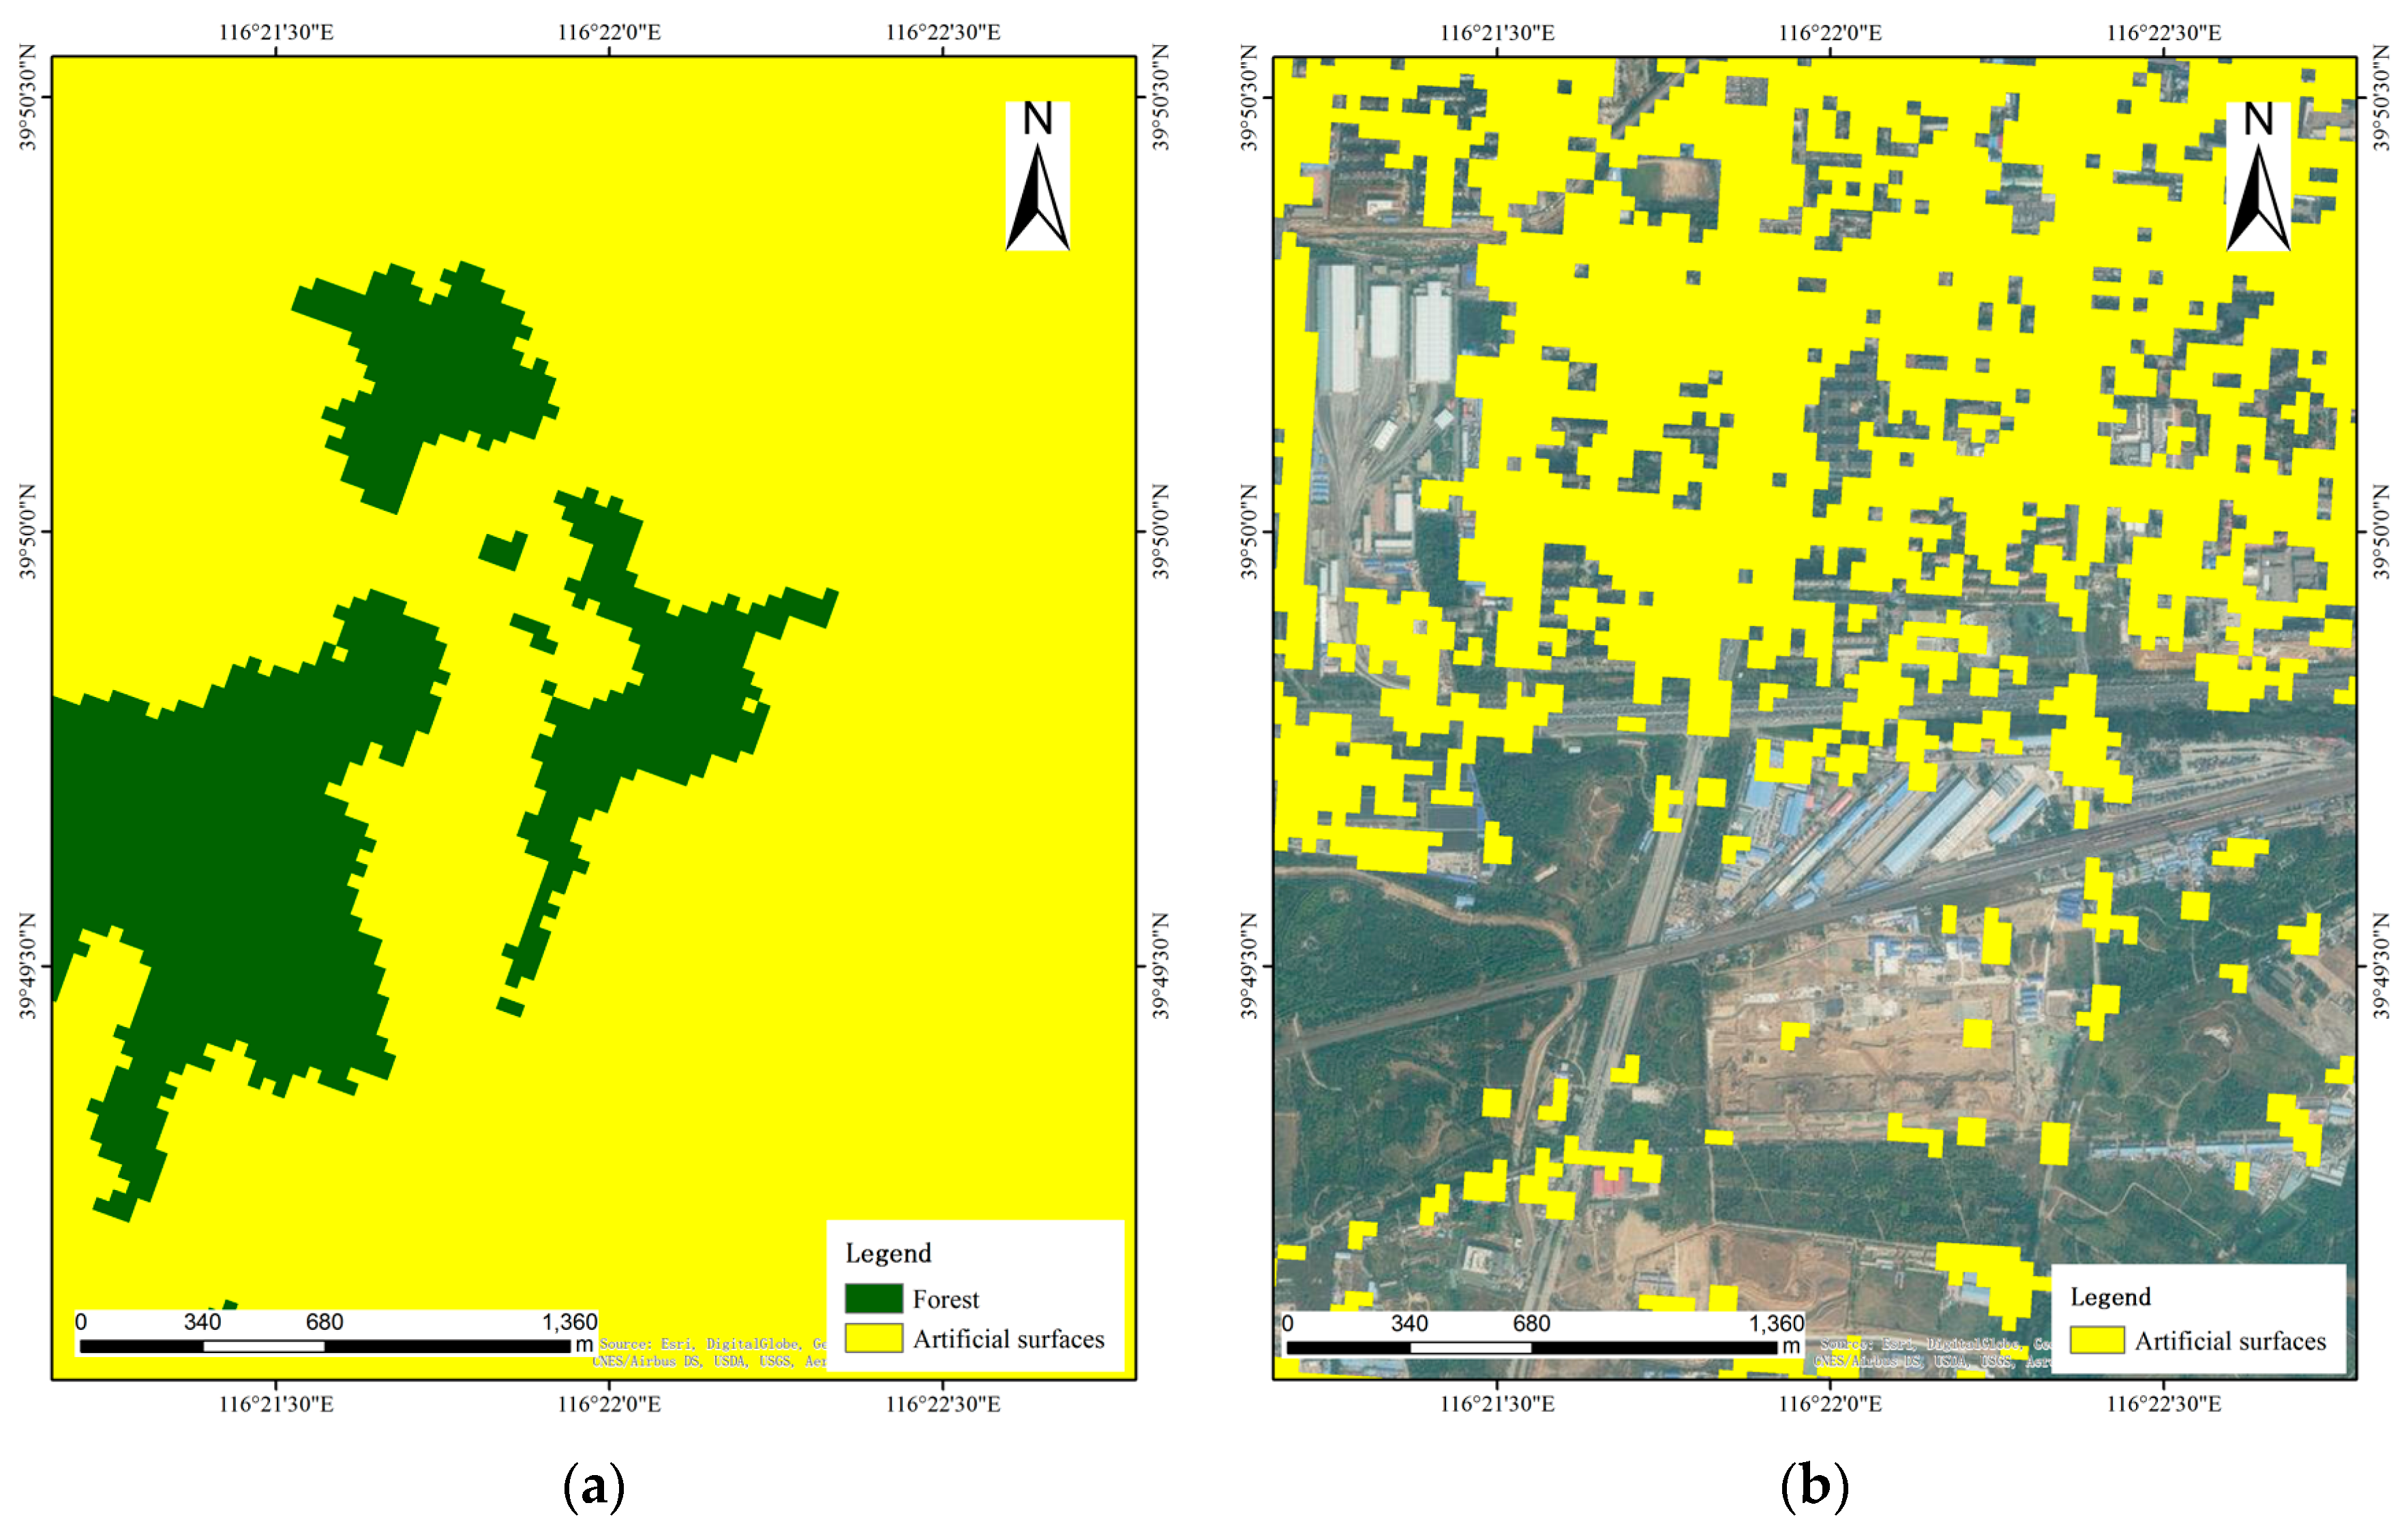
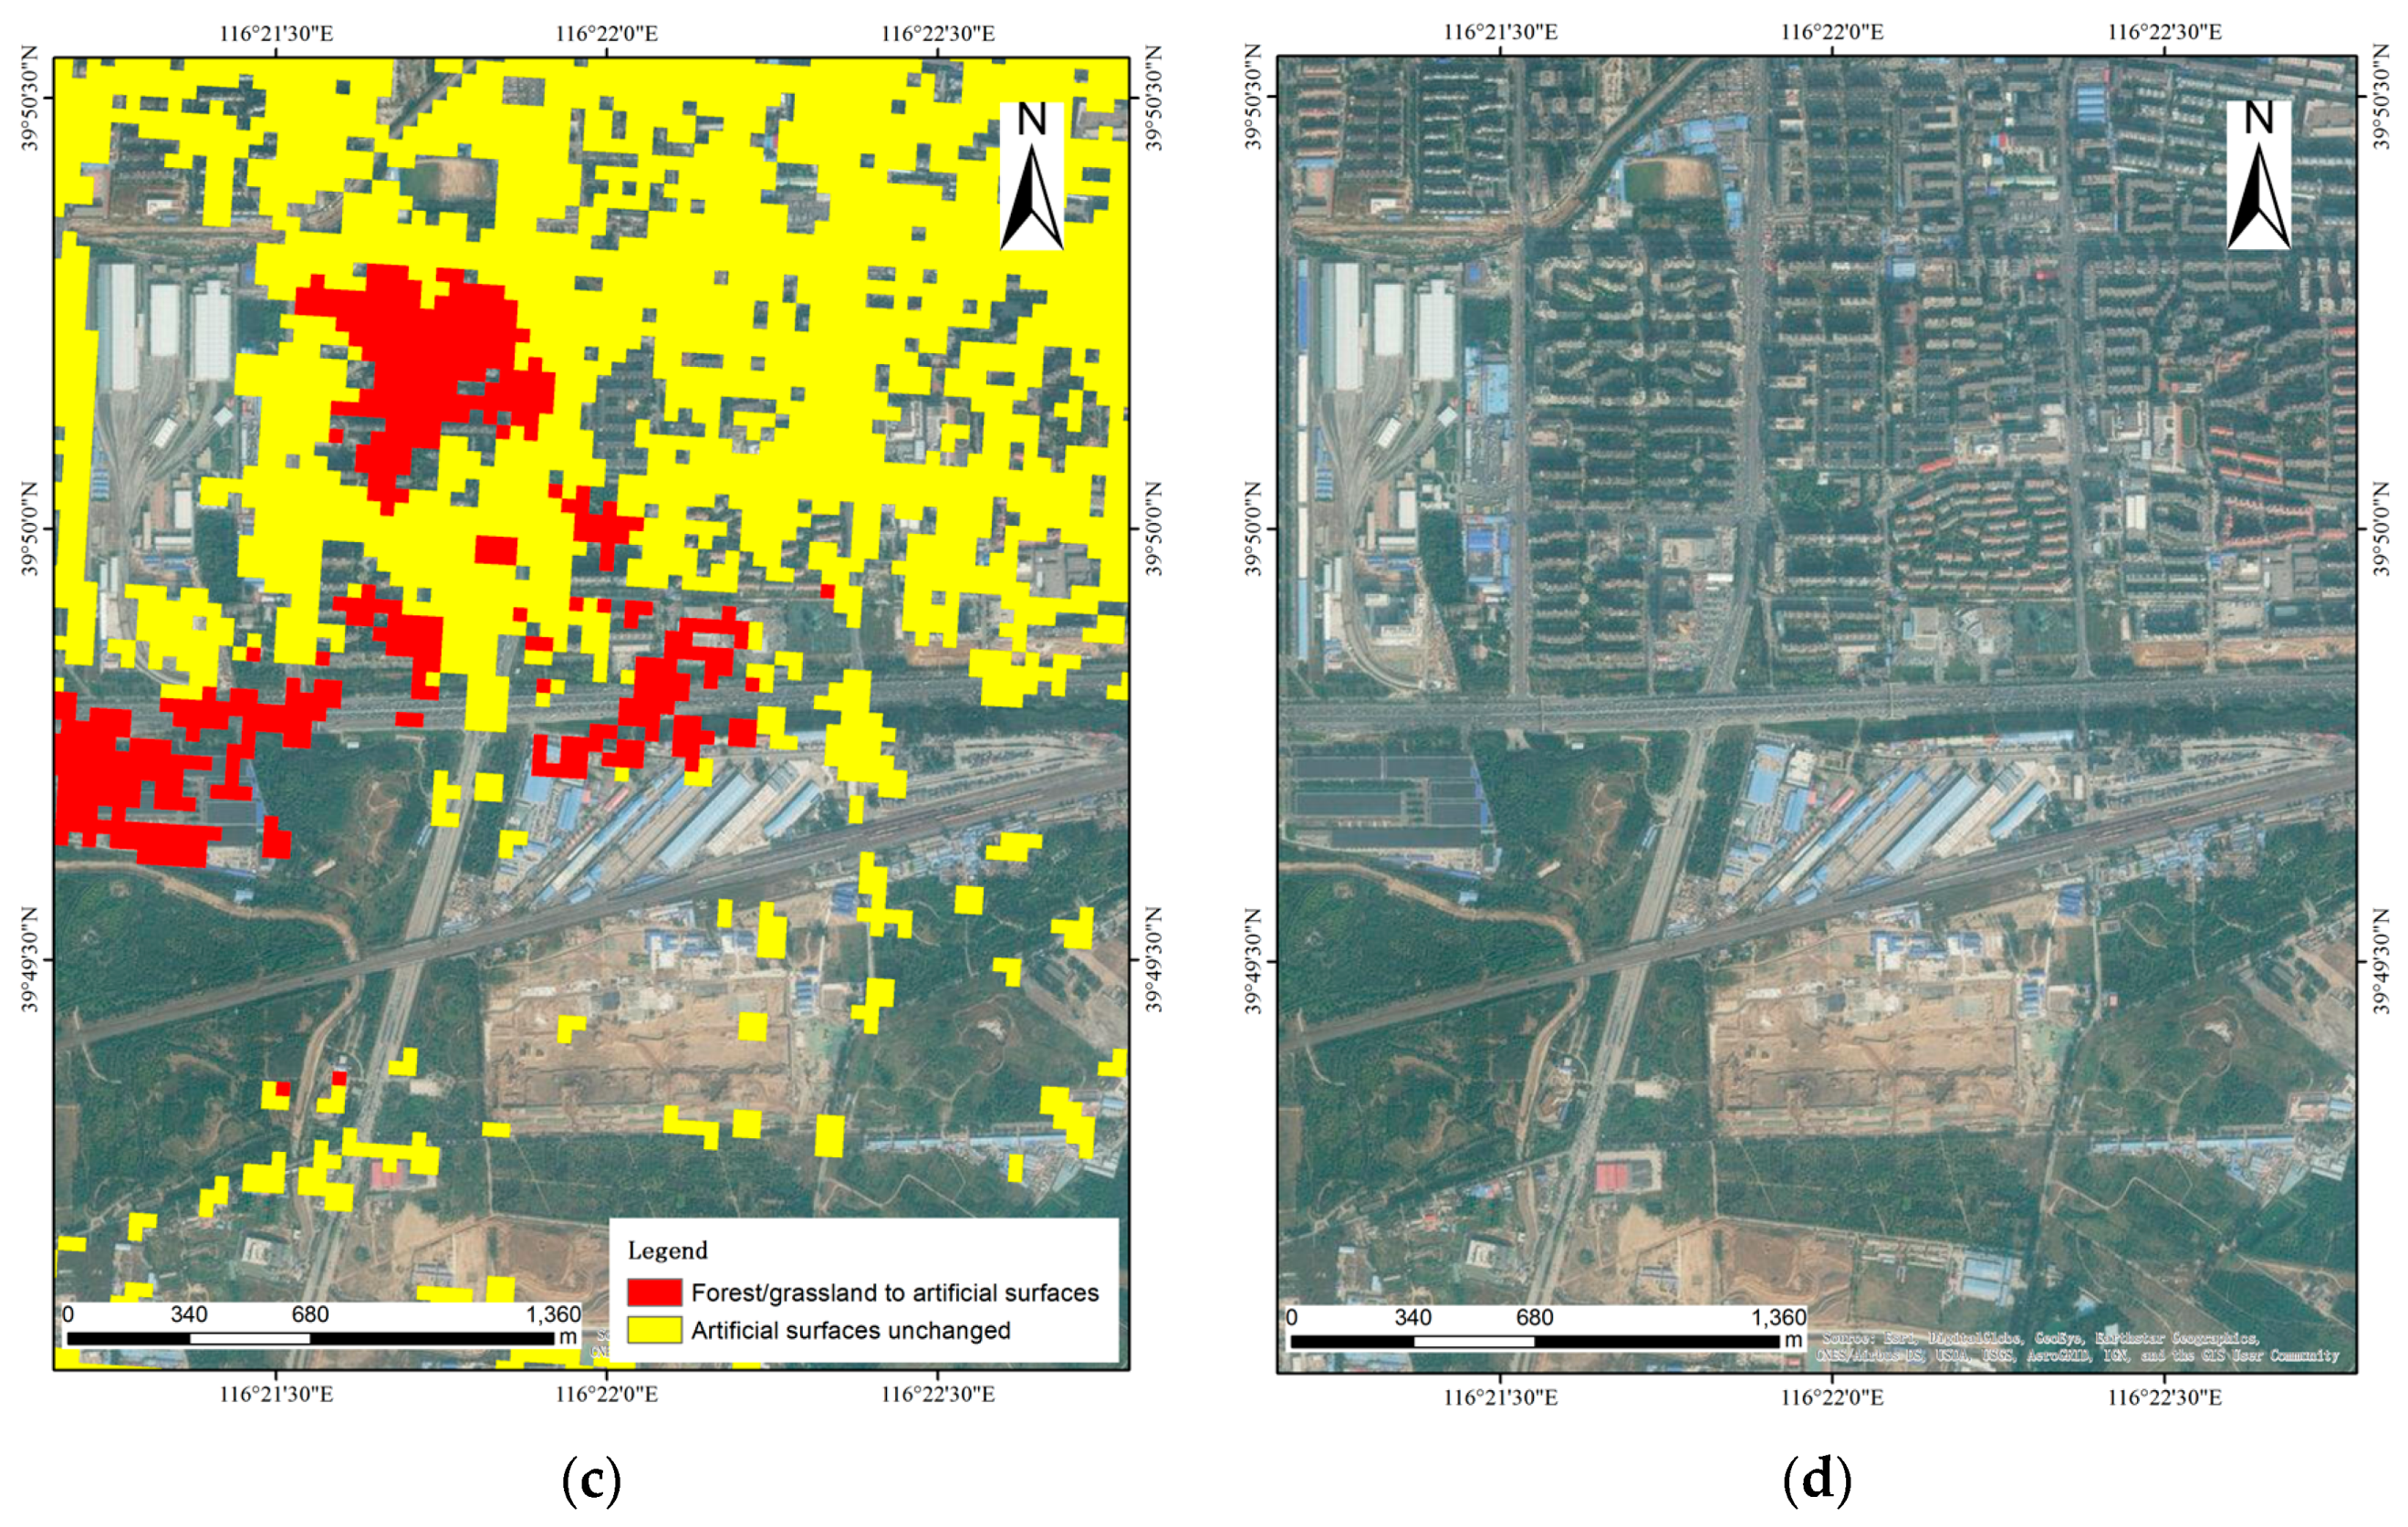
LCC can also be detected in urban areas, where land cover transitions from forest/grassland to artificial surfaces (
Figure 9).
Figure 9a,b display the changes of artificial surfaces and forest/grassland in the period of 2010 to 2016. An increase of artificial surfaces can be seen in the north and west of the area, although the land cover regions generated by POIs are sparser because of the lack of POIs (
Figure 9c). These changes are highlighted in red in
Figure 9c, which can be evaluated based on images in
Figure 9d.
4.4. LCC Detection Comparison between Remotely Sensed Images and CGI
To compare the LCC detection efficiency between POIs and remotely sensed images, a traditional method is proposed to monitor LCC in the 2010–2016 period. In general, LCC detection usually contains two methods, namely post-classification approaches and direct radiometric comparison approaches. LCC detection with post-classification approaches is based on the comparison of land cover classification using remotely sensed images, while direct radiometric comparison approaches propose a comparison of images before classifying land cover. Noting that we use the GlobeLand30 product as land cover in 2010 and do not rely on remotely sensed images, we use post-classification approaches for LCC detection.
We selected three images from Landsat 8 in 2016 as experimental data. Since these images are not generated in the same time, the atmospheric conditions can be variable. Therefore, both radiometric calibration and atmospheric correction are required for data pre-processing. Then, we used Maximum likelihood classifier to classify land cover with the processed images. As training data are required via image interpretation, we selected eight data samples as water bodies, twenty-five data samples as forest/grassland, thirty data samples as cultivated land, and thirty-two data samples as artificial surfaces. On the other hand, CGI usually contains land cover information and does not rely on selecting training data via image interpretation. After images from Landsat 8 were classified with different land cover classes, a post-classification approach was applied to detect LCC using classified regions and GlobeLand30 in 2010. The result is shown in
Figure 10. Since land cover regions generated by Landsat 8 data are much wider than POIs, the LCC transitions are more complicated with different land cover classes.
Then, we analysed the differences and efficiency of these two data sources. The methods comparison is displayed in
Table 7. In the stage of data pre-processing, both remotely sensed images and CGI are processed to extract useful land cover information. However, pre-processing with remotely sensed images is very time consuming, as radiometric calibration, atmospheric correction, and image mosaic are very complicated. More importantly, the increasing number of remotely sensed images could extend this pre-processing routine. Taking the experiment above as an example, three images from Landsat 8 covering Beijing are processed within two hours. In contrast, unclassified CGI can be easily extracted based on their textual information. For instance, processing POIs according to their categories was completed within 10 min in the study. Such POI pre-processing cannot be more complex due to the standard categories of POIs.
In terms of data classification, conventional methods require training data for each class. To complement this process, image interpretation is required by selecting several regions for each class from remotely sensed images. In this study, a total number of sixty-five training data were randomly selected in the area of Beijing, and it took approximately two hours for one volunteer to confirm the actual land cover classes of each training data. On the other hand, we group POIs into different classes according to their categories. This process takes about less than half an hour, since ambiguous POI categories have been removed in the pre-processing stage. Furthermore, the POI classification process would not be extended when detecting LCC in much wider regions, while image classification indeed requires considerable time to select more training data.
Land cover regions generation/classification using remotely sensed images and CGI are both utilised by automatic methods, with the formal using Maximum likelihood classifier, Decision tree classifier, etc. and the latter using kernel density and overlapping rules. In this study, we classified Landsat 8 data using Maximum likelihood classifier, and it took about fifteen minutes to complete the process. Although it is much more effective than data pre-processing and classification, the generation of land cover regions with POIs only takes a few seconds to automatically complete the entire area.
In the last stage, changes are extracted by comparing up-to-date land cover regions with the baseline map. Since land cover regions have been generated by both remotely sensed images and CGI, the efficiency of this stage is quite similar, with approximately fifteen minutes required for either process.


