Article

Facilitating Regional Energy Transition Strategies: Toward a Typology of Regions

1
Institute for Ethics and Transdisciplinary Sustainability Research, Faculty of Sustainability, Leuphana University Lueneburg, 21335 Lueneburg, Germany
2
Center for Global Sustainability and Cultural Transformation—CGSC, 21335 Lueneburg, Germany
3
Institute of Ecology, Faculty of Sustainability, Leuphana University Lueneburg, 21335 Lueneburg, Germany
*
Author to whom correspondence should be addressed.
Sustainability 2017, 9(9), 1560; https://doi.org/10.3390/su9091560
Submission received: 7 July 2017 / Revised: 10 August 2017 / Accepted: 11 August 2017 / Published: 1 September 2017
(This article belongs to the Section Energy Sustainability)

Abstract

:
The regional level is essential for the use of renewable energies since on this level national political goals are harmonized with implementation activities. Hence, regional strategies can, we argue, be useful. Yet, these strategies must be tailored to meet a variety of contextual conditions. Within this study, we identified natural and socio-economic conditions that need to be considered when developing regional strategies for Energiewende. Focusing on these conditions, we conducted a multivariate statistical analysis of all 412 German districts (Landkreise). We identified nine energy context types characterized by different renewable energy potentials and socio-economic conditions. We propose to develop one generic regional energy transition strategy for each of the energy context types. These can serve as a governance tool that operationalizes and allocates national Energiewende goals according to regional contextual conditions. Moreover, the energy context types may support regional decision makers by allowing them to prioritize steps in the transition process, to establish networks with, and to learn from, similar regions.

1. Introduction

The growing use of renewable energy (RE) is an innovative practice that arose from the need to radically change the energy system in order to minimize GHG emissions. It aims to meet the social need to supply society with energy in a sustainable way, now and in the future [1,2,3,4]. In Germany, the incumbent energy companies have generally reacted to this trend rather late [5]. Instead, the growing use of RE has often been facilitated and diffused by organizations whose main purpose is social, not profit-oriented: governance bodies, social movements, community energy initiatives, etc. [5,6,7]. Regions are one relevant level for RE implementation and use in Germany, as the political system is strongly based on federalism. Historically, the energy system developed in decentralized nodes and is still often structured locally and regionally [8,9].
The implementation of RE in regional or local settings has been examined in empirical studies, especially case studies, and in more theoretical papers focusing on energy or sustainability transitions. A survey of the empirical literature indicates that there is considerable heterogeneity concerning the contextual conditions for using RE. For example, a comparative analysis of all the municipalities of one Swiss canton (state) showed that there is no single ideal energy strategy for municipalities, but, due to the different conditions in each of the municipalities, a broad range of possible options needs to be considered [10]. The authors concluded that these differences need to be considered when developing energy strategies. It is safe to assume that this is also true not only at the municipal, but also at the regional level: regional innovation studies also argue to consider contextual differences in innovation policies [11]. The significance of context for the use of RE is also emphasized in a spatially explicit analysis of conflicts between traditional landscape services and the use of the energy resources of wind, photovoltaics (PV), and forest biomass for Switzerland [12]. This insight has important implications for those tasked with developing strategies for implementing RE at the regional level, as these strategies will have to integrate context-specific conditions into a broader framework. This is a very complex and challenging task, and the literature has so far only focused on some of the conditions that would need to be considered.
Several case studies of single regions in different European countries such as Austria [13,14,15,16], Switzerland [17,18], Germany [19], and Slovenia [20] mainly focused on rural municipalities or regions that largely rely on bioenergy. This emphasis on the distinct conditions for implementing bioenergy can also be observed in the literature on bioenergy villages in Germany. An interdisciplinary study on, for example, the village Juehnde integrated the perspectives of agriculture, soil science, economics, sociology, and psychology [21]. Other studies have considered socio-economic conditions for implementing RE. These are, for example, community-ownership of renewable energy utilities (e.g., [22,23]) or citizen cooperatives financing RE (e.g., [24,25]). The acceptance of wind power installations and the NIMBY-effect (not in my backyard) have also been studied (e.g., [26,27]).
The empirical literature on implementation of RE in regional or local settings is complemented by research that opens up a boundary between sustainability transitions and geography, the geography of sustainability transitions [28], and energy geography [29]. In geography, regions are discussed as key drivers for innovations [30,31]. The space and place of transitions in general and energy transitions in particular has received considerable attention [32,33,34]. Most publications in this emerging field exist on urban and regional visions and policies, while only few articles deal with the significance of local resources for the use of RE [28]. Späth and Rohracher argue that regions provide social contexts and apply socio-technical innovations that differ from the dominant regime. They thereby test and demonstrate whether and how technical alternatives are feasible [35]. Transitions research stresses that conditions underlying larger dynamics determine the outcome of transition processes. In the literature, these conditions are also often referred to as contextual, landscape, or environmental conditions (Berkhout et al., 2004; Geels and Schot, 2007; Jacobsson and Lauber, 2006; Smith et al., 2005). The analysis of landscape service conflicts named above is not framed within this research field; nonetheless, it can offer fruitful inspiration for spatially explicit empirical energy transition research. For example, it combines different energy potentials with a set of social and environmental factors relevant for the acceptance of RE use [12].
As this cursory survey of the empirical literature shows, many specific conditions have been identified in distinct national, regional, or municipal contexts, but the insights of these studies have yet to be fully synthesized into a general framework or typology that could be used to develop regional strategies for implementing RE.
German energy transition policies, summarized under the term Energiewende, have been developed and decided on the national level [5,36,37]. Even though there has been no concerted effort to achieve the policy aims at the regional and local level, the German Association of Towns and Municipalities called for a coordinated approach [38]. Regions can share the responsibility to contribute to national Energiewende goals, as suggested in the region’s network scenario by the Federal Environmental Agency, according to their potentials and challenges [39]. This is supported by the finding that regions are the governance scale where national policies are actually realized and implemented [40]. Regions differ, for example in their RE supply potentials and demand for energy services [39]. Still, we expect that there are similarities between regions that can be used to allocate shares of Energiewende goals. In the light of limited temporal and financial resources to realize RE use, we suggest developing generic strategies for regions. These would supply a basic structure and basic contents that would fit to all regions with comparable contextual conditions for RE use (see [41] for a generic modeling approach of energy demand of buildings). For concrete RE realization, the generic strategies would need to be tailored specifically for each region, but each region would not have to start from zero.
With this paper, we aim at contributing to the need for spatially explicit, empirical analyses on regional energy transition contexts. We analyze (a) how regions differ in their contextual conditions and (b) whether and how regions can be grouped for generic regional RE implementation strategies.
In Section 2 we clarify our understanding of contextual conditions of regional RE use and present the contextual factors used for analysis. Section 3 presents details on spatial scale, data, and analysis. We employ principal component analysis to identify correlations between all contextual conditions and cluster analysis to identify groups of regions. After presenting the results in Section 4, Section 5 discusses the results in the light of generic regional energy transition strategies. Section 6 concludes and binds the findings back to the challenges of realizing energy transition.

2. Contextual Factors of Regional RE Use

We understand regional energy systems as complex systems that are composed of natural, technological, and societal units. According to Scholz and Tietje, complex systems can be described by three dimensions: function, structure, and context. These three dimensions can be defined as follows [42]:
  • Functions are the goals and demands that are imposed on a system. In the case considered here, the most important function of a regional energy system is to provide energy services—heat, electricity, and mobility—using renewable energy sources.
  • Structures are defined as the relevant “spatial and temporal relationship, connectedness, partitioning and modularization of the system units” ([42] p. 309) that serve to fulfill the functions of a system. Structures are regularly altered and shaped from within and from outside the system. The structures of regional energy systems are, among others, energy infrastructure such as solar panels or electricity grids or relationships between public energy services and their customers.
  • Context “includes all environmental constraints that are permanently relevant system or impact factors” ([42] p. 309) that influence the processes in the system and cannot be easily influenced from within the system. The context of a regional energy system includes natural and socio-economic conditions, which both underlie larger dynamics and cannot or can only partly be influenced by actors at the regional level, e.g., wind speed for wind power.
In this study, we focus on the context of regional energy systems. As discussed above, recent developments concerning the use of RE primarily take place at the local and regional levels and within the confines of a given region (Landkreis). For this reason, we assume that these regions meaningfully bound RE systems for fostering sustainability transformations. It is important to note here that there are a few exceptions, for example Aller-Leine-area, a cooperation of municipalities from three adjacent regions [43], but for the most part, this approach allows us to examine the wide range of spatial patterning concerning RE systems in Germany with regards to transition strategies.
In order to propose a corresponding typology of regions, it is necessary to identify, first, contextual factors for the regional use of RE and, second, groups of regions which encompass similar regions with regards to these factors, which show strong differences compared to regions in other groups. Therefore, we do not include contextual factors that affect regions in an equal manner, but only those that can be used to distinguish between regions. For example, national legislation and policy developments are two relevant contextual factors of regional energy systems, but in general, they apply to the entire country and do not differ between regions.
For this study, we identified a range of contextual factors from the transition literature and energy studies, which meet the criteria mentioned in the section above (see Table 1). Compared to the transition literature, energy studies have a more practical perspective, as they depict future energy system options for fostering specific kinds of transitions (e.g., [44]). Having identified contextual factors, we then assigned these factors to two categories: ‘natural context’ and ‘socio-economic context’. The natural context corresponds to the natural environment; factors in this category can be used to assess the potential supply of RE. The socio-economic context corresponds to the social environment and includes factors that can be used to estimate the demand for energy and a set of factors describing select societal characteristics that need to be considered when implementing strategies at the regional level. We do not consider technical aspects because we understand technologies for the use of RE as part of the structure of a system, not its context. The contextual factors are presented in greater detail below, and their operationalization is discussed in Section 3.
Natural context: In this study, we include the three renewable energy sources with the current largest shares in electricity and heating in Germany. These are sun, biomass, and onshore wind [45]. Moreover, these sources are being mainly used in decentralized installations, and can therefore be part of regional energy transition strategies. We only consider the use of waste biomass in this study. According to the German Advisory Council on the environment, energy crops include several sustainability challenges in agriculture and forestry apart from the discussions on ‘food or fuel’ [46]. For example, (German) forests serve as a sink for CO2. Intensified harvesting for energy purposes changes forest structures and lowers the potential to bind CO2, which conflicts with the aim of Energiewende to reduce GHG emissions [47]. Energy from biomass can, in the form of biogas, be used to flexibly even out the fluctuations from wind and sun and is therefore important for stabilizing RE electricity generation [48]. We do not consider offshore wind in this study, because its share in electricity from RE was less than 5% in 2016 [49]. Additionally, offshore wind farms are a field in which regions or regional energy providers can invest, but there are no regional differences to be considered. We also do not consider the potentials of water and geothermal energy here, although they can provide the essential base-load power [50]. The use of water power has a long tradition [51], and the installed capacity of water power in Germany has not increased significantly in the last 15 years [45]. Shallow geothermal energy can be used anywhere, so there are no regional differences to consider. The use of deep geothermal energy does not (yet) play a role in German electricity and heating. According to the considered renewable energy sources, we defined contextual factors that essentially influence their suitability in certain regions.
Socio-economic context: We use population density to indicate (a) the demand for energy from private households; (b) the possibility to employ small-scale shared facilities like heating networks [56]; and (c) built-up surfaces such as roofs and facades where the use of solar energy receives a feed-in tariff [57]. For developing a realistic future energy system, it is vital to consider the future energy demand pattern from the population; we therefore implement population growth in our analysis. Because more than 40% of solar energy technology is owned by private households [55], we take the property rate into account (here meaning whether the inhabitants live on rent or own the place they live in). The basic structure of the regional economy is included to indicate: (a) the demand for energy from industry and commerce; and (b) the potential to make use of waste biomass from land use (e.g., skilled workers). The economic strength of each region covers the ability to finance infrastructure projects related to the use of RE. Investments by private households represent a considerable share of all the money that is spent on decentralized renewable energy facilities, for instance rooftop solar panels or financial citizen participation in energy cooperatives or comparable models [25,58]. Therefore, unemployment was considered as a second variable related to this context factor.

3. Materials and Methods

Spatial scale: The study covers all German regions. These include 110 city regions (kreisfreie Stadt), which are, essentially, one larger city each, and 302 rural regions (Landkreis), which encompass several smaller cities and rural municipalities. It is important to note here that these are legal designations that may but do not necessarily reflect the actual character of these regions in terms of population density.
Proxies: Measurable proxies for each variable were chosen. We consider theoretical energy potentials regardless of technical options; in this case, the annual average wind speed at a height of 80m, the annual average global radiation, and the amount of energy in the available waste biomass. The theoretical energy potentials were normalized for each region for the area on which the land use allowed the implementation of the different considered energy sources. For this, CORINE (Coordination of Information on the Environment) land cover data was used, a set of satellite data publicly available for all EU member countries that differentiates between land use classes [59]. We consider all fractions of waste biomass that were used in a material flow analysis for a sustainable use of biomass for energy purposes [54], except for industrial wood. This was excluded because we could not find reliable, spatially explicit empirical data. Values refer to the year 2010. Energy potentials of the waste biomass fractions harvest residues, meadow residues, and forest residues were normalized for area. Energy potential of the biomass fraction zoo mass was normalized for livestock units, and the fraction household waste was normalized for the number of inhabitants. For each region, the mean annual wind speed was calculated for areas covered by land use types on which wind turbines are common (arable land, pastures) and on which wind turbines are possible without nature conservation conflicts (coniferous forest) [60,61]; i.e., CORINE land cover classes 211, 231, and 312. For each region, the mean annual global radiation was calculated for surfaces on which solar energy is supported by the feed-in tariff [57]. These are buildings (CORINE land cover classes 111,112, 121) and disturbed surfaces (CORINE land cover classes 122, 132, 131). Population density is included because predominantly rural and predominantly urban regions have shown very different activities concerning the use of RE. We use the total population growth up to the year 2025. To assess economic strength, we use the unemployment rate and the municipal tax income from households because the latter is an indicator of the financial resources available to private households and municipalities. In contrast, GDP is an indirect proxy. The investments by private households represent a considerable share of all the money that is spent on decentralized renewable energy facilities [25,58]. The share of home ownership is included as the variable property, because regional RE strategies would need to address the needs of different stakeholders such as private home owners or public and private housing associations with different incentives and tools. Data on earners per economic sector (agriculture and forestry, industry, services) are used as proxies for the strength of each sector.
Data: Socio-economic data from the Federal Institute for Research on Building, Urban Affairs, and Spatial Development was used for the year 2010 [62]. Data on livestock units from the German statistical database [63] was also used for the year 2010. For the regions Aschaffenburg, Bremen, Bremerhaven, Darmstadt, Offenbach, Schwerin, and Stralsund data on livestock units was only available for 2005, which was subsequently included in the data set. No original data on livestock units was available for the regions Wismar, Schweinfurt, and Neubrandenburg; here we used the mean value of all regions. Data on mean annual global radiation and mean annual wind speed at a height of 80 m are both raster data with a 1 km × 1 km resolution, and come from the German National Meteorological Service. For land use biomass fractions and the normalization of wind and radiation potentials we used CORINE land cover 2006 raster data with 250 m × 250 m resolution. The administrative borders in the conditions of 1 January 2009 are from GeoDatenZentrum [64]. All data is publicly available and mostly open source; we hope that this approach can thus be reproduced in other locations with comparable data.
Analysis and software specifications: Principal components analysis (PCA) in R (R 64 2.15.1 GUI 1.52) was used on standardized data, to analyze the correlation between all contextual factors across the data set and to determine the gradients along which the types of regions change. The analysis was done with standardized data in order to make different variables comparable regardless of the scaling of the data. Cluster analysis was used to identify types of regions with similar contextual characteristics. Clusters in the standardized data were identified and analyzed in R with the cluster package version 1.14.2. We used hierarchical agglomerative clustering (agnes) with Euclidean distances and Ward’s method. Dendrograms were used to determine an appropriate number of clusters. Types and single variables were mapped in ArcGIS (ArcGIS Desktop 10 Education Edition) to visualize and compare spatial patterns.

4. Results

The following section presents the results of the PCA as well as the larger spatial patterns of select contextual conditions for the use of RE in the regions. After that, we describe the characteristics of each energy context type as suggested by subsequent analyses.

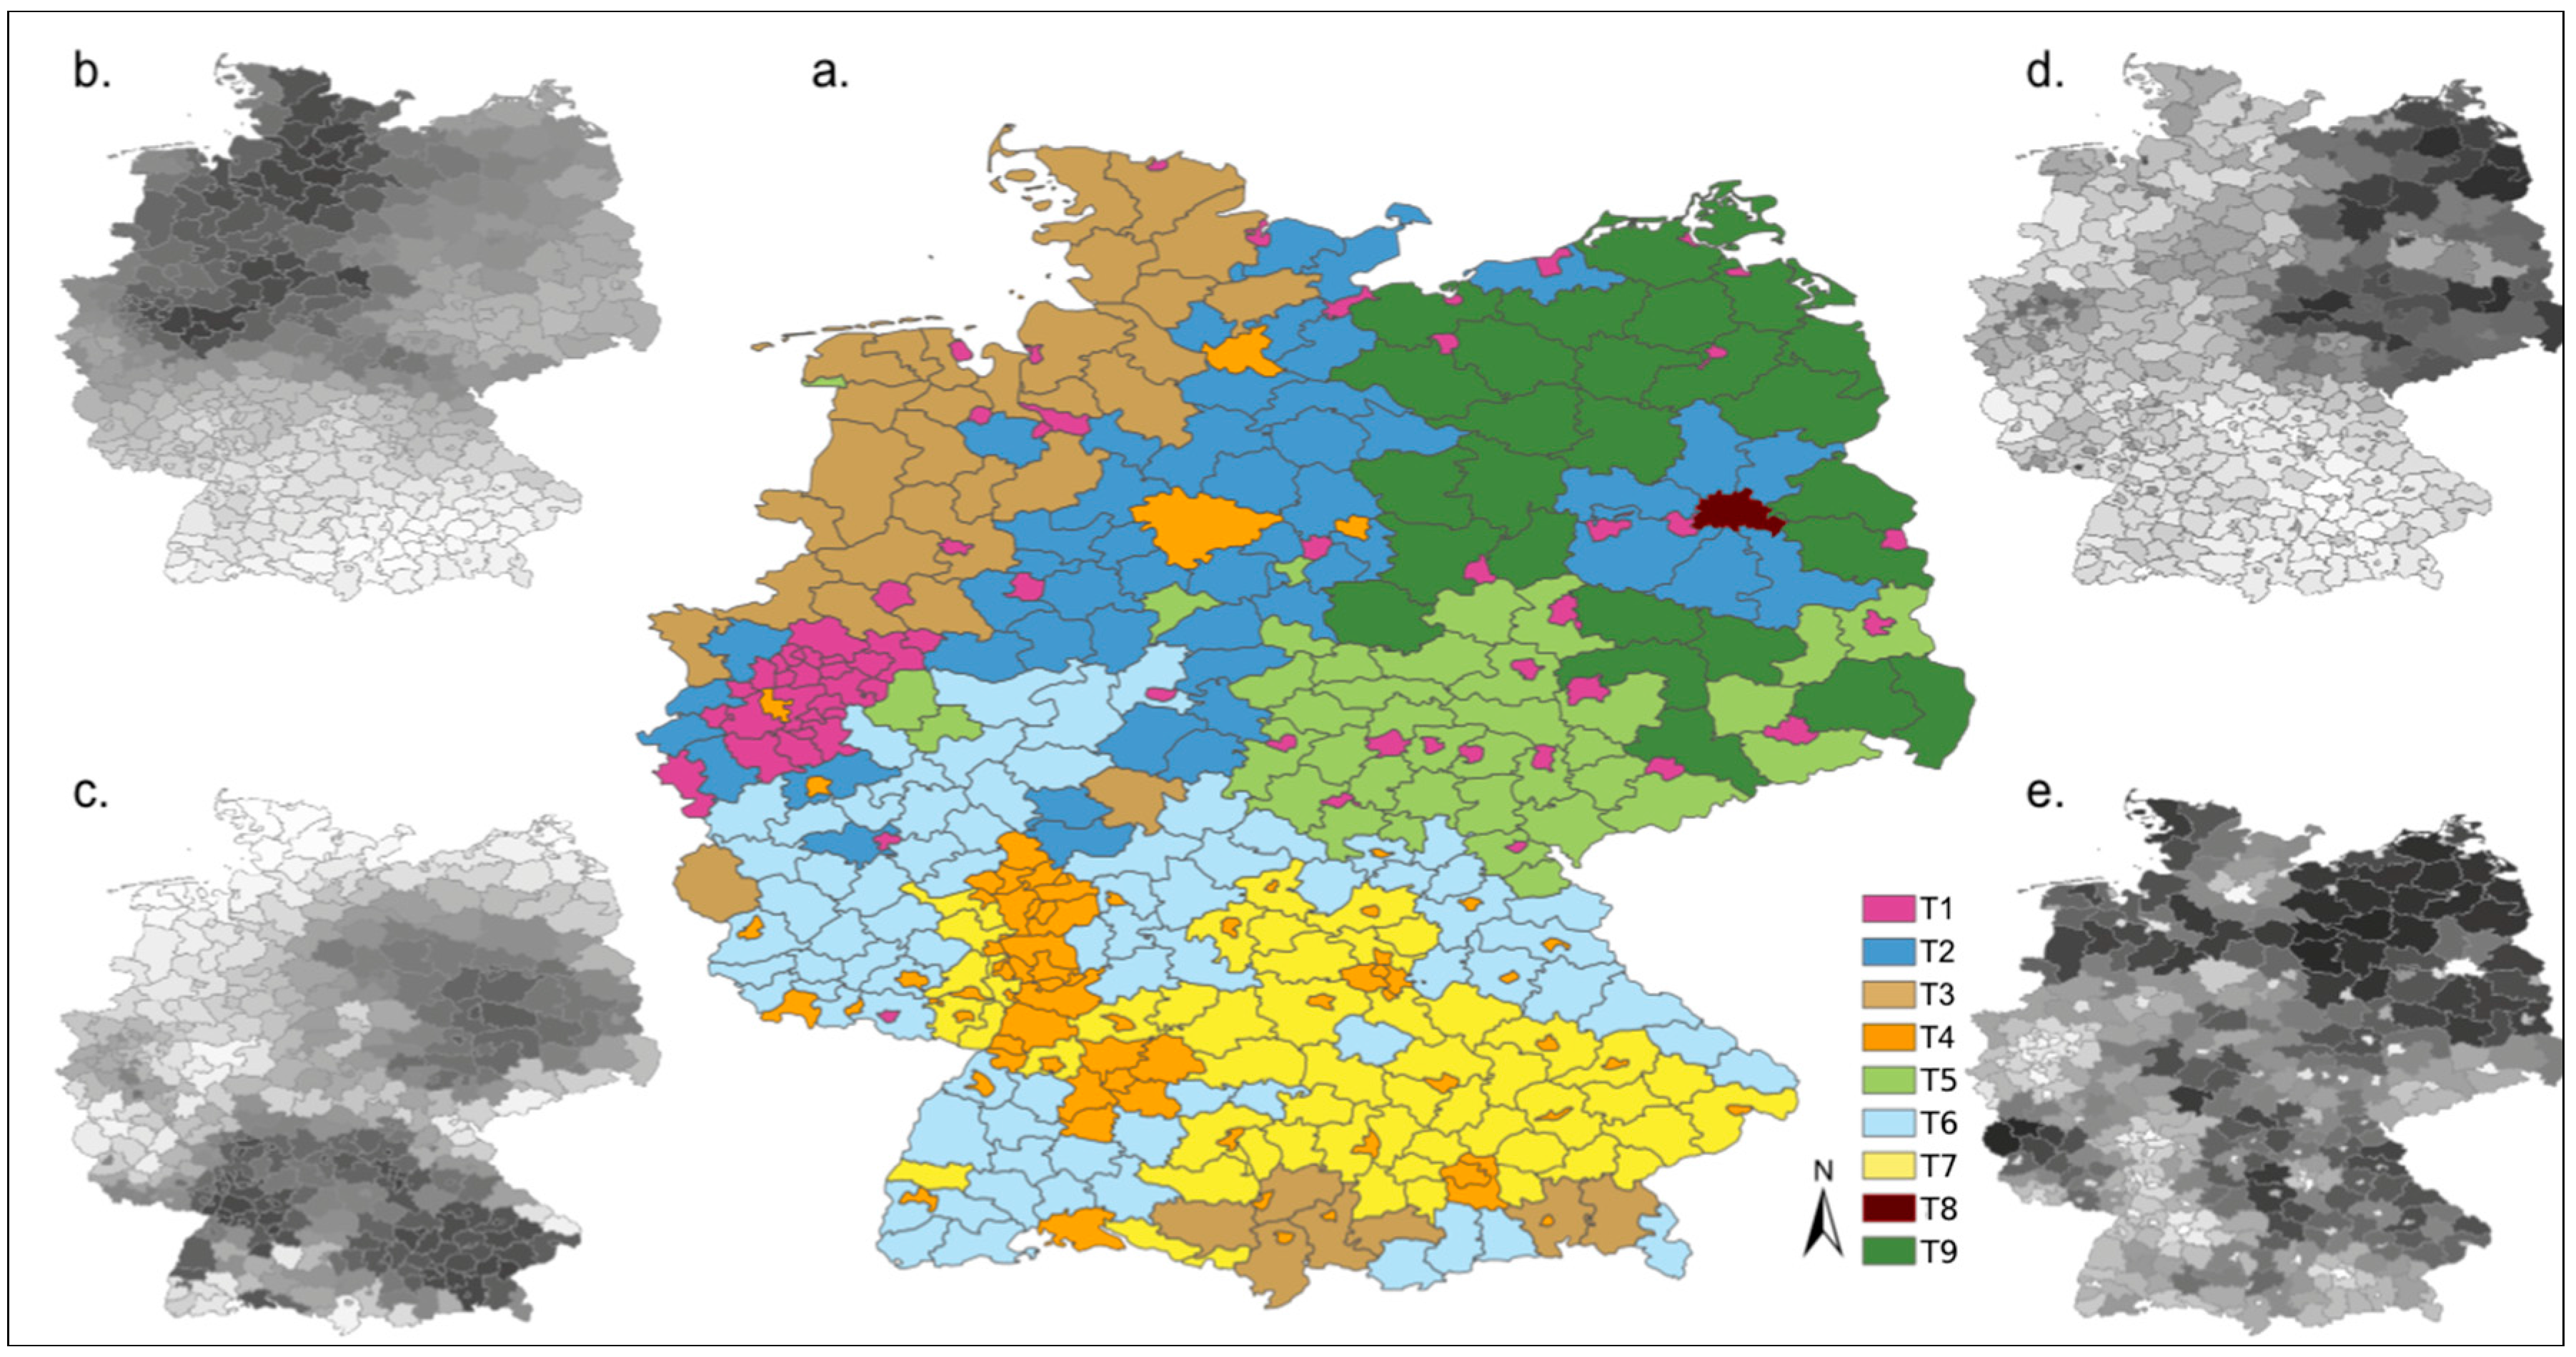
4.1. Spatial Patterns

The PCA showed that the variation in the set of 15 variables across all regions can be explained by different gradients. Principal Component 1 (x axis) corresponded to the variable population density, and explained 32% of the variance. A shown in Figure 1, population density correlated on this axis closely with the variable earners in agriculture and forestry. Based on our dataset, we recognize a gradient from regions with very high population density to regions with very low population density that are characterized by an above-average percentage of earners in forestry and agriculture. Figure 2e shows the differences in population density. Principal Component 2 (y axis) corresponded to variable unemployment, and this axis explained another 22% of the variance in the data set. The tax income is here negatively correlated to the unemployment rate based on the results shown in the principal component analysis. We interpret this in a way that the y axis widely corresponds to the regions’ economic strength. Together with the variable population growth, which is closely correlated on the y axis, it described a socio-economic gradient from regions with a high unemployment rate and strong population decrease to regions with a low unemployment rate and population increase. The gradient of unemployment was oriented east to west (see Figure 2d). The variables global radiation and unemployment are closely correlated, but we do not see a causal relationship here. The variables show similar trends in the data on the regions, because the spatial patterns of unemployment and global radiation show some similarities. This is due to the strong economy in southern Germany, as more jobs are available here than in northern and eastern Germany. This pattern overlaps with the one for global radiation (see Figure 2b), but again, we urge caution as this is only a correlation and no causal relationship. It is possible to discern a spatial pattern of wind speed (see Figure 2c), which suggests a gradient from north to south, displaying high wind speeds on the coasts of the North and Baltic Seas. Further south, the regions with higher elevations are again characterized by higher wind speeds. Gradients for global radiation and wind, are, as indicated by the PCA, diametrically opposed. It is important to note here, however, that there are several notable exceptions, for example regions along the coast or those in higher elevations that show both high wind speeds and strong solar radiation.

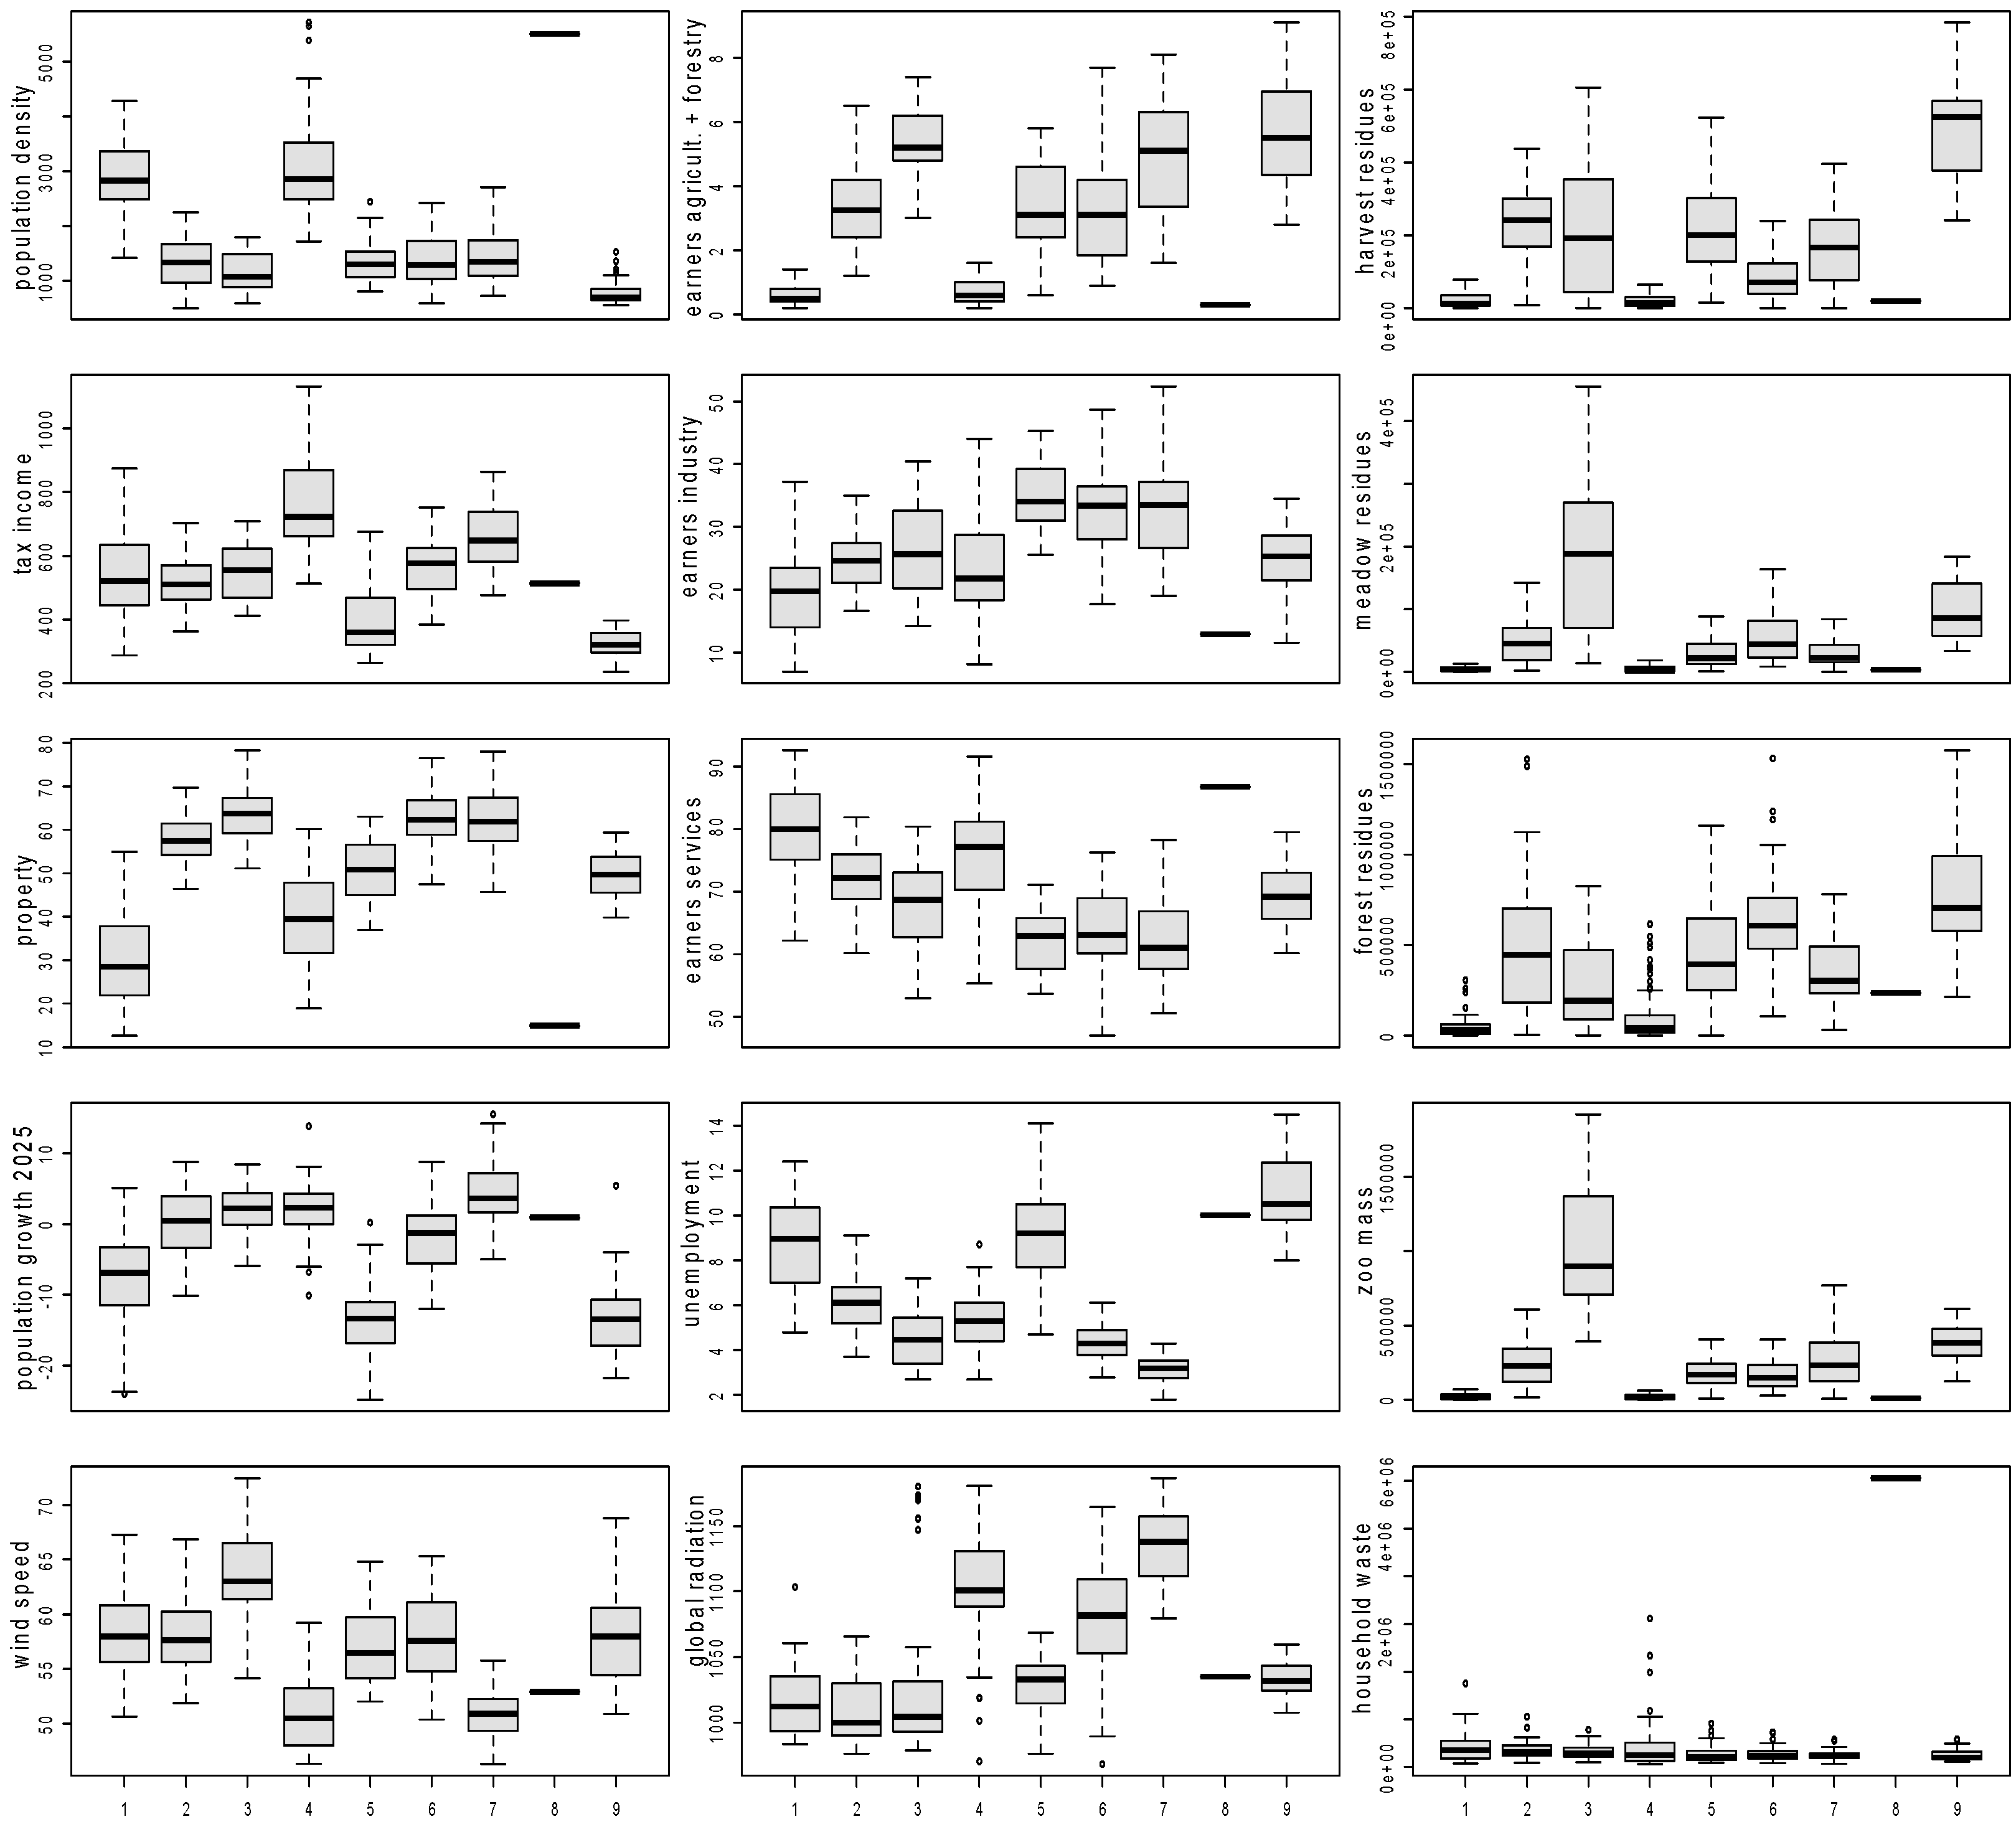
4.2. Energy Context Types

Nine clusters of regions were identified (see Figure 2a), which represent specific energy context types that differ in terms of their socio-economic and natural contextual conditions (see Table 2). The energy context types reflect the spatial patterns identified in Section 4.1. In accordance with PC1, the population density strongly defined how regions were clustered. The three urban types T1, T4, and T8 include all city regions and the rural regions of the densely-populated areas Rhine valley and Ruhr area. The other six types include only rural regions. Regarding the socio-economic conditions, it is possible to observe a gradient from the economically weak and primarily rural Northeast to the economically strong and predominantly urban South. The latter corresponds to a high potential for the use of solar energy, whereas the former is associated with a high potential in wind energy. Detailed information on the variation of parameters evaluated for all energy transition types are given in the boxplot figure in Appendix A.
In the following we have summarized key characteristics of the nine types, including respective “spotlights”, with regard to the potential consequences for transition strategies. A detailed overview of the characteristics of the types can be found in Table 2:
T1, Urban North: the city districts in northern Germany and the rural districts in the Rhine-Ruhr area are characterized by an above-average share of earners in services, a high unemployment rate, and sharply decreasing population. The energy potential from waste and the mean wind speed are quite high. Spotlight: motivation for and ownership of the transition process in the light of tense economic situation and population loss.
T2, Rural North: this type in the middle of Northern Germany shows average socio-economic contextual conditions. The districts are characterized by high wind speeds and biomass potential from land use, especially harvest and forest residues. Global radiation is quite low. Spotlight: supply of adjacent city-districts.
T3, Livestock belt: this type consists of districts in the North-West and in mountainous areas that are traditional areas of livestock farming and have the highest mean wind speed. Spotlight: a concerted use of the diverse strong energy potentials may even out fluctuation, and high potential to supply city districts.
T4, Urban South: the city districts mostly in southern Germany and the rural districts in the Rhine valley have a strong economy with the highest tax income, a growing population and, for urban areas, high residual property. The major energy potential is the strong global radiation. Spotlight: combine the high potential from radiation in the cities with the energy potentials of adjacent rural areas.
T5, Industrial East: the rural districts mainly in eastern middle Germany have the highest share of earners in industry and are characterized by a weak economy and strong population decrease. The wind speed and radiation have average values, and the potentials from forest and harvest residues do as well. Spotlight: financing and ownership of the transition process.
T6, Rural South: this type encompasses rural districts with average socio-economic contextual conditions, a large industrial sector, strong radiation, and high mean wind speeds. The strongest fraction in the mix of biomass potentials is forest residues. Spotlight: a concerted use of wind and solar energy may even out fluctuations and the supply of industry.
T7, Sunny South: the rural districts are characterized by a strong economy with a large industrial sector, and show the lowest unemployment rate and highest population increase; they have very strong radiation and considerable potentials from land use. Spotlight: synergy between the population dynamic and the transition dynamic.
T8, Global City: this type contains only Berlin, Germany’s capital and largest city. It is by far the densest city with a specific socio-economic context, e.g., with very low residual property. The largest potential is waste, radiation is average. Spotlight: challenge through low residual property, focus on financing and the ownership of the transition process.
T9, Rich but Poor: the rural districts in the North-East have the weakest economy and strongest population decrease. They are also characterized by very high energy potentials from land use, high mean wind speed, and average radiation values. Spotlight: make use of energy abundance to create motivation for and ownership of the transition process in the light of the tense economic situation and population loss.
All types have RE potentials for the three sources analyzed in this paper, i.e., biomass, wind, and solar. Even though the actual potentials and challenges for the use of RE are determined by different contextual conditions, our study indicates that it is possible to identify basic patterns and energy context types. In other words, each of the nine types identified here represents a distinct set of potentials and challenges for implementing RE.
The analysis has shown that each type contains regions with wind speeds above 5 m/s (see boxplot diagrams in the supplementary material). Nevertheless, wind speeds are generally higher in northern Germany with 6.3 m/s for T3 and about 5.8 m/s for T1, T2, T5, T6, and T9. Global radiation is generally stronger in southern Germany than in the north. With the mean value being 1053.3 Wh/m2, the energy context types T4, T6, and T7 show above-average values. Regarding the parameters wind speed and global radiation, the urban types do not differ from the rural ones. In contrast, there are major differences when it comes to biomass. The highest total biomass potential can be found in T8, Berlin, which is due to the high energy potential of household waste (see also Appendix A). T3 and T9 also show high biomass potentials; here, the latter result from agriculture and forestry. The other rural energy context types hold considerable biomass potentials as well, whereas the smaller city regions of the urban types T1 and T4 show relatively low potentials from all waste fractions.
Regarding the socio-economic conditions, the strongest differences appear between rural and urban types. This is true for population density, which is, in all three urban types, more than one standard deviation above average. Moreover, the urban types show lower shares of property ownership and earners in agriculture and forestry. The latter is very closely related to the land-use related biomass parameters. Regarding the unemployment rate and population growth, the data shows considerable differences between the rural regions of eastern Germany (T5 and T9) and the urban and rural regions of western Germany. To a lesser extent, this is also true for tax income. T5 and T9 show the highest expected decrease in population until 2025 (>13%), and unemployment rates of 9.3% and 11%, respectively. Berlin, T8, is also characterized by a high unemployment rate of 10%, but it differs from T5 and T9 in many respects. For example, the data suggests that Berlin’s population will grow slightly until 2025. There are differences concerning the municipal tax income between urban and rural regions and between southern Germany and northern and eastern Germany. The tax incomes of T4 are more than one standard deviation higher than the average, while they are more than one standard deviation lower in T9. All other types are distributed along this gradient from the rich urban south to the poor rural northeast.

5. Discussion

In the following, we discuss the relevance and interrelations of our results according to the research questions and present an outlook on possible further research related to this study.

5.1. Discussion of Results

The analysis showed that the socio-economic context changes along an East-West-oriented gradient. This gives evidence for a still-existing imbalance between the two former German states: energy context types T5 and T9 encompass the rural area of the former German Democratic Republic. Major discrepancies between these two types and the remaining seven types become apparent in economic strength, population density, and property rates. The North-South gradient displays the interplay between high mean wind speeds on the coasts of the North and Baltic Seas and strong global radiation in the South. The biomass potential is independent from this gradient; it is rather a function of space and inhabitants, with space increasing the energy potentials from agriculture and forestry and the number of inhabitants increasing the energy potentials from household waste. The total energy potential from waste biomass in this study is 475 PJ, which is 50 PJ lower than in the original data [54]. This difference mainly results from omitting the fraction industrial wood in our analysis, which represents 55 PJ in the data source. The remaining difference of 5 PJ can be explained as a result of not calculating the total amount directly, but from mean values per type.
The data on all analyzed renewable energy sources allows assessing as to which degree these sources should be considered in the generic regional energy strategy of each type. According to the ‘region’s network scenario’ of the German Environmental Agency, Germany can be supplied with 100% renewable electricity by 2050 if all rural and urban regions use their local potentials [39]. Potentials of the analyzed RE sources are high in some energy context types, and lower in others. The study considers theoretical energy potentials. Wind speeds and solar radiation were therefore only assessed for areas on which the use of wind energy or solar energy is possible. Still, the analysis does not consider the total area on which wind turbines or solar panels can be mounted. Other factors in the analysis allow a careful guess of the feasibility to use an energy potential. The values of harvest, meadow, and forest residues (see Table 2 and Appendix A) mirror the total area of these land use forms and thus allow for a rough assessment of the area on which wind farms can be mounted. The potential rooftop area for solar energy use can be cautiously derived from the variable settlement density. A comparison with the region’s network scenario shows a similar spatial pattern of the PV potential [39].
In the region’s network scenario, wind speeds of 5 m/s are regarded as sufficient [39]. This analysis offers a conservative assessment of areas with sufficient wind speeds, because we use 80 m as the reference height for wind speed. Wind turbines are usually higher than 100 m, and wind speeds generally increase with height [65]. With mean annual wind speeds of 5.1 m/s, wind energy use may not be a main strategy element in T4 and T7, for instance. Nevertheless, these regions also host areas with wind speeds considerably higher than 5 m/s (see boxplot diagrams in Appendix A). All other rural energy context types offer, according to our analysis, a high number of locations with adequate wind speed for energy generation. Here, wind power can be a viable RE source, and these types can thus contribute considerably to national RE targets. We conclude that wind energy can be used cost-effectively in every energy context type, and that especially types T2, T3, T5, T6, and T9 host considerable wind potentials. For the use of solar energy and biomass, a comparable pattern is visible. Practical experience shows that solar devices can be used in all parts of Germany regardless of the energy context type. Still, the use of solar energy is more resource-effective for regions with stronger radiation and might thus be favored there. These are found in southern Germany, especially in the energy context types T4, T7, and T6. T4 is an urban energy context type with high population density and relatively high property rates; this allows us to assume that the considerable area for solar power devices exists here. T6 and T7 are both rural types with the highest share of earners in industry, which allows us to assume that industrial infrastructure offers rooftops and so-called disturbed surfaces exist, on which solar devices can be installed on the ground. We thus conclude that solar energy can be used in all parts of Germany, and that especially types T4, T6, and T7 host considerable potentials. For the use of biomass, the potentials from household waste and from land use waste need to be considered separately from one another. The energy potential from household waste is related to the number of inhabitants and is especially high in urban areas. The biomass from land use waste is related to different forms of agriculture and forestry and is, depending on the characteristics of the material, processed in different ways. Urban and rural types, therefore, may need to consider very different technical options. All considered forms of biomass share the characteristic that they can be stored as fuels and further processed to electricity and heat when demand for energy services exists. This is considered important for regulating fluctuations from wind and solar energy [66]. Summing up, all energy sources can be used in all energy context types, but their significance in the generic strategies for each type differs. Also, the technical options to make use of the energy potentials differ.

5.2. Implications for Generic Regional Energy Transition Strategies

The generic strategies should include both the socio-economic and the technological perspectives. For example, generic strategies can offer different options to realize a strategy element such as shared facilities to supply homes with electricity and heat. For this, the strategies should consider different ownership models or organizational models that allow for adaptation to different economic situations of private households and different property rates. In urban areas where most people live on rent and thus invest less in their homes, shared facilities can, for example, be owned and managed by housing companies or communities [67]. Cooperatives may be an option for both urban and rural types, while privately owned, shared facilities in neighborhoods can be an option for rural areas with high property rates. Shared facilities can consist of different technological options. For example, combined heat and power plants are a cost-effective and resource-efficient system for small-scale applications [68] that can be fueled by biogas from land use or landfills, or by wood chips [18]. District heating systems can also be fueled by these sources.
For example, the generic strategy of type 9 would build on the high potentials for RE use and recognize the challenge of high unemployment and population loss. In this situation, it may be wise to focus first on those steps of RE implementation that can bring a positive effect to the people in these regions. A more intense use of RE will probably not automatically lead to the creation of jobs or to local revenues [69,70]. Still, a combination of different funding sources for regional RE projects and a close collaboration with formal networks seems to contribute to successful RE implementation and a general positive influence on the regional economy [71]. Breaking this down to the generic strategy for type 9, it may be interesting to use waste biomass from forestry and agriculture in decentral combined heat and power plants. While the generated electricity can be sold and can contribute to supplying other regions, the heat can be used locally in district heating systems. It can be expected that many homes in type 9 need to modernize their heating soon, because a great number of homes invested in new heating after the reunification of Germany. The generic strategy could thus set incentives and offer an option to guide investments that are anyway necessary to solutions based on RE, which might additionally contribute to realizing the necessary improvements of the older building stock [72].
The typology may set the basis to operationalize national energy transition policies, especially concerning the use of RE, for the regional level. It offers a structured picture of regional socio-economic and natural conditions for the use of RE, which may allow for the allocation shares of national RE goals to energy context types. For example, the aim to install a capacity of 2800 MW of onshore wind energy per year [73] can be distributed between and allocated to energy context types according to wind speeds and space: urban types can, for example, use small wind turbines as a resource-efficient option to generate electricity [74]. However, effects and challenges of small-scale and micro wind turbines in urban areas are not sufficiently understood yet [75,76]. Many German regions are already experienced with the use of RE, but they may have used different planning procedures, ownership models, or technologies. The typology may enlarge the potential of interregional learning, because, by having comparable contexts, successful projects can be reproduced in other regions of the respective energy context type.
The envisioned generic regional energy transition strategies can be adapted to the major differences between the German regions. Still, each region will have to adapt the generic strategy of their type to the specific regional conditions and current situation. Although belonging to the same context type, regions may differ substantially in their experience and maturity concerning RE use. To fully develop these generic strategies, further research on fostering structural change is necessary, e.g., on actors, institutions, and regulations. The generic strategies need to be flexible to differences in the maturity of regions with regards to the implementation of RE. While one region might just be starting to use renewables, others of the same type might have a long tradition or show a dynamic development in using renewable energy sources recently. Furthermore, it would be interesting to test this approach on different scales (municipality, state) or in other countries. We believe that large parts of the conceptual framework concerning the natural and socio-economic context are also valid for other energy systems; however, considerable differences should be expected in the implementation process between countries due to different legislation, institutions, and traditions.

6. Conclusions

This paper presented an approach to inform the development of generic regional transition strategies for the use of RE, which is based on multivariate analysis. Building on the contextual conditions for the use of RE in all 412 German regions, we identified nine energy context types. These energy context types differ in their natural and socio-economic contexts. Therefore, the approach fulfills its purpose with regard to the goal of informing the development of generic regional energy transition strategies.
The structured picture of regional characteristics can support the operationalization of national and international energy transition goals by adapting regional energy transition strategies to the respective natural and socio-economic contexts. Generic regional energy transition strategies can guide regional decision makers to prioritize action options in the complex field of energy transition. Moreover, the energy context types enable networking with and learning from other regions with comparable natural and socio-economic conditions. In the light of the above discussion, we are confident that generic regional energy transition strategies based on the natural and socio-economic context can serve as innovative tools to inform governance and operationalize national and international goals on the regional level. This may then contribute to realizing energy transition policies and GHG reductions.

Acknowledgments

This research was made possible with financial support from the Innovation-Incubator at Leuphana University, TM 1.4 Graduate School. We thank Lisa-Britt Fischer and an anonymous reviewer for their constructive feedback on earlier drafts, Micha G. P. Edlich for engaged discussions on the last draft, and Alisa Weber and Heather Murray for copy-editing an earlier version of this manuscript.

Author Contributions

Lotte M. Lutz and Daniel J. Lang developed the research idea; Lotte M. Lutz and Henrik von Wehrden analyzed the data; Lotte M. Lutz wrote the paper in collaboration with Daniel J. Lang and Henrik von Wehrden.

Conflicts of Interest

The authors declare no conflict of interest.

Appendix A

Figure A1. Variation of parameters evaluated for all energy transition types. Boxes display the information of one parameter, each encompassing one boxplot per energy transition type as indicated on the x-axis. Outliers are only shown for the variables settlement density, forest residues, population growth, unemployment rate, radiation, and waste.
Sustainability 09 01560 g003

References

  1. Scheer, H. The Energy Imperative: 100 Per Cent Renewable Now; EarthScan: New York, NY, USA, 2011. [Google Scholar]
  2. Sathaye, J.; Lucon, O.; Rahman, A.; Christensen, J.; Denton, F.; Fujino, J.; Heath, G.; Mirza, M.; Rudnick, H.; Schlaepfer, A.; et al. Renewable Energy in the Context of Sustainable Development. In IPCC Special Report on Renewable Energy Sources and Climate Change Mitigation; Edenhofer, O., Pichs-Madruga, R., Sokona, Y., Seyboth, K., Matschoss, P., Kadner, S., Zwickel, T., Eickemeier, P., Hansen, G., Schlömer, S., et al., Eds.; Cambridge University Press: Cambridge, UK, 2011; pp. 707–790. [Google Scholar]
  3. Wissenschaftlicher Beirat der Bundesregierung Globale Umweltveränderungen (WBGU). Sondergutachten: Klimaschutz als Weltbürgerbewegung; Sondergutachten (WBGU): Berlin, Germany, 2014. [Google Scholar]
  4. IPCC. IPCC Special Report on Renewable Energy Sources and Climate Change Mitigation; Prepared by Working Group III of the Intergovernmental Panel on Climate Change; Edenhofer, O., Pichs-Madruga, R., Sokona, Y., Seyboth, K., Matschoss, P., Kadner, S., Zwickel, T., Eickemeier, P., Hansen, G., Schlömer, S., et al., Eds.; Cambridge University Press: Cambridge, UK, 2011. [Google Scholar]
  5. Schmid, E.; Knopf, B.; Pechan, A. Putting an energy system transformation into practice: The case of the German Energiewende. Energy Res. Soc. Sci. 2016, 11, 263–275. [Google Scholar] [CrossRef]
  6. Bundesregierung des Deutschen Bundestags. Energiekonzept für eine Umweltschonende, Zuverlässige und Bezahlbare Energieversorgung; Bundesministerium für Wirtschaft und Energie: Berlin, Germany, 2010. [Google Scholar]
  7. Agora Energiewende. Energiewende und Dezentralität. Zu den Grundlagen einer Politisierten Debatte; Agora Energiewende: Berlin, Germany, 2017. [Google Scholar]
  8. Tietz, H.-P. Systeme der Ver- und Entsorgung; Teubner Verlag: Wiesbaden, Germany, 2007. [Google Scholar]
  9. Hall, S.; Foxon, T.J.; Bolton, R. Financing the civic energy sector: How financial institutions affect ownership models in Germany and the United Kingdom. Energy Res. Soc. Sci. 2016, 12, 5–15. [Google Scholar] [CrossRef]
  10. Trutnevyte, E.; Stauffacher, M.; Schlegel, M.; Scholz, R.W. Context-Specific Energy Strategies: Coupling Energy System Visions with Feasible Implementation Scenarios. Environ. Sci. Technol. 2012, 46, 9240–9248. [Google Scholar] [CrossRef] [PubMed]
  11. Tödtling, F.; Trippl, M. One size fits all? Towards a differentiated regional innovation policy approach. Res. Policy 2005, 34, 1203–1219. [Google Scholar]
  12. Kienast, F.; Huber, N.; Hergert, R.; Bolliger, J.; Moran, L.S.; Hersperger, A.M. Conflicts between decentralized renewable electricity production and landscape services—A spatially-explicit quantitative assessment for Switzerland. Renew. Sustain. Energy Rev. 2017, 67, 397–407. [Google Scholar] [CrossRef]
  13. Späth, P.; Rohracher, H. “Energy regions”: The transformative power of regional discourses on socio-technical futures. Res. Policy 2010, 39, 449–458. [Google Scholar] [CrossRef]
  14. Späth, P. Understanding the Social Dynamics of Energy Regions—The Importance of Discourse Analysis. Sustainability 2012, 4, 1256–1273. [Google Scholar] [CrossRef]
  15. Binder, C.R.; Knoeri, C.; Hecher, M. Modeling transition paths towards decentralized regional energy autonom—The role of legislation, technology adoption, and resource availability. Raumforsch. Raumordn. 2016, 74, 273–284. [Google Scholar] [CrossRef]
  16. Hecher, M.; Vilsmaier, U.; Akhavan, R.; Binder, C.R. An integrative analysis of energy transitions in energy regions: A case study of ökoEnergieland in Austria. Ecol. Econ. 2016, 121, 40–53. [Google Scholar] [CrossRef]
  17. Trutnevyte, E.; Stauffacher, M.; Scholz, R.W. Supporting energy initiatives in small communities by linking visions with energy scenarios and multi-criteria assessment. Energy Policy 2011, 39, 7884–7895. [Google Scholar] [CrossRef]
  18. Trutnevyte, E.; Stauffacher, M.; Scholz, R.W. Linking stakeholder visions with resource allocation scenarios and multi-criteria assessment. Eur. J. Oper. Res. 2012, 219, 762–772. [Google Scholar] [CrossRef]
  19. Hauber, J.; Ruppert-Winkel, C. Moving towards Energy Self-Sufficiency Based on Renewables: Comparative Case Studies on the Emergence of Regional Processes of Socio-Technical Change in Germany. Sustainability 2012, 4, 491–530. [Google Scholar] [CrossRef]
  20. Kostevsek, A.; Cizelj, L.; Petek, J.; Pivec, A. A novel concept for a renewable network within municipal energy systems. Renew. Energy 2013, 60, 79–87. [Google Scholar] [CrossRef]
  21. Ruppert, H.; Schmuck, P.; Eigner-Thiel, S.; Girschner, W.; Karpenstein-Machan, M.; Ruwisch, V.; Sauer, B.; Roland, F. Das Bioenergiedorf; Fachagentur für nachwachsende Rohstoffe: Gülzow, Germany, 2008. [Google Scholar]
  22. Walker, G. What are the barriers and incentives for community-owned means of energy production and use? Energy Policy 2008, 36, 4401–4405. [Google Scholar] [CrossRef]
  23. Walker, G.; Cass, N. Carbon reduction, “the public” and renewable energy: Engaging with socio-technical configurations. Area 2007, 39, 458–469. [Google Scholar] [CrossRef]
  24. Yildiz, Ö. Financing renewable energy infrastructures via financial citizen participation—The case of Germany. Renew. Energy 2014, 68, 677–685. [Google Scholar] [CrossRef]
  25. Yildiz, Ö.; Rommel, J.; Debor, S.; Holstenkamp, L.; Mey, F.; Müller, J.R.; Radtke, J.; Rognli, J. Renewable energy cooperatives as gatekeepers or facilitators? Recent developments in Germany and a multidisciplinary research agenda. Energy Res. Soc. Sci. 2015, 6, 59–73. [Google Scholar] [CrossRef]
  26. Hitzeroth, M.; Megerle, A. Renewable Energy Projects: Acceptance Risks and Their Management. Renew. Sustain. Energy Rev. 2013, 27, 576–584. [Google Scholar] [CrossRef]
  27. Musall, F.D.; Kuik, O. Local acceptance of renewable energy—A case study from southeast Germany. Energy Policy 2011, 39, 3252–3260. [Google Scholar] [CrossRef]
  28. Hansen, T.; Coenen, L. The geography of sustainability transitions: Review, synthesis and reflections on an emergent research field. Environ. Innov. Soc. Transit. 2014, 17, 1–18. [Google Scholar] [CrossRef]
  29. Calvert, K. From “energy geography” to “energy geographies”. Prog. Hum. Geogr. 2016, 40, 105–125. [Google Scholar] [CrossRef]
  30. Asheim, B.T.; Boschma, R.; Cooke, P. Constructing Regional Advantage: Platform Policies Based on Related Variety and Differentiated Knowledge Bases. Reg. Stud. 2011, 45, 893–904. [Google Scholar] [CrossRef]
  31. Markard, J.; Truffer, B. Technological innovation systems and the multi-level perspective: Towards an integrated framework. Res. Policy 2008, 37, 596–615. [Google Scholar] [CrossRef]
  32. Dewald, U.; Truffer, B. The Local Sources of Market Formation: Explaining Regional Growth Differentials in German Photovoltaic Markets. Eur. Plan. Stud. 2012, 20, 37–41. [Google Scholar] [CrossRef]
  33. Coenen, L.; Benneworth, P.; Truffer, B. Toward a spatial perspective on sustainability transitions. Res. Policy 2012, 41, 968–979. [Google Scholar] [CrossRef]
  34. Bridge, G.; Bouzarovski, S.; Bradshaw, M.; Eyre, N. Geographies of energy transition: Space, place and the low-carbon economy. Energy Policy 2013, 53, 331–340. [Google Scholar] [CrossRef] [Green Version]
  35. Späth, P.; Rohracher, H. Local demonstrations for global transitions—Dynamics across governance levels fostering socio-technical regime change towards sustainability. Eur. Plan. Stud. 2012, 20, 461–479. [Google Scholar] [CrossRef]
  36. Bundesregierung des Deutschen Bundestags Energiewende—Maßnahmen im Überblick. Available online: http://www.bundesregierung.de/Content/DE/StatischeSeiten/Breg/Energiekonzept/0-Buehne/ma%C3%9Fnahmen-im-ueberblick.html.s3t1 (accessed on 16 October 2015).
  37. Deutscher Bundestag. Gesetz für den Vorrang Erneuerbarer Energien. Available online: https://www.bgbl.de/xaver/bgbl/start.xav?start=%2F%2F*%5B%40attr_id%3D%27bgbl100s0305.pdf%27%5D#__bgbl__%2F%2F*%5B%40attr_id%3D%27bgbl100s0305.pdf%27%5D__1503311809295 (accessed on 23 October 2017).
  38. Deutscher Städte-und Gemeindebund. Positionspapier Energiewende nur mit Kommunen; Deutscher Städte-und Gemeindebund: Berlin, Germany, 2013. [Google Scholar]
  39. Umweltbundesamt. Energieziel 2050: 100% Strom aus Erneuerbaren Quellen; Umweltbundesamt: Dessau-Roßlau, Germany, 2010. [Google Scholar]
  40. Morgan, K. Sustainable Regions: Governance, Innovation and Scale. Eur. Plan. Stud. 2004, 12, 871–889. [Google Scholar] [CrossRef]
  41. Knoeri, C.; Goetz, A.; Binder, C.R. Generic bottom-up building-energy models for developing regional energy transition scenarios. In Advances in Computational Social Science and Social Simulation; Quesada, M., Amblard, F., Barceló, J.A., Madella, M., Eds.; Autònoma University of Barcelona: Barcelona, Spain, 2014. [Google Scholar]
  42. Scholz, R.W.; Tietje, O. Embedded Case Study Methods: Integrating Quantitative and Qualitative Knowledge; Sage Publications: Thousand Oaks, CA, USA, 2002. [Google Scholar]
  43. KoRiS-Kommunikative Stadt-und Regionalentwicklung. Regionales Entwicklungskonzept Kooperationsraum Aller-Leine-Tal zur Teilnahme am Niedersächsischen Auswahlverfahren für die LEADER- und ILE-Regionen für den Förderzeitraum 2014–2020; Europäischer Landwirtschaftsfonds für die Entwicklung des ländlichen Raums: Schwarmstedt, Germany, 2015. [Google Scholar]
  44. Öko-Institut: Prognos AG. Modell Deutschland—Klimaschutz bis 2050 Vom Ziel her denken. Endbericht; World Wildlife Fund: Basel, Switzerland, 2009. [Google Scholar]
  45. BMWi—Bundesministerium für Wirtschaft und Energie. Erneuerbare Energien in Deutschland. Daten zur Entwicklung im Jahr 2015; Bundesministerium für Wirtschaft und Energie: Berlin, Germany, 2016. [Google Scholar]
  46. Thompson, P.B. The Agricultural Ethics of Biofuels: The Food vs. Fuel Debate. Agriculture 2012, 2, 339–358. [Google Scholar] [CrossRef]
  47. SRU Sachverständigenrat für Umweltfragen. Klimaschutz durch Biomasse—Sondergutachten; Erich Schmidt Verlag: Berlin, Germany, 2007. [Google Scholar]
  48. Hahn, H.; Krautkremer, B.; Hartmann, K.; Wachendorf, M. Review of concepts for a demand-driven biogas supply for flexible power generation. Renew. Sustain. Energy Rev. 2014, 29, 383–393. [Google Scholar] [CrossRef]
  49. Agora Energiewende. Die Energiewende im Stromsektor: Stand der Dinge 2016. Rückblick auf die wesentlichen Entwicklungen sowie Ausblick auf 2017. Available online: https://www.agora-energiewende.de/fileadmin/Projekte/2017/Jahresauswertung_2016/Agora_Jahresauswertung-2016_WEB.pdf (accessed on 23 August 2017).
  50. Grünwald, R.; Ragwitz, M.; Sensfuß, F.; Winkler, J. Regenerative Energieträger zur Sicherung der Grundlast in der Stromversorgung. Available online: http://www.tab-beim-bundestag.de/de/pdf/publikationen/zusammenfassungen/TAB-Arbeitsbericht-ab147_Z.pdf (accessed on 23 August 2017).
  51. Reynolds, T.S. Stronger Than a Hundred Men: A History of the Vertical Water Wheel; The Johns Hopkins University Press: Baltimore, MD, USA, 1983. [Google Scholar]
  52. SRU Sachverständigenrat für Umweltfragen. Wege zur 100% Erneuerbaren Stromversorgung: Sondergutachten; Erich Schmidt Verlag: Berlin, Germany, 2011. [Google Scholar]
  53. Verbong, G.; Geels, F.W. The ongoing energy transition: Lessons from a socio-technical, multi-level analysis of the Dutch electricity system (1960–2004). Energy Policy 2007, 35, 1025–1037. [Google Scholar] [CrossRef]
  54. Öko-Institut & Partner. Stoffstromanalyse zur Nachhaltigen Energetischen Nutzung von Biomasse-Endbericht. Available online: https://www.oeko.de/oekodoc/236/2004-025-de.pdf (accessed on 23 August 2017).
  55. Trend:Research. Marktakteure Erneuerbare–Energien-Anlagen in der Stromerzeugung. Available online: http://www.kni.de/media/pdf/Marktakteure_Erneuerbare_Energie_Anlagen_in_der_Stromerzeugung_2011.pdf (accessed on 23 August 2017).
  56. Vallios, I.; Tsoutsos, T.; Papadakis, G. Design of biomass district heating systems. Biomass Bioenergy 2009, 33, 659–678. [Google Scholar] [CrossRef]
  57. Deutscher Bundestag. Gesetz für den Vorrang Erneuerbarer Energien. Bundesgesetzblatt I S. 2074 & S. 2730. Available online: https://www.bundesanzeiger-verlag.de/fileadmin/BIV-Portal/Dokumente/eeg_2012_bf.pdf (accessed on 23 August 2017).
  58. Holstenkamp, L. Definition und Marktanalyse von Bürgerenergie in Deutschland. Available online: http://100-prozent-erneuerbar.de/wp-content/uploads/2013/10/Definition-und-Marktanalyse-von-B%C3%BCrgerenergie-in-Deutschland.pdf (accessed on 23 August 2017).
  59. European Environment Agency. Corine Land Cover 2006 Raster Data. Available online: https://www.eea.europa.eu/data-and-maps/data/clc-2006-raster-4 (accessed on 23 August 2017).
  60. Bofinger, S.; Callies, D.; Scheibe, M.; Saint-Drenan, Y.-M.; Rohrig, K. Fraunhofer Institut für Windenergie und Energiesystemtechnik (IWES) Abteilung Energiewirtschaft und Netzbetrieb. In Potenzial der Windenergienutzung an Land. Kurzfassung; Bundesverband für Windenergie e.V.: Berlin, Germany, 2012. [Google Scholar]
  61. Ministerium für Wirtschaft Klimaschutz Energie und Landesplanung Rheinland-Pfalz; Ministeriums der Finanzen Rheinland-Pfalz; Ministeriums für Umwelt Landwirtschaft Ernährung Weinbau und Forsten Rheinland-Pfalz; Ministeriums des Innern für Sport und Infrastruktur Rheinland-Pfalz. Hinweise für die Beurteilung der Zulässigkeit der Errichtung von Windenergieanlagen in Rheinland-Pfalz (Rundschreiben Windenergie ); Ministerium für Wirtschaft, Klimaschutz, Energie und Landesplanung, Ministerium der Finanzen/Ministerium für Umwelt Landwirtschaft Ernährung Weinbau und Forsten/Ministerium des Innern für Sport und Infrastruktur: Mainz (Rheinland-Pfalz), Germany, 2013.
  62. Bundesinstitut für Bau- Stadt- und Raumforschung. Indikatoren und Karten zur Raum-und Stadtentwicklung; Bundesinstitut für Bau- Stadt- und Raumforschung: Bonn, Germany, 2011. [Google Scholar]
  63. Statistische Ämter des Bundes und der Länder. Regionaldatenbank Deutschland. Available online: https://www.regionalstatistik.de/genesis/online/data;jsessionid=D7B825233CC603C8D663B4D388FB23E3?operation=abruftabelleBearbeiten&levelindex=2&levelid=1379406520750&auswahloperation=abruftabelleAuspraegungAuswaehlen&auswahlverzeichnis=ordnungsstruktur&aus (accessed on 10 August 2017).
  64. Bundesamt für Kartographie und Geodäsie Archive of GeoDatenZentrum. Available online: http://www.geodatenzentrum.de/auftrag/services/archiv/de0901/ (accessed on 10 August 2017).
  65. Pal Arya, S. Introduction to Micrometeorology, 2nd ed.; Academic Press: New York, NY, USA, 1988. [Google Scholar]
  66. Thrän, D.; Dotzauer, M.; Lenz, V.; Liebetrau, J.; Ortwein, A. Flexible bioenergy supply for balancing fluctuating renewables in the heat and power sector—A review of technologies and concepts. Energy Sustain. Soc. 2015, 5. [Google Scholar] [CrossRef]
  67. Walker, G.; Devine-Wright, P. Community renewable energy: What should it mean? Energy Policy 2008, 36, 497–500. [Google Scholar] [CrossRef]
  68. Dincer, I.; Acar, C. A review on clean energy solutions for better sustainability. Int. J. Energy Res. 2015, 39, 585–606. [Google Scholar] [CrossRef]
  69. Del Río, P.; Burguillo, M. An empirical analysis of the impact of renewable energy deployment on local sustainability. Renew. Sustain. Energy Rev. 2009, 13, 1314–1325. [Google Scholar] [CrossRef]
  70. Cebotari, S.; Benedek, J. Renewable energy project as a source of innovation in rural communities: Lessons from the periphery. Sustainability 2017, 9, 509. [Google Scholar] [CrossRef]
  71. Lutz, L.M.; Fischer, L.-B.; Newig, J.; Lang, D.J. Driving factors for the regional implementation of renewable energy—A multiple case study on the German energy transition. Energy Policy 2017, 105, 136–147. [Google Scholar] [CrossRef]
  72. Deutscher Bundestag. Nationaler Aktionsplan Energieeffizienz; Unterrichtung durch die Bundesregierung: Berlin, Geramny, 2014. [Google Scholar]
  73. BMJV Bundesministerium der Justiz und für Verbraucherschutz. Gesetz für den Ausbau Erneuerbarer Energien; Bundesministerium für Justiz und Verbraucherschutz: Berlin, Germany, 2017. [Google Scholar]
  74. Hirschl, B.; Aretz, A.; Dunkelberg, E.; Neumann, A.; Weiß, J. Potenziale Erneuerbarer Energien in Berlin 2020 und Langfristig—Quantifizierung und Maßnahmengenerierung zur Erreichung Ambitionierter Ausbauziele Studie zum Berliner Energiekonzept (Anlage 6); Institut für ökologische Wirtschaftsforschung: Berlin, Germany, 2011. [Google Scholar]
  75. Acosta, J.L.; Combe, K.; Djokic, S.Z.; Hernando-Gil, I. Performance Assessment of Micro and Small-Scale Wind Turbines in Urban Areas. IEEE Syst. J. 2012, 6, 152–163. [Google Scholar] [CrossRef]
  76. Allen, S.R.; Hammond, G.P.; McManus, M.C. Energy analysis and environmental life cycle assessment of a micro-wind turbine. Proc. Inst. Mech. Eng. Part A J. Power Energy 2008, 222, 669–684. [Google Scholar] [CrossRef]
Figure 1. Principal Component Analysis. Principal Component 1 is displayed on the x-axis (which explains 32% of variance) and Principal Component 2 on the y-axis (which explains 22% of variance). The variables are shown as arrows; the longer the arrow, the higher its explanatory power. For reasons of visual clarity, the following five variables, which had no or hardly an additional explanatory power, are not included in the figure: meadow residues, zoo mass and forest residues (closely correlated to jobs in agriculture and forestry), population growth (closely correlated to mean radiation and unemployment), household waste.
Sustainability 09 01560 g001
Figure 2. Contextual conditions for using renewable energy sources in all German regions. Maps show (a) the energy context types; (b) mean annual global radiation; (c) mean annual wind speed; (d) employment; and (e) settlement density. In maps (be), light colors indicate high values, dark colors indicate low values.
Sustainability 09 01560 g002
Table 1. Contextual factors considered in this study. Factors from natural and socio-economic context are operationalized in variables and proxies.
Contextual FactorVariableProxyReferences
Natural contextsolar radiationglobal radiationannual average global radiation [Wh/m2][39,52,53]
wind speedwind speedannual average wind speed at a height of 80 m [m/s][39,52]
waste biomass potentialfrom cropsharvest residues [GJ][54]
from meadowsmeadow residues [GJ][54]
from forestryforest residues [GJ][10,54]
from livestockzoomass [GJ][54]
from householdswaste [GJ][54]
Socio-economic contextpopulation densitypopulation densitynumber of inhabitants per km2 built-up area[44,52]
population growthpopulation growthtotal population growth up to the year 2025 [%][44,52]
property rateproperty rateproperty rate [%][55]
economic structureforestry and agricultureearners in forestry and agriculture [%][10]
industryearners in industry [%][44,52]
commerce and servicesearners in commerce and services [%][44]
economic strengthtax incomemunicipal tax income from households [€][44]
unemploymentunemployment rate [%][44]
Table 2. Energy context types: summary statistics. Mean values of non-standardized data are given. Cells are colored dark gray for values more than 1 standard deviation (SD) above average, and light gray for values more than 1 SD below average.
VariableEnergy Context Type
Urban NorthRural NorthLivestock BeltUrban SouthIndustrial EastRural SouthSunny SouthGlobal CityRich but Poor
T1T2T3T4T5T6T7T8T9
(N = 64)(N = 50)(N = 36)(N = 69)(N = 38)(N = 75)(N = 52)(N = 1)(N = 27)
Population density2916.81345.41162.43128.11338.41371.21438.15503.3810.5
Property30.058.363.839.950.862.661.914.949.0
Tax income543.3527.7547.3811.1402.5561.7664.5513.6330.1
Unemployment8.86.14.65.39.34.33.210.011.0
Earners agri. + fores.0.73.45.50.83.33.35.10.35.5
Earners industry19.424.526.524.034.832.932.912.924.6
Earners services79.972.167.975.162.063.962.086.869.8
Population growth−7.9−0.11.92.1−13.3−2.04.70.9−13.4
Wind speed5.85.86.35.15.75.85.15.35.8
Global radiation101710081034110510301081113610351034
Harvest residues27,413239,325227,5123040219,01785,821164,58218,187491,340
Meadow residues776548,905182,927714730,60357,57733,8673343101,253
Forest residues49,852485,553291,896112,371445,870625,863355,525236,318765,317
Zoo mass48,419249,7581,030,41731,780175,590181,885300,3927586378,915
Household waste422,402360,245324,317446,452275,217271,564246,3326,059,108250,054

