A Methodology for Analysing Sustainability in Energy Scenarios
by
 , ,
, ,
Elisa Peñalvo-López
1 ,
,
Francisco Javier Cárcel-Carrasco
1 ,
,
Carlos Devece
1,* and
Ana Isolda Morcillo
2 1
Universitat Politècnica de València, Camino de Vera s/n, 46022 Valencia, Spain
2
ATERSA S.A., P. Ind. Juan Carlos I, Av de la Foia, 14, 46440 Almussafes, Valencia, Spain
*
Author to whom correspondence should be addressed.
Sustainability 2017, 9(9), 1590; https://doi.org/10.3390/su9091590
Submission received: 26 July 2017
/
Revised: 1 September 2017
/
Accepted: 1 September 2017
/
Published: 7 September 2017
(This article belongs to the Special Issue Entrepreneurial Sustainability: New Innovative Knowledge)
Abstract
:Energy is a key factor in sustainability and a very attractive but risky sector for entrepreneurs. The need for sustainability in the energy sector forces the introduction of renewable sources in any scenario considered, but this investment must be thoroughly assessed. A methodology is required that enables the deduction of a realistic level of participation of renewable energy in the energy scenario in each particular case. Such a methodology should take into account all the factors involved and, by conciliating the different constraints imposed by each of them, find the maximum level of renewable energy possible in the system. This paper introduces a new methodology to address this problem by taking into account demand, generation, level of resources and technologies; and applies it to a particular case in a region of Democratic Republic of Congo. The uncertainties present in the energy sector, as well as the numerous factors at play, call for scenario planning, and this paper presents a structured procedure for viewing plausible futures.
1. Introduction
Electricity has become one of the main driving forces for the economic development of societies, especially in remote areas where lack of access to modern energy is linked to poverty [1]. One of the main challenges for the international community is to minimize the inequality of energy services between OECD and developing countries. According to many different organizations, such as the United Nations [2,3], the World Bank [4] and the International Energy Agency [5], electricity provides the necessary framework for economic, social and human progress with deep effect on productivity, health, education, climate change, food and water security, and communication services.
International Energy Agency (IEA) studies show that approximately 16% of the world population will still lack access to electricity in 2030 if no additional policies are introduced to alleviate energy poverty [6]. It is necessary to develop a sustainable energy roadmap to increase the worldwide electrification rate, beginning with energy planning. According to the United Nations’ report “Our common future”, sustainability refers to “meeting the needs of the present without compromising the ability of future generations to meet theirs”. In this regard, a sustainable energy roadmap implies the energy development of present countries based on increasing renewable generation and energy independence with other regions, while moderating the energy use and reducing CO2 emissions due to energy consumption.
The renewable energy sector is a very attractive investment opportunity for green entrepreneurs [7], entrepreneurs capable of discovering opportunities in extant economic structures in order to introduce competitiveness in sustainable behaviours [8]. In the energy sector, any green initiative needs to be thoroughly analysed, considering general energy planning. Entrepreneurs need to understand the big picture of energy sources in a country, how and why these sources are used, and the possible future demand scenarios, before taking any strategic decision for renewable energy investment. The main aim of this work is to present an easily applicable energy planning tool for assisting entrepreneurs in analysing the risks and viability of renewable energy projects.
Energy planning is a scientific discipline used to study different energy transition roadmaps for communities [9]. It analyses the various paths of energy evolution of a region by studying different energy scenarios in three temporal ranges: short (1 to 10 years), medium (10 to approximately 30 years) and long term analysis (more than 30 years). Generally, it begins examining as a reference the actual scenario, named “Business As Usual” (BAU), and its evolution for the time span considered. Then, it compares the results from another alternative scenario under the same time span and demand constraints. Each energy scenario involves assessing and matching energy sources (oil, coal, natural gas, renewable and nuclear) with the corresponding demand sectors (commercial, industrial, residential, etc.) in an optimal manner.
Although it may seem a simple idea, it becomes a complex problem in which various decisions and criteria converge, together with the existence of complex relationships between the different actors involved in the simulation process: generation, demand, emissions, economics, and technologies [10]. Any decision about the use of renewable energy must be thoroughly assessed in terms of capacity and competitiveness [11]. Models in energy planning are important in emerging communities and in developed urban areas, since they determine the energy roadmap and future objectives. Precise modelling requires large computational resources, thus a trade-off between exactness and resources needs to be balanced.
In order to approximate reality with acceptable computational resources, models are based on certain hypotheses that tackle possible scenarios and casuistry, using estimations and assumptions which may or may not become valid under initial premises but that are unknown at the moment of modelling [12].
2. Methodology
Our review of the appropriate literature shows numerous tools for energy planning [13]. The applicability and benefits of software tools in energy planning, which facilitate calculations and reduce processing time, is widely demonstrated. In 2010, Connolly et al. [13] published a review of 37 computer tools for analysing the integration of renewable energy into various energy systems. These tools, such as Energy Plan or LEAP (Long-range Energy Alternatives Planning system) [13], allow comparing different alternatives in order to assess the advantages and disadvantages of different energy solutions, assisting in the evaluation of different energy roadmaps in a feasible time frame. However, these tools are not specifically developed for the verification of distributed renewable hybrid systems aiming to cover the energy demand of a particular area in a sustainable way.
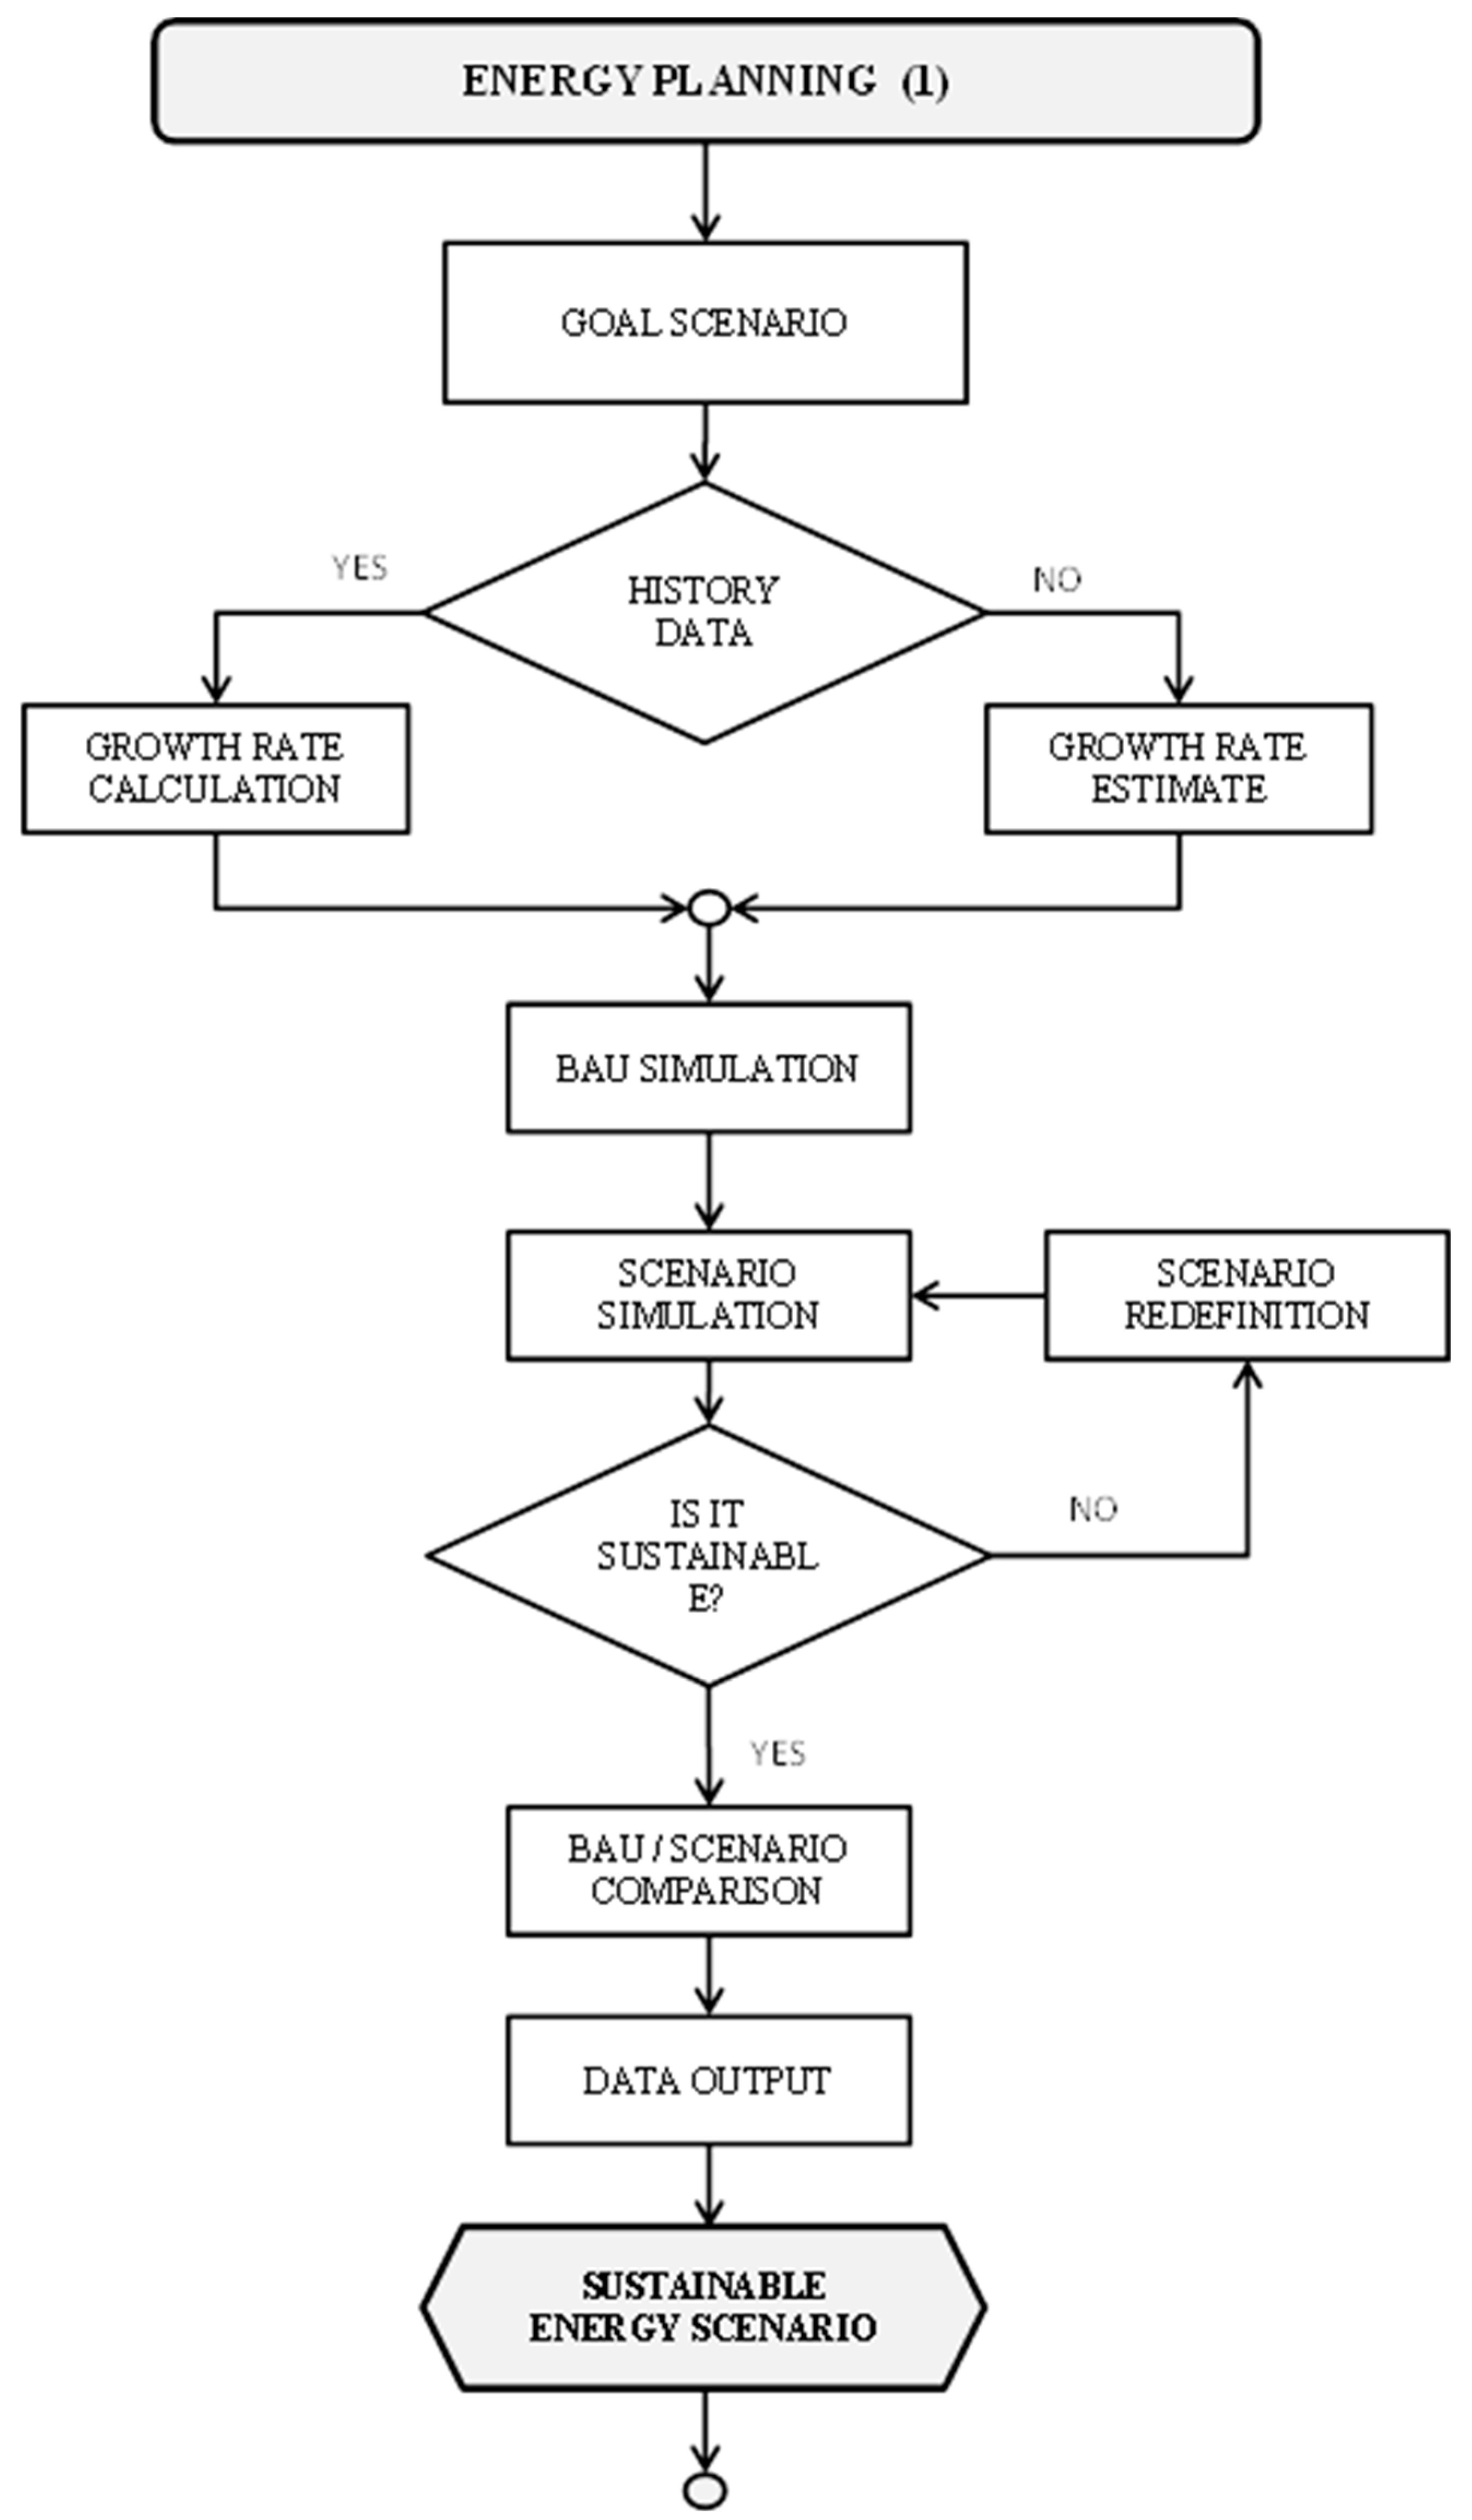
The methodology presented in this paper, called SIMESEN (“Simulación de Escenarios Energéticos”—Simulation of Energy Scenarios), was developed at the Institute for Energy Engineering of Universitat Politécnica de València in 2010 (Figure 1). It uses a centralized approach to analyse different energy alternatives towards a sustainable energy transition of an area, a region or a country. It explores the impact of sustainable solutions in the energy roadmap of the country. The methodology presented refers to the comparison of two macro-level energy scenarios: Business As Usual (BAU) and an exploratory energy scenario based on renewable energies. It compares the evolution of the energy context with the actual energy mix of the country with an HRES (Hybrid Renewable Systems) scenario based on distributed renewable power generation. The HRES scenario explores the impact of increasing the contribution of renewable sources in the country by means of distributed renewable hybrid systems [14,15]. SIMESEN allows analysing two alternative paths in order to identify the key factors and quantify the contribution of renewable sources for reaching a sustainable objective.
This methodology is based on a linear model that relates the demand with the possible contributions of each primary energy source and electricity. The use of linear models to tackle complex problems is usual in energy modelling [13]. It provides the evolution of each of these contributions and their associated CO2 eq. emissions in order to analyse a series of energy variables (Table 1).
The following variables are taken into consideration:
The evolution of the independent variables, which are assumed to be the energy demand of each sector, can be defined by predetermined mathematical laws. In this type of analysis annual rhythms of variation is often used, for which it is defined vector R(j,t).
The following relationships represent the mathematical relation between them:
The following energy indicators quantify the degree of compliance with the sustainability objective and the evolution followed to achieve it:
- External dependence from outside the country on the primary energy supply.
- Share of renewable energies in total energy consumption.
- Energy intensity as the ratio between energy consumption and gross domestic product, which is used to measure energy saving and efficiency.
- Total amount of CO2 emitted by each energy sector in the country.
3. Case Study: Democratic Republic of Congo
Electricity is necessary for the economic development of any community. However, electricity supply becomes a challenge for remote and isolated communities [16]. Renewable hybrid energy systems may safely generate electricity for minimum demand requirements without implementing large facilities or networks. Throughout this case study the integration of Renewable Hybrid Systems in the national energy context is studied as a strategy for increasing sustainable electrification in isolated areas and the possibilities of green entrepreneurship.
3.1. Energy Context of DRC
Democratic Republic of Congo (DRC) is located in the centre of Africa, near the equator. It is the second largest country in Africa in terms of area (2,345,441 km2) with an estimated population of 74.88 million of inhabitants, having a population growth rate of 3.1% from 1990 to 2014. Approximately 75% of the total population lives in rural areas and it is dependent on agriculture, land cultivation and forestry being their major economic activities.
In terms of energy, DRC has a great potential with abundant and varied energy resources: biomass, solar, wind, hydraulic energy, hydrocarbons, including methane gas from Lake Kivu, mineral coal, oil shale, and so on. The sustainable development of these energy resources for economic and social development of the country will certainly be the main agenda of the national and regional Governments.
DRC’s energy sector is currently centralised and characterised by a state monopoly. However, it has a high energy potential for distributed energy supply over the country’s territory, which is almost unexploited. Estimations of DRC’s energy potential are around 100 GW of exploitable capacity, of which almost half (44 GW) is concentrated at the river Inga. Despite this extraordinary energy potential, especially for renewable energy generation (mainly hydro based), DRC’s national electrification rate is 9% with strong disparities between urban and rural areas (Kinshasa is 44%, while rural Bandundu is 0.6%) [17]. Moreover, the transport and distribution electricity network is out of date and unable to support actual current consumption, which results in frequent power outages. In the places where electricity is essential, such as hospitals, hotels, public buildings, and so on, the problem is circumvented by using fossil fuel generators to get some security in electricity supply. However, many remote areas exist where grid extension is costly and these areas simply do not have access to electricity [17,18]. In these cases, renewable hybrid systems may be the best alternative to provide energy access and economic development to the societies, without large initial investment in network extension. The DRC energy policy to increase the electrification rate was implemented by means of the Electricity Code in 2014, which authorized the establishment of a regulatory agency and a rural electrification agency, while promoting the power sector to private investment [19].
Figure 2 represents the energy flow diagram of DRC in the year 2014, including the origin (energy source) and destination (sector) of energy units. As may be observed, only oil and renewable energies are supplying the country. Country imports are oil products for transport and electricity; while hydro is all for electricity generation and biomass is mainly used in residential contexts as fuel.
Data from 2014, provided by International Energy Agency (IEA) [19,20], represented in the following Energy diagram for DRC (Figure 2), shows a national energy supply of 30.04 Mtep (Million tons of oil equivalent, 1 Mtep is equivalent to 11,630 GWh) in contrast to 28.79 Mtep in 2013, mainly based in three energy sources: oil, biomass and hydro. Produced oil is exported to other countries (1.07 Mtep), while oil products such as gasoline and diesel are imported in large quantities (1.78 Mtep), so DRC presents an oil product dependency from the exterior, mainly in transport (1094 Mtep). Biomass is the highest energy supply in the country, and it is based on traditional fuels such as firewood, charcoal and waste, which denotes the reduced access to energy supply and the low level of electrification in the country. Hydro is the only source for electricity generation together with minor contributions from coal and natural gas.
Total final energy consumption reached 21.51 Mtep, an increase of 12.5% from the previous year (19.11 Mtep in 2013). The sector leading consumption is residential (77%), followed by industry (16%) and transport (7%), while other forms of energy such as electricity contributes with only 4.1%.
3.2. Comparison of Scenarios: BAU vs. HRES
Further to the analysis of the actual energy context, this section compares the evolution of two energy scenarios: BAU and HRES. BAU is based on a continuous trend where participation of each energy source to the national mix is maintained, together with the electricity import-export balance. To do so, a historical analysis has been carried out in order to forecast the growth rates of population, GDP, primary energy and final consumption for each sector (see Table 2).
The second scenario, HRES, proposes a sustainable roadmap based on increasing renewable energy in the energy mix of the country by means of implementing HRES. This scenario aims to increase the access to electricity using distributed renewable hybrid technologies and palliating the raise of CO2 emissions introducing biofuels in the transport sector.
The comparison showed the impact of the proposed measures in a series of energy indicators and graphs representing the evolution of both energy alternatives over time. Results of the sustainable energy indicators for BAU and HRES scenarios and their forecasted evolution within the time period of study (from 2014 to 2035) are shown in the following tables (Table 3 and Table 4):
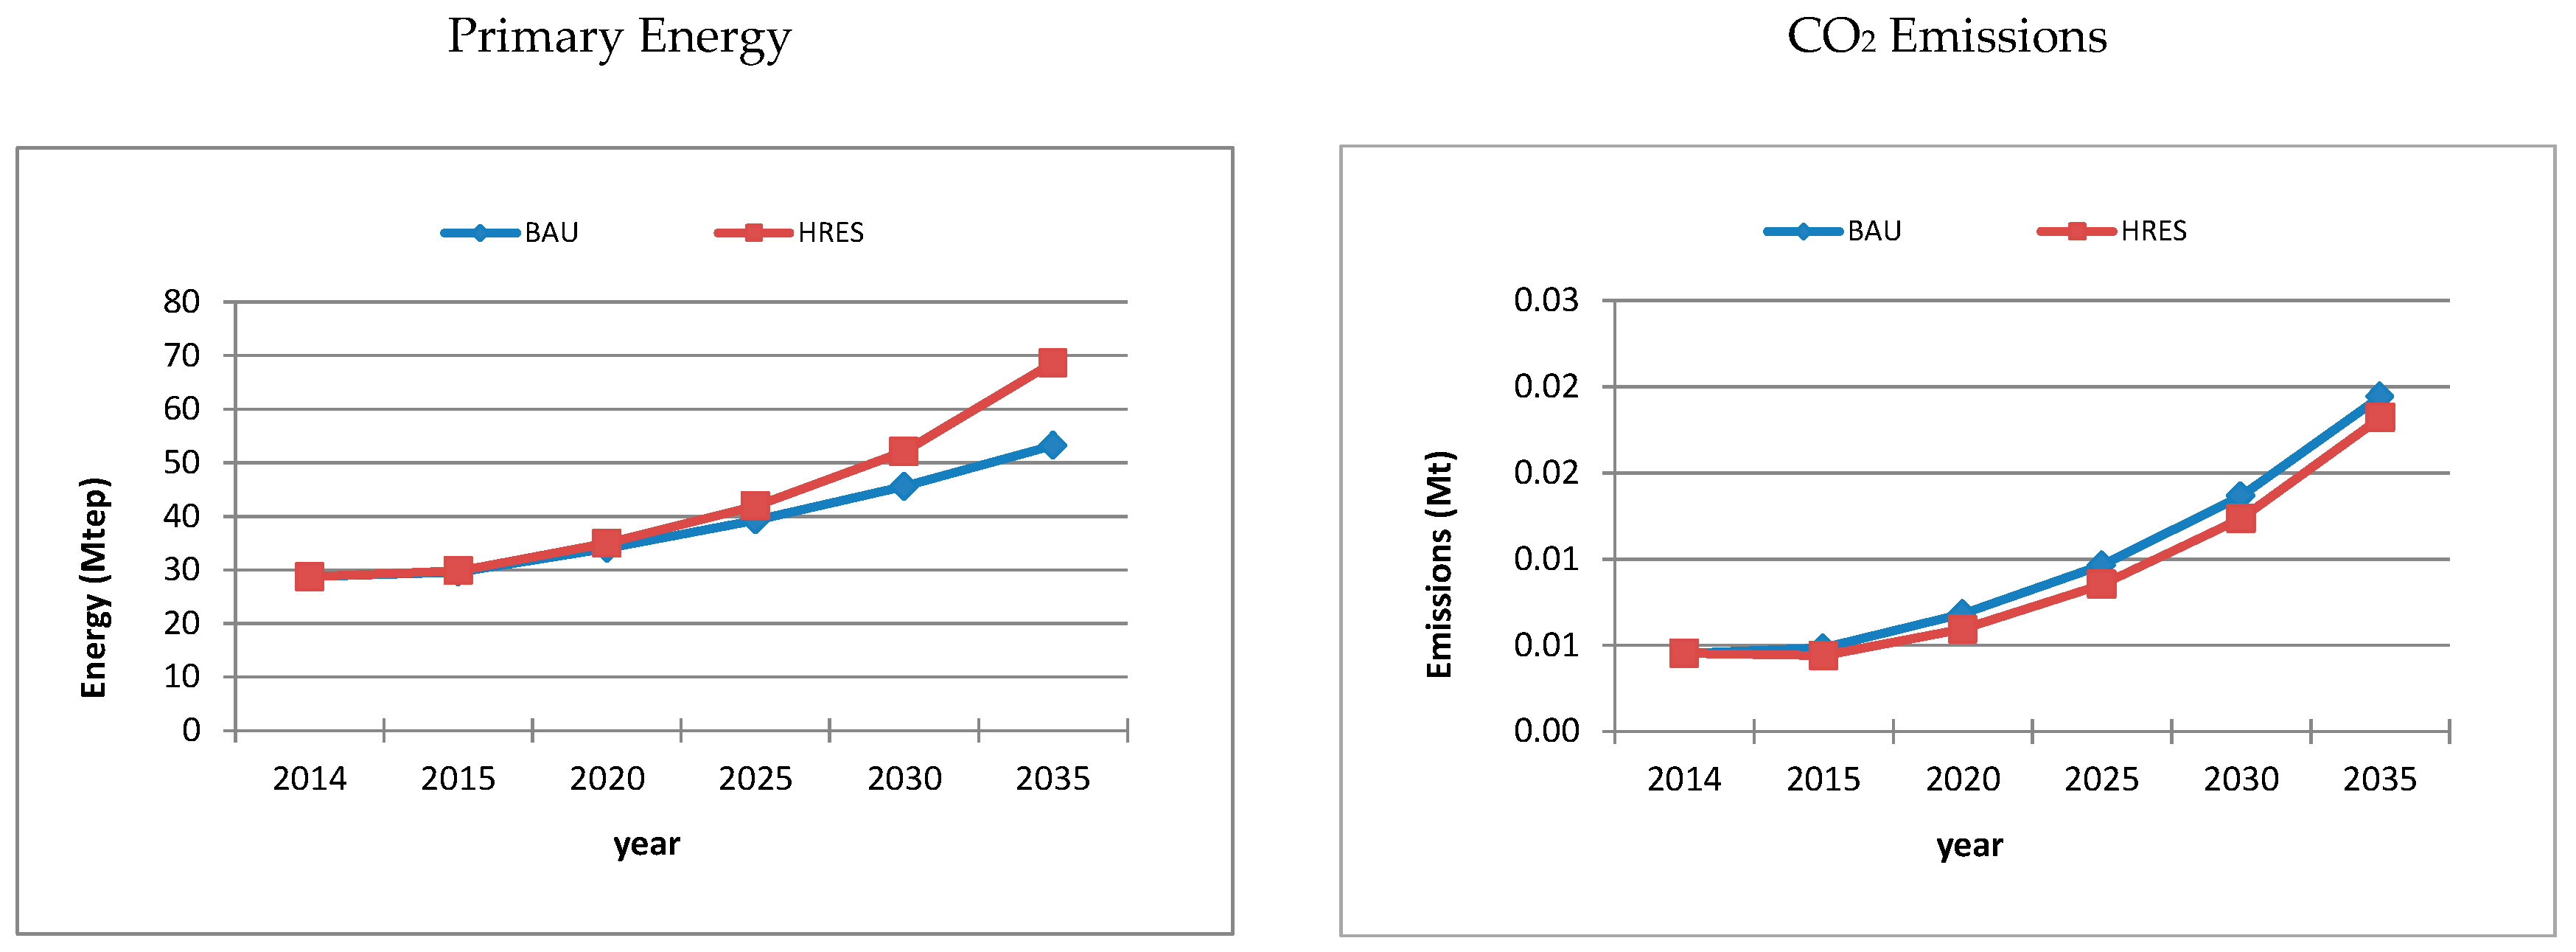
The next step is to analyse the key indicators. Figure 3 represents the analysis of the primary energy and CO2 emissions for both scenarios. As may be observed, the HRES scenario shows an increment of total primary energy with respect to BAU. This is due to the increment in distributed electric generation with renewable hybrid systems. CO2 emissions are similar in both scenarios; HRES is slightly lower since this scenario considers a penetration of 10% of biofuels in transport, thus replacing part of the fossil fuel consumption in this sector.
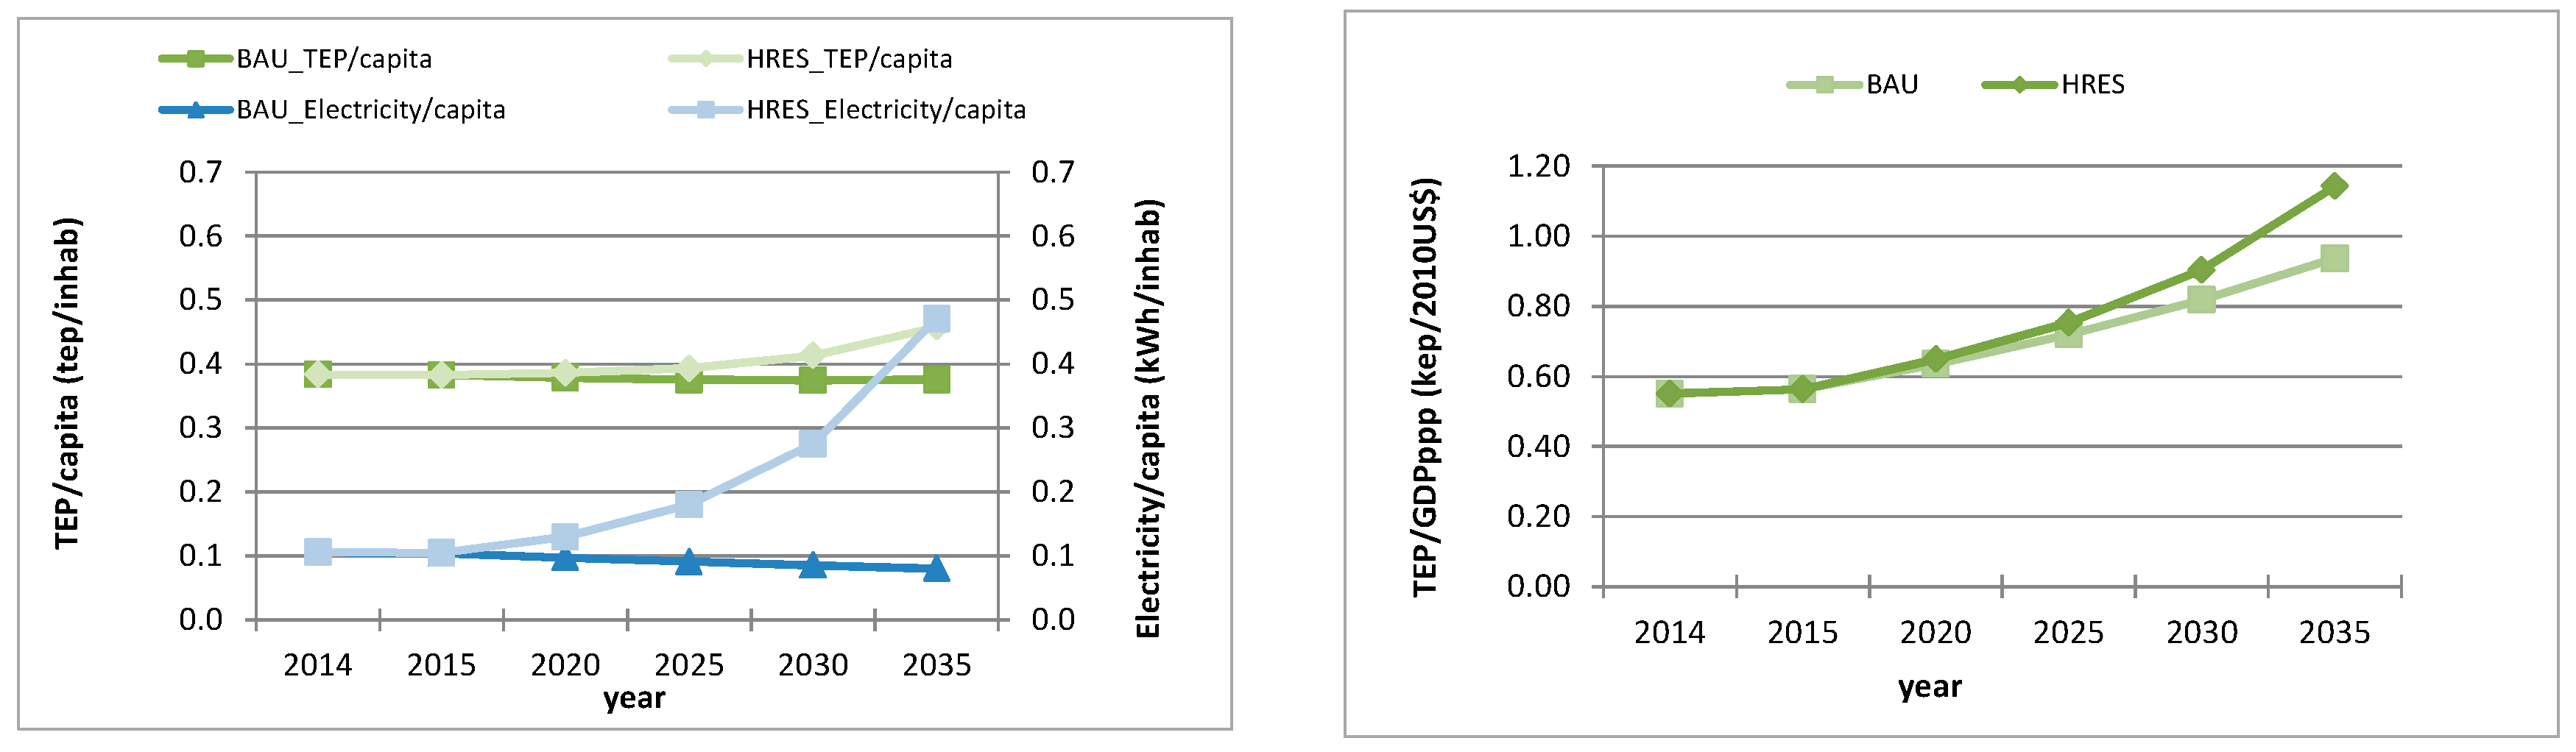
Energy intensity is analysed using three main energy indicators: total primary energy per capita (TEP/capita), average consumption of electricity per capita (electricity/capita), and total primary energy per gross domestic product per employed person (TEP/GDPppp). In this regard, it is observed that HRES increases the electrification rate to 0.58 kWh/capita by 2035, while continuing with the current energy paradigm will quasi maintain electricity rate to actual value (Figure 4).
Exterior dependency is similarly reduced in the HRES scenario. Penetration of renewable hybrid systems in remote areas will increase the percentage of population with electricity access without compromising their energy independence, since HRES are off-grid power plants based on local resources (Figure 5). In the case of continuing with the current scenario (BAU), fossil fuels and electricity dependency will increase in future years.
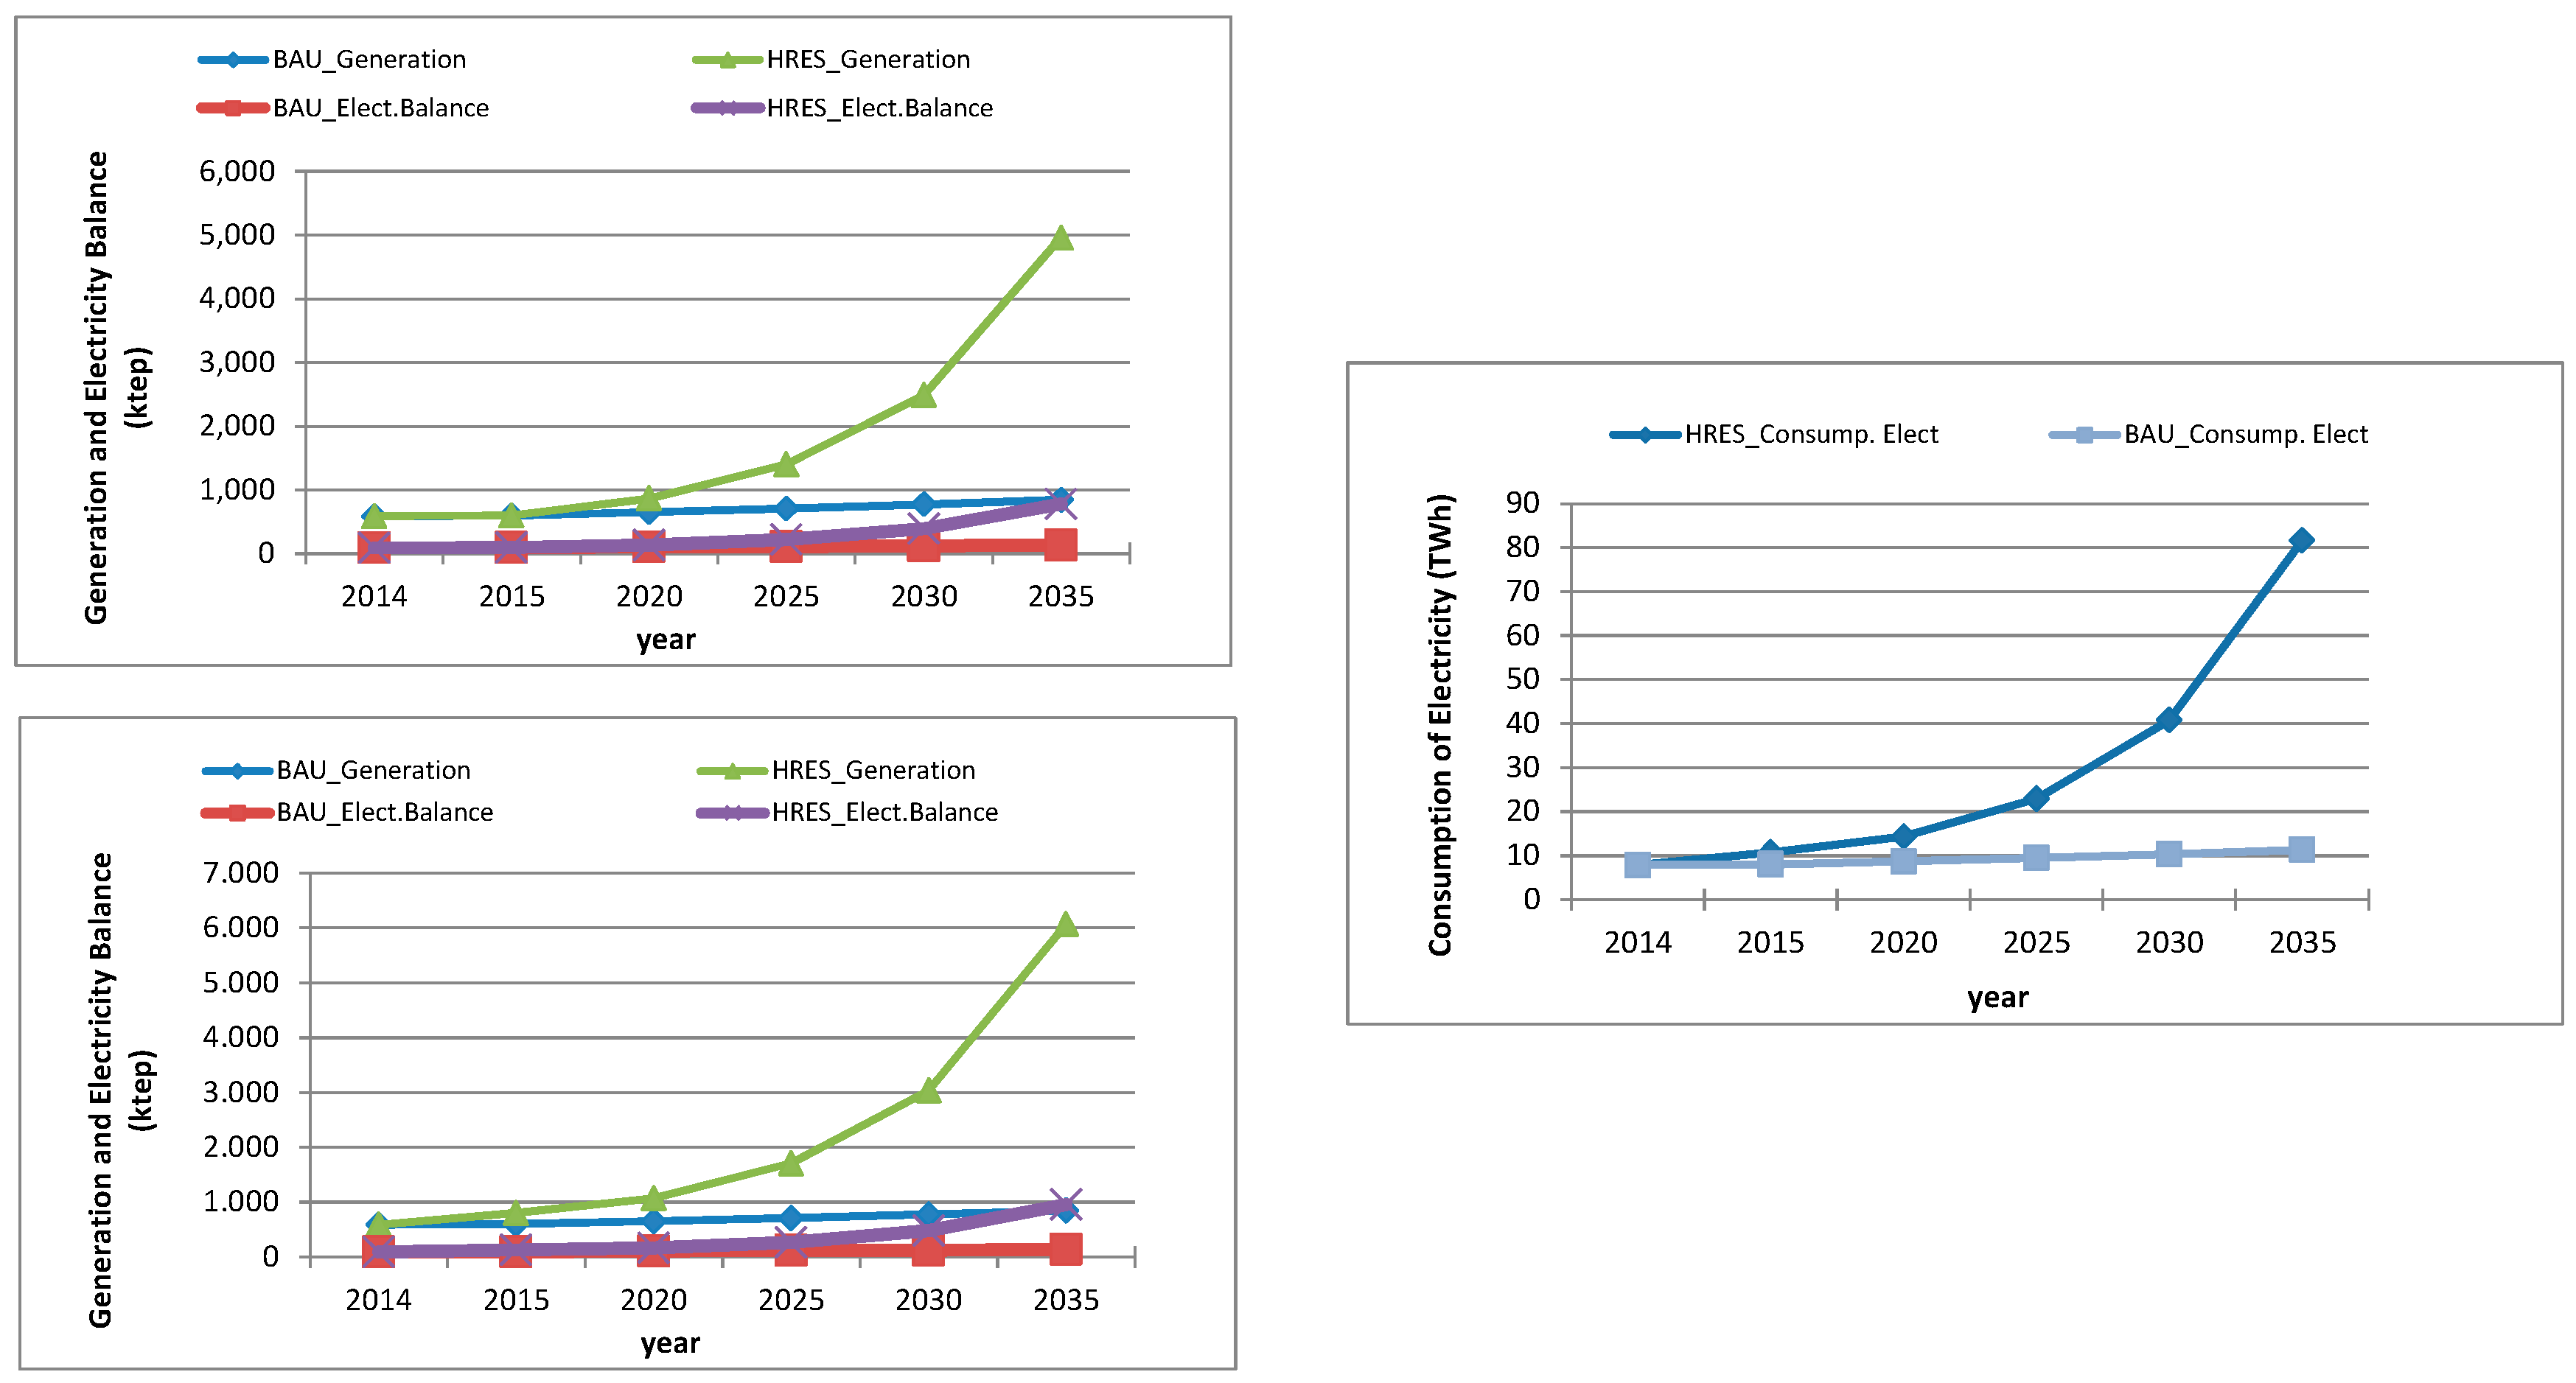
Electricity generation in the HRES scenario would cover a wider range of electricity access in isolated areas, which would also imply higher electricity consumption and economic development of the area. Increasing electricity rate to Africa’s actual values of electricity per capita will require a significant effort and compromise from national and regional government to promote HRES as a local and sustainable alternative for rapid energy development in off-grid areas (Figure 6).
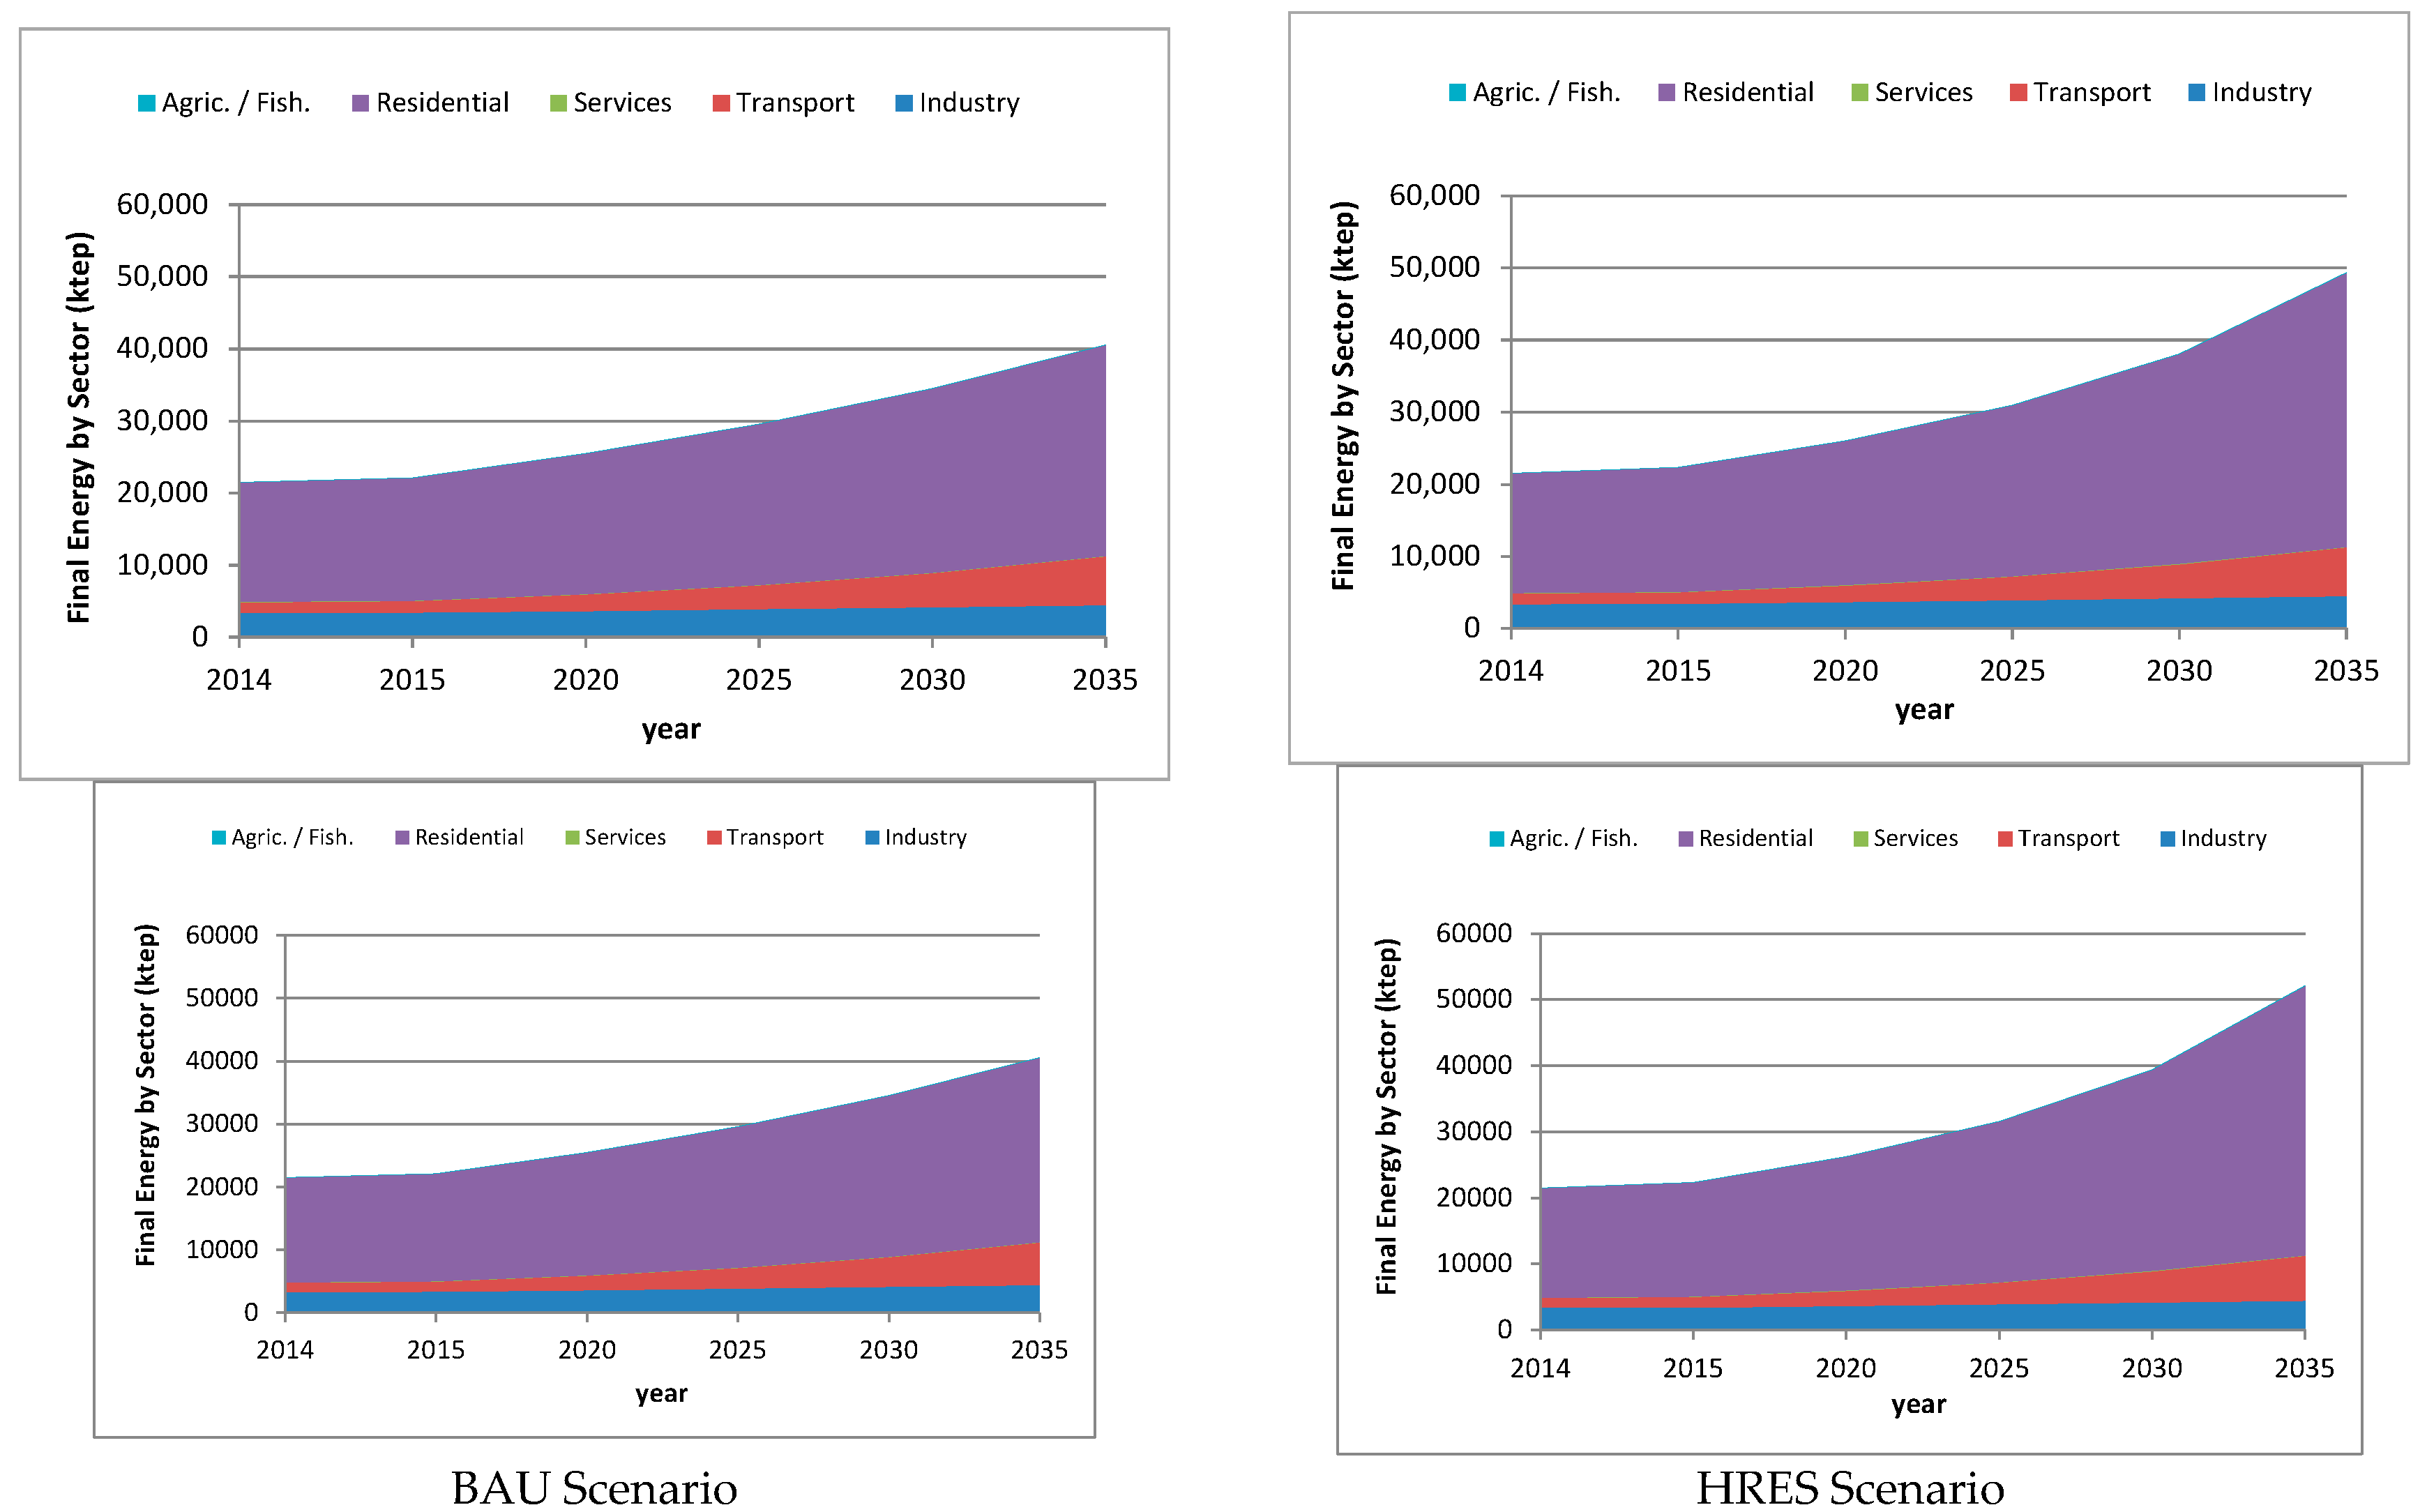
Final energy consumption per economic sector indicates a growing energy demand in the residential segment in HRES with respect to BAU, while Industry and Transport show similar energy evolution. The HRES scenario provides an increment in Residential energy consumption originated by the electrification process in residential segment, reaching 50 Mtep in 2035 (Figure 7).
Analysis of energy sources highlights the rapid growth of renewable energies to respond to residential electrical needs in 2035. In both scenarios, production with renewable energies increases significantly, but it is specially significant in HRES, reaching the value of around 4.7 Mtep in 2035 in contrast with 3.3 Mtep in BAU 2035. Oil demand is similar in both scenarios, presenting a value of 6.8 Mtep in BAU 2035 versus 5.8 Mtep in HRES 2035. This difference corresponds to decreasing demand of oil products (gasoline and diesel) in transport that have been replaced with biofuels, increasing biomass requirements in this economic sector (Figure 8).
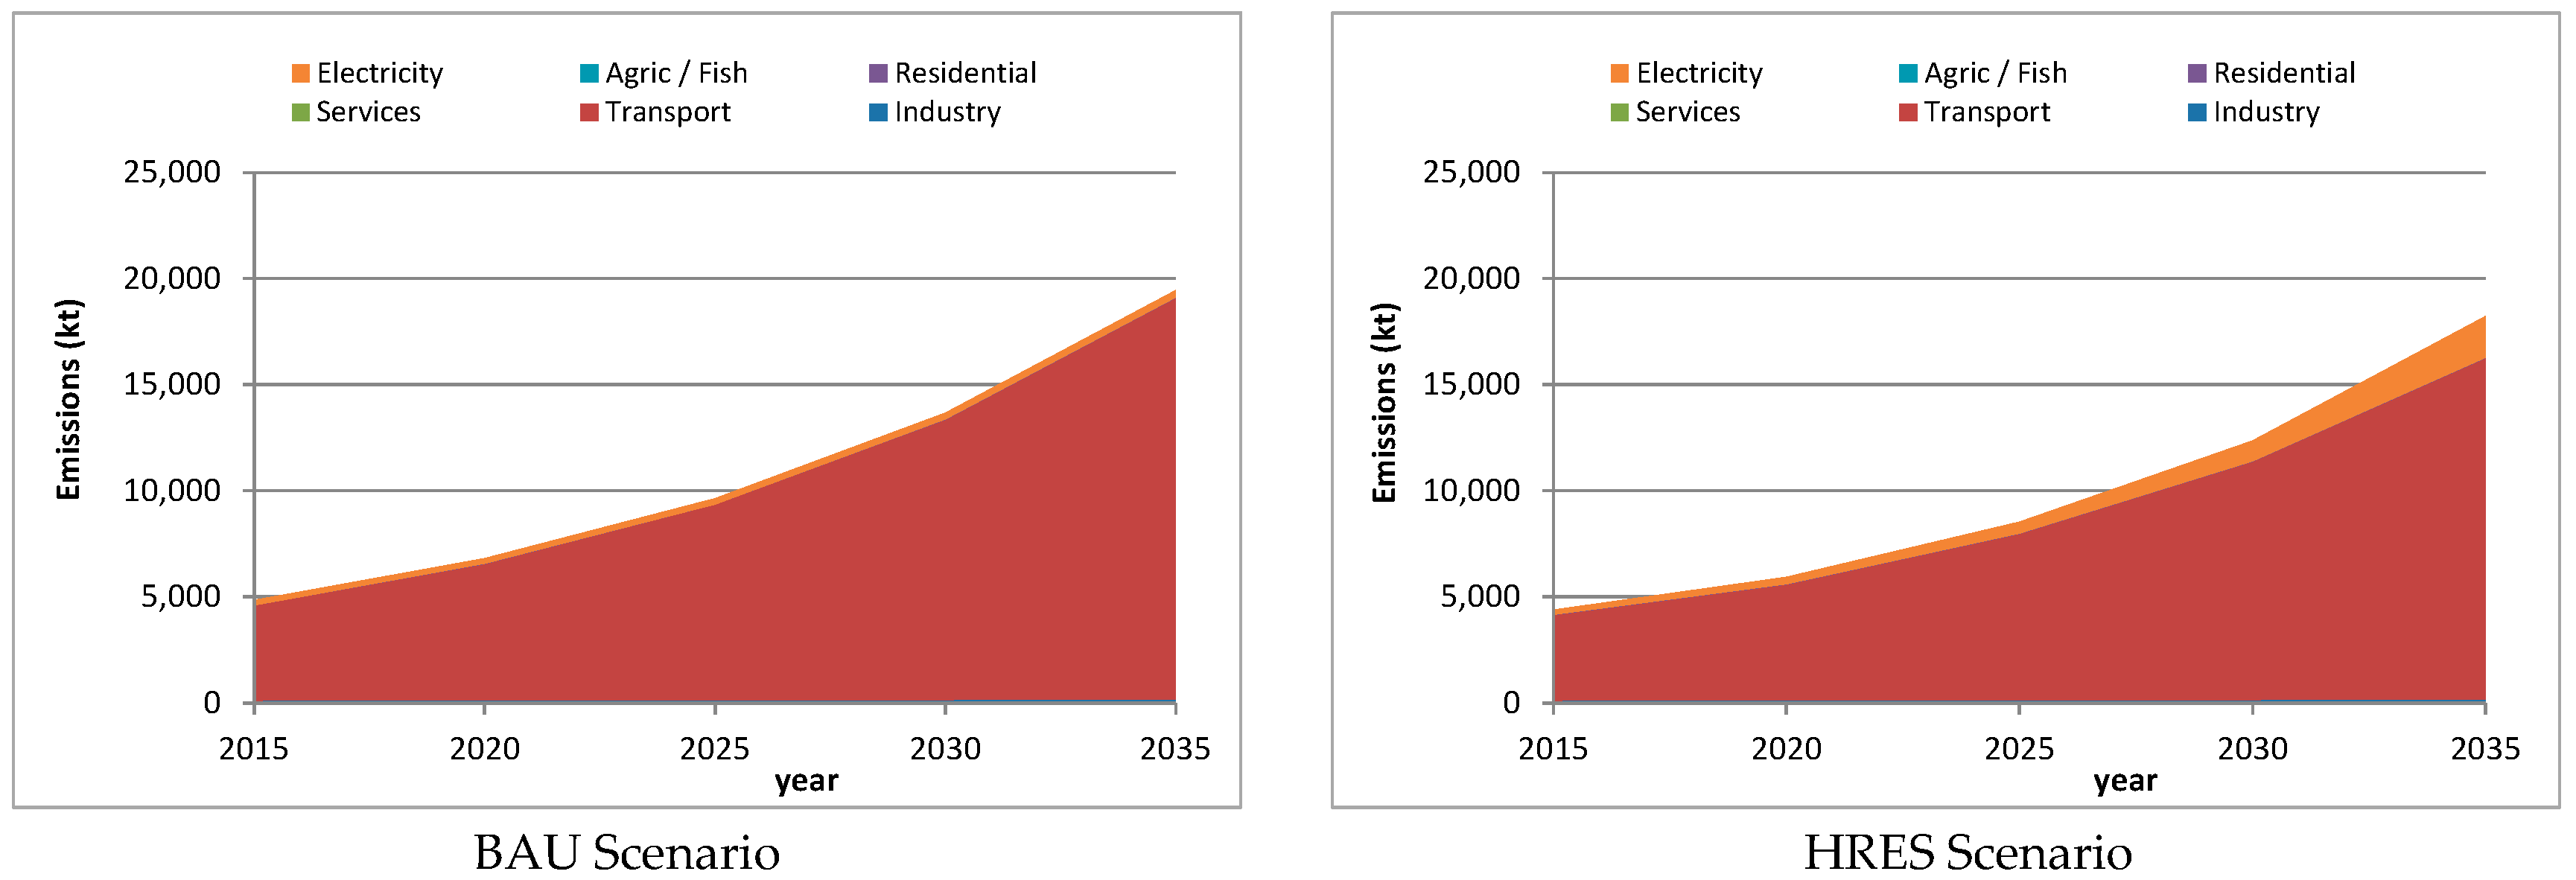
Emissions will evolve similarly in both scenarios. Nevertheless, the HRES scenario shows a slight reduction of emissions in transport due to the biofuel penetration in the transport, and an increment in emissions due to the extended used of electricity in the country (Figure 9).
As may be observed in the analysis, it is feasible to alleviate energy poverty in the country by means of HRES penetration in remote areas where access to electricity is not available.
4. Conclusions
In the present study, the authors present SIMESEN, a practical methodology to guide green entrepreneurship in the energy sector. SIMESEN methodology analyses different energy scenarios to increase the electrification rate while maintaining the commitment with climate change and CO2 eq. emissions reduction. This methodology allows identification of the best energy path to achieve a sustainable roadmap for developing countries, such is the case of Democratic Republic of Congo. The SIMESEN method condenses a considerable amount of data, reducing the sustainability complexity to a manageable amount of meaningful information [21].
Results extracted from the SIMESEN methodology allow assessment of the realistic level of participation of renewable energies in a specific region or country. For instance, results from the case study presented demonstrate that sustainable energy development of countries with low electrification rates based on HRES is possible and should be accompanied by national and regional energy directives. Integrating energy policies that promote the use of distributed HRES systems may reduce external dependency from 36% to 31%, while increasing the electrification rate in the country. Renewable contributions to the national energy mix increases from 63 to 68%, mainly due to its increment in areas with no energy access, thus alleviating poverty. In fact, electricity per capita increases from 0.08 to 0.58 kWh/inhab while CO2 emissions per primary energy is reduced from 0.37 to 0.27 tCO2ep./tep. Enhancing HRES in remote communities will provide energy access to isolated areas, promoting the economic development of these communities without increasing CO2 emissions.
Future research can combine or include the SIMESEN, a scenario building method, with multi criteria decision analysis in order to support the process of decision making [22]. A considerable amount of data and uncertainty can be managed by SIMESEN, nevertheless, there are important aspects to be included, such as changing environmental regulations, variations in energy prices and technology improvements [23].
Acknowledgments
This work was carried out at the Institute for Energy Engineering located at the Universitat Politècnica de València in the framework of INICIA and GrowGreen projects (Ref. BIA2013-48157-C2-2-R and 649773, respectively). The authors deeply thank the Universitat Politècnica de Valencia and all the organizations involved in these projects for their support and, especially, to the National Government and European Commission for their funding provision.
Author Contributions
E. Peñalvo-López performed the model development; F. J. Cárcel-Carrasco and A. I. Morcillo gathered and analysed the data and Carlos Devece, together with E. Peñalvo-López, wrote the paper.
Conflicts of Interest
The authors declare no conflict of interest
References
- Pinkse, J.; Groot, K. Sustainable Entrepreneurship and Corporate Political Activity: Overcoming Market Barriers in the Clean Energy Sector. Entrep. Theory Pract. 2015, 39, 633–654. [Google Scholar] [CrossRef]
- United Nations Development Programme (UNDP). Sharing Innovative Experience: Examples of Successful Uses of Renewable Energy Sources in the South; United Nations Development Programme (UNDP): New York, NY, USA, 2003. [Google Scholar]
- United Nations. Commercialization of Renewable Energy Technologies for Sustainable Development; United Nations: New York, NY, USA, 2000. [Google Scholar]
- World Bank. The World Bank’s Energy Program: Poverty Reduction, Sustainability, and Selectivity; World Bank: Washington, DC, USA, 2010; Available online: http://siteresources.worldbank.org/INTENERGY/Publications/20269216/energybrochure.pdf (accessed on 10 July 2017).
- International Energy Agency (IEA). World Energy Balances: Overview (2017 edition); International Energy Agency: Paris, France, 2017; Available online: http://www.iea.org/statistics/topics/energybalances/ (accessed on 10 August 2017).
- International Energy Agency (IEA). Energy for All: Financing Access for the Poor; International Energy Agency: Paris, France, 2011; Available online: http://www.worldenergyoutlook.org/media/weowebsite/energydevelopment/weo2011_energy_for_all.pdf (accessed on 10 July 2017).
- Ndubisi, N.O.; Nair, S.R. Green Entrepreneurship (GE) and Green Value Added (GVA): A Conceptual Framework. Int. J. Entrep. 2009, 13, 21–24. [Google Scholar]
- Pacheco, D.F.; Dean, T.J.; Payne, D.S. Escaping the green prison: Entrepreneurship and the creation of opportunities for sustainable development. J. Bus. Ventur. 2010, 25, 464–480. [Google Scholar] [CrossRef]
- Laes, E.; Gorissen, L.; Nevens, F. A comparison of energy transition governance in Germany, the Netherlands and the United Kingdom. Sustainability 2014, 6, 1129–1152. [Google Scholar] [CrossRef]
- Loken, E. Use of multicriteria decision analysis methods for energy planning problems. Renew. Sustain. Energy Rev. 2007, 11, 1584–1595. [Google Scholar] [CrossRef]
- Gulagi, A.; Bogdanov, D.; Fasihi, M.; Breyer, C. Can Australia Power the Energy-Hungry Asia with Renewable Energy? Sustainability 2017, 9, 233. [Google Scholar] [CrossRef]
- Grubb, M.; Edmunds, J.; ten Brink, P.; Morrison, M. The cost of limiting fossil-fuel CO2 emissions: A survey and analysis. Annu. Rev. Energy Environ. 1993, 8, 397–478. [Google Scholar] [CrossRef]
- Connolly, D.; Lund, H.; Mathiesen, B.V.; Leahy, M. A review of computer tools for analysing the integration of renewable energy into various energy systems. Appl. Energy 2010, 87, 1059–1082. [Google Scholar] [CrossRef]
- Hurtado, E.; Peñalvo-López, E.; Pérez-Navarro, A.; Vargas, C.; Alfonso, D. Optimization of a hybrid renewable system for high feasibility application in non-connected zones. Appl. Energy 2015, 155, 308–314. [Google Scholar] [CrossRef]
- Sánchez-Diaz, C.; Monrabal, J.; González, D.; Alfonso, D.; Peñalvo-López, E. Experimental results of the hydrogen production control of a hydrogen energy buffer. Int. J. Hydrogen Energy 2015, 40, 5013–5024. [Google Scholar] [CrossRef]
- Petrakopoulou, F. The Social Perspective on the Renewable Energy Autonomy of Geographically Isolated Communities: Evidence from a Mediterranean Island. Sustainability 2017, 9, 327. [Google Scholar] [CrossRef]
- Bioenergy and Food Security Projects (BEFS). Democratic Republic of the Congo, BEFS Country Brief; Bioenergy and Food Security Projects (BEFS): Rome, Italy, 2013; Available online: http://www.fao.org/3/a-aq170e.pdf (accessed on 10 July 2017).
- Taliotis, C.; Bazilian, M.; Welsch, M.; Gielen, D.; Howells, M. Grand Inga to power Africa: Hydropower development scenarios to 2035. Energy Strategy Rev. 2014, 4, 1–10. [Google Scholar] [CrossRef]
- International Energy Agency (IEA). Africa Energy Outlook; World Energy Outlook Special Report; Organization for Economic Co-Operation and Development (OECD)/International Energy Agency (IEA): Paris, France, 2014; Available online: https://www.iea.org/publications/freepublications/publication/WEO2014_AfricaEnergyOutlook.pdf (accessed on 10 July 2017).
- International Energy Agency (IEA). Country Statistics; International Energy Agency: Paris, France, 2016; Available online: https://www.iea.org/statistics/statisticssearch/report/?country=CONGOREP&product=balances&year=2014 (accessed on 10 July 2017).
- Singh, R.K.; Murty, H.R.; Gupta, S.K.; Dikshit, A.K. An overview of sustainability assessment methodologies. Ecol. Indic. 2012, 15, 281–299. [Google Scholar] [CrossRef]
- Cinelli, M.; Coles, S.R.; Kirwan, K. Analysis of the potentials of multi criteria decision analysis methods to conduct sustainability assessment. Ecol. Indic. 2014, 46, 138–148. [Google Scholar] [CrossRef]
- Benedict, B.A. Benefits of scenario planning applied to energy development. Energy Procedia 2017, 107, 304–308. [Google Scholar] [CrossRef]
Figure 1.
Methodology SIMESEN (“Simulación de Escenarios Energéticos”—Simulation of Energy Scenarios) for Energy Planning.
Figure 1.
Methodology SIMESEN (“Simulación de Escenarios Energéticos”—Simulation of Energy Scenarios) for Energy Planning.

Figure 2.
Energy context of Democratic Republic of Congo (DRC) in 2014.
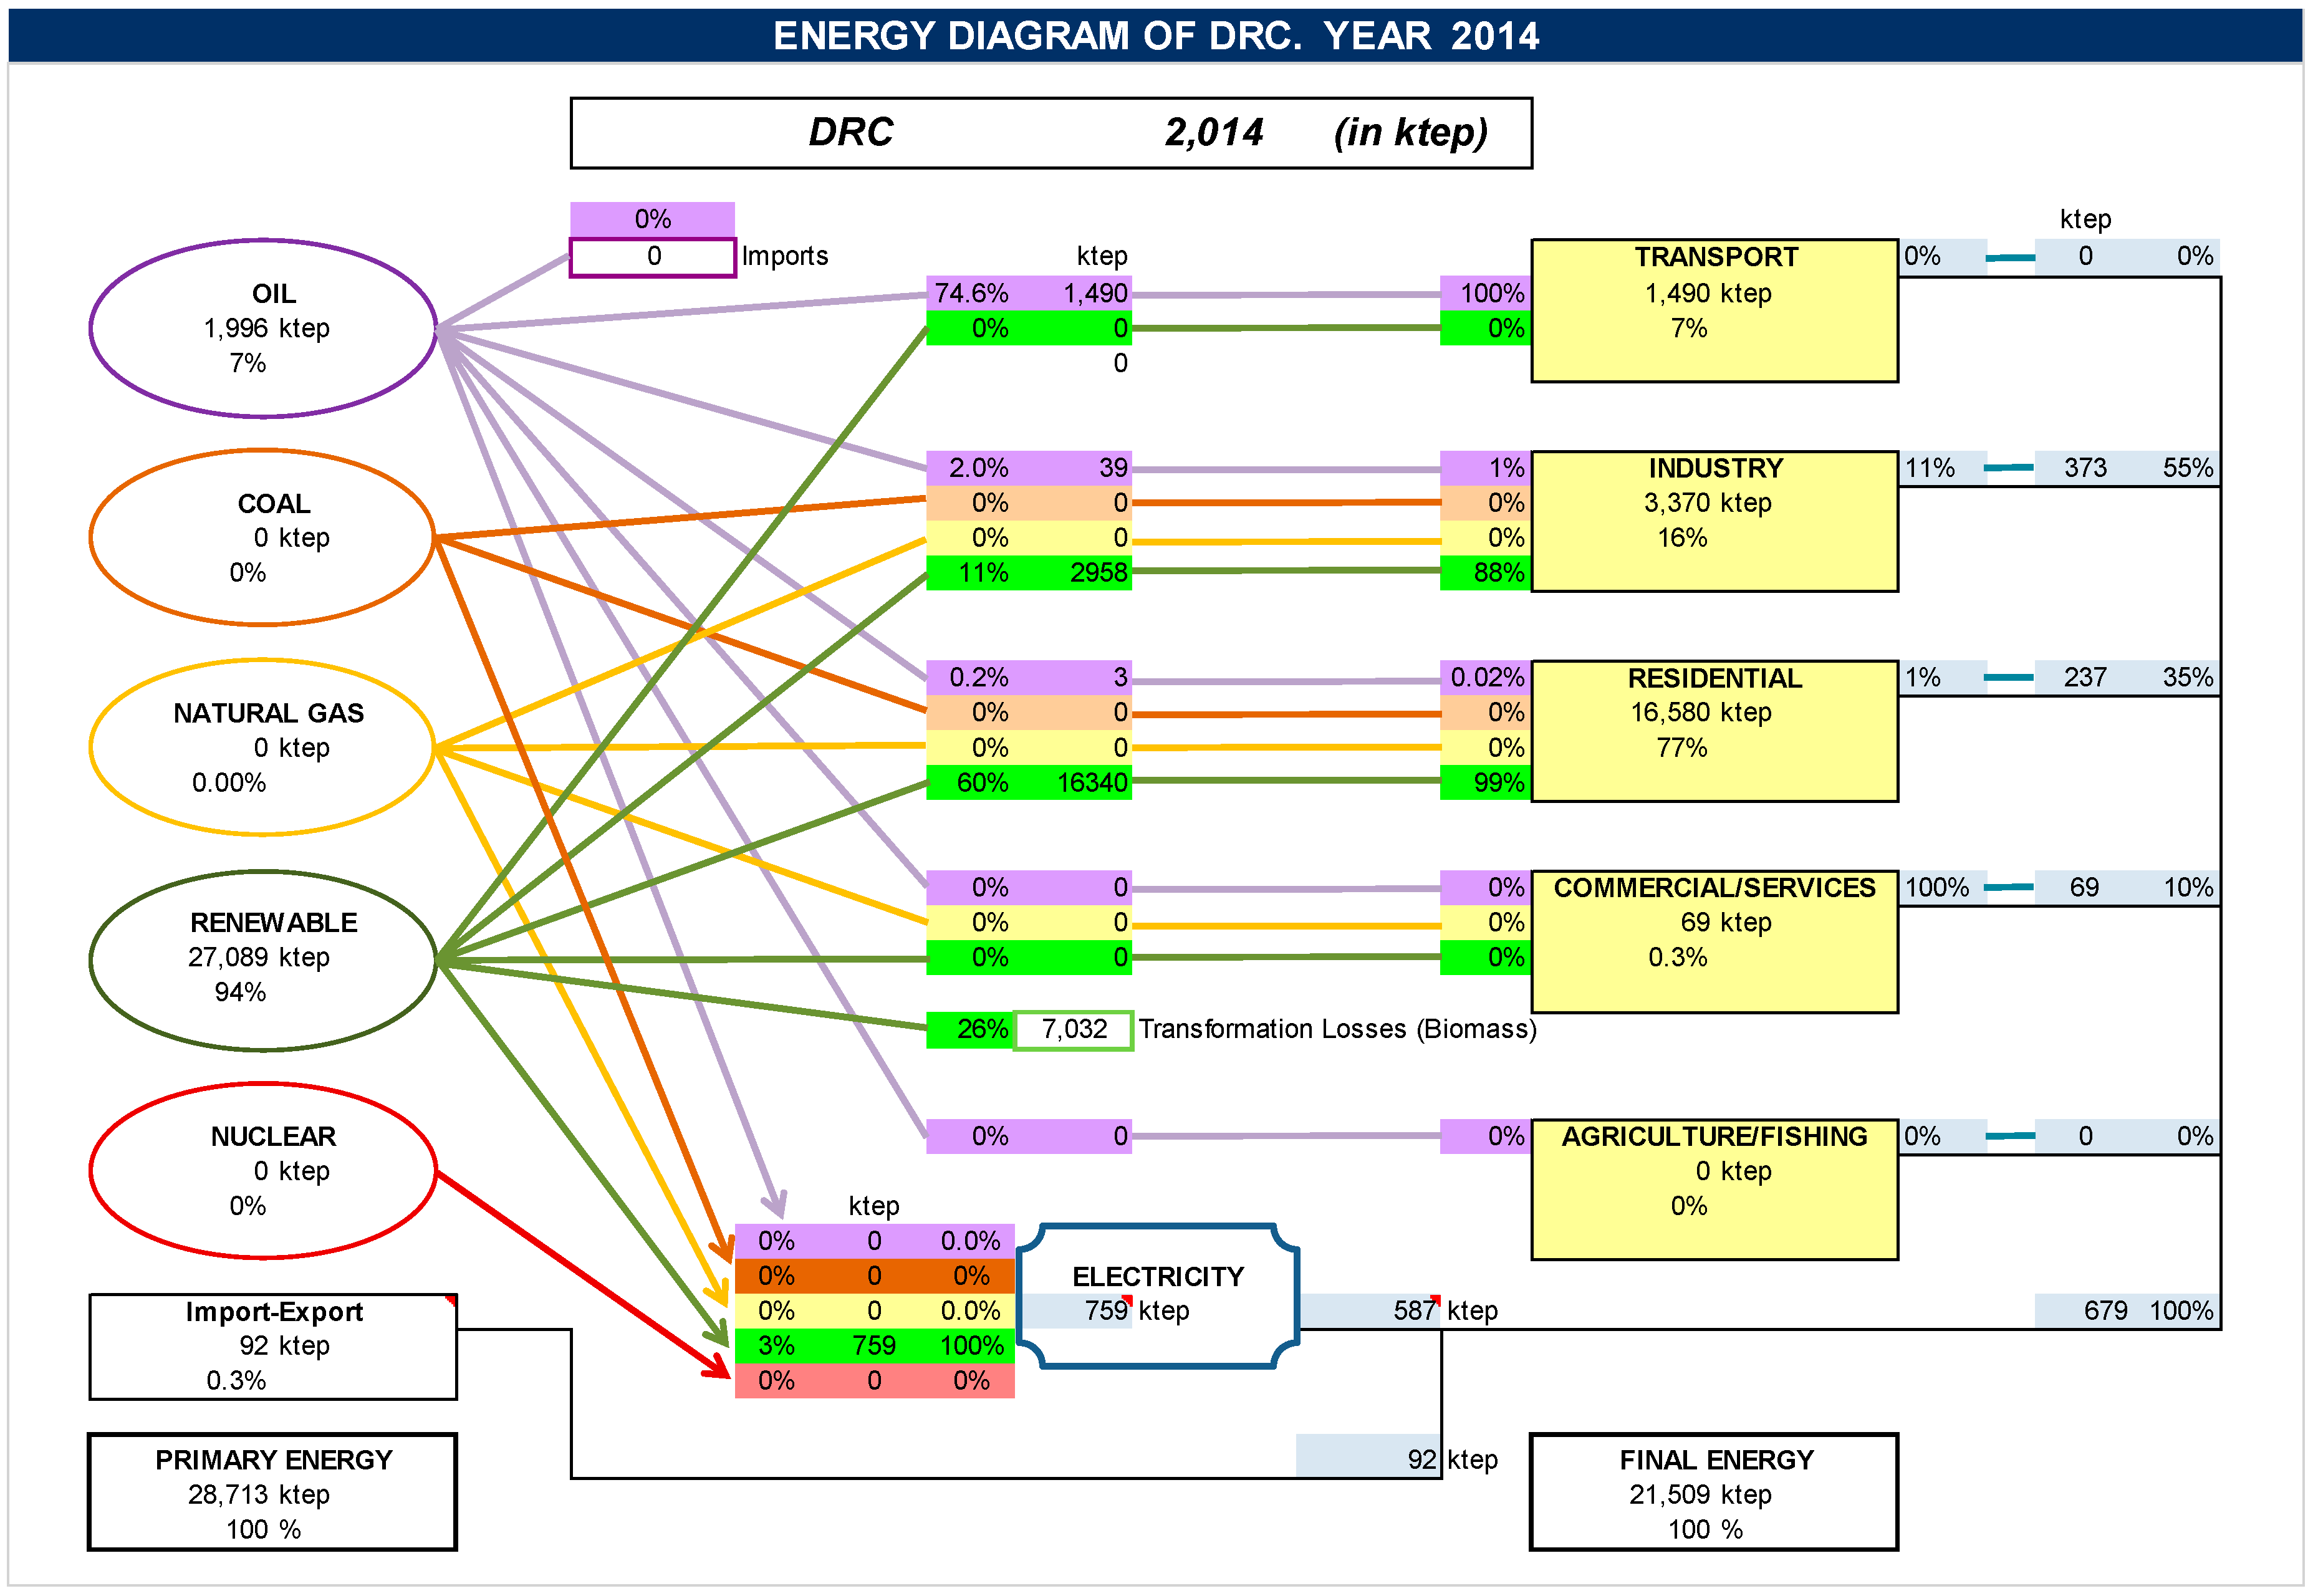
Figure 3.
Primary energy consumption and associated CO2 Emissions.

Figure 4.
Energy intensity.

Figure 5.
Exterior dependency.
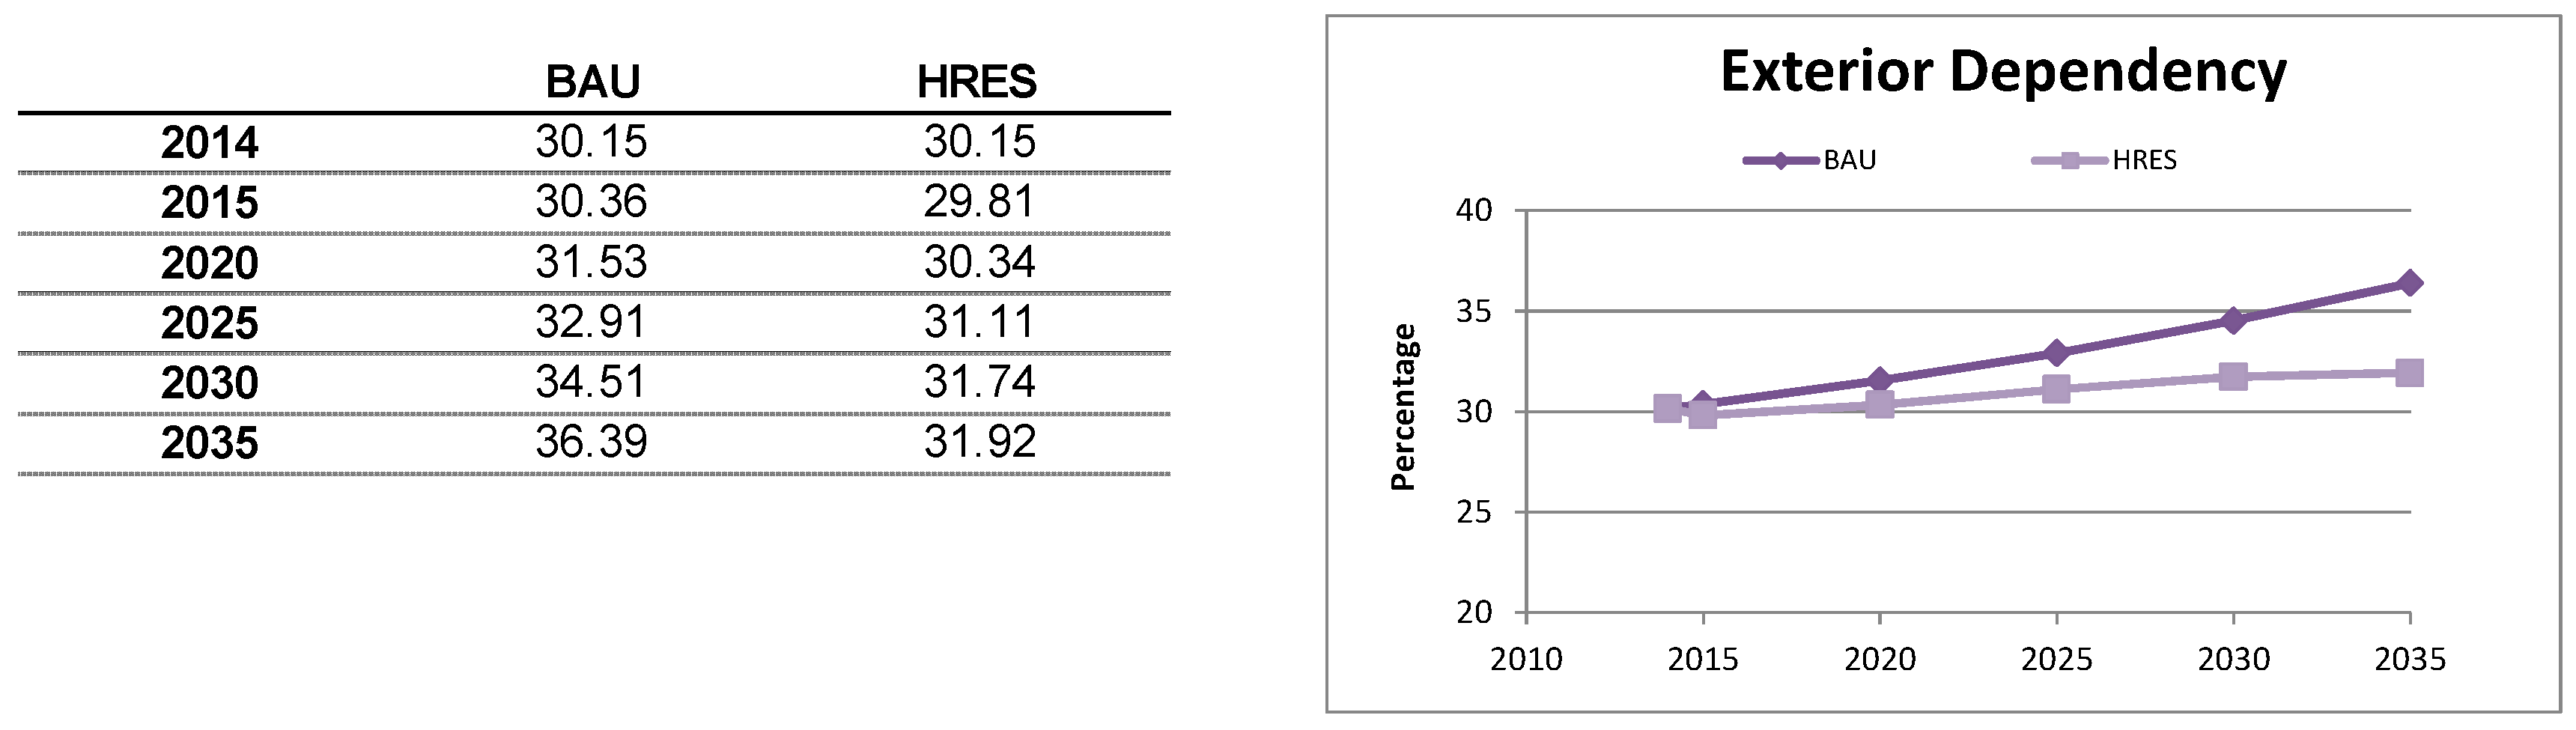
Figure 6.
Electricity.

Figure 7.
Energy demand by Sector.

Figure 8.
Energy sources.
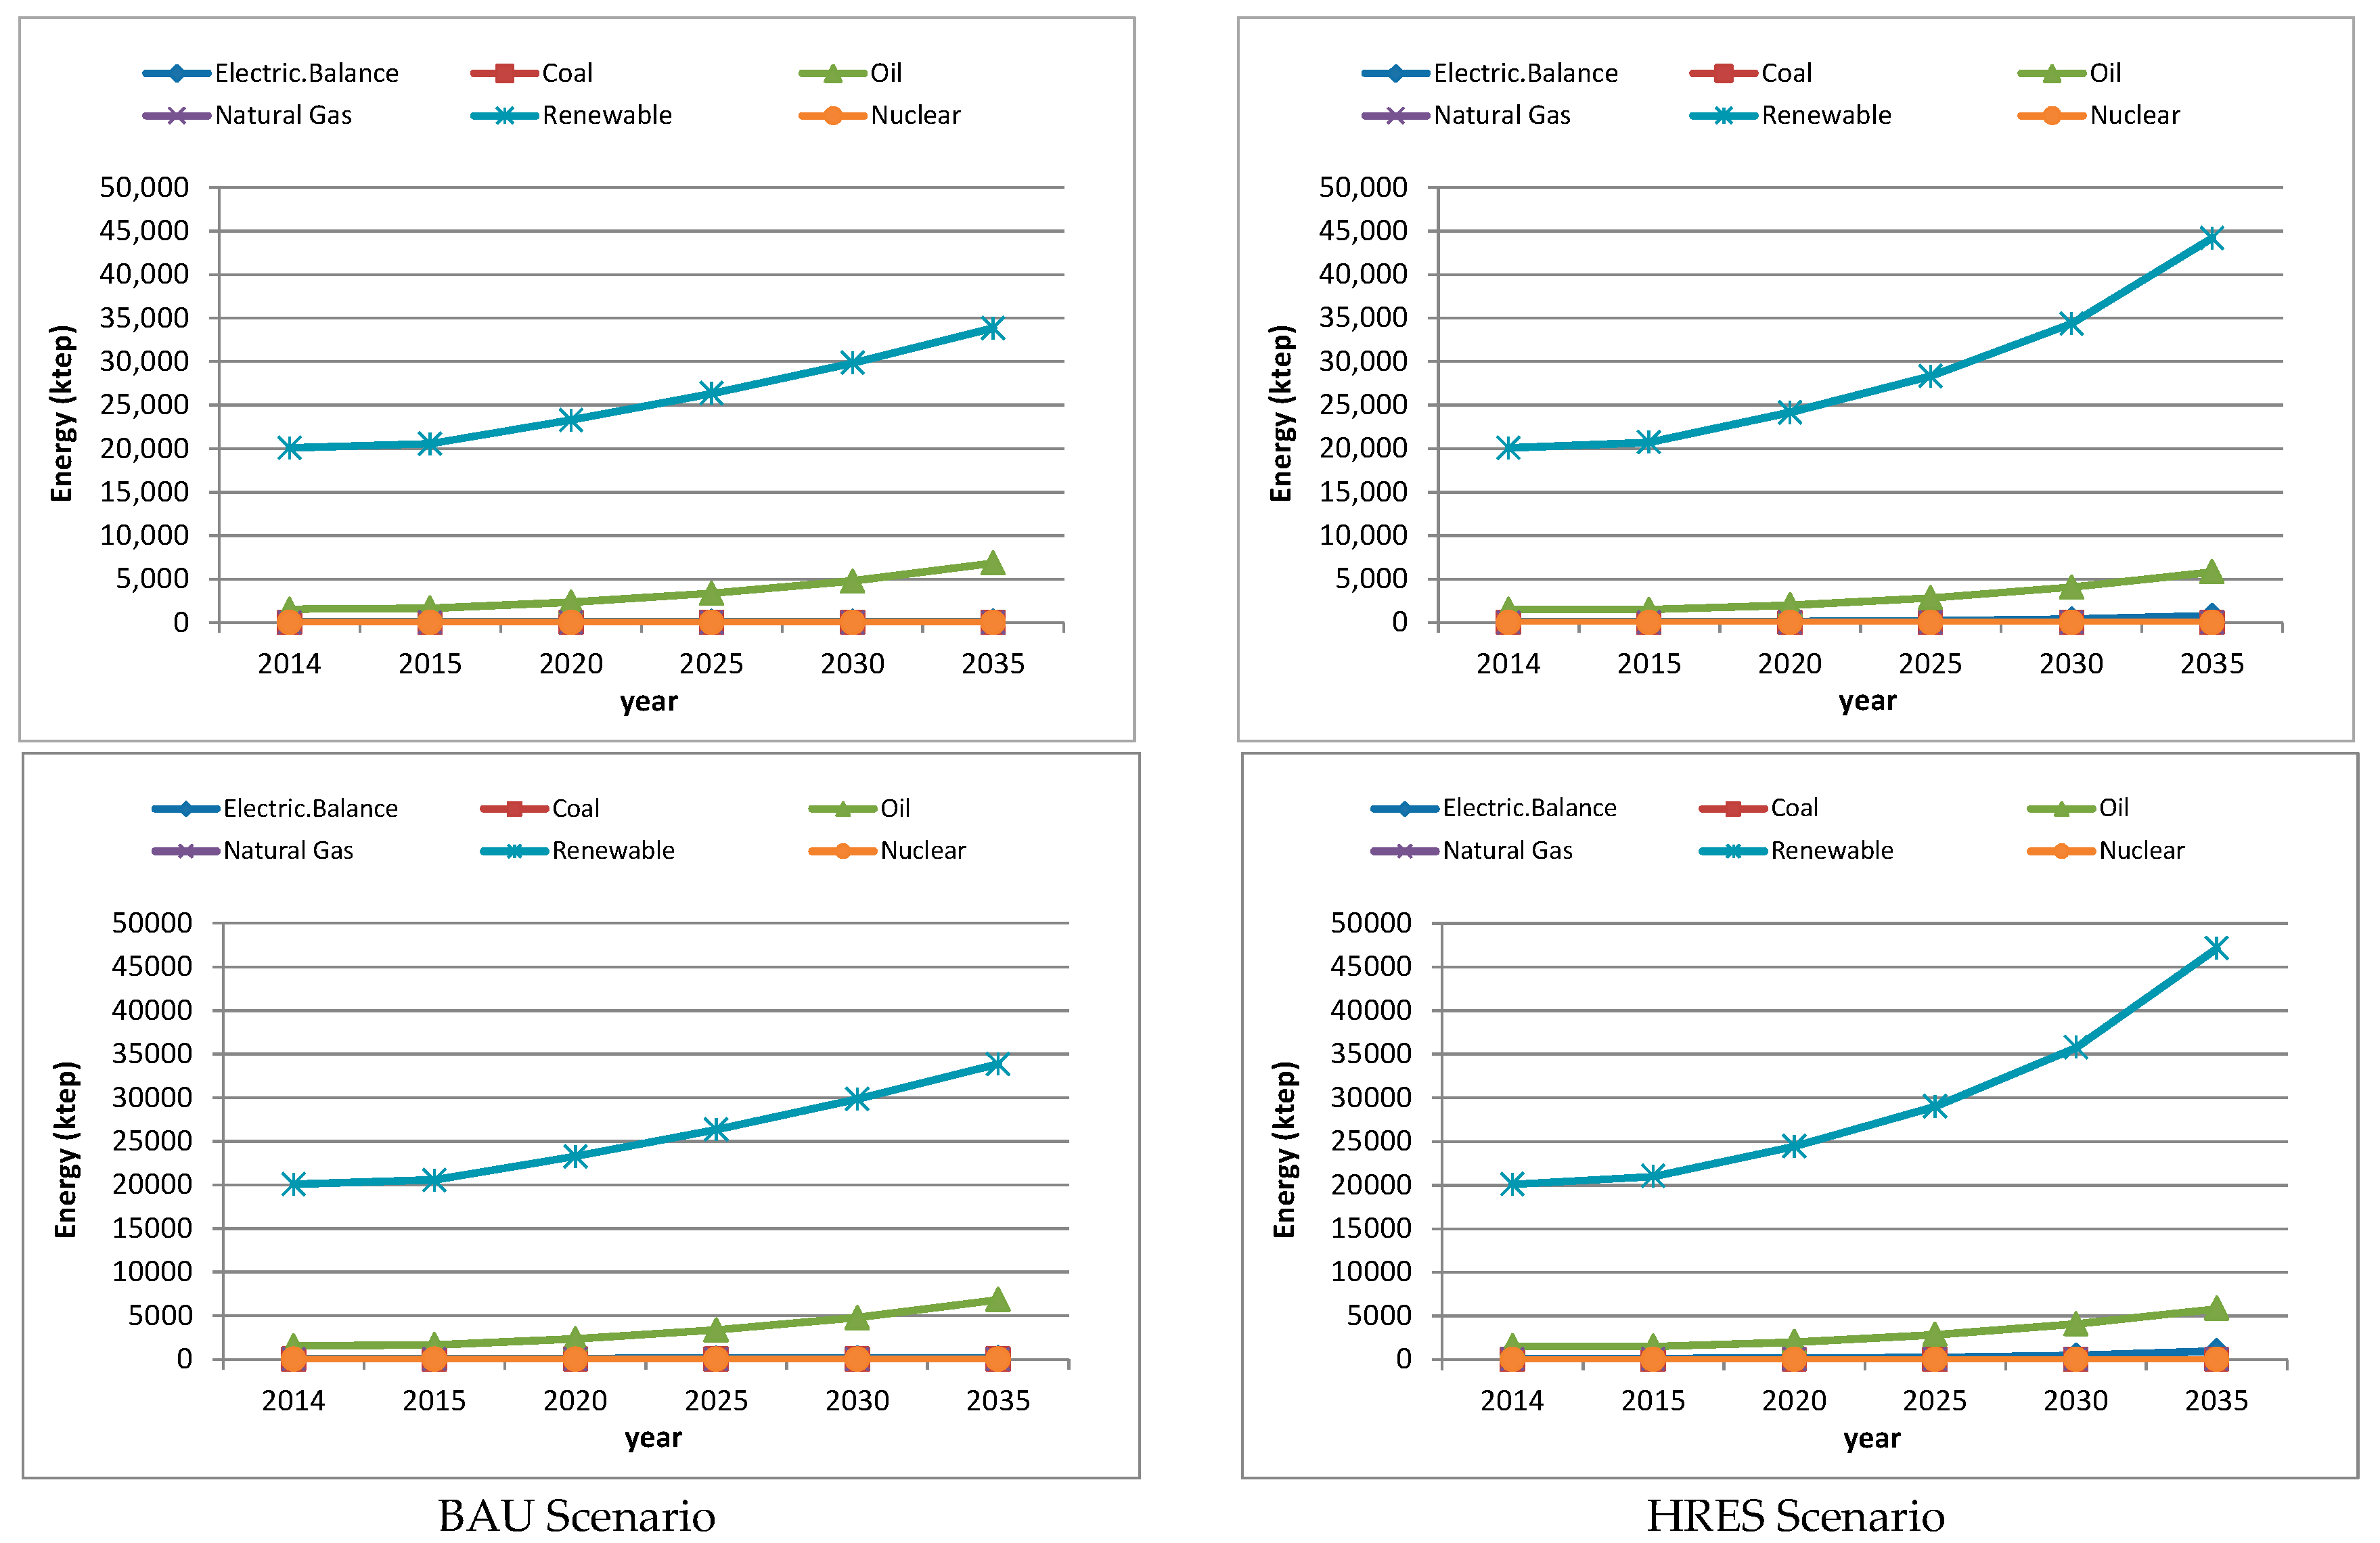
Figure 9.
CO2 Emissions per sector.


Table 1.
Variables of SIMESEN methodology.
| Variable | Definition |
|---|---|
| P(t) | Population |
| GDP(t) | Gross domestic product |
| TEP(t) | Total Primary Energy |
| EP(t) | Evolution of the primary energy demand for each source: i = 1 (coal); i = 2 (oil); i = 3 (natural gas); i = 4 (renewable); i = 5 (nuclear); i = 6 (electricity generation) |
| DA(t) | Evolution of the final energy demand from each sector: j = 1 (transport); j = 2 (industrial); j = 3 (residential); j = 4 (services); j = 5 (agricultural and fishing); j = 6 (electricity generation) |
| TDA(t) | Evolution of total final energy demand from each sector |
| TEF(t) | Evolution of total final energy consumption |
| DR(i,j,t) | Evolution of the percentage of each source of energy (i) in the demand of a particular sector (j) |
| TEM(t) | Evolution of total CO2 emissions |
| EM(i,j,t) | Evolution of the CO2 emissions due to the use of a particular source of energy (i) in a demand sector (j) |
| SEM(t) | Evolution of the total CO2 emissions from sector j |
| CEM(i,j) | Emission coefficients due to the energy (i) use in the sector (j) |
| R(j,t) | Growth rate evolution for the energy demand in the sector (j) and for the population (j = 7) and the GDP in j = 8. |
Table 2.
Growth rates for Scenarios.
| Economic Sector | Growth Rate (%) | Other | Growth Rate (%) |
|---|---|---|---|
| Industry | 1.4 | Population | 3.1 |
| Transport | 7.5 | GDPppp | 0.4 |
| Services | 0.5 | ||
| Residential | 2.7 | ||
| Agric./Fish. | 0.1 |
Table 3.
Results for Business As Usual (BAU) Scenario.
| Variables | Units | 2014 | 2015 | 2020 | 2025 | 2030 | 2035 |
|---|---|---|---|---|---|---|---|
| Population | Million | 74.9 | 77.2 | 89.9 | 104.6 | 121.8 | 141.8 |
| GDPppp | M€2010 | 52,200,000 | 52,412,599 | 53,488,650 | 54,586,794 | 55,707,483 | 56,851,180 |
| Consumption of Electricity | TWh | 7.9 | 8.0 | 8.7 | 9.5 | 10.4 | 11.3 |
| CO2 Emissions | Mt | 4.53 | 4.85 | 6.82 | 9.64 | 13.68 | 19.45 |
| Primary Energy (EP) | ktep | 28,713 | 29,520 | 33,978 | 39,265 | 45,586 | 53,214 |
| EP Generated | ktep | 20,057 | 20,558 | 23,264 | 26,344 | 29,852 | 33,848 |
| Import-Export | ktep | 92 | 94 | 102 | 111 | 121 | 132 |
| Generated Electricity | ktep | 587 | 597 | 648 | 706 | 771 | 843 |
| Exterior Dependency | % | 30.15 | 30.36 | 31.53 | 32.91 | 34.51 | 36.39 |
| GDPppp/capita | M€2010/inhab | 0.70 | 0.68 | 0.60 | 0.52 | 0.46 | 0.40 |
| TEP/capita | tep/hab | 0.383 | 0.382 | 0.378 | 0.375 | 0.374 | 0.375 |
| TEP/GDPppp | tep/M€2010 | 0.55 | 0.56 | 0.64 | 0.72 | 0.82 | 0.94 |
| Electricity/capita | kWh/inhab | 0.11 | 0.10 | 0.10 | 0.09 | 0.09 | 0.08 |
| CO2/TEP | t/tep | 0.16 | 0.16 | 0.20 | 0.25 | 0.30 | 0.37 |
| CO2/GDPppp | t/M€2010 | 0.09 | 0.09 | 0.13 | 0.18 | 0.25 | 0.34 |
| CO2/capita | t/inhab | 0.060 | 0.063 | 0.076 | 0.092 | 0.112 | 0.137 |
| Fraction ER in EP* | % | 69.9 | 69.6 | 68.5 | 67.1 | 65.5 | 63.6 |
| Fraction ER in EE* | % | 86.5 | 86.5 | 86.5 | 86.5 | 86.5 | 86.5 |
Fraction ER in EP and EE*: % of renewable energies contribution to primary energy and electrical generation.
Table 4.
Results for Hybrid Renewable Systems (HRES) Scenario.
| Variables | Units | 2014 | 2015 | 2020 | 2025 | 2030 | 2035 |
|---|---|---|---|---|---|---|---|
| Population | Million | 74.9 | 77.2 | 89.9 | 104.6 | 121.8 | 141.8 |
| GDPppp | M€2010 | 52,200,000 | 52,412,599 | 53,488,650 | 54,586,794 | 55,707,483 | 56,851,180 |
| Consumption of Electricity | TWh | 7.9 | 8.1 | 11.6 | 18.8 | 33.5 | 66.7 |
| CO2 Emissions | Mt | 4.53 | 4.40 | 5.94 | 8.53 | 12.37 | 18.22 |
| Primary Energy (EP) | ktep | 28,713 | 29,524 | 34,675 | 41,107 | 50,315 | 64,915 |
| EP Generated | ktep | 20,057 | 20,721 | 24,156 | 28,320 | 34,347 | 44,195 |
| Import-Export | ktep | 92 | 94 | 136 | 219 | 390 | 778 |
| Generated Electricity | ktep | 587 | 600 | 865 | 1,400 | 2,488 | 4,961 |
| Exterior Dependency | % | 30.15 | 29.81 | 30.34 | 31.11 | 31.74 | 31.92 |
| GDPppp/capita | M€2010/inhab | 0.70 | 0.68 | 0.60 | 0.52 | 0.46 | 0.40 |
| TEP/capita | tep/hab | 0.383 | 0.382 | 0.386 | 0.393 | 0.413 | 0.458 |
| TEP/GDPppp | tep/M€2010 | 0.55 | 0.56 | 0.65 | 0.75 | 0.90 | 1.14 |
| Electricity/capita | kWh/inhab | 0.11 | 0.10 | 0.13 | 0.18 | 0.27 | 0.47 |
| CO2/TEP | t/tep | 0.16 | 0.15 | 0.17 | 0.21 | 0.25 | 0.28 |
| CO2/GDPppp | t/M€2010 | 0.09 | 0.08 | 0.11 | 0.16 | 0.22 | 0.32 |
| CO2/capita | t/inhab | 0.060 | 0.057 | 0.066 | 0.082 | 0.102 | 0.128 |
| Fraction ER in EP* | % | 69.9 | 70.2 | 69.7 | 68.9 | 68.3 | 68.1 |
| Fraction ER in EE* | % | 86.5 | 86.5 | 86.5 | 86.5 | 86.5 | 86.5 |
© 2017 by the authors. Licensee MDPI, Basel, Switzerland. This article is an open access article distributed under the terms and conditions of the Creative Commons Attribution (CC BY) license (http://creativecommons.org/licenses/by/4.0/).
Share and Cite
MDPI and ACS Style
Peñalvo-López, E.; Cárcel-Carrasco, F.J.; Devece, C.; Morcillo, A.I. A Methodology for Analysing Sustainability in Energy Scenarios. Sustainability 2017, 9, 1590. https://doi.org/10.3390/su9091590
AMA Style
Peñalvo-López E, Cárcel-Carrasco FJ, Devece C, Morcillo AI. A Methodology for Analysing Sustainability in Energy Scenarios. Sustainability. 2017; 9(9):1590. https://doi.org/10.3390/su9091590
Chicago/Turabian StylePeñalvo-López, Elisa, Francisco Javier Cárcel-Carrasco, Carlos Devece, and Ana Isolda Morcillo. 2017. "A Methodology for Analysing Sustainability in Energy Scenarios" Sustainability 9, no. 9: 1590. https://doi.org/10.3390/su9091590
Note that from the first issue of 2016, this journal uses article numbers instead of page numbers. See further details here.