Seeing the Immaterial: A New Instrument for Evaluating Integrated Management Systems’ Maturity


Department of Design Engineering and Robotics, Technical University of Cluj-Napoca, 103-105 Muncii Blvd., 400641 Cluj-Napoca, Romania
*
Author to whom correspondence should be addressed.
Sustainability 2017, 9(9), 1643; https://doi.org/10.3390/su9091643
Submission received: 28 July 2017
/
Revised: 2 September 2017
/
Accepted: 12 September 2017
/
Published: 18 September 2017
(This article belongs to the Section Economic and Business Aspects of Sustainability)
Abstract
:Integrated management systems (IMSs) can already be considered a proven tool to help companies cope with the challenges associated with staying competitive in the face of dynamic stakeholder requirements. The present paper proposes a new instrument designed to evaluate and communicate the maturity achieved by an integrated management system (IMS) for responding properly to the requirements of its reference standards in a consolidated manner. The approach mainly aims to highlight the level of integration achieved on common requirements of the component standards and to determine the extent to which they work together as a whole. At the same time, it is useful to identify the needs for improvement in the system as a whole or in its sub-systems. The proposed methodology uses the transmutation in the RGB color space (red–green–blue) of the process audits’ results achieved under each standard, followed by the analysis of the IMS characteristics, with tools specific to the color space, based on the affinities between the two domains. To sustain the thoroughness of this approach, a case study of an integrated system for an industrial company is presented, analyzing the situation from two different evolution stages of the IMS. The approach is presented as a proof-of-concept, without large scale validation.
1. Introduction
Behaving sustainably and being part of a long-term and viable economic model are challenges that any modern company faces. Management systems, which have developed over more than 30 years to address various issues that faced firms and influenced their competitiveness, can contribute significantly to the sustainability performances of any industry, especially if employed in a consistent and efficient manner. The growing number of standards in this field determines companies to seek either external help in the form of consultancy or quick and powerful instruments, they can use themselves in order to master their implementation and upkeep.
Starting more than a quarter-century ago with the ISO 9000 series of standards [1], which guide organizations towards customer satisfaction, with ISO 14001 [2], which extended company concerns to the responsibility towards the environment, and with OHSAS 18001 [3] towards health and safety of its personnel, standardized management systems have become increasingly popular in contemporary society and in the economy due to their undeniable benefits. The International Organization for Standardization (ISO) has highlighted, in a relevant number of case studies [4], how the use of standards in general, and especially managerial standards, brings value both to the organizations employing them and to the world economy. ISO’s annual statistics for 2014 and 2015 have identified an average of 1.3 million certifications only for the quality and environmental management standards [5]. Encapsulating expert experience and feedback in their content and method of operation and benefiting from an upgrading system that ensures their periodical adaptation to a constantly changing world, the managerial standards are strategic tools for both larger companies and small businesses, having a positive impact on products, processes, organizations, and sustainable economic development.
The success of the already mentioned standards has led to the addition of similar approaches, but specific to different fields of interest for businesses. Standards such as those related to information security (ISO 27001) [6], social responsibility (ISO 26000) [7], or domain-specific standards (TS 16949) [8] in the automotive industry, Good Manufacturing Practice (GMP in the pharmaceutical industry, ISO 22000 for the food industry, etc.) [9] have been developed.
Since the publication of the second management standard, ISO 14001 [2], following ISO 9001 [10], the topic of their compatibility and coexistence in a single integrated system has been raised. Currently, the list of ISO management standards [11] contains more than 30 documents addressing such topics as quality, security, general management, health, environment and energy, industry, services, and information technology. It is obvious that, in any organization that is able to implement more than one of the mentioned standards, the main issue is to integrate them into a single management system (MS) that is expected to perform effectively, both as a whole and for each component, under the conditions of optimized resource consumption.
Standardized management systems’ integration raises challenges for all stakeholders. These challenges are faced specifically by ISO and national organizations for standardization, by certification and consulting organizations, by beneficiary organizations together with their customers, and by suppliers and cover a wide range—from conceptual and structural compatibility and guidance for unitary application and up to matters pertaining to their concrete application in organizations at different levels: policy, planning, implementation, documentation, communication evaluation, auditing, certification, and tools that support the operationalization of all of them. For the purposes of this paper, the notion of maturity of integration is conceptualized as the measure of the internal harmony of the IMS, reflected into its outside impact, by addressing two main questions: How effective is the IMS in achieving its objectives and those of its sub-systems? And how much interference exists among its sub-systems?
This paper proposes an innovative management tool, built on the principles of the RGB system for combining colors, that can be used by the organization’s management for IMS evaluation, highlighting its compliance with the reference standards and the level of integration of the system, which is called maturity in this approach.
2. The Review of the Scientific Literature
The current section intends to present a structured picture of the previous relevant research carried out in two areas at the intersection of which this paper intends to place its contributions: integrated management systems (IMSs) and maturity approaches and models in organizations’ management. In the first, exploratory phase, the analysis was focused on relatively recent publications undertaking comprehensive reviews on the mentioned domains, aiming at the identification of the main components (topics) of their actual conceptual frameworks. Among these recent publications with a comprehensive coverage of the knowledge for the IMS field, References [12,13,14,15] are mentioned here, and Maturity Models (MMs) [16,17], to which a publication can be added [18], are listed as a common reference for both domains. The examination of the mentioned publications allowed for the structuring of the literature review in the two domains and the formulation of the questions to which this paper should answer.
For the IMS field, the main topics identified were definition, components, benefits, implementation strategies and models, audit/assessment, and integration levels. Regarding MMs, the main subjects of discussion were the definition of maturity and MM, maturity factors in organizations, types of MMs and their purpose, MM building and usage, assessment, and presentation/visualization of results. The results of the survey are presented in Table 1, Sections A and B.
Some conclusions resulting from the bibliographical analysis on IMSs and MMs are discussed in the following. Both fields of knowledge are conceptually structured and mature, even showcasing standardized/normalized approaches and terminology in their nucleus (MS standards and PAS 99 in IMSs case and, respectively, ISO/IEC 33004, replacing ISO/IEC 15504 for IT processes MM). In such a context, clearness, consistency, and stability concerning the associated topics are typically expected. Despite this mentioned “maturity”, both domains are research-emergent, enjoying knowledge developments (papers, reports, and web documents reflecting new conceptual or applicative researches) that are remarkable in terms of quantity, timeliness, and relevance.
As in any emergent knowledge space, new approaches bring forth disputes, contradictions, and a lack of clarity. On the other hand, as a positive element, it is worth mentioning that the efforts to establish typologies in these fields did not limit their innovative potential, e.g., despite the attempts to establish a design framework for MM (principles, requirements, steps), a variety of new developments in this matter have been issued, whereas, concerning IMSs, implementation (procedures, methods, and tools) and integration (strategies and levels) are both still novel topics.
The review also highlights certain aspects relevant for the research presented in this paper. First, there is a scarcity of developments at the intersection of the herein discussed domains (only one group of authors has been identified, proposing, in several papers, an MM dedicated to IMS). Secondly, even if the potential connection between the levels of integration and an IMS maturity levels has been mentioned, this subject has not enjoyed the deserved attention since adequate tools have not been developed. Last but not least, neither in the IMS field nor in the MM domain have attempts to innovatively present/visualize results related to levels of conformance, integration, or maturity been identified.
3. Research Methodology
This paper aims to explore the elusive but important issue of determining the extent to which components of an IMS are able to go beyond the individual functional parts and develop synergy and emergence, properties specific for a complex adaptive system, as mentioned in Reference [43]. If this status is achieved, the IMS can act as a whole, able to facilitate an organization’s interaction with an increasing number of stakeholders. The objectives and tasks of the current undertaking include the following:
- identification and quantification of an IMS property, which we propose to call, by similarity with other concepts in the field of standardized systems, integration maturity or the integration level;
- easy communication of the results of an IMS integration maturity assessment in order to provide valuable information for organizational decisions related to performance and the allocation of resources;
- establishment and validation of a procedure for an IMS management tool based on the above approach, with possible IT automation support.
The research methodology proposed for this paper has two main components: the development of an algorithm for the evaluation and visualization of the integration maturity within IMSs and, respectively, the testing of this methodology within a company. The case study provides a form of validation of the tool and highlights its features. The proposed algorithm starts from the stages put forward by the authors in a previous paper [44]:
- (1)
- The identification and documentation of all business processes within the IMS;
- (2)
- The correlation of a list of processes with the requirements of each standard used by the systems included in the IMS (the process–requirement matrix);
- (3)
- The determination of the level of maturity [mij] for each intersection of the process [i] and requirement [j] (defined as the overall operational effectiveness minus the impact of the possible redundancies and conflicts) by performing process audits using a percentage-based scale, which is then numerically converted to color gradients of the three fundamental colors;
- (4)
- The repetition of the previous step for all three components of the IMS, using processes within the firm for rows and the ISO correlation tables for columns (we note that this analysis may include those requirements for which the correspondence is, or can be, clarified based on the standards;
- (5)
- The performance of three layers of analysis observing the following correspondence:
- a quality management system—QMS—where the maturity degree is associated with intensity levels of the fundamental color red (R);
- environmental management systems—EMS—where the maturity degree is associated with intensity levels of the fundamental color green (G);
- an occupational health and safety management system—OHSMS—where the maturity degree is associated with intensity levels of the fundamental color blue (B).
This correspondence could be applied for any IMS with three components. Additional sub-systems to be included in the IMSs could be modeled using more complex color spaces that contain more than one RGB spaces in an imbricated manner, with additional codification based on other characteristics such as hue, chroma, saturation, and luminance. However, the mathematical model becomes very complex and most integrated systems are covered under the RGB model, so this approach is outside the purpose of the paper.
- (6)
- The color map for the IMS is obtained, each process–requirement intersection being represented by a colored square-shaped element. The integration maturity level is thus represented in the RGB color space, with the white color representing the maximum maturity and black representing the minimum maturity. The combination is performed to obtain an overall image with two-way correspondence regarding IMS maturity, both from a managerial and a chromatic point of view, assuming a similar behavior of color mixing and MS mixing, due to their complexity and homogeneity.
- (7)
- The color map is analyzed with specific image processing tools, such as Fourier Fast Transformation (FFT) or the RGB histogram, by transferring colors in the frequency analysis domain.
- (8)
- The results of the color map processing are interpreted from a managerial perspective and scenarios for improving the IMS or its components are elaborated.
4. Results and Discussion
To validate the proposed concept, a case study was planned, consisting of an analysis of the integrated quality-environment system in a production company. The authors turned their attention to a simple system with only two components in order to facilitate understanding of the concept, without overloading the presentation from a mathematical and graphical point of view. We note that the QMS has a greater age, being considered functional and mature by the organization due to two surveillance audits already passed, and that this study captures the moment when environmental system was added and the “birth” of the integrated system. The references used in the company were ISO 9001:2008 [10] and ISO 14001:2004 [2], but the methodology is adaptable to the more recent versions of those standards or to the incorporation of different standards. The analysis takes place the same way for two or three components, as the colors in the RGB space are unique, and having one channel always 0 (due to the OHSMS being absent) will not determine results that overlap with the situation in which all three-color channels are non-null. Conversely, the final analysis uses graphical instruments to study channel synchronicity and content, and is thus able to analyze two-component and three-component systems without confusion. One must note that the color channels codify the maturity in their dynamics and not in their absolute value, so an IMS with two sub-systems could be more maturely integrated than one with three sub-systems.
Two different moments from the life cycle of the system were chosen: the initial certification (in fact, recertification of the quality system and the integration of the environmental system to complete it) and the first surveillance of the IMS conducted after one year. In this way, the opportunity to test the proposed algorithm dynamically was obtained, benefitting from the advantage of a smaller number of variables in motion, the QMS already being stable. The two primary colors used are red and green, with high integration chromatically inclined towards yellow–gold and low integration inclined towards black, because the blue color, associated with occupational health and safety, is missing in this case and is included in all performed calculations and operations with a 0 value, which brings it closer to the black area of the palette.
The process–requirement matrix, containing 9 processes and 14 integrated requirements, from the most relevant ones, was developed for the two phases, respectively, for the two standards, following the internal audit process, using a rating scale for maturity in percentages, which was then converted to levels of the color scale from 0 to 255 in the so-called 24-bit RGB space (see [45] for more information on color spaces), in order to facilitate the processing of the image and the concept demonstration. For practical applications in the economic environment, it is recommended that simpler color spaces with less color levels on each channel, such as 6-bit or 12-bit RGB, are used. These could be assessed directly by the audit team on scales with 4 or 16 levels, without the need to perform additional transformations. The achieved resolution of the assessment would be lower due to the lower granularity of the inputs, but the processing of data could be done practically in real time.
The four matrices obtained during the analysis for the case study are presented in the tables below (Table 2, Table 3, Table 4 and Table 5). The data has been collected using process audits performed by the authors who are experienced management system specialists and the results have been first expressed by them, based on consensus, on the intuitive 0–100% scale. The conversion from percentages into the numerical scale has been performed by rounding to the nearest integer.
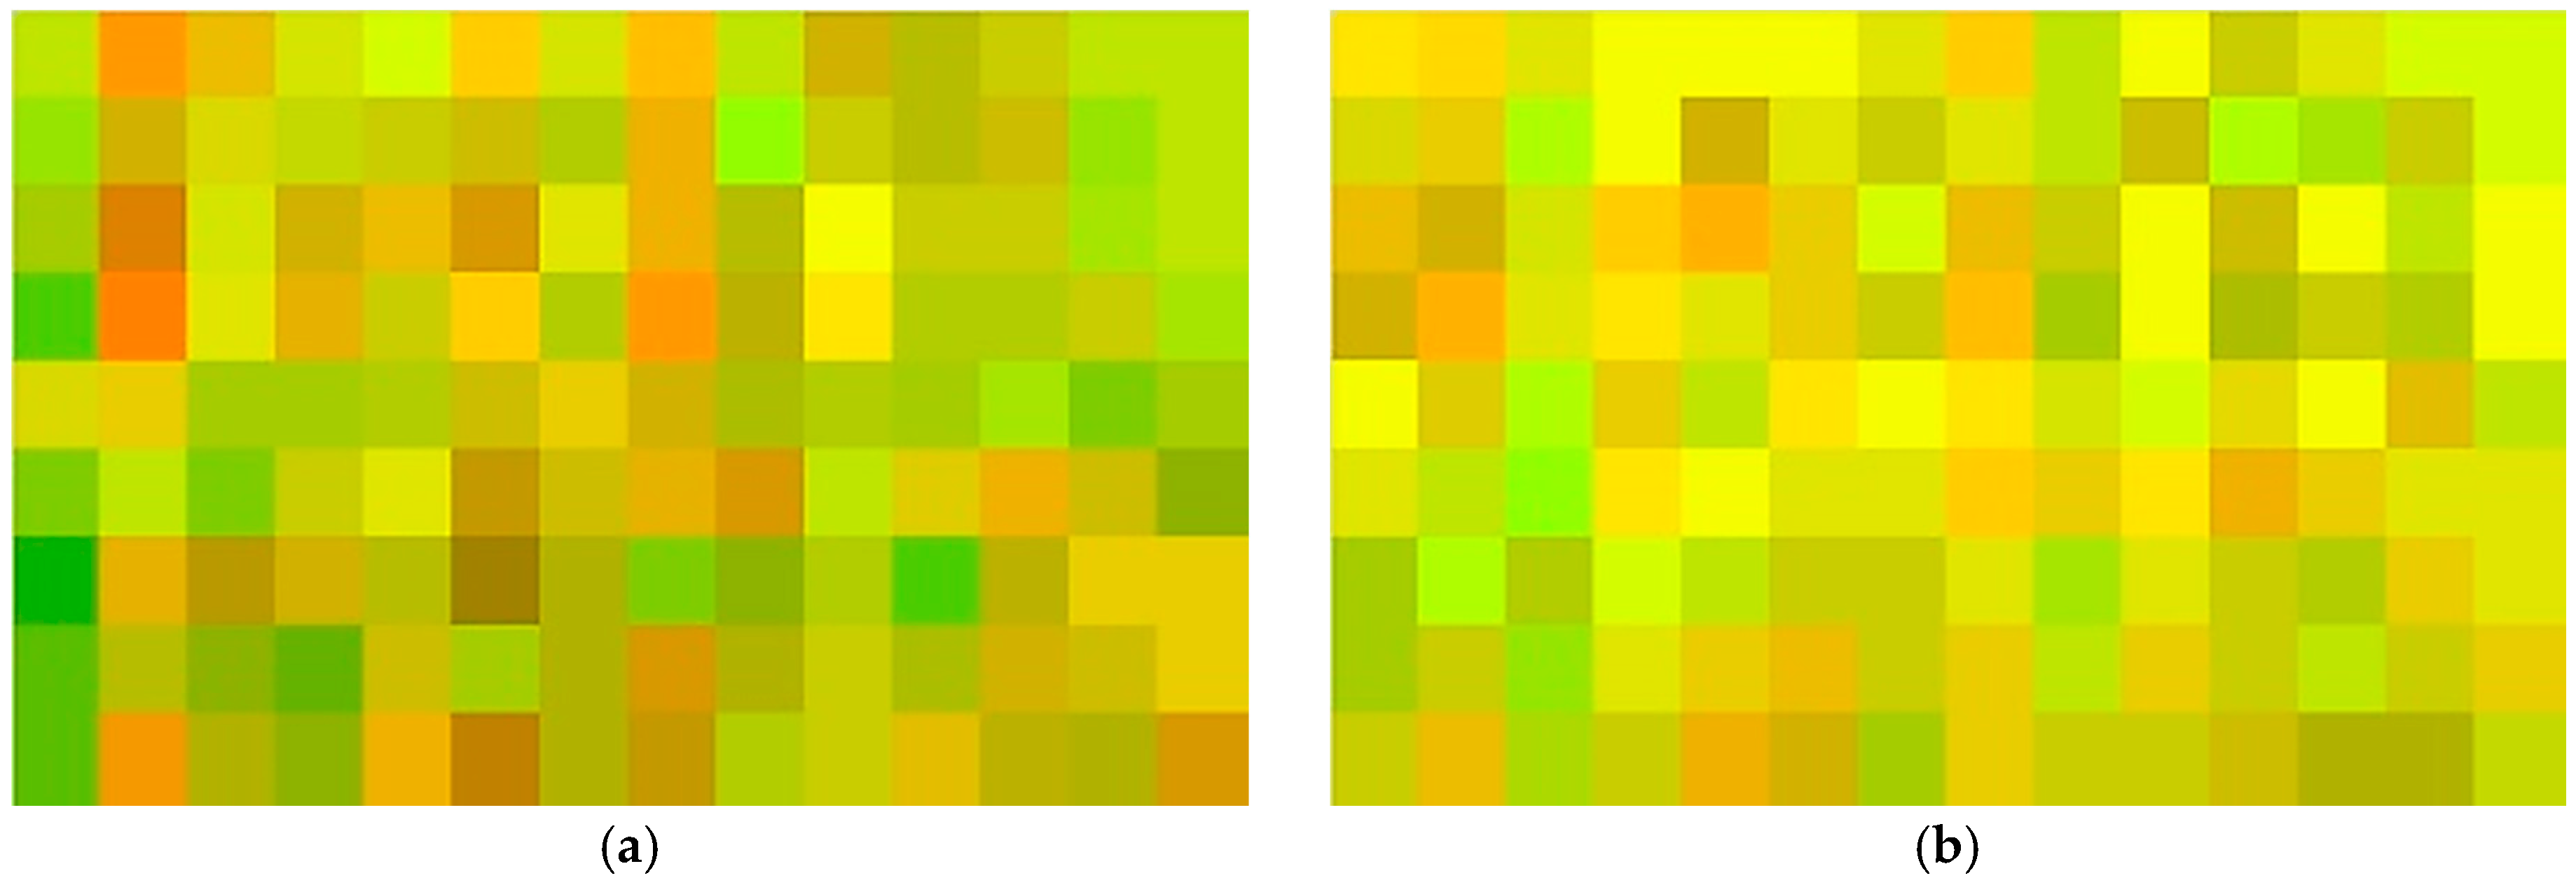
These matrices have been processed using the Microsoft Office package, namely the spreadsheet program Microsoft Excel, which allowed also for the inclusion of Visual Basic scripts to transform the matrices into unique RGB images made up of square elements with a 4-pixel side, using the procedure described on the web page [46] and the program help. The combination of the two systems will place the results of the analysis in the yellow–gold area. The two RGB color maps generated have the following aspect (Figure 1).
These two composed images were then imported and analyzed with the help of specific image processing functions within the programming environment MathWorks MATLAB [47]. For convenience in implementation, any other image processing software with similar functions (i.e., capable of color channel analyses) would be adequate for use. The output data of the investigations performed upon the composite RGB images, which are representative for the IMS, have then been interpreted in the context of standardized management systems, based on the experience of the authors, and the results presented in Figure 2 were obtained.
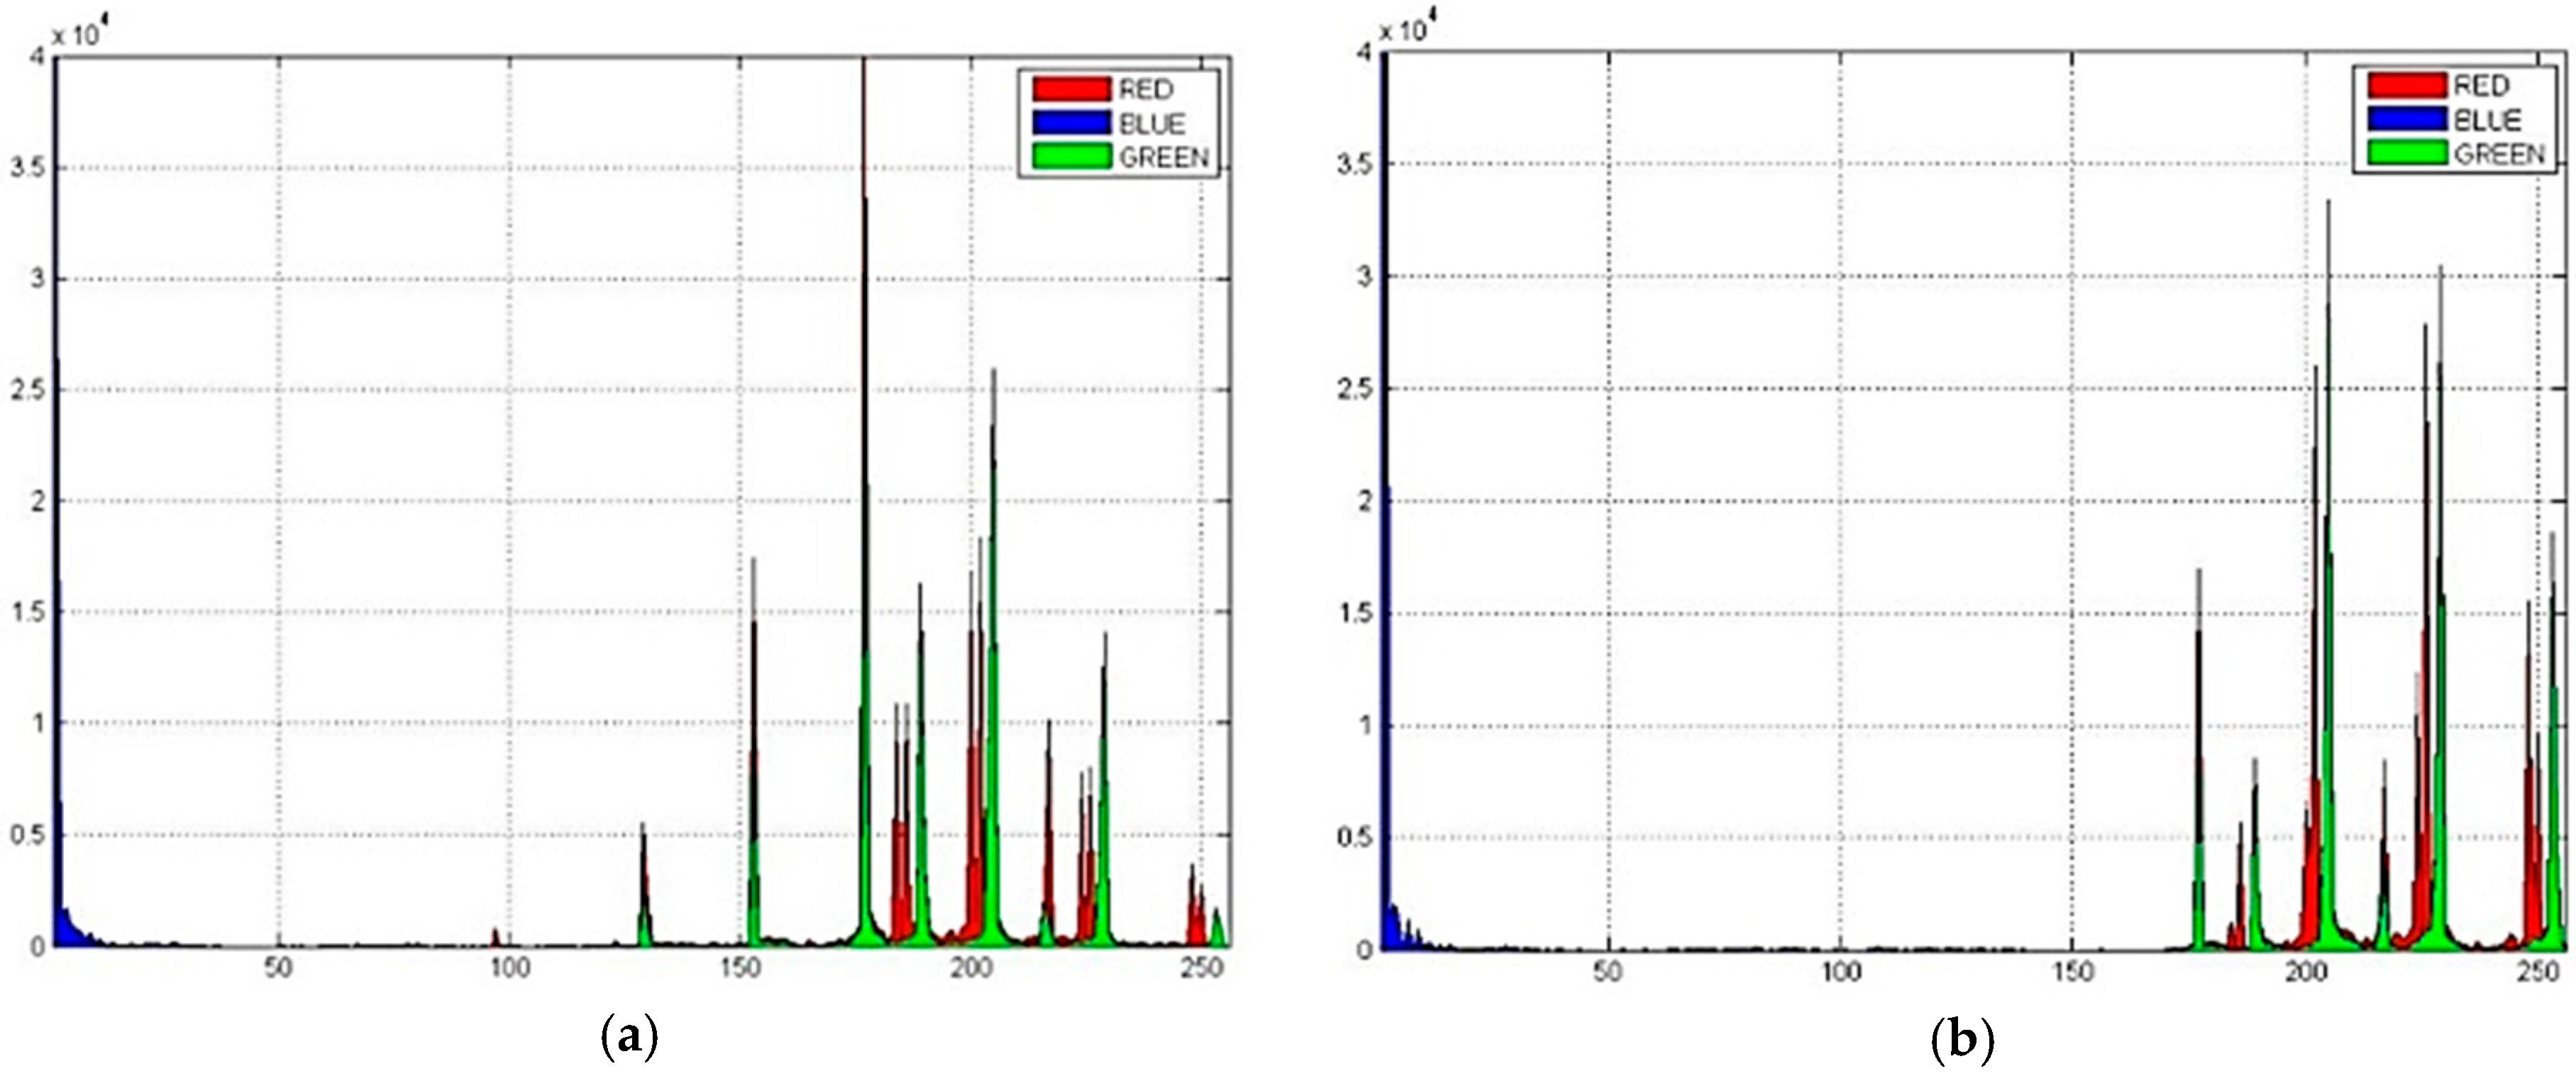
We must note that these results should not be interpreted quantitatively but qualitatively, because the size of the images depends on user selections. Therefore, the shape, distribution, and relationships within diagrams are bearing the message for the specialist in IMS and not the numeric values or the measurement units used in the image domain. In the histogram of RGB channels, both graphics presented realize the decomposition of the image in the component colors, providing a particularly useful insight into how integrated systems evolve after integration. A trained engineer or scientist would be interested in the mathematical model that describes the variability of the processes or the predicted evolution of the systems (see the discussion below), but the visual impact of the instrument also allows managers to make sensible business decisions to support the sustainability of companies built around the IMS. By visually assessing the relative maximum and minimum of the color channels, as well as their position, dynamic business leaders can decide which process group requires action or resources in order to become more effective or to become better integrated within the process network of the company.
The charts are drawn in the space by the no. of pixels–shades of color (hues). Thus, the blue channel is close to the value 0 as intensity, and any requirements associated with it can be met only through replacement from the other two systems. It was left as part of the analysis to showcase its full range of possibilities and because it does not influence the behavior of the other two channels. Regarding the QMS and EMS, they appear grouped by categories of processes, presenting a similar behavior, but there are also a significant number of differences that allow for the interpretation of the charts both from the point of view of the case study itself and from the point of view of the proposed methodology validation. Thus, the parallel evolution of the two systems can be easily seen, and primary hypotheses concerning the interpretation in the managerial space of the chromatic aspects can be put forth:
- Both channel histograms move to the right of the horizontal scale, indicating the maturation of the individual components (i.e., they are more effective and impactful in performing the function ascribed to them by the reference standards’ requirements), as the number of points of greater color intensity is increasing.
- Moreover, the growth in the second diagram is more strongly correlated between the two basic colors (red and green), indicating that the two systems begin to develop in common (i.e., they support each other in achieving objectives and operating effectively).
- The shape of the histogram is improved, more closely approaching a normal distribution (the color combinations are found within a narrower interval, indicating greater internal cohesion and a better balance within the integrated system).
- The histogram for the green color presents increases and movements more significant than the one for red, specific for a management system at the beginning of its improvement cycle (in this case the EMS), when variations are larger and more random.
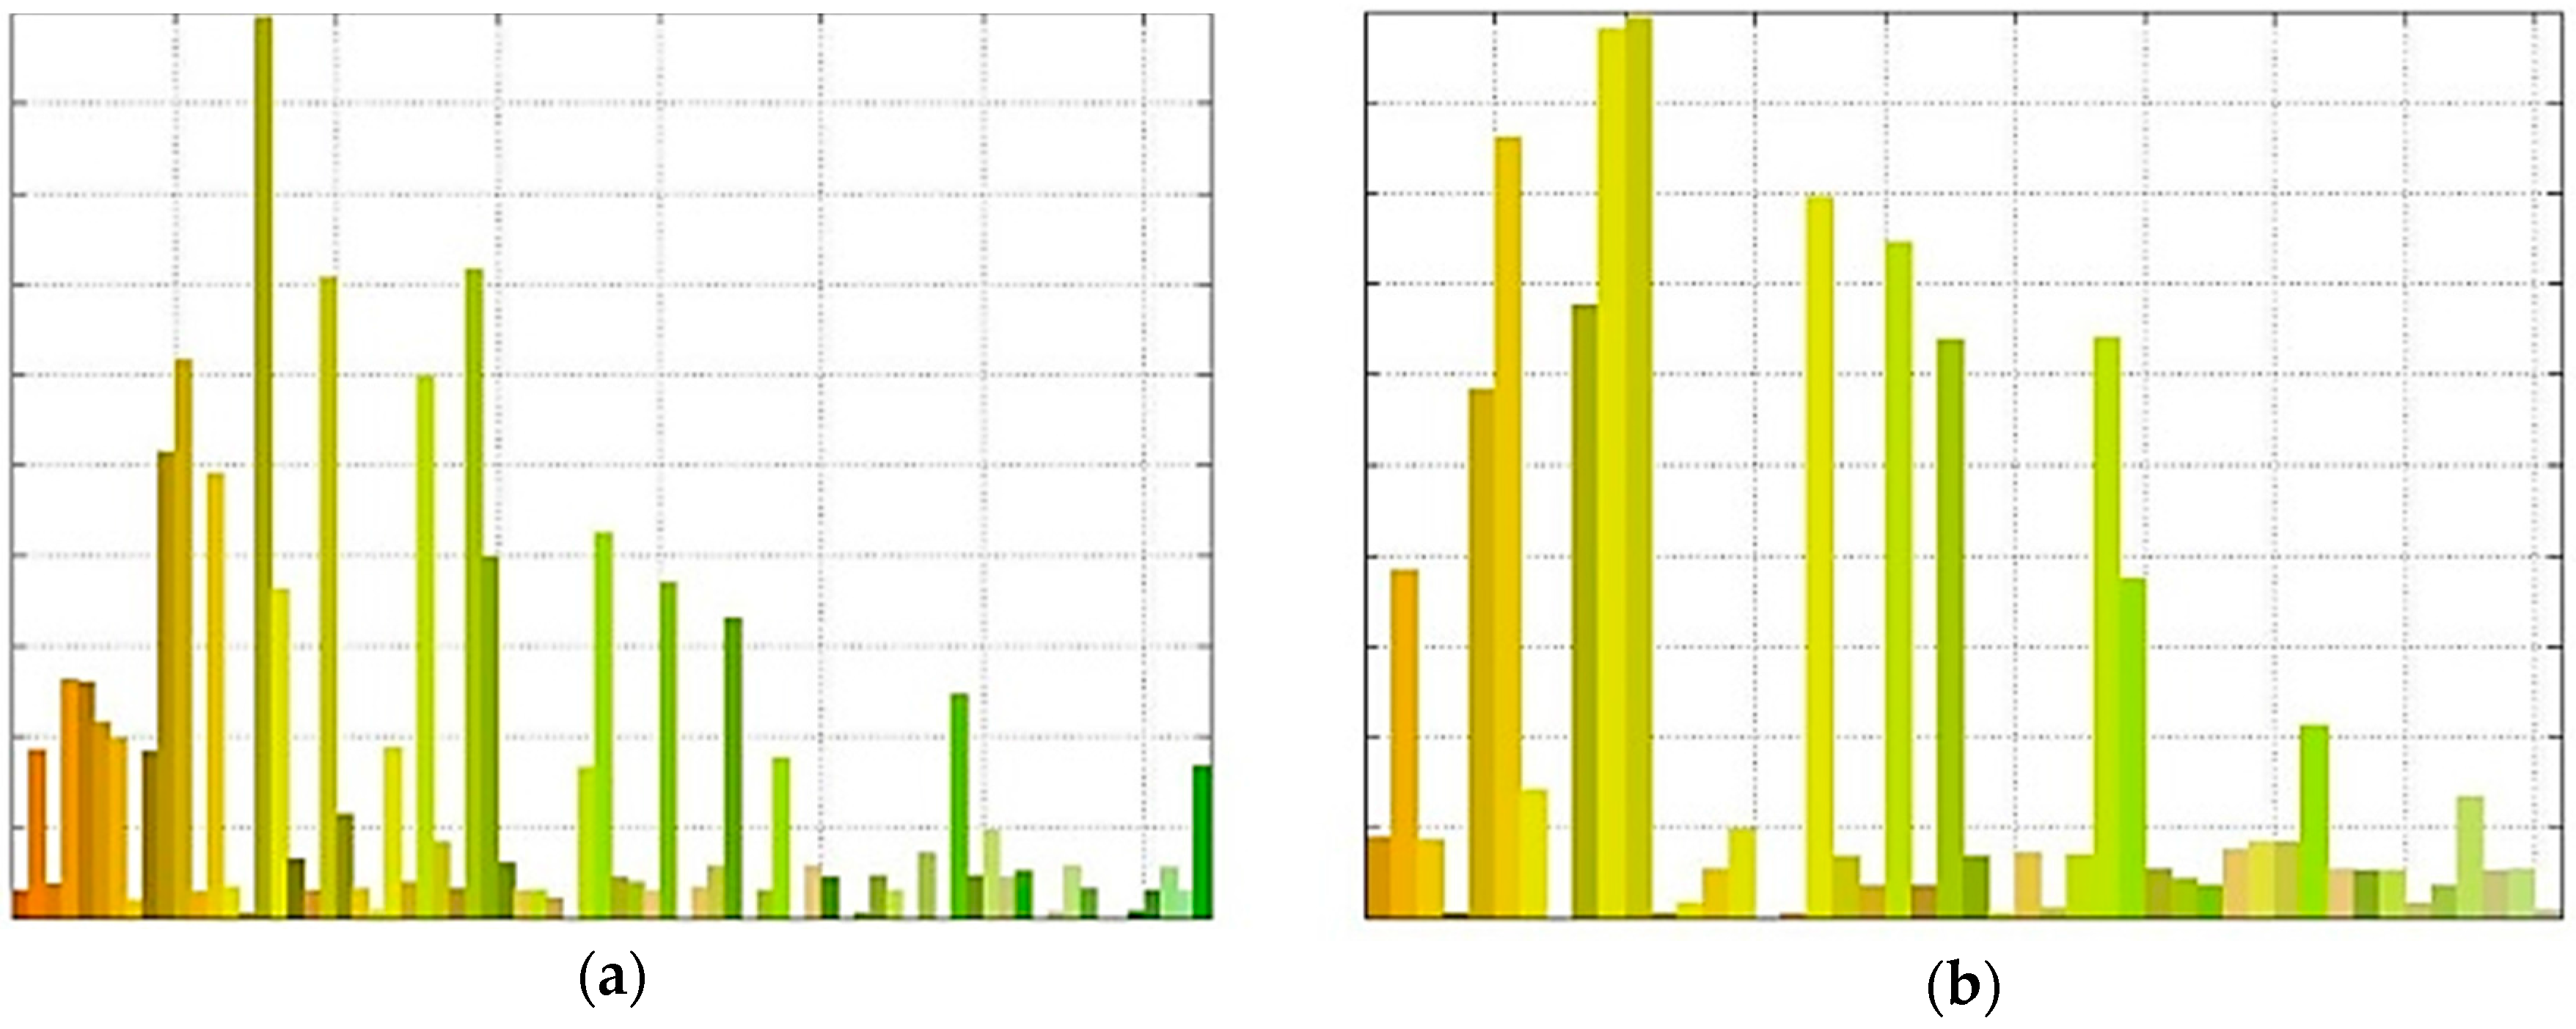
In the color histogram of the complete RGB image (Figure 3), the saturation levels are indicated for each of the shades of colors identified. Basically, the more often a shade appears, the higher the equivalent plotting is (occurrence frequency). This figure allows for a comparison of the overall degree of effectiveness within the IMS, as more shades in the diagram indicate sub-systems that work individually in the various processes, while fewer shades and more consolidated color areas indicate elements that are able to function more in tandem while running within the IMS. It can be considered that this histogram represents relatively faithfully the distribution of the different levels of integration within the studied IMS, as this has improved slightly over the one-year period between the two assessment moments (i.e., the colors move to lighter areas). It can be noted that the diagram is similar in shape to the normal distribution, with the following observations:
- It can be easily observed that the histogram contains a series of close shades, which seems to support the idea that the number of appreciation levels for maturity should be reduced, although in the second picture we can already see a better grouping of the categories.
- It should not be forgotten, however, the importance of processes in the whole system, based on their delivered added value, e.g., the managerial process “Development” influences investments and new projects and can be considered more important than the support process “Storage”, which only aids in the temporary placement of materials/products, and evolves faster towards improved levels of integration.
- Intervention decisions should take into account the need to advance the overall integration maturity while at the same time increasing inner cohesion (i.e., process performance aligned to similar levels).
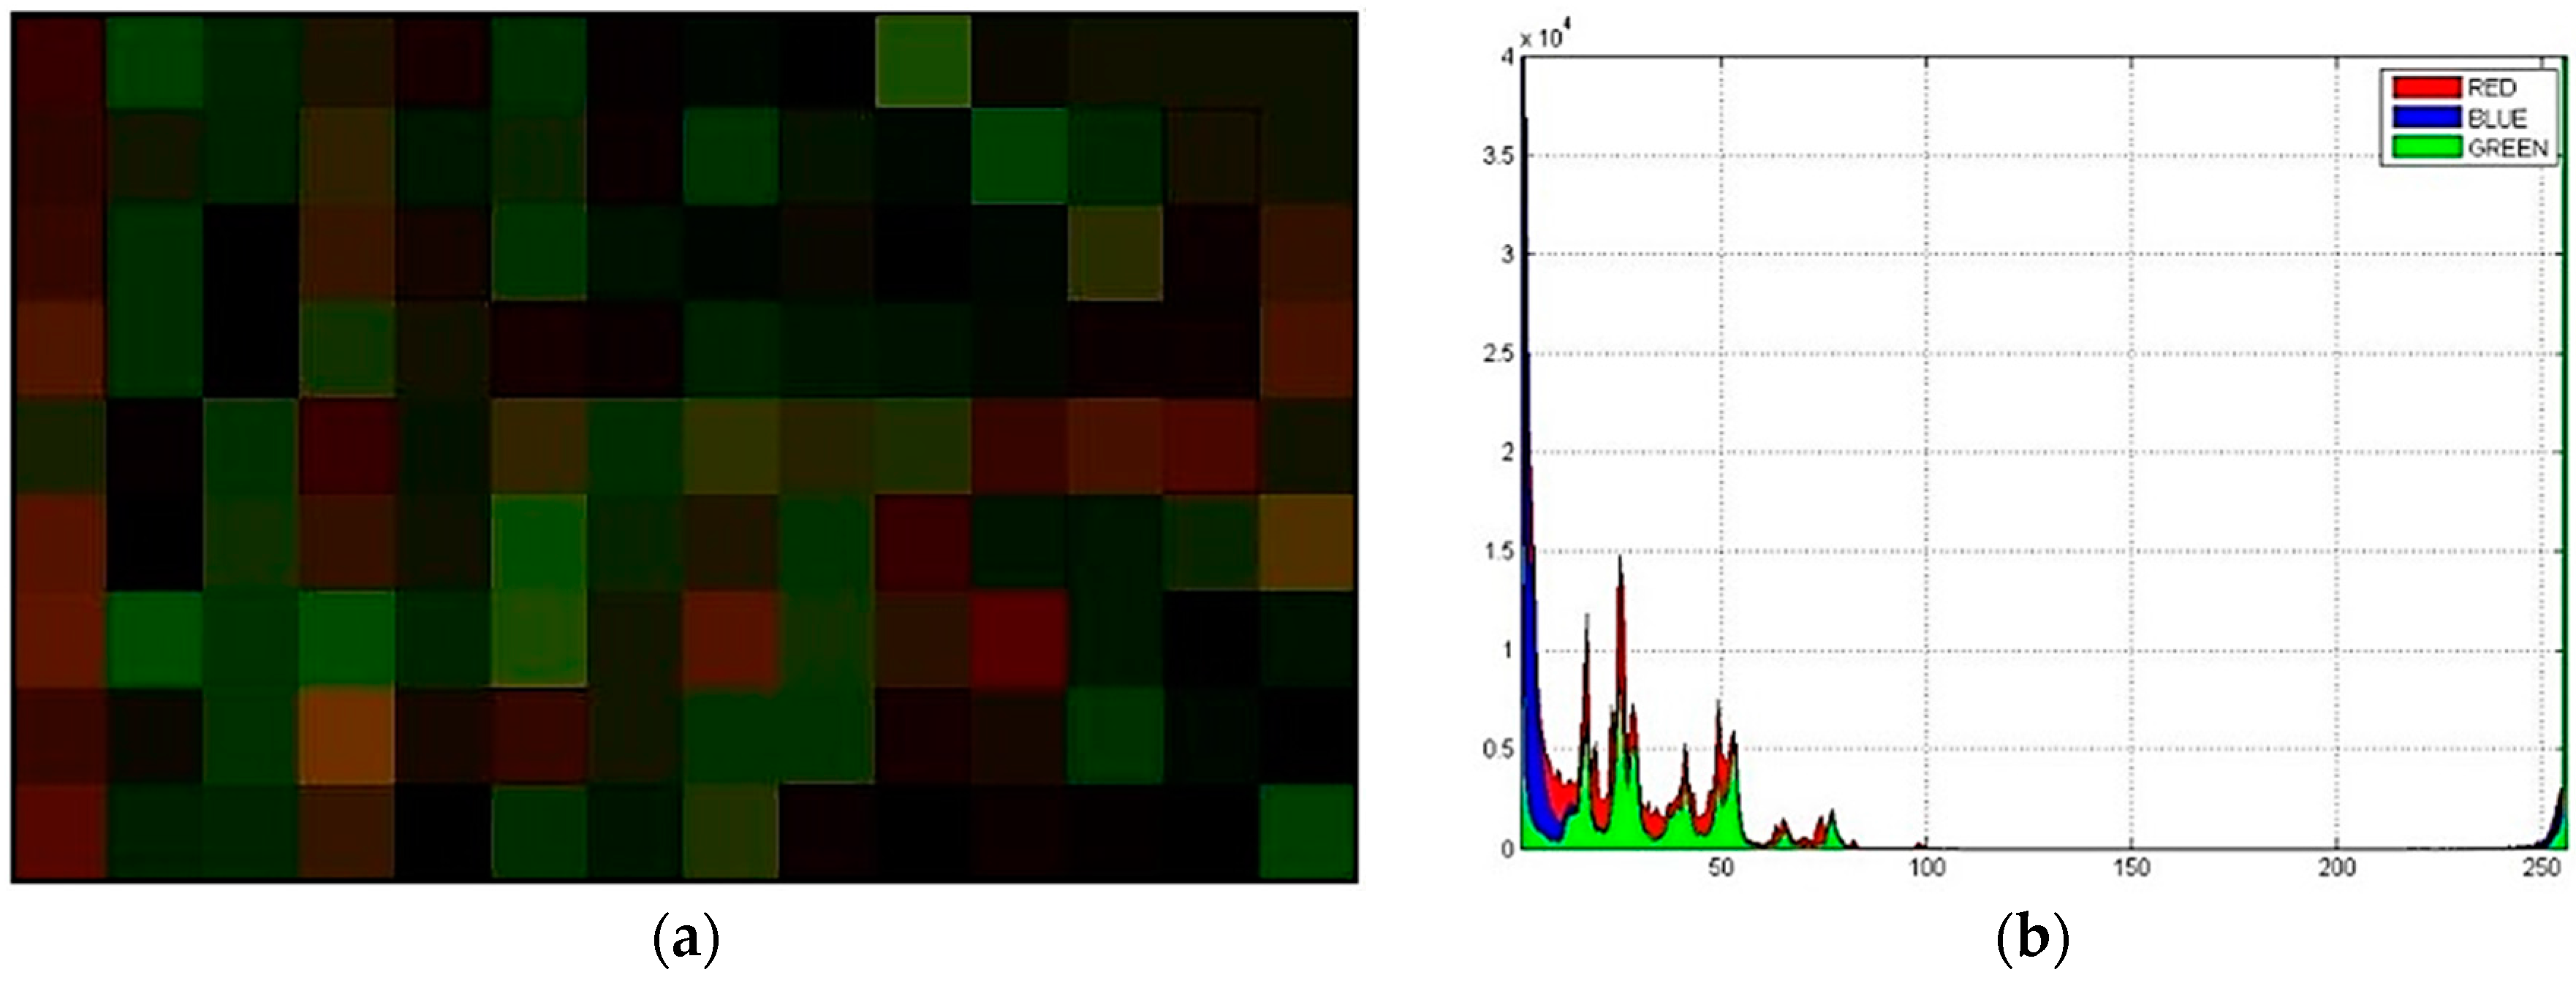
The study of the differences between the two images shown in Figure 1 (both at the global level of color shades and the level of the channels’ histogram) also reveal interesting aspects. Thus, one can see in the images below (Figure 4) that the two systems especially influence each other regarding the evolution of the integration degree and continual improvement. It can be observed that the QMS (based on the longer experience accumulated) is the leader in this evolution and that, in numerical terms (i.e., color channel quantitative assessment performed with MATLAB and evaluated in terms of relationships, not absolute values), its improvements are grouped in the area with a small difference from the certification to the surveillance, as the system does not need significant modifications from one year to another. EMS follows to the best of its abilities the behavior of its “older brother”, which is relatively easy for the elements that are common and identical based on the two referentials, but it also has areas in which it cannot keep up due to internal or external factors. Although there is equivalency among the requirements, according to the correspondence tables from the two standards, it is not always the case that this is manifested in practice in a concrete way (e.g., identifying and evaluating the environmental aspects is only partially assimilated with customer orientation).
Concerning the quantitative evaluation of the maturation process for the IMS, with the help of the MATLAB program the following important numerical results were obtained for describing the evolution recorded above (Table 6).
An integration behavior can be observed, which is in line with the expectations of the company, the certification body, and the specialists. Thus, globally, the mean value of color intensity is increasing, which indicates a movement towards more functional individual MSs, the standard deviation increases and indicates a distribution with a more pronounced randomness, due to the fact that the new component (EMS) is in its starting stages and contains natural modifications and hesitations, while the entropy decreases slightly, indicating a higher coherence between the two combined systems, i.e., a higher level of integration maturity of the IMS. This final part of the analysis could be omitted when implementing the approach in a business setting, where concrete results are more important than statistical insights. One must underline the fact that both stages of this process address IMS maturity as a measure of its effectiveness, not factoring in costs and efficiency. This is due to the component sub-systems themselves, which are built around effective application and impact assessment, and require additional tools to become aware and in control of their resource consumption (e.g., ISO 9001 [10] is supplemented by ISO 9004 [48] for quality costing and other efficiency related issues).
5. Conclusions
The current work proposes an original approach for assessing the internal coherence and the projected results of IMSs that combine two or more management systems and thus offers a base for their improvement towards supporting more sustainable corporate conduct. Its main advantage is translating sustainability from an abstract concept into a visible and easily addressable concern, thus operationalizing it for the management of companies and helping to ensure its associated issues are addressed and tracked to completion.
At the level of the case study, we believe that the positive development detected indicates the global increase of the IMS’s degree of maturity. This type of assessment can serve to rapidly characterize the system. We conjecture that the increase of the standard deviation points to a higher degree of dispersion of the results, but that the decrease in entropy signals the reduction of variability within the system and the appearance of a more homogeneous internal structure. The two trends can be reconciled in the long run by continuing to improve the IMS and to deepen the integration between its components. The presented approach treats the resulting color map as an indicator of the integrated state and the primary color maps as representations of the individual systems, assuming that the systems’ interaction is similar to the color addition mathematical model, based on affinities in terms of complexity, dynamics, and systems of systems behavior. Among the limitations brought about by this assumption is the inflexibility to consider external factors not addressed by the components systems (e.g., cultural influences) or the possible improvements within the IMS, which would not be linear but disruptive (e.g., radical innovation). However, if one considers sustainability in terms of competitiveness and organizational cohesiveness, as well as controlled impact upon the environment and its own employees, the approach can model, assess, and help improve the way in which a firm acts.
At the methodological level, we remark the following aspects that characterize this solution as a possible future instrument for system managers or senior managers of an organization:
- Unlike existing models, focusing more on a qualitative-subjective approach that divides maturity into classes, levels or categories, this solution enables an improved quantification and a fine discretization of the integration maturity assessment.
- The proposed algorithm uses existing procedures and processes from the implemented systems (process audits, correspondence of requirements) and requires no extra effort that might discourage or drive away companies or their employees from collecting and processing the necessary data.
- The instrument has a mathematical apparatus and computer support, which is transparent to the users, that at the same time ensures scientific consistency, ease of use, and stimulating problem solving, and the identification of opportunities for improvement; this is accentuated by the peoples’ positive understanding of chromaticity, which allows for an intuitive form of visualization that, once assimilated by the user, facilitates the rapid identification of the integration level.
Finally, we mention the ongoing development, as a continuation of the undertaken research, of a web software instrument for automating the approach. This action involves the online transfer of this algorithm for assessing the maturity of integration and the elaboration of a database of diverse case studies, allowing for the conduction of comparative analyses, respectively, for refining the tool for analysis in real situations. Moreover, in the web application, there are performed tests with images of 16 colors, which is a much more intuitive system for potential users. Finalizing these demarches could, after proper wide scale testing, contribute to the rapid application of this methodology in business settings for tracking IMS performances and enhancing the managerial decision-making process for transforming the IMS into a sustainability enabler.
Acknowledgments
We would like to thank our colleagues and collaborators Dorin Țifrea, Lucian Pitic, Marcel Beldean, and Diana Rusu for their support and advice.
Author Contributions
M.D., S.P., and C.N. conceived and developed the methodology, M.D., D.D., and Ș.B. performed data collection, M.D., C.N., and Ș.B. performed data analysis, M.D., S.P., and D.D. wrote the paper.
Conflicts of Interest
The authors declare no conflict of interest.
References
- International Organization for Standardization. ISO 9000:2005—Quality Management Systems—Fundamentals and Vocabulary; International Organization for Standardization: Geneva, Switzerland, 2005. [Google Scholar]
- International Organization for Standardization. ISO 14001:2004—Environmental Management Systems—Requirements with Guidance for Use; International Organization for Standardization: Geneva, Switzerland, 2004. [Google Scholar]
- British Standards Institution. BS OHSAS 18001:2007—Occupational Health and Safety Management Systems—Requirements; British Standards Institution: London, UK, 2007. [Google Scholar]
- International Organization for Standardization. Economic Benefits of Standards; International Organization for Standardization: Geneva, Switzerland, 2014; Available online: http://www.iso.org/iso/ebs_case_studies_factsheets.pdf (accessed on 12 November 2016).
- International Organization for Standardization. The ISO Survey of Management System Standard Certifications 2015; International Organization for Standardization: Geneva, Switzerland, 2016; Available online: http://www.iso.org/iso/the_iso_survey_of_management_system_standard_certifications_2015.pdf (accessed on 13 November 2016).
- International Organization for Standardization/International Electrotechnical Commission. ISO/IEC 27001:2013—Information Technology—Security Techniques—Information Security Management Systems—Requirements; International Organization for Standardization/International Electrotechnical Commission: Geneva, Switzerland, 2013. [Google Scholar]
- International Organization for Standardization. ISO 26000:2010—Guidance on Social Responsibility—Principles of Social Responsibility; International Organization for Standardization: Geneva, Switzerland, 2010. [Google Scholar]
- International Organization for Standardization. ISO/TS 16949:2009—Quality Management Systems—Particular Requirements for the Application of ISO 9001:2008 for Automotive Production and Relevant Service Part Organizations; International Organization for Standardization: Geneva, Switzerland, 2009. [Google Scholar]
- International Organization for Standardization. ISO 22000:2005—Food Safety Management Systems—Requirements for Any Organization in the Food Chain; International Organization for Standardization: Geneva, Switzerland, 2005. [Google Scholar]
- International Organization for Standardization. ISO 9001:2008—Quality Management Systems—Requirements; International Organization for Standardization: Geneva, Switzerland, 2008. [Google Scholar]
- International Organization for Standardization. ISO Management System Standards; International Organization for Standardization: Geneva, Switzerland, 2016; Available online: http://www.iso.org/iso/home/standards/management-standards/mss-list.htm. (accessed on 12 November 2016).
- Domingues, P.; Sampaio, P.; Arezes, P. Analysis of integrated management systems from various perspectives. Total Qual. Manag. Bus. Excell. 2015, 26, 1311–1334. [Google Scholar] [CrossRef]
- Kauppila, O.; Härkönen, J.; Väyrynen, S. Integrated HSEQ management systems: Developments and trends. Int. J. Qual. Res. 2015, 9, 231–242. [Google Scholar]
- Kymal, C.; Gruska, G.; Reid, R.D. Integrated Management Systems; American Society for Quality: Milwaukee, WI, USA, 2015. [Google Scholar]
- Nunhes, T.V.; Ferreira Motta, L.C.; de Oliveira, O.J. Evolution of integrated management systems research on the Journal of Cleaner Production: Identification of contributions and gaps in the literature. J. Clean. Prod. 2016, 139, 1234–1244. [Google Scholar] [CrossRef]
- Bititci, U.S.; Garengo, P.; Ates, A.; Nudurupati, S.S. Value of maturity models in performance measurement. Int. J. Prod. Res. 2015, 53, 3062–3085. [Google Scholar] [CrossRef] [Green Version]
- Tarhan, A.; Turetken, O.; Reijers, H.A. Business process maturity models: A systematic literature review. Inf. Softw. Technol. 2016, 75, 122–134. [Google Scholar] [CrossRef]
- Domingues, P.; Sampaio, P.; Arezes, P.M. Integrated management systems assessment: A maturity model proposal. J. Clean. Prod. 2016, 124, 164–174. [Google Scholar] [CrossRef]
- British Standard Institution (BSI). PAS 99 Specification of Common Management System Requirements as a Framework for Integration; BSI: London, UK, 2012. [Google Scholar]
- Tangen, S.; Warris, A. New Format for Future ISO Management system Standards. 2012. Available online: https://www.iso.org/news/2012/07/Ref1621.html (accessed on 30 July 2017).
- Bernardo, M.; Simon, A.; Tarí, J.J.; Molina-Azorín, J.F. Benefits of management systems integration: A literature review. J. Clean. Prod. 2015, 94, 260–267. [Google Scholar] [CrossRef]
- Olaru, M.; Maier, D.; Nicoara, D.; Maier, A. Establishing the basis for development of an organization by adopting the integrated management systems: Comparative study of various models and concepts of integration. Procedia 2014, 109, 693–697. [Google Scholar] [CrossRef]
- Asif, M.; Fisscher, O.A.; de Bruijn, E.J.; Pagell, M. Integration of management systems: A methodology for operational excellence and strategic flexibility. Oper. Manag. Res. 2010, 3, 146–160. [Google Scholar] [CrossRef]
- Asif, M.; de Bruijn, E.J.; Fisscher, O.A.; Searcy, C. Meta-management of integration of management systems. TQM J. 2010, 22, 570–582. [Google Scholar] [CrossRef]
- Bernardo, M.; Casadesus, M.; Karapetrovic, S.; Heras, I. An empirical study on the integration of management system audits. J. Clean. Prod. 2010, 18, 486–495. [Google Scholar] [CrossRef]
- Simon, A.; Bernardo, M.; Karapetrovic, S.; Casadesús, M. Integration of standardized environmental and quality management systems audits. J. Clean. Prod. 2011, 19, 2057–2065. [Google Scholar] [CrossRef]
- Bernardo, M.; Casadesus, M.; Karapetrovic, S.; Heras, I. How integrated are environmental, quality and other standardized management systems? An empirical study. J. Clean. Prod. 2009, 17, 742–750. [Google Scholar] [CrossRef]
- Bernardo, M.; Marti, S.; Karapetrovic, S.; Inaki, H. Do integration difficulties influence management system integration levels? J. Clean. Prod. 2012, 21, 23–33. [Google Scholar] [CrossRef]
- Bernardo, M.; Casadesus, M.; Karapetrovic, S.; Heras, I. Integration of standardized management systems: Does the implementation order matter? Int. J. Oper. Prod. Manag. 2012, 32, 291–307. [Google Scholar] [CrossRef]
- Sampaio, P.; Saraiva, P.; Domingues, P. Management systems: Integration or addition? Int. J. Qual. Reliab. Manag. 2012, 29, 402–424. [Google Scholar] [CrossRef] [Green Version]
- Abad, J.; Dalmau, I.; Vilajosana, J. Taxonomic proposal for integration levels of management systems based on empirical evidence and derived corporate benefits. J. Clean. Prod. 2014, 78, 164–173. [Google Scholar] [CrossRef]
- Merriam-Webster Dictionary, Mature. Available online: https://www.merriam-webster.com/dictionary/mature (accessed on 7 August 2017).
- Bersin by Deloitte, Bersin Lexicon—Organizational Maturity. Available online: http://www.bersin.com/Lexicon/Details.aspx?id=14272 (accessed on 11 August 2017).
- Mettler, T. Maturity assessment models: A design science research approach. Int. J. Soc. Syst. Sci. 2011, 3, 81–98. [Google Scholar] [CrossRef]
- Van Looy, A. Business Process Maturity; Springer: Cham/Heidelberg, Germany; New York, NY, USA; Dordrecht, The Netherlands; London, UK, 2014. [Google Scholar]
- Röglinger, M.; Pöppelbuß, J.; Becker, J. Maturity models in business process management. Bus. Process Manag. J. 2012, 18, 328–346. [Google Scholar] [CrossRef]
- Rose, J. Selecting, Using and Creating Maturity Models; A Tool for Assurance and Consulting Engagements (Practice Guide); The Institute of Internal Auditors: Lake Mary, FL, USA, 2013. [Google Scholar]
- Becker, J.; Knackstedt, R.; Pöppelbuß, J. Developing maturity models for IT management—A procedure model and its application. Bus. Inf. Syst. Eng. 2009, 1, 213–222. [Google Scholar] [CrossRef]
- Software Engineering Institute. Standard CMMI® Appraisal Method for Process Improvement (SCAMPI SM) A, 1st ed.; Method Definition Document; Carnegie Mellon University: Pittsburgh, PA, USA, 2011. [Google Scholar]
- EFQM. Assessment. Available online: http://www.efqm.org/what-we-do/assessment (accessed on 11 August 2017).
- Software Engineering Institute. CMMI for Development, version 1.3; Carnegie Mellon University: Pittsburgh, PA, USA, 2010. [Google Scholar]
- Abrahamsson, S.; Hansson, J.; Isaksson, R. Integrated Management Systems—Advantages, problems. In Proceedings of the 13th Toulon-Verona Conference Organisational Excellence in Services, Coimbra, Portugal, 2–4 September 2010. [Google Scholar]
- Domingues, P.; Sampaio, P.; Arezes, P. Integrated management systems as complex adaptive systems. In Proceedings of the 8th International Conference Working on Safety, Porto, Portugal, 23–25 September 2015. [Google Scholar]
- Dragomir, M.; Popescu, S. Contributions regarding the design, development, implementation and continuous improvement of integrated management systems. In Proceedings of the 6th International Conference Management of Technological Changes, Alexandroupolis, Greece, 3–5 September 2009. [Google Scholar]
- Pascale, D. A Review of RGB Color Spaces … from xyY to R’G’B’; BabelColor Company: Montreal, QC, Canada, 2003. [Google Scholar]
- Excel Tips. Square Cells in Excel, 8 December 2004. Available online: http://excel-tips.blogspot.ro/2004/12/square-cells-in-excel.html (accessed on 29 November 2016).
- Jayaraman, S.; Esakkirajan, S.; Veerakumar, T. Digital Image Processing, 3rd ed.; Tata McGraw Hill Education: New Delhi, India, 2010. [Google Scholar]
- International Organization for Standardization. ISO 9004:2009—Managing for the Sustained Success of an Organization—A Quality Management Approach; International Organization for Standardization: Geneva, Switzerland, 2009. [Google Scholar]
Figure 1.
(a) IMS—certification phase and surveillance phase, (b) RGB-composed images.

Figure 2.
RGB Histogram—correlated analysis of integrated components in the two phases, certification (a) and surveillance (b).
Figure 2.
RGB Histogram—correlated analysis of integrated components in the two phases, certification (a) and surveillance (b).

Figure 3.
Color Histogram—IMS analysis in the two phases, certification (a) and surveillance (b).

Figure 4.
Color map (a) and channel histogram (b) of the difference image (surveillance map minus certification map).
Figure 4.
Color map (a) and channel histogram (b) of the difference image (surveillance map minus certification map).


Table 1.
Structured review of the scientific literature.
| Section A. A Conceptual Framework for Integrated Management Systems (IMSs) |
| IMS Definition and the Usual Components |
| An IMS is a management system that integrates all systems and processes of an organization into one complete framework [19], enabling it to work as a single unit with unified objectives. Usually (i.e., most often found in practice), an IMS integrates the standardized management systems dedicated to Quality (QMS) (ISO 9001), Environment (EMS) (ISO 14001), and Occupational Health and Safety (OHSMS) (OHSAS 18001, replaced by ISO 45001). The integration refers [14] to risks, processes, documents, and auditing, including the way the structure of the new versions of these standards facilitate their requirements’ integration by a common High-Level Structure (HLS) [20]. As a normative reference, PAS99 [19], delivering guidance for IMS realization could be also mentioned. |
| Organizational Benefits from Adopting IMS |
| Reference [21], which analyzes about 120 publications about the benefits of standardized management systems in general and of IMSs in particular, groups the benefits of companies for adopting IMSs into internal benefits (overall organization, and specific to human resources, performance management, and system audits) and external benefits (market stakeholders and auditing/certification). Reference [12], analyzing specific literature, reports, as the most common drawbacks identified related to non-integrated systems, effort duplication and increasing bureaucracy. |
| IMS Implementation Strategies and Models |
| For IMS implementation, Olaru, M. et al [22] identifies and analyzes different models of integration realizing a comparative study of those applying the quality–environment–health triad and safety management standards. Reference [23] describes the start of integration, its moments, and the functional and structural changes and their impact on the level of processes, documentation, staff behavior, reducing needed resources and losses, and improving company performance, and declares integration as a tool to reform company bureaucracy. Reference [24] identifies methodologies and approaches for managerial system integration: sequential, systemic, hierarchical, TQM, integrating augmented standards, and incorporation in processes. It also defines the levels of control for integration in the system approach case (meta level–object level–intervention level) as well as its characteristics. |
| IMS Audit/Assessment |
| Reference [14] mentions that minimal integration for audits means one audit process, an integrated audit schedule, integrated forms including checklists, and a team capable of conducting an integrated audit. Reference [25], exploring the audit process integration, reviews specific issues such as team, simultaneity, implementation, and planning/reporting IMS audits, and identifies three levels of integration: not integrated, partially integrated, and fully integrated. Reference [26] notes a higher degree of integration of specific components in internal audits compared with external audits. |
| IMS Levels/Degrees of Integration |
| There is no consensus concerning this subject even between papers with common authors. The authors of [27] recorded the levels of integration of IMSs identified by other authors—addition–merger integration; individual–combination integration; separated–aligned integration; harmonization–cooperation–amalgamation—framing them into four distinct levels. They evaluate the degree of individual integration on processes, focusing the investigation on human resources and on documentation. At the same time, Bernardo, M. et.al. [25] identifies three levels of integration: not integrated, partially integrated, and fully integrated, while the authors of References [28,29] studied whether the degree of integration is influenced by the difficulties of implementation (from standards, organization, resources, consultants, certification bodies) or by the implementation order of the component standards. The authors of [30] mention the integration steps proposed by British Standards Institution—BSI (Combined–Integratable–Integrating–Integrated) and refer in the empirical study to five levels of integration. The authors of Reference [31] support the three levels of integration, places integration at the level of managerial processes, and notes that obtaining a higher degree of integration is more difficult for large companies. |
| Section B. A Conceptual Framework for a Maturity Approach to Managerial Systems |
| Maturity as Concept and the Organizational Entities to Which It can be Associated |
| Based on Reference [32], maturity could be defined as the “quality” or “state” gained by an entity during its “natural” or “intended” process of “change, growth and development” towards “a final or desired state.” In Reference [33], organization maturity is defined as the level of readiness and experience in relation to people, processes, technologies, and consistent measurement practices. It implies [34] an evolutionary progress in the demonstration of a specific ability or a maturity factor, such as people/culture, processes/structures, and objects/technology. |
| Maturity Models (MMs), Types and Usage Purposes in Organizations |
| MMs represent tools for systematically assessing and improving capabilities or critical factors for reaching goals [35]. An MM includes a sequence of levels that form an anticipated, desired, or logical path from an initial state to maturity. The main classifications of MMs are in terms of how they should be used; in this sense, three types of MMs can be mentioned [36]: descriptive (internal diagnostic tool or base for external reports); prescriptive (indicating desirable levels and providing improvement guidance), and comparative (for internal or external benchmarking). From their beginnings in the 1970s [34], passing through software Capability Maturity Model Integration—CMMI (early 1990s) and ISO/IEC 15504, a wide range of MMs have been developed by practitioners and academics, mainly as a basis of informed approaches for continuous improvement or means of self- or third-party assessment. |
| MM Design and Usage |
| After [36,37] MM development associates its design and use in a common sequential process with the following design stages: establish purpose and components, determine scale, and set expectations for component levels, to which the utilization phase adds the following: set targets for each component, assess the level of maturity by component, and consider possible improvements. MMs are usually subject to a validation and improvement phase that includes the following as additional stages: check suitability for purpose, consider possible missing elements, and revise and improve the model [37]. Reference [38] proposes a set of nine requirements and a procedure for designing MMs and provides a synopsis of design processes, and Reference [36] provides three sets of design principles for MMs: basic, specific to descriptive, and specific to prescriptive use. |
| Maturity Assessment and The Presentation of Their Results |
| Maturity assessment is based on self-assessment (audits) or external evaluation processes, following consecrated procedures such as SCAMPI (Standard CMMI Appraisal Method for Process Improvement) for CMMI [39], and the EFQM Assessment applied in the well-known excellence model [40], or developed for the specific purpose of the MM. A typical assessment process has the following phases: plan the assessment, collect and analyze data, report findings, deduce recommendations, implement recommendations, and track the improvements. The nature of the assessed variables and results depend on the MM design and could be qualitative or quantitative, sometimes both being present. Keeping the same examples, CMMI uses [41] qualitative approaches for both assessed variables and results, and five levels of maturity are available: Initial, Managed, Defined, Quantitatively Managed, and Optimizing. For the EFQM model [40], the 9 assessment criteria and their sub-criteria are qualitative, but their evaluation is made quantitatively. There have not been any identified references for MMs using color to present assessment results. |
| Other References Approaching the IMS Maturity |
| Few web references were explicitly identified as addressing IMS maturity in a consistent way. Some of these [42] place maturity in association with the IMS “integration levels” (which appears to be a relevant approach), while others just mention the IMS impact on an organization and the maturity of processes. Reference [18] and four other publications by the same authors (2012–2017) deliver an exception, focusing on IMS–MM development, which uses a tri-dimensional approach having the following as axes: key process agents, externalities (external features that impact on the IMS maturity), and excellence management pillars (based on the quality management principles). The maturity assessment combines a CMMI approach with statistics and leads to six maturity levels. |
Table 2.
QMS—certification phase, red color levels.
| Certification | Quality Management System | |||||||||||||
|---|---|---|---|---|---|---|---|---|---|---|---|---|---|---|
| Process | 5.3 | 5.2 | 7.2.1 | 5.4.1 | 5.5, 6.1 | 6.2 | 4.2.1–3 | 7 | 8.1 | 8.2, 8.4 | 8.3 | 4.2.4 | 8.2.2 | 5.6 |
| Management | 204 | 255 | 230 | 217 | 230 | 255 | 217 | 255 | 204 | 204 | 191 | 204 | 204 | 204 |
| Development | 179 | 204 | 217 | 204 | 204 | 204 | 191 | 230 | 191 | 204 | 191 | 204 | 179 | 204 |
| Analysis | 179 | 204 | 217 | 204 | 230 | 204 | 230 | 230 | 191 | 255 | 204 | 204 | 191 | 204 |
| Sales | 128 | 255 | 230 | 217 | 204 | 255 | 191 | 255 | 191 | 255 | 191 | 191 | 204 | 191 |
| Design | 217 | 230 | 179 | 179 | 191 | 204 | 230 | 204 | 179 | 191 | 179 | 191 | 153 | 179 |
| Purchasing | 153 | 204 | 153 | 204 | 230 | 191 | 204 | 217 | 204 | 204 | 217 | 230 | 204 | 153 |
| Production | 102 | 217 | 179 | 204 | 191 | 153 | 179 | 153 | 153 | 191 | 128 | 191 | 230 | 230 |
| Storage | 128 | 191 | 153 | 128 | 204 | 179 | 179 | 204 | 179 | 204 | 179 | 204 | 204 | 230 |
| Delivery | 128 | 230 | 179 | 153 | 230 | 179 | 179 | 191 | 191 | 204 | 217 | 191 | 179 | 204 |
Table 3.
EMS—certification phase, green color levels.
| Certification | Environmental Management System | |||||||||||||
|---|---|---|---|---|---|---|---|---|---|---|---|---|---|---|
| Process | 4.2 | 4.3.1 | 4.3.2 | 4.3.3 | 4.4.1 | 4.4.2–3 | 4.4.4–5 | 4.4.6 | 4.4.7 | 4.5.1–2 | 4.5.3 | 4.5.4 | 4.5.5 | 4.6 |
| Management | 230 | 153 | 191 | 230 | 255 | 204 | 230 | 191 | 230 | 179 | 191 | 204 | 230 | 230 |
| Development | 230 | 179 | 217 | 217 | 204 | 191 | 204 | 179 | 255 | 204 | 191 | 191 | 230 | 230 |
| Analysis | 204 | 128 | 230 | 179 | 191 | 153 | 230 | 179 | 191 | 255 | 204 | 204 | 230 | 230 |
| Sales | 204 | 128 | 230 | 179 | 204 | 204 | 204 | 153 | 179 | 230 | 204 | 204 | 204 | 230 |
| Design | 217 | 204 | 204 | 204 | 204 | 191 | 204 | 179 | 191 | 204 | 204 | 230 | 204 | 204 |
| Purchasing | 204 | 230 | 204 | 204 | 230 | 153 | 191 | 179 | 153 | 230 | 204 | 179 | 191 | 179 |
| Production | 179 | 179 | 153 | 179 | 191 | 128 | 179 | 204 | 179 | 204 | 204 | 179 | 204 | 204 |
| Storage | 191 | 191 | 179 | 179 | 191 | 204 | 179 | 153 | 179 | 204 | 191 | 179 | 191 | 204 |
| Delivery | 191 | 153 | 179 | 179 | 179 | 128 | 179 | 153 | 204 | 204 | 191 | 179 | 179 | 153 |
Table 4.
QMS—surveillance phase, red color levels.
| Certification | Quality Management System | |||||||||||||
|---|---|---|---|---|---|---|---|---|---|---|---|---|---|---|
| Process | 5.3 | 5.2 | 7.2.1 | 5.4.1 | 5.5, 6.1 | 6.2 | 4.2.1–3 | 7 | 8.1 | 8.2, 8.4 | 8.3 | 4.2.4 | 8.2.2 | 5.6 |
| Management | 255 | 255 | 230 | 255 | 255 | 255 | 230 | 255 | 204 | 255 | 204 | 230 | 230 | 230 |
| Development | 217 | 230 | 204 | 255 | 204 | 230 | 204 | 230 | 204 | 204 | 204 | 191 | 204 | 230 |
| Analysis | 230 | 204 | 217 | 255 | 255 | 230 | 230 | 230 | 204 | 255 | 204 | 255 | 204 | 255 |
| Sales | 204 | 255 | 230 | 255 | 230 | 230 | 204 | 255 | 179 | 255 | 179 | 204 | 191 | 255 |
| Design | 255 | 217 | 204 | 230 | 204 | 255 | 255 | 255 | 217 | 230 | 230 | 255 | 217 | 204 |
| Purchasing | 230 | 204 | 191 | 255 | 255 | 230 | 230 | 255 | 230 | 255 | 230 | 230 | 230 | 230 |
| Production | 179 | 204 | 191 | 230 | 204 | 204 | 204 | 230 | 191 | 230 | 204 | 191 | 230 | 230 |
| Storage | 179 | 204 | 179 | 230 | 230 | 230 | 204 | 230 | 204 | 230 | 204 | 204 | 204 | 230 |
| Delivery | 204 | 230 | 191 | 204 | 230 | 204 | 179 | 230 | 204 | 204 | 204 | 179 | 179 | 204 |
Table 5.
EMS—surveillance phase, green color levels.
| Certification | Environmental Management System | |||||||||||||
|---|---|---|---|---|---|---|---|---|---|---|---|---|---|---|
| Process | 4.2 | 4.3.1 | 4.3.2 | 4.3.3 | 4.4.1 | 4.4.2–3 | 4.4.4–5 | 4.4.6 | 4.4.7 | 4.5.1–2 | 4.5.3 | 4.5.4 | 4.5.5 | 4.6 |
| Management | 230 | 217 | 230 | 255 | 255 | 255 | 230 | 204 | 230 | 255 | 204 | 230 | 255 | 255 |
| Development | 217 | 204 | 255 | 255 | 179 | 230 | 204 | 230 | 230 | 191 | 255 | 230 | 204 | 255 |
| Analysis | 191 | 179 | 230 | 204 | 179 | 204 | 255 | 191 | 204 | 255 | 191 | 255 | 230 | 255 |
| Sales | 179 | 179 | 230 | 230 | 230 | 204 | 204 | 191 | 204 | 255 | 191 | 204 | 204 | 255 |
| Design | 255 | 204 | 255 | 204 | 230 | 230 | 255 | 230 | 230 | 255 | 217 | 255 | 191 | 230 |
| Purchasing | 230 | 230 | 255 | 230 | 255 | 230 | 230 | 204 | 204 | 230 | 179 | 204 | 230 | 230 |
| Production | 204 | 255 | 204 | 255 | 230 | 204 | 204 | 230 | 230 | 230 | 204 | 204 | 204 | 230 |
| Storage | 204 | 204 | 230 | 230 | 204 | 191 | 204 | 204 | 230 | 204 | 204 | 230 | 204 | 204 |
| Delivery | 204 | 191 | 217 | 204 | 179 | 179 | 204 | 204 | 204 | 204 | 191 | 179 | 179 | 217 |
Table 6.
Numerical characterization of the image analysis.
| Measure | Certification | Surveillance | Delta |
|---|---|---|---|
| Mean value | 129.916 | 145.272 | 15.357 |
| Standard deviation | 93.352 | 102.999 | 9.647 |
| Entropy | 4.623 | 4.036 | −0.587 |
© 2017 by the authors. Licensee MDPI, Basel, Switzerland. This article is an open access article distributed under the terms and conditions of the Creative Commons Attribution (CC BY) license (http://creativecommons.org/licenses/by/4.0/).
Share and Cite
MDPI and ACS Style
Dragomir, M.; Popescu, S.; Neamțu, C.; Dragomir, D.; Bodi, Ș. Seeing the Immaterial: A New Instrument for Evaluating Integrated Management Systems’ Maturity. Sustainability 2017, 9, 1643. https://doi.org/10.3390/su9091643
AMA Style
Dragomir M, Popescu S, Neamțu C, Dragomir D, Bodi Ș. Seeing the Immaterial: A New Instrument for Evaluating Integrated Management Systems’ Maturity. Sustainability. 2017; 9(9):1643. https://doi.org/10.3390/su9091643
Chicago/Turabian StyleDragomir, Mihai, Sorin Popescu, Călin Neamțu, Diana Dragomir, and Ștefan Bodi. 2017. "Seeing the Immaterial: A New Instrument for Evaluating Integrated Management Systems’ Maturity" Sustainability 9, no. 9: 1643. https://doi.org/10.3390/su9091643
Note that from the first issue of 2016, this journal uses article numbers instead of page numbers. See further details here.