The Reduction of CO2 Emissions by Application of High-Strength Reinforcing Bars to Three Different Structural Systems in South Korea

Department of Architectural Engineering, Seoul National University of Science and Technology, 232 Gongneung-ro, Nowon-gu, Seoul 01811, Korea
*
Author to whom correspondence should be addressed.
Sustainability 2017, 9(9), 1652; https://doi.org/10.3390/su9091652
Submission received: 19 August 2017
/
Revised: 13 September 2017
/
Accepted: 14 September 2017
/
Published: 18 September 2017
(This article belongs to the Special Issue Sustainability in Civil Engineering: from Sustainable Materials to Sustainable Cities)
Abstract
:The architecture, engineering, and construction (AEC) industry consume approximately 23% of the national energy annually, and are considered among the highest energy consuming industries. Recently, several studies have focused on establishing strategies to reduce the emissions of carbon dioxide in the AEC industry by utilisation of low-carbon materials, material reuse, recycling and minimal usage; selection of an optimal structural system and structural optimisation; and optimisation of construction operations. While several studies examined material selection and replacement in concrete, there is a paucity of studies investigating the replacement and implementation of high-strength re-bars to lower the carbon dioxide emissions in buildings. To fill this research gap, the purpose of this study involves calculating the emissions of carbon dioxide by applying high-strength reinforcement bars in three different types of buildings. The input–output analysis method was adopted to compute the emissions of carbon dioxide by using the yield strength and size. This study showed that the application of the high-strength re-bars is beneficial in reducing the input amount of materials, although the quantity of reinforcing bars on the development and splice increased. Furthermore, the application of high-strength deformed bars is also advantageous as a means of carbon dioxide reduction in the studied structural systems. In this study, the CO2 emissions of three different structural systems indicated that implementing SD500 re-bars is the most effective method to reduce carbon dioxide emissions.
1. Introduction
It is widely recognised that architecture, engineering, and construction (AEC) industry significantly impact the environment. The AEC industry consumes approximately 23% of the national energy per year [1]. Additionally, the ratio of energy consumption increases to 40% when the production and transportation of construction materials are considered [2]. Given that the AEC industry consumes a vast amount of energy, the emission of greenhouse gases is an inevitable phenomenon in this industry. According to IPCC Report [3], approximately 40% of carbon dioxide is emitted from the AEC industry. To lower the environmental burden and satisfy international agreements (e.g., business-as-usual (BAU), Kyoto Protocol [4], or the Paris Agreement), it necessary to focus on alleviating the anti-environmental impacts in the AEC industry. In keeping with the above-mentioned international approaches towards low-carbon and sustainability, the South Korean Government established a goal of lowering carbon dioxide emissions to a maximum of 50% by 2050 as agreed in the 15th United Nations Framework Convention on Climate Change (UNFCCC).
Recently, several studies researched and established strategies to reduce the embodied carbon of buildings by the utilisation of low-carbon materials, material reuse, recycling and minimal usage, selection of optimal structural system and structural optimisation, and optimisation of construction operations [5,6,7,8,9,10,11,12,13]. In conjunction with these strategies in building and construction, various studies examined material selection and replacement in concrete. In addition, there are several advantages when high-strength reinforcing bars are applied to buildings such as simplified connections between re-bars, improved workability, retrenchment of labour cost and so forth. However, the replacement of normal strength reinforcing bars with high-strength re-bars for reduction of CO2 emissions is relatively rare as a low carbon emission material in reinforced concrete structure and buildings. Hence, the aim of this study involves evaluating the environmental performance of high-strength reinforcing bars and assessing the applicability of high-strength re-bars as a means of reducing CO2 emissions in the rigid-frame structure, bearing wall system, and flat-plate system.
2. Literature Review
To reduce the emitted carbon dioxide in the architecture, engineering, and civil industry, it is extremely effective to lower the CO2 emissions from all materials that consume significant amounts of energy and emit a high proportion of greenhouse gases. There are several stages involved in constructing buildings or structures. Generally, this is divided into four phases: construction, operation and maintenance, decomposition, and demolition. Tae et al. [14] propose a simple CO2 assessment system over the entire life cycle of apartment housing in South Korea. They divided a building’s life cycle into four broad phases, namely a construction stage, an operation stage, a maintenance stage, and a dissolution and disposal stage. According to them, the construction stage is the most energy intensive phase of a building’s life cycle, and emits the highest amount of CO2. Additionally, they indicate that six major construction materials, including reinforced steel, ready mixed concrete, plywood, concrete product, industrial plastic products, and pain and vanish, account for approximately 80% of carbon dioxide emissions during the construction phase. The suggested simplified method for assessing the life cycle CO2 of apartment housing shows results that are in agreement with those from the existing approach, with respect to the calculation of the life cycle of CO2 emissions. Yan et al. [12] suggested a calculation method for GHG emissions in building construction in Hong Kong. They defined the sources of GHG emissions into four sources, namely manufacturing and transporting of buildings materials, energy consumption of construction equipment, energy consumption for processing resources, and disposal of construction waste. In their case study (One Peking in Hong Kong), the main source of CO2 emissions in building construction involves manufacturing and transporting the materials and energy for equipment operation, which account for approximately 98.6% to 99.2% of CO2 emissions. The results indicate that the majority of GHG emissions are due to ready-mixed concrete and reinforcement bars. They suggest that the application of recycled materials (especially re-bars) is a crucial method to lower the GHG emissions in building materials.
As reviewed, the most significant phases in terms of CO2 emissions in the construction industry is the construction phase. Additionally, reducing the CO2 emissions from the construction stage is the most important factor in the success of carbon reduction of a building. There are several carbon reduction strategies during the construction phase in building construction. Akbarnezhad and Xiao [15] reviewed extant studies in terms of strategies and methods to reduce the embodied carbon of buildings. They suggest that the embodied carbon of construction materials exhibits a relatively increased trend due to the recent advances in minimising the operating emissions of carbon dioxide. They categorise lowering the embodied carbon of buildings into five categories, namely using low-carbon materials, minimal utilisation of materials, recycling of materials, supplying materials to local suppliers, and constructing buildings with optimisation strategies. The most prevalent strategy of lowering the embodied carbon is the application of low-carbon materials in buildings. Cole [16] examines energy consumption and greenhouse gas emissions with the on-site construction of different material applications (i.e., wood, steel, and concrete). The results show that concrete consumes the highest energy as well as emits the highest amount of greenhouse gas. The runner-up for energy consumption and CO2 emissions is structures with wood. A steel structure is the lowest energy consumer as well as the lowest greenhouse gas emitter. A remarkable aspect of this study is that it reflects the energy consumption of transportation of construction personnel to and from the construction site. The results indicate that the energy consumption of transportation is not insignificant, and it accounts for approximately 5–85% based on the type of construction materials.
An extremely common method to reduce carbon dioxide from buildings involves implementing low-carbon emitting materials or substituting higher components for lower components. González and Navarro [6] indicated that selection of appropriate and low environmental materials in construction significantly impacts the reduction of carbon dioxide emission from construction sites. They maintained that the proper selection of low CO2 emitting materials lowers the emissions by approximately 28%. According to Cho and Chae [17], lowering the impact of buildings on the environment requires the utilisation of low-carbon emitting materials. They show that buildings with low-carbon materials emit approximately 25% less carbon dioxide emissions when compared with those of the conventional buildings. Additionally, they suggest two methods of producing low-carbon construction materials, namely by using recycled materials or industrial by-products, and by shortening the manufacturing process of the materials. According to their research, the top ranking of carbon dioxide emissions amongst construction materials is ready-mixed concrete. Additionally, they analysed the emissions of CO2 by phases during the entire life cycle of a building. Cho and Chae [17] indicated that the operation phase is the most energy consuming stage of the whole life cycle of a building, and the construction period is followed by the operation phase. Tae et al. [18] examine the influence of high-strength concrete as a means of low environmental impacts materials in high-rise buildings. A reduction of CO2 emissions is expected given the replacement of the normal strength concrete by high-strength concrete since the amount of concrete and re-bars were lowered, and the lifespan of the structures were prolonged when compared with those of the buildings to which normal strength materials were applied. When the aspect of structural systems is considered, the application of high-strength concrete leads to a significant reduction in vertical members. The study also points out that relatively more CO2 is emitted when high-strength concrete is applied although it is possible to reduce CO2 emission by substituting a portion of cement with industrial wastes or by-products such as blast furnace slag.
Another endeavour to reduce carbon dioxide in the building construction industry involves constructing a building with optimal design. This approach is closely related to the structural design of a building. Baek et al. [19] investigated the relation in CO2 emissions between different types of building structures. They compared a block type (i.e., bearing wall system) that is commonly used in constructing apartment buildings in South Korea, to a column and beam system. The results indicate that the structural systems have a significant influence on lowering carbon dioxide emissions during the construction stage. Additionally, they also consider CO2 reductions in terms of material substitution from normal strength concrete to high strength concrete. They insist that, although the total emissions of CO2 in high strength concrete exceeds those in normal concrete, CO2 emissions are reduced when blast furnace slag is added, up to 20%. Kim et al. [20] suggest three ways to reduce CO2 emissions of concrete structures based on building type and regional attributes. They indicate that high-strength concrete is effective in lowering the occurrence of carbon dioxide, since the application of high-strength concrete requires a reduced quantity of reinforcing bars and concrete. The concrete mix design adds an appropriate admixture, such as blast furnace slag, and constitutes a method to reduce CO2 emissions in concrete structures. Finally, minimising the distance between the ready-mixed concrete plant and the construction site is important with respect to the emissions of carbon dioxide that occur during the transportation of construction materials. However, the proposed methods only assessed CO2 emissions during the construction stage including raw material, transportation, and manufacturing. Thus, its application is extremely limited for the evaluation of Life Cycle CO2 (LCCO2) for concrete structures. Additionally, they did not consider other construction materials, such as reinforcing bars, paint, glass, and insulating materials, although the concrete includes significant amount of CO2 emissions. Moreover, Park et al. [21] propose an optimal design method of steel reinforced concrete in high-rise buildings. They maintain that a main source of emitting carbon dioxide in construction corresponds to construction materials. Thus, the results indicated that this reduces the amount of CO2 emissions when the structural design considers the CO2 emission and reflects the results in this phase. In the study, the application of high-strength materials, such as high-strength concrete and steel, is extremely effective in reducing the emissions of carbon dioxide although the initial cost and the unit CO2 emission exceed those of the normal materials. According to the above-mentioned assertion, the input amount of high-strength materials is a main reason for the reduction in costs and CO2 emissions.
Nadoushani and Akbarnezhad [22] examined the relationships between different structural systems and carbon footprints of buildings as opposed to the replacement of low-carbon materials. They suggest that relatively little research has focused on the selection of the structural systems to reduce the carbon footprint of buildings. Additionally, they point out that most studies consider the application of low-carbon materials as the consequence of structural design. However, Nadoushani and Akarnezhad [22] suggested that comprehensive assessment of embodied carbon and operating carbon during the structural design is very important for life cycle carbon assessment. For example, steel structures have relatively low embodied carbon, but a high level of operating carbon since the thermal mass is considerably lower than that of concrete structures. In a nutshell, selection of the best structural design alternative to reduce the carbon footprint should be based on the effects of the structural system on the life cycle carbon footprint rather than the carbon footprint of individual life cycle phases.
Reinforcing bars are considered as a main construction material when considering Life Cycle Assessment (LCA), Life Cycle Inventory Database (LCI DB), and LCCO2 [22,23,24,25]. Although reinforcing bars are regarded as a main carbon dioxide emitter in the AEC industry, very few studies examined the reduction in CO2 emission from the application of re-bars. In South Korea, Choi et al. [23] suggest a new method to calculate the basic unit of CO2 emission of re-bars by applying an individual integration method. However, this study focuses on new ways to quantify the amount of CO2 from cradle-to-gate instead of the application of LCCO2 assessment. Moreover, Han and Kim [24] propose that the application of high-strength materials, such as concrete and reinforcement bars, is an effective way to lower the occurrence of carbon dioxide in reinforced concrete, although they did not support the practicality of applying high-strength materials. Along with these studies, Hong et al. [25] calculate and establish a carbon dioxide emission database of structural steel materials by using input–output analysis (e.g., deformed bars and H-beam). According to Hong et al. [25], an extremely important factor in the calculation of carbon dioxide of a material by adopting the input–output analysis involves considering manufacturing processes and the efficiency of manufacturing processes. If there are differences in the process and the energy efficiency of manufacturing in the same product, then the emission of CO2 differs based on the two factors. Thus, both process and energy efficiency crucially impact the calculation of CO2 on a certain material in the input–output analysis. Despite this approach to calculate CO2 emissions of structural materials, it is necessary to study the effectiveness and relationships between the implementation of high-strength re-bars and normal re-bars. To fill this gap, this study examines the reduction of reinforcement bars and CO2 emissions by the implementation of high-strength re-bars in three different structural types.
3. Research Method
3.1. Calculating the Quantity of Re-Bars in the Different Building Structures
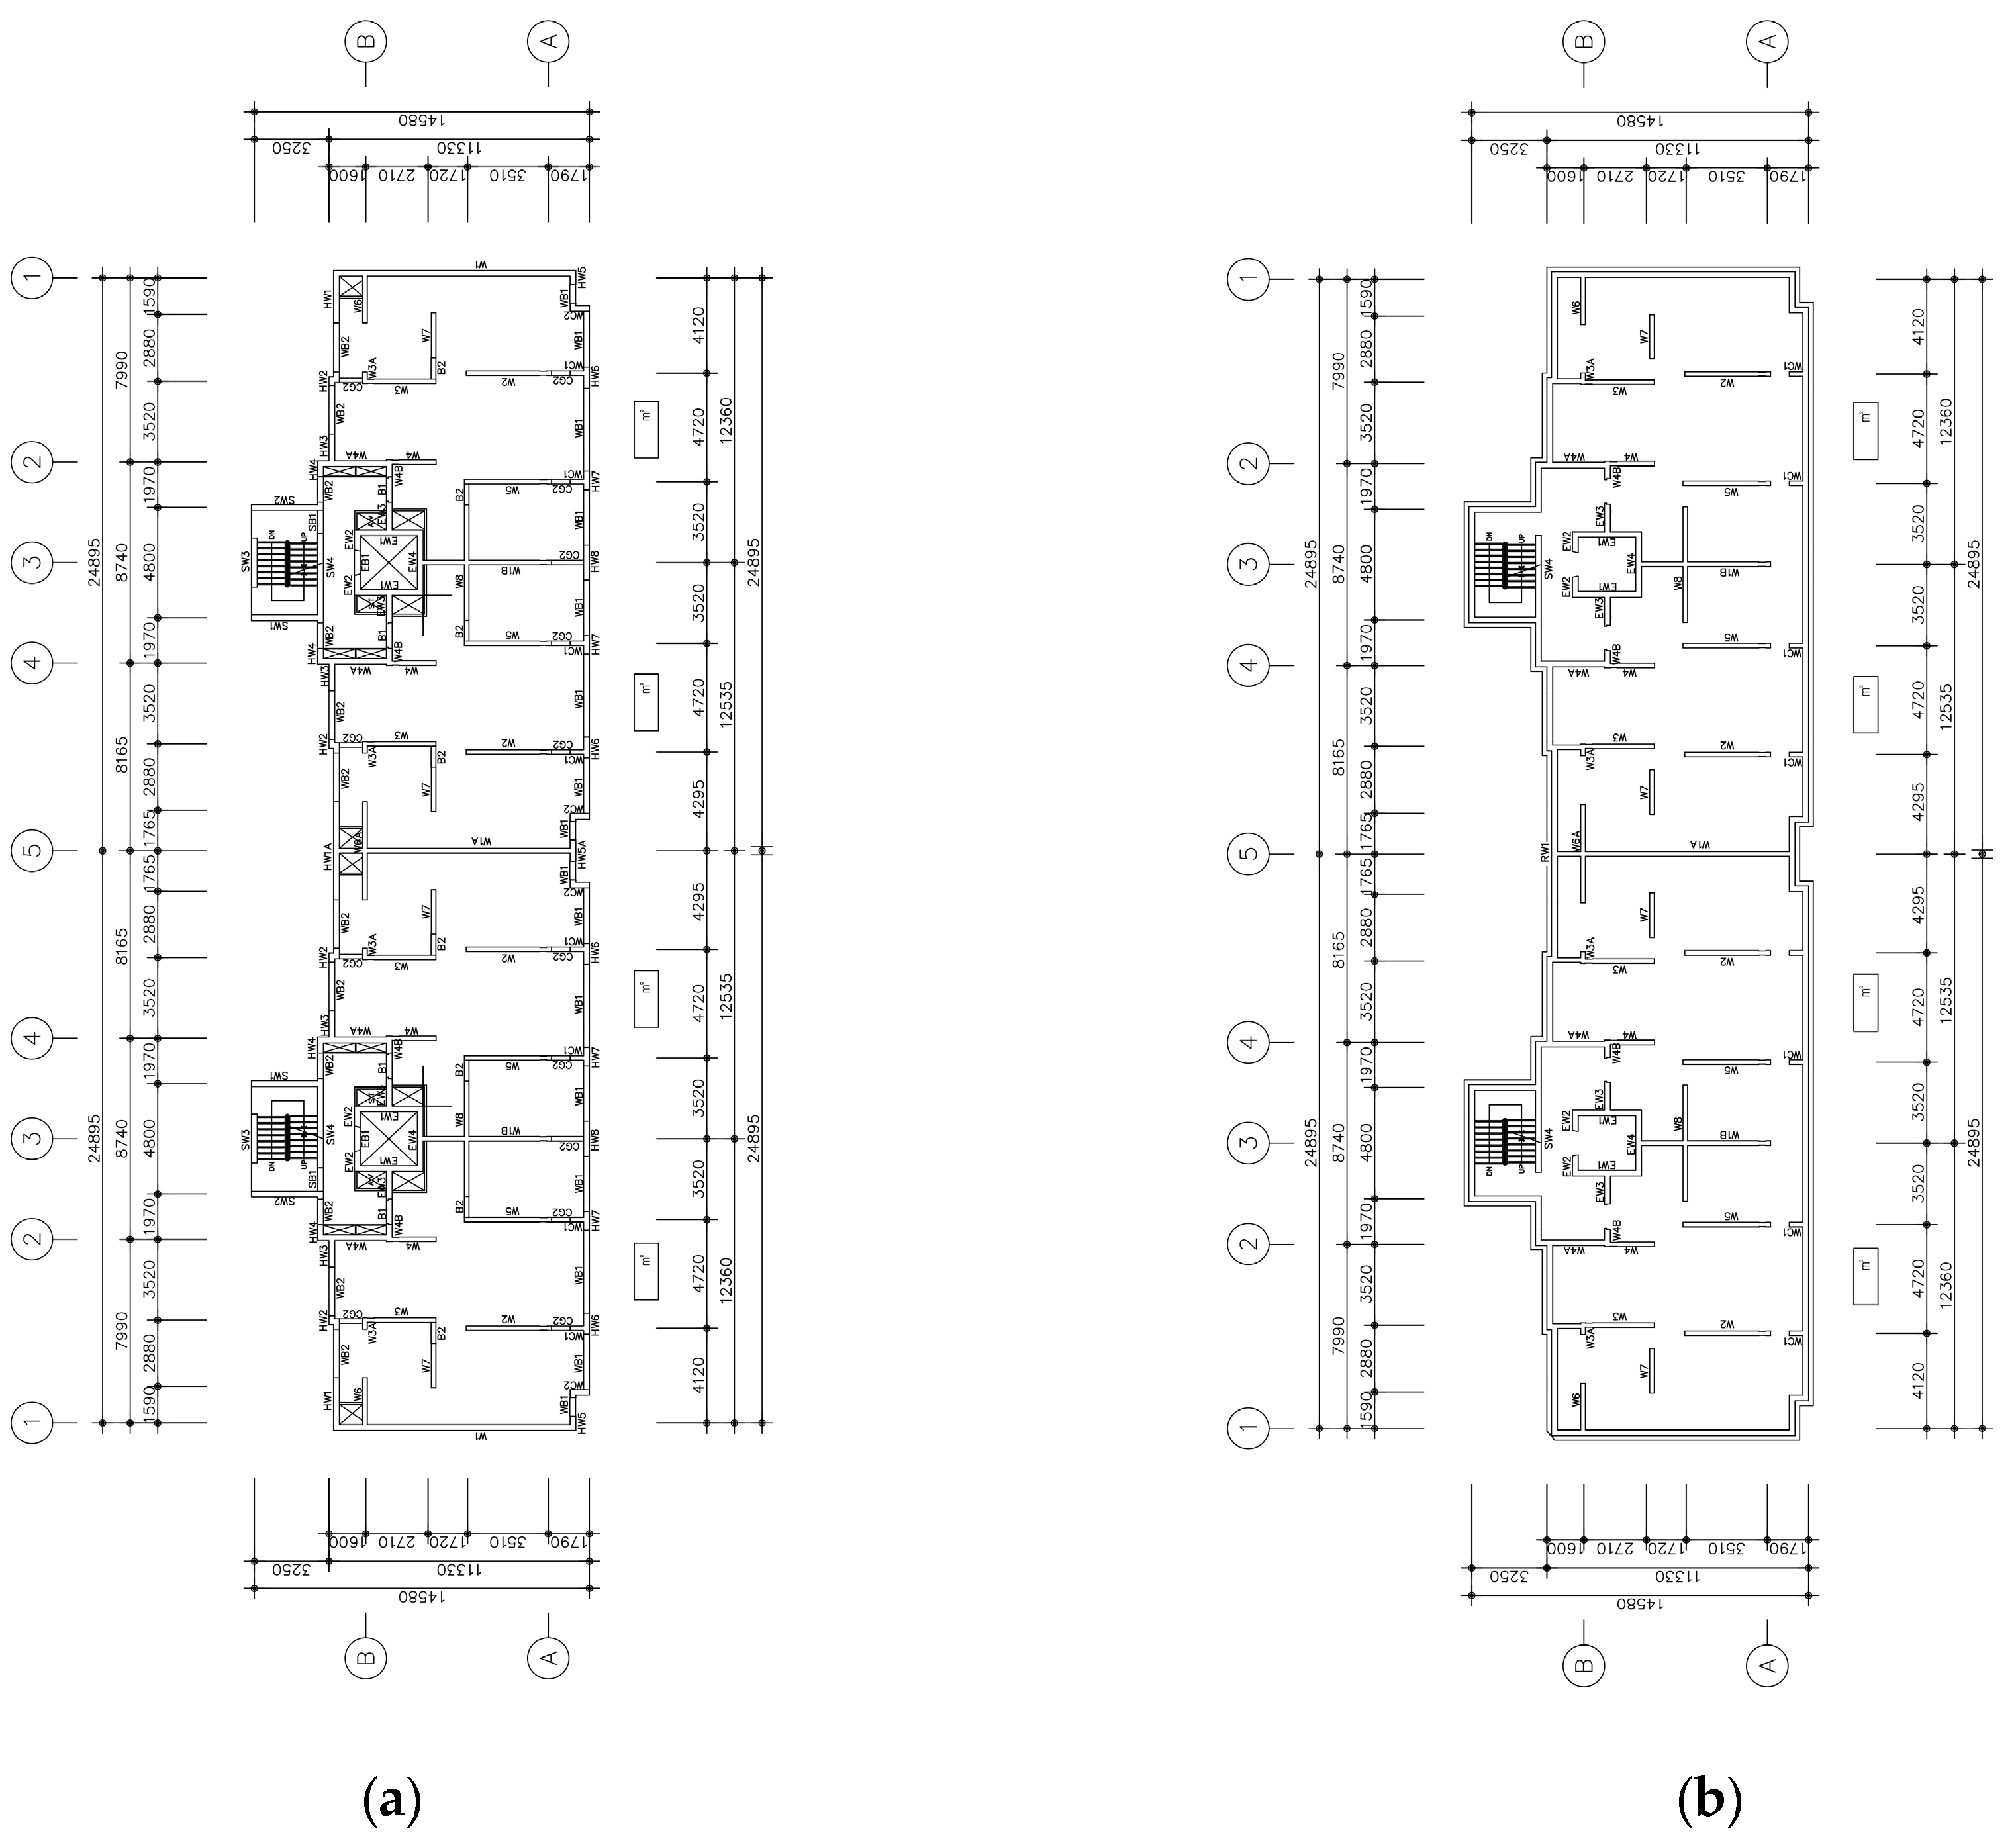
In this study, three different types of buildings, namely an office complex building, an apartment, and a residential–commercial complex building, were selected to compare the quantity variation in terms of reinforcing bars. The office complex building had a rigid-frame structure and is 25 storeys above the ground and one floor underground. The selected apartment building is one of the most popular hosing building types in South Korea and was constructed with a bearing wall system. The structure included 25 storeys aboveground and one floor underground with a mat footing system. The last model system was a residential–commercial complex building structure with a flat plate system. It included 43 floors aboveground and one floor for the basement with a mat footing system. A structural summary of the three models is indicated in Table 1. Additionally, the floor plans of the studied structures are shown in Figure 1, Figure 2 and Figure 3.
The three models were designed in compliance with Structural Concrete Design Code and Commentary by Korea Concrete Institute [26]. As shown in Table 2, the load factors, including seismic and wind loads, satisfied the Korean Building Code: Structure [27] as established by the Architectural Institute of Korea.
3.2. Calculation of Carbon Dioxide Emissions on Re-Bars by Using Yield Strength and Diameter
There are two approaches to establish Life Cycle Inventory (LCI) database: the individual integration method and the economic input–output analysis method [28]. The individual integration method involves investigating a product’s relevant data from manufacturing to demolition and subsequently accumulating the collected data of a product’s energy consumption and carbon dioxide emissions. Normally, this method complies with ISO14044 [29] and ISO21930 [30] standards. Based on this, the system boundary of a target material, such as cradle-to-gate or cradle-to-grave, is applied to calculate the carbon dioxide emissions of a material. The economic input–output analysis method involves quantifying the industrial relationships of materials in an input–output matrix.
The input–output matrix represents all the interactions amongst industrial sectors in a comprehensive manner [19,31,32,33,34,35,36,37]. The data in the input–output matrix are normally derived from the National Statistics and Census data. For example, a glass panel manufacturer requires silica sand, other chemicals, and electricity. While direct suppliers perform measurements by analysing ingredients of glass, indirect suppliers, such as those for office equipment, papers, and others, might be excluded. Each unit of glass that is produced causes environmental discharges in other industry sectors that may range in several orders of magnitude. The input–output analysis method is expensive and time consuming, since inputs and environmental burdens must be collected either directly or obtained from extant studies, if they are available [33,36,37]. Despite the above-mentioned difficulties in establishing the input–output analysis method of LCI, it is useful and efficient to predict the direct and indirect industrial impacts on the national economy [31,37]. The input–output analysis method facilitates the calculation of energy consumption and carbon dioxide emissions. In this study, the economic input–output analysis was adopted as a method to obtain CO2 emissions of normal strength reinforcement bars and high-strength reinforcement bars.
In this study, the input–output analysis was adopted to calculate the CO2 emission of deformed bars using yield strength and diameter. This approach involves the analysis of relation of economic analysis based on the inter-dependencies of economic sectors [32,34]. The basic assumption of the input–output analysis is that the production of a material is intertwined with several different processes and involves direct and indirect manufacturing such that the economic value analysis makes it possible to summarise the influx of material consumptions. To calculate the emission of CO2 on re-bars, it is necessary to refer to production inducement coefficients and the unit price of materials [38]. Table 3 shows production inducement coefficient of the structural steel [38]. Additionally, Table 4 indicates the unit price of the reinforcing bars that were examined in this study [39].
Table 5 displays the energy consumption and CO2 emissions of deformed bars by yield strength and diameter. The detailed explanation of calculating the CO2 emissions by yield strength and diameter is shown in Appendix B.
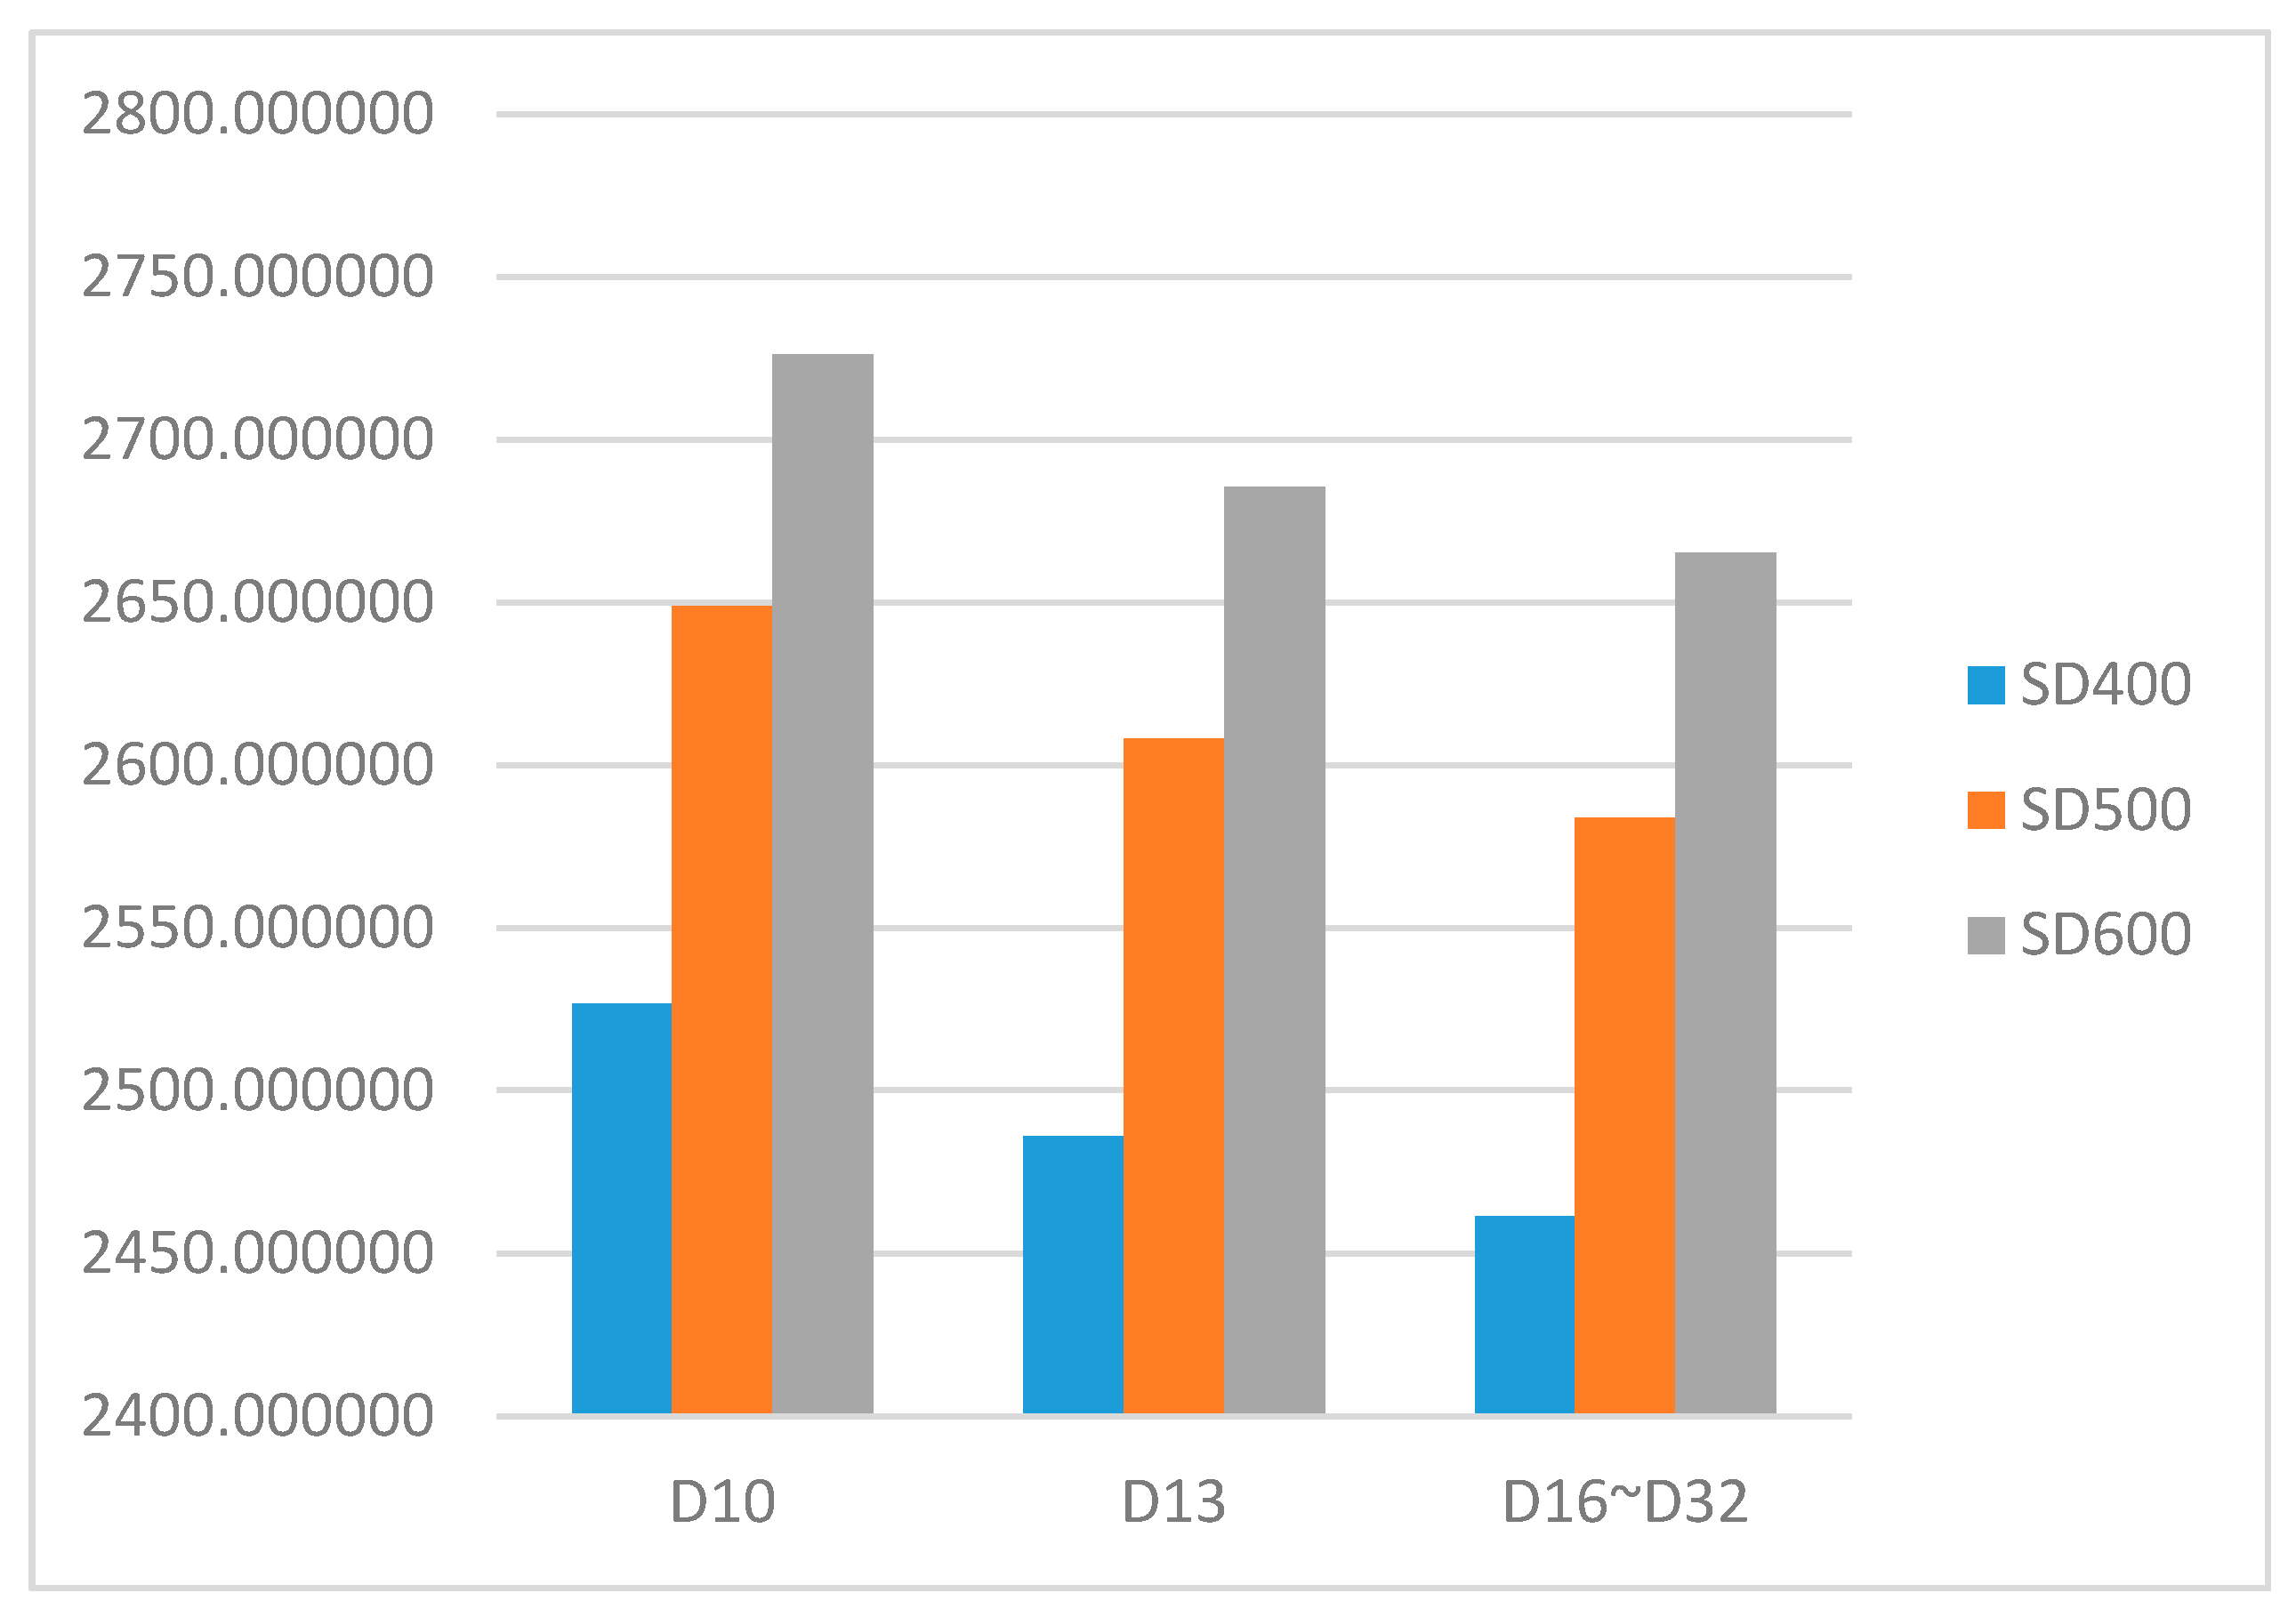
Based on the data shown in Table 5, the CO2 emissions of the reinforcement bars on D10 were computed as 2526.611924 kg-CO2/ton, 2648.867339, and 2726.295769 kg-CO2/ton for SD400, SD500, and SD600, respectively. The CO2 emissions of D13 and D16 re-bars exhibited a tendency similar to D10, as shown in Table 5. With respect to the D13 reinforcement bars, SD400, SD500, and SD600 emit carbon dioxide corresponding to 2485.860118, 2608.115534, and 2685.543964, respectively. The calculated results of D16 were 2461.409035, 2608.115534, and 2665.169062 for SD400, SD500, and SD600, respectively. Generally, the emissions of carbon dioxide increased when the yield strength of the reinforcement bars was increased as shown in Figure 3.
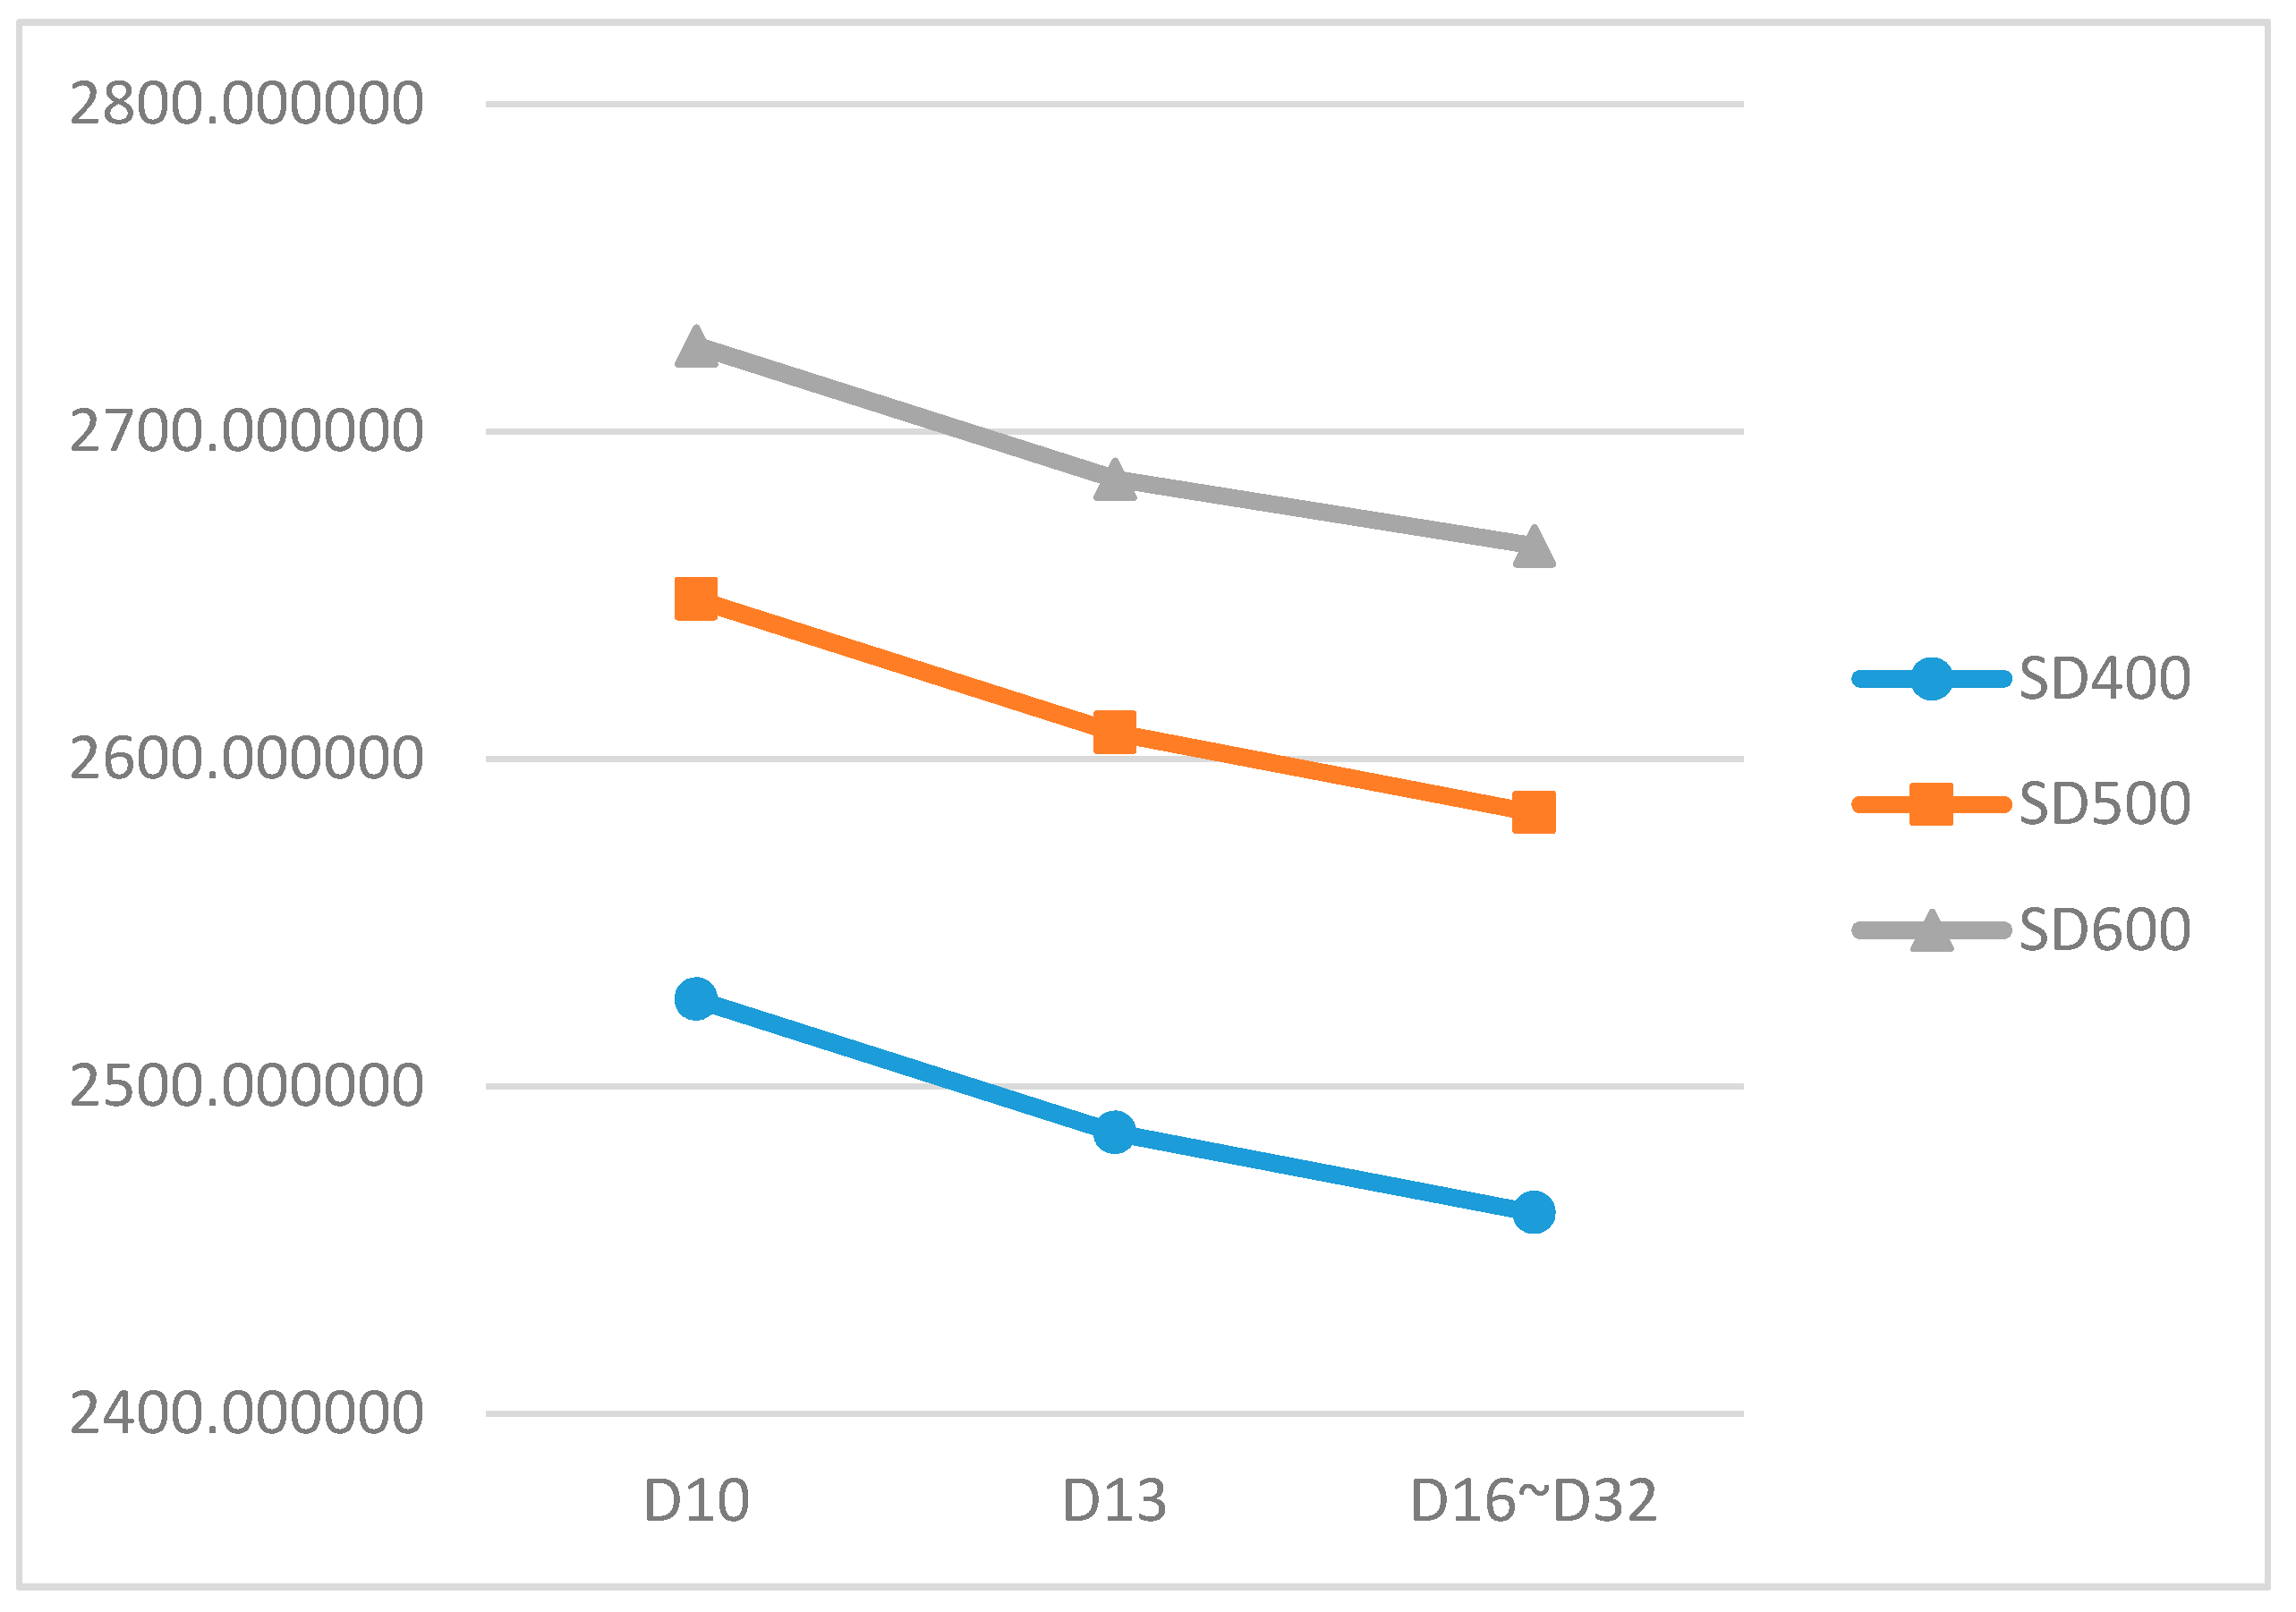
Additionally, the emissions of CO2 relative to variations in the diameter of reinforcement bars were compared as shown in Figure 4. The emissions of carbon dioxide decreased when the diameter of SD400 increased by D10, D13, and D13–D16. According to the computation results, SD400 with D10 corresponded to 2526.611924, D13 corresponded to 2485.860118, and D13–D16 corresponded to 2461.409035. This trend was similar to those of the other deformed bars (SD500 and SD600) while the diameter generally increased.
4. Data Analysis
4.1. Analysis of the Quantity of Reinforcement Bars
The quantity variation of reinforcement bars in the three different structural types of buildings are shown in Table 6 and the detailed process of computing the quantity of each structure is displayed in Appendix A. The ratio of vertical to horizontal members in the rigid-frame structure (Rahmen structure) was approximately 35:65. When the normal strength reinforcement bars (SD400) were replaced with the high-strength bars (SD500 and SD600), beams or girders and footings were the most effective members with high-strength deformed bars in the rigid-frame structure. The reduction ratio of re-bars in beams or girders was 20.8% for SD500 and 32.0% for SD600, when compared with those of the normal strength deformed bars (SD400). Additionally, the results indicated 18% of quantity reduction ratio for SD500 when compared to SD400 and 21.2% decrease in quantity with SD600 when compared with SD400 reinforcing bars in footings. The quantity variation on the slabs increased when the high-strength deformed bars are implemented, as shown in Table 6. The computed results show that the quantity variation increased by 8.3% and 27.3% in for SD500 and SD600, respectively, when compared with those of SD400. While the amount of main reinforcement decreased when the high-strength re-bars were applied to slabs, thermal cracking control reinforcement was also used, although it was not required to resist the internal and external forces.
The reduction ratio of reinforcement bars in the apartment buildings was less effective than those of the other two structures. With respect to the total quantity reduction ratio of re-bars in the apartment buildings, the data show that 5.1% and 9.7% of reinforcement bars were reduced in the case of SD500 and SD600, respectively, when compared with those of SD400 re-bars. The highest reduction ratio in the bearing wall system (i.e., apartment buildings) corresponded to the footing. As shown in Table 6, the results show a 16.4% reduction ratio for SD500 and 26.8% reduction ratio for SD600 when compared with those of SD400 deformed bars. Conversely, the reduction ratio on walls in the apartment buildings was relatively smaller when compared with those of other components.
The reduction ratio of reinforcing bars in the apartment building was the least amongst the three studied models. The apartment building with a bearing wall system accounts for more than 50% of reinforcement on walls. However, the amount of reduction on walls was lower than those of the other structural systems in this study. This could be because the vertical reinforcement is regulated by the minimum reinforcement and minimum area of re-bars as opposed to the internal forces of members. Thus, the reduction ratio of the horizontal members exceeded those of the vertical member since the reinforcement in the vertical members above certain floors was controlled by the minimum reinforcement ratio instead of the member’s internal forces. Among the horizontal members, beams or girders and footings exhibited considerable lowering tendencies as well as similar reduction ratios. Conversely, slabs displayed a different trend of reduction ratio based on the size and yield strength of the deformed bars. The reason for this result could be due to the thermal cracking control reinforcement on slabs that did not indicate any reduction ratio, although the quantity of main reinforcement was lowered by a significantly high amount.
4.2. CO2 Emission Analysis of High-Strength Reinforcement Bars
4.2.1. The Overview of the Total CO2 Emissions
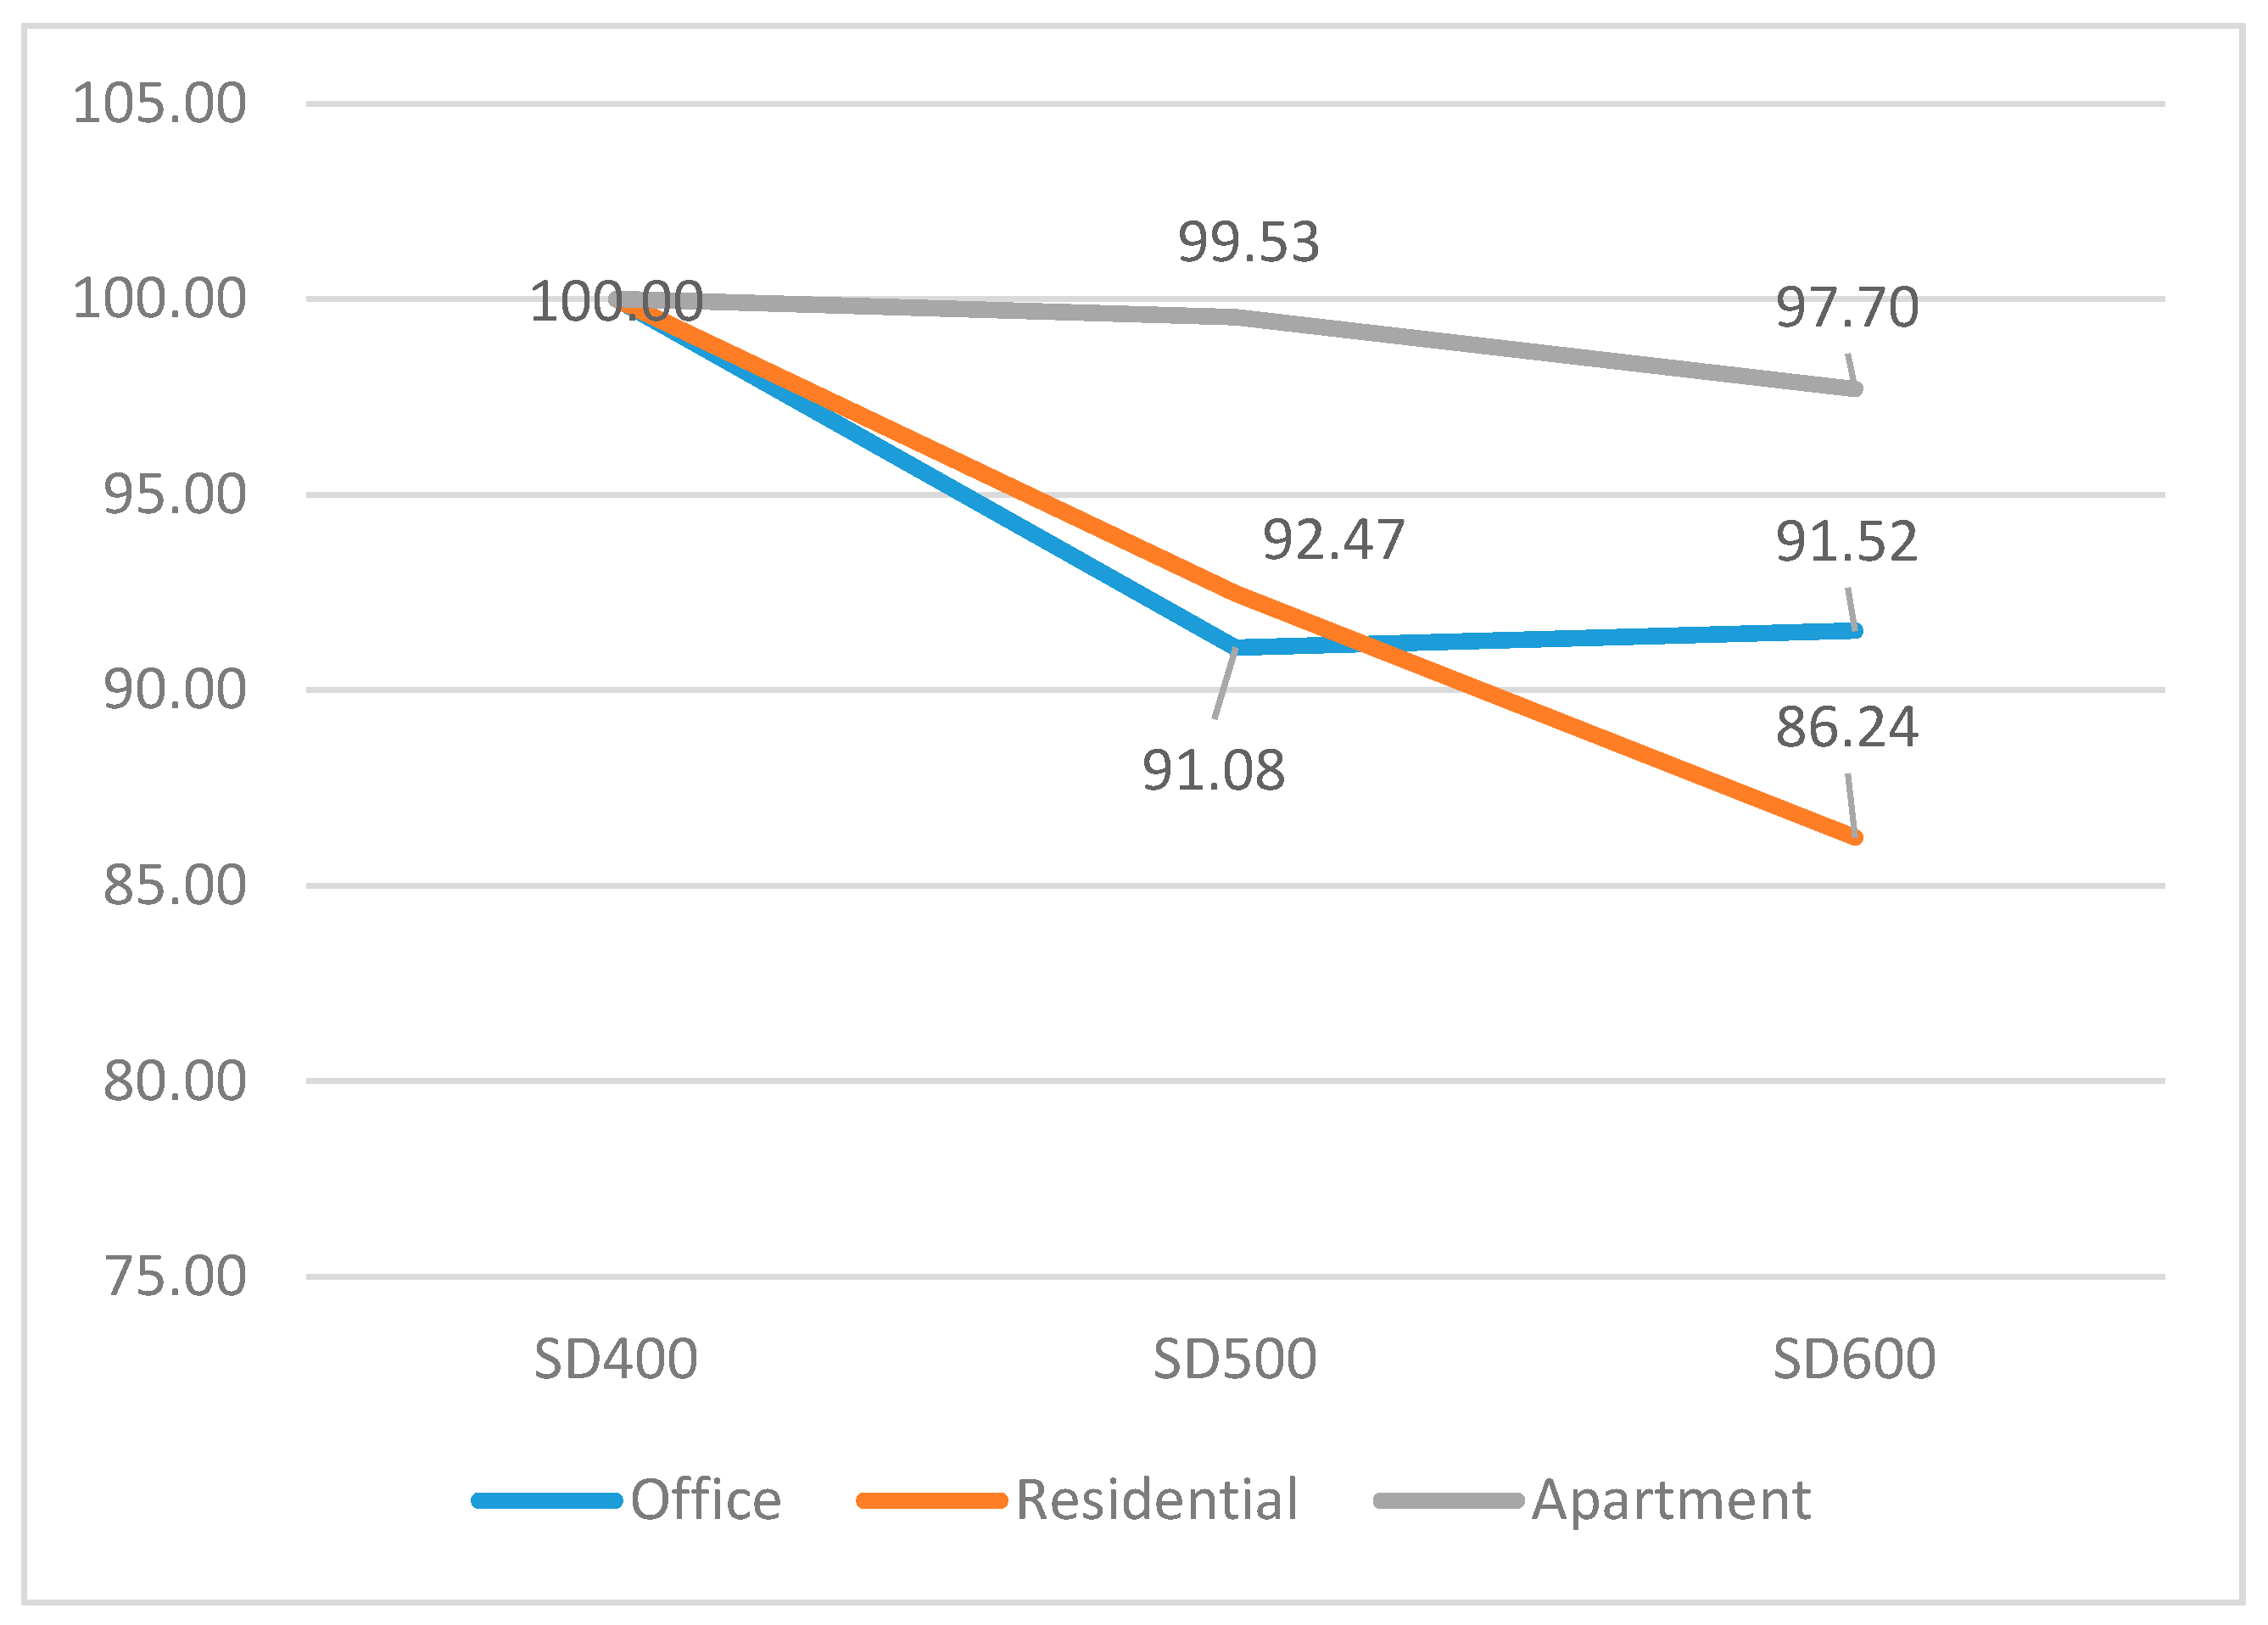
The total quantity of CO2 emissions is the sum of carbon dioxide emissions from main components, which include slabs, beams or girders, walls, columns, and footings. For the office building with the rigid-frame structure, the emissions of CO2 were reduced when high-strength reinforcement bars were applied in the structure. When the building was designed with SD500, the total quantity of CO2 emissions was reduced by 8.92% when compared to those of SD400. Although the use of SD600 showed a slight increase in the carbon dioxide emissions, the emissions of CO2 were reduced when compared to those of SD400. The application of SD600 re-bars indicated that the CO2 emissions were lowered by 8.48% when compared to those of SD400. Thus, the application of SD600 reinforcement bars in the rigid-frame structure leads to a slight increase in CO2 emissions (0.44%) when compared with the application of SD500 re-bars. In this study, the implementation of SD500 deformed bars in the rigid-frame structure corresponds to the most effective method to minimise the emissions of CO2 (see Figure 5).
Although the reduction ratio of carbon dioxide in the bearing wall system structure (the apartment building) was relatively smaller than the other structures, it showed a reduced tendency with respect to the implementation of high-strength reinforcement bars. As shown in Figure 6, the application of SD500 and SD600 exhibits 0.47% and 2.30% reduction ratios of CO2, respectively, when compared with those of SD400. The residential–commercial complex building that was designed with the flat plate structure exhibited the most effective reduction ratio of CO2 among three different structures with the use of the high-strength reinforcement bars. The application of SD500 in the residential–commercial complex building showed similar results with the office building corresponding to a 7.53% reduction ratio when compared to the implementation of SD400 reinforcing bars. The CO2 emissions from the application of SD600 re-bars were significantly lowered in the flat plate structure. The results indicated that the reduction ratio on SD600 when compared with that of SD400 was 13.76%. The CO2 reduction ratio of each component in the three different structures is compared in the following section.
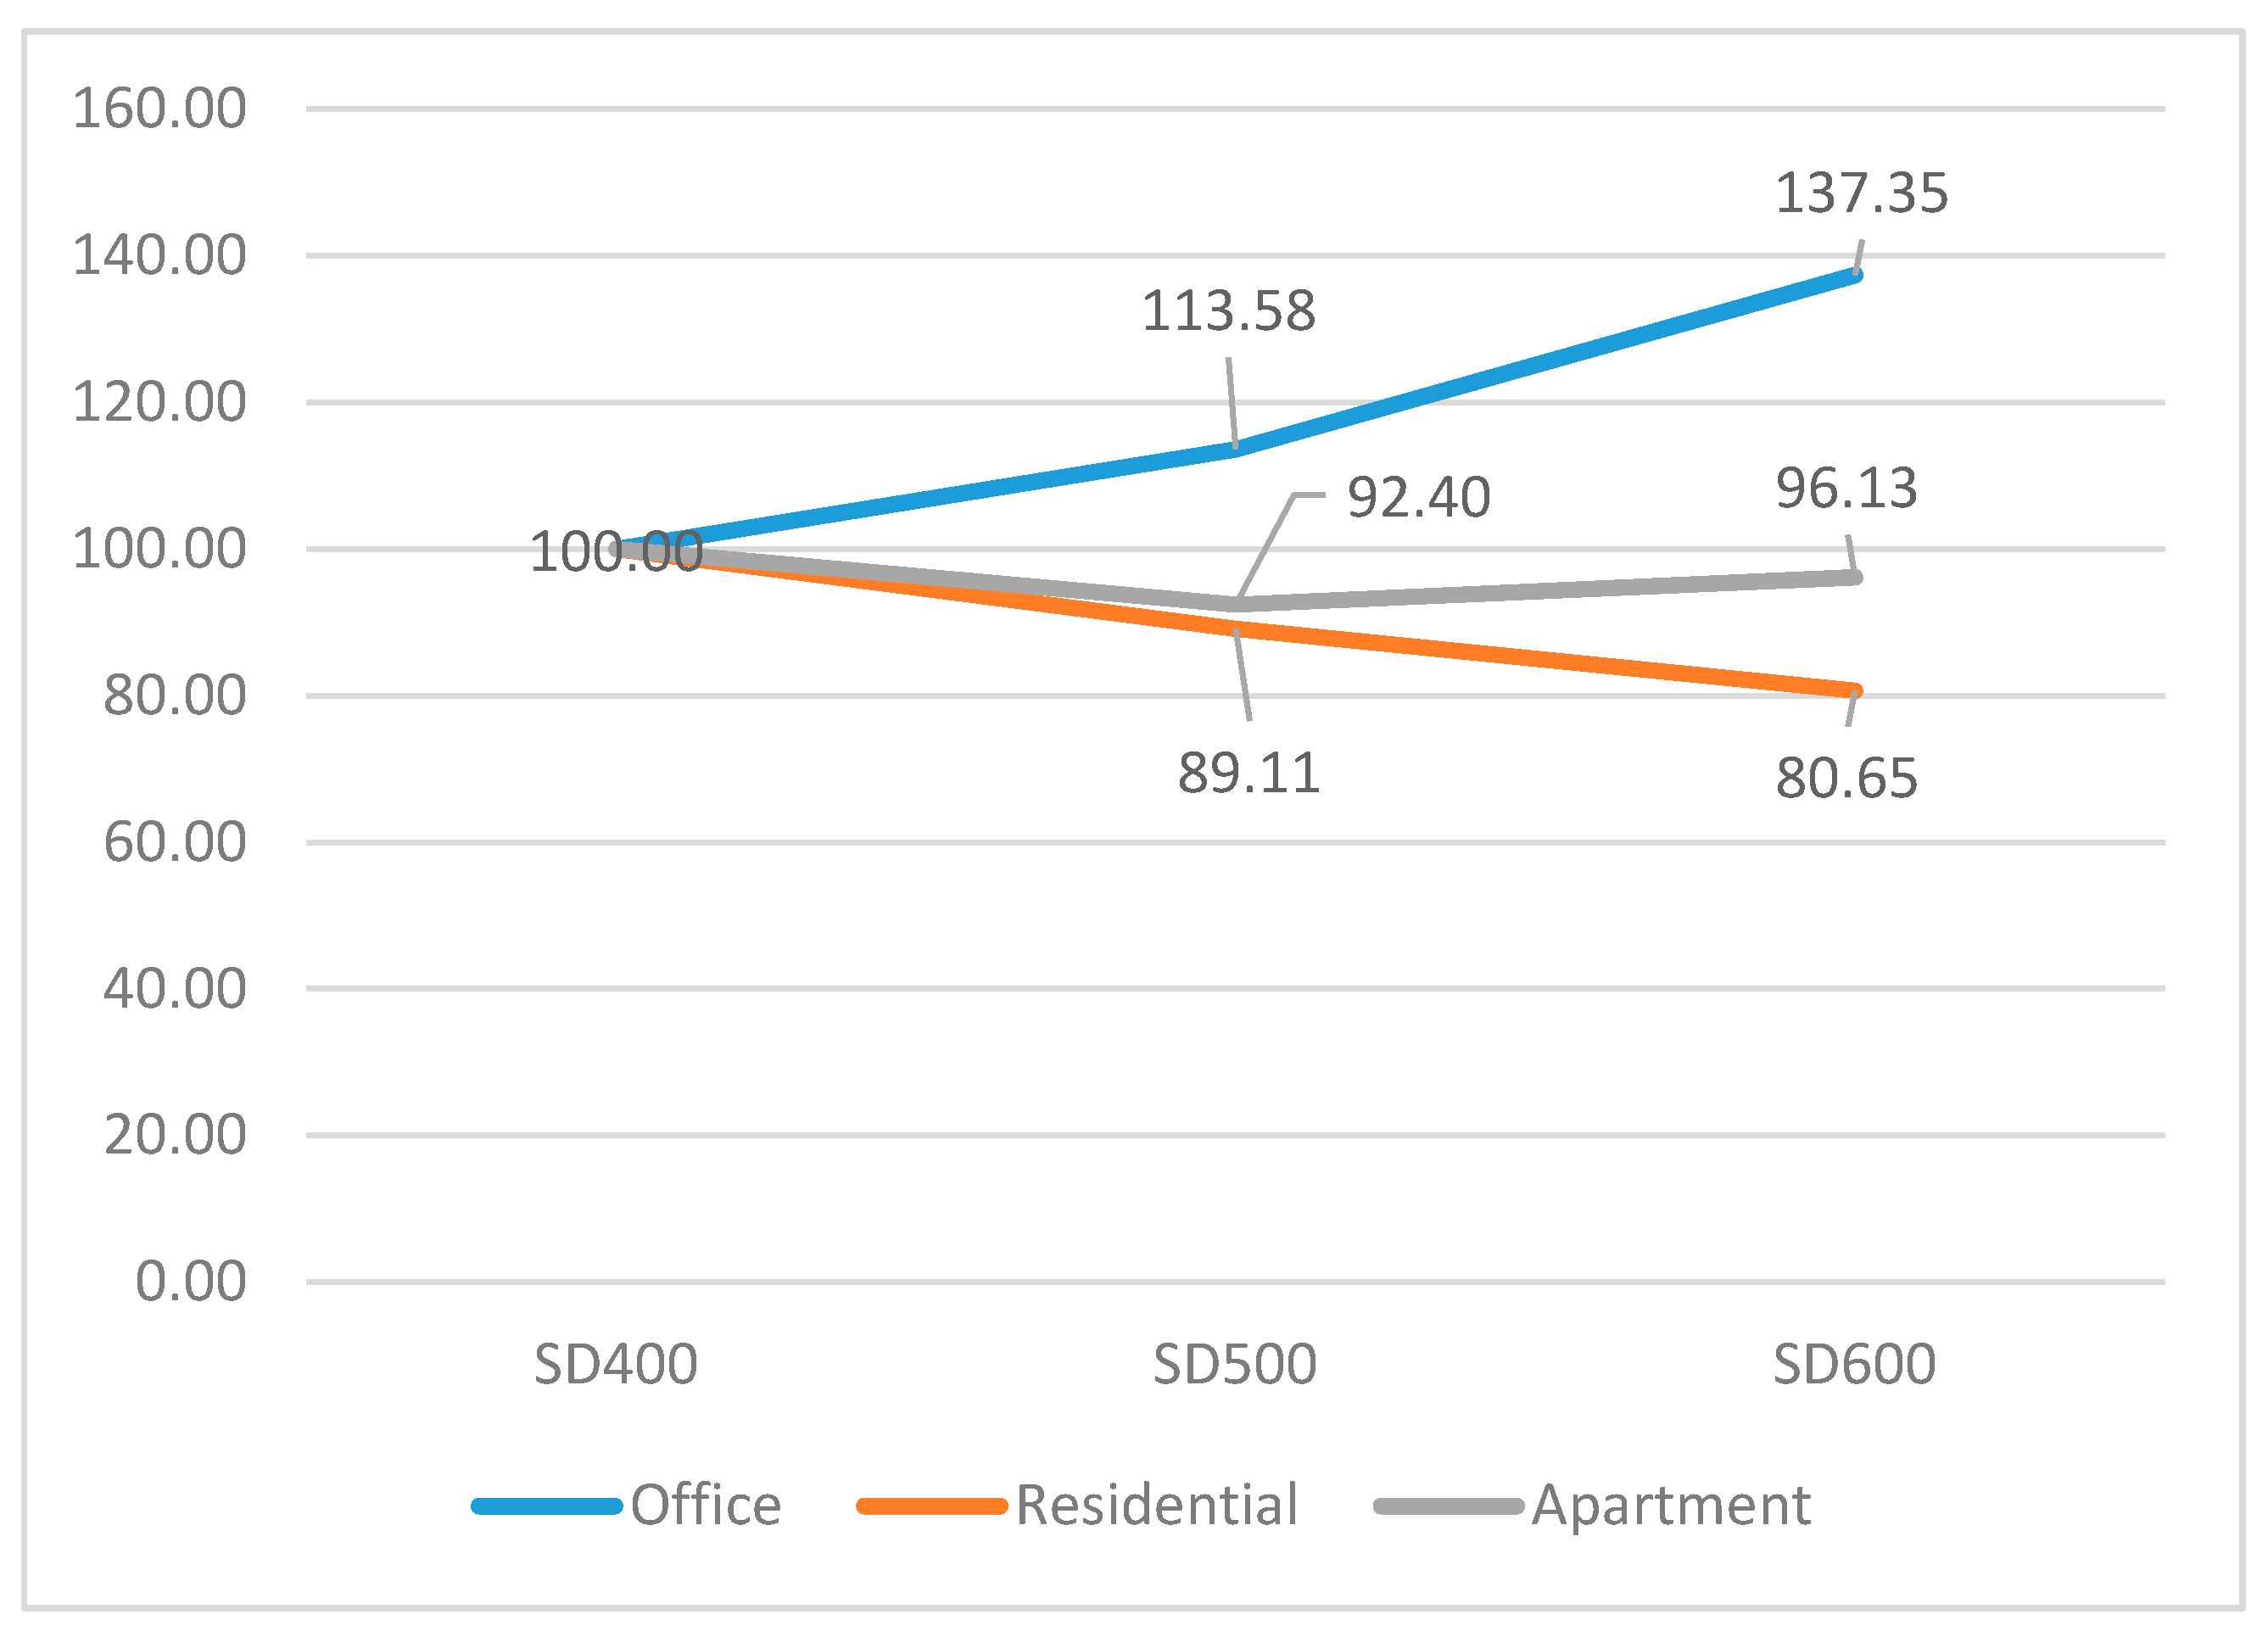
4.2.2. CO2 Emissions on Slabs
The CO2 emissions of the residential–commercial complex building and the apartment building reduced when the high-strength reinforcement bars were applied to the slabs. The implementation to the residential–commercial complex building was significant because the reduction ratio was the highest among the three different structures. When the strength of the reinforcement bars increased due to SD500 and SD600, the reduction ratio reduced by 10.89% and 19.35%, respectively (see Figure 7).
With respect to the apartment building, the CO2 emissions also reduced when the high-strength reinforcement bars were applied to slabs. The reduction ratio of CO2 on SD500 and SD600 reinforcement bars was 92.40% and 96.13%, respectively. However, the reduction ratio of SD600 re-bars slightly increased compared with that of SD500 (which corresponded to 3.73%). This result was because of the high increase in the ratio for the input material of splice and development of slabs in the apartment building.
The reduction ratio of the office building was completely different between the two building types. An increase in the yield strength of re-bars caused the reduction ratio of CO2 to exhibit an increasing tendency. The application of SD500 and SD600 deformed bars indicated increases corresponding to 13.58% and 37.35%, respectively, when compared with those of SD400. Hence, the quantity of splice and development was significantly higher than the quantity reduction in the main reinforcement on slabs in the office building.
4.2.3. CO2 Emissions on Beams or Girders
The CO2 emissions reduction ratio of beams or girders exhibited distinct characteristics based on the structural type of the building. With respect to an office building, the CO2 emissions reduction ratio displayed a decreasing tendency when the high-strength reinforcement bars were applied to beams or girders. When SD500 re-bars were applied to the beams or girders in the apartment building, the reduction ratio achieved a 16.20% reduction ratio of CO2. Additionally, the results demonstrated a 26.06% reduced amount of carbon dioxide when the SD600 reinforcing bars were implemented (see Figure 8).
The residential–commercial complex building showed a slight increase in CO2 emissions when high-strength re-bars were applied to the beams or girders. The use of SD500 and SD600 re-bars indicated 3.37% and 2.49% increase in CO2, respectively. This result can be used to analyse whether a difference exists between the utilisation of high-strength re-bars and normal re-bars for lowering the CO2 emissions on beams in a residential–commercial complex building.
The last model (the apartment building) displayed a unique CO2 reduction ratio movement. While the application of the SD500 deformed bars yielded an increase in CO2 emissions of approximately 10%, the SD600 re-bars indicated a reduction in CO2 emissions by 12.94%. This effect may be caused by a significant quantity reduction in splice and development by using SD600.
4.2.4. CO2 Emissions on Columns
The CO2 reduction ratio for columns, as shown in Figure 9, were compared for the office and residential–commercial complex buildings since the structural system of an apartment building corresponds to a bearing wall system. Generally, buildings with a bearing wall system resist loads and external forces through the bearing walls without columns.
The office building with the rigid-frame structure and the residential–commercial complex with the flat-plate system exhibited a decreasing tendency of carbon dioxide emissions when the high-strength reinforcing bars were applied to the columns. In the office building, the application of SD500 exhibited 91.24% that corresponded to 8.76% reduced CO2 emissions when compared to SD400. The result for the use of SD600 showed 5.38% reduced CO2 emissions over SD400, although it slightly increased when compared to SD500.
Conversely, the application of the high-strength reinforcement bars in the residential–commercial complex exhibited a gradual decrease of 8.77% and 17.31%, respectively, when the yield strength increased due to SD500 and SD600. A potential reason for this could be the design regulations of columns that are designed with respect to the minimum reinforcement ratio as opposed to the resistance of the internal forces on columns. This design practice leads to a significant reduction ratio of reinforcement bars on columns as well as a reduction in the carbon dioxide emissions.
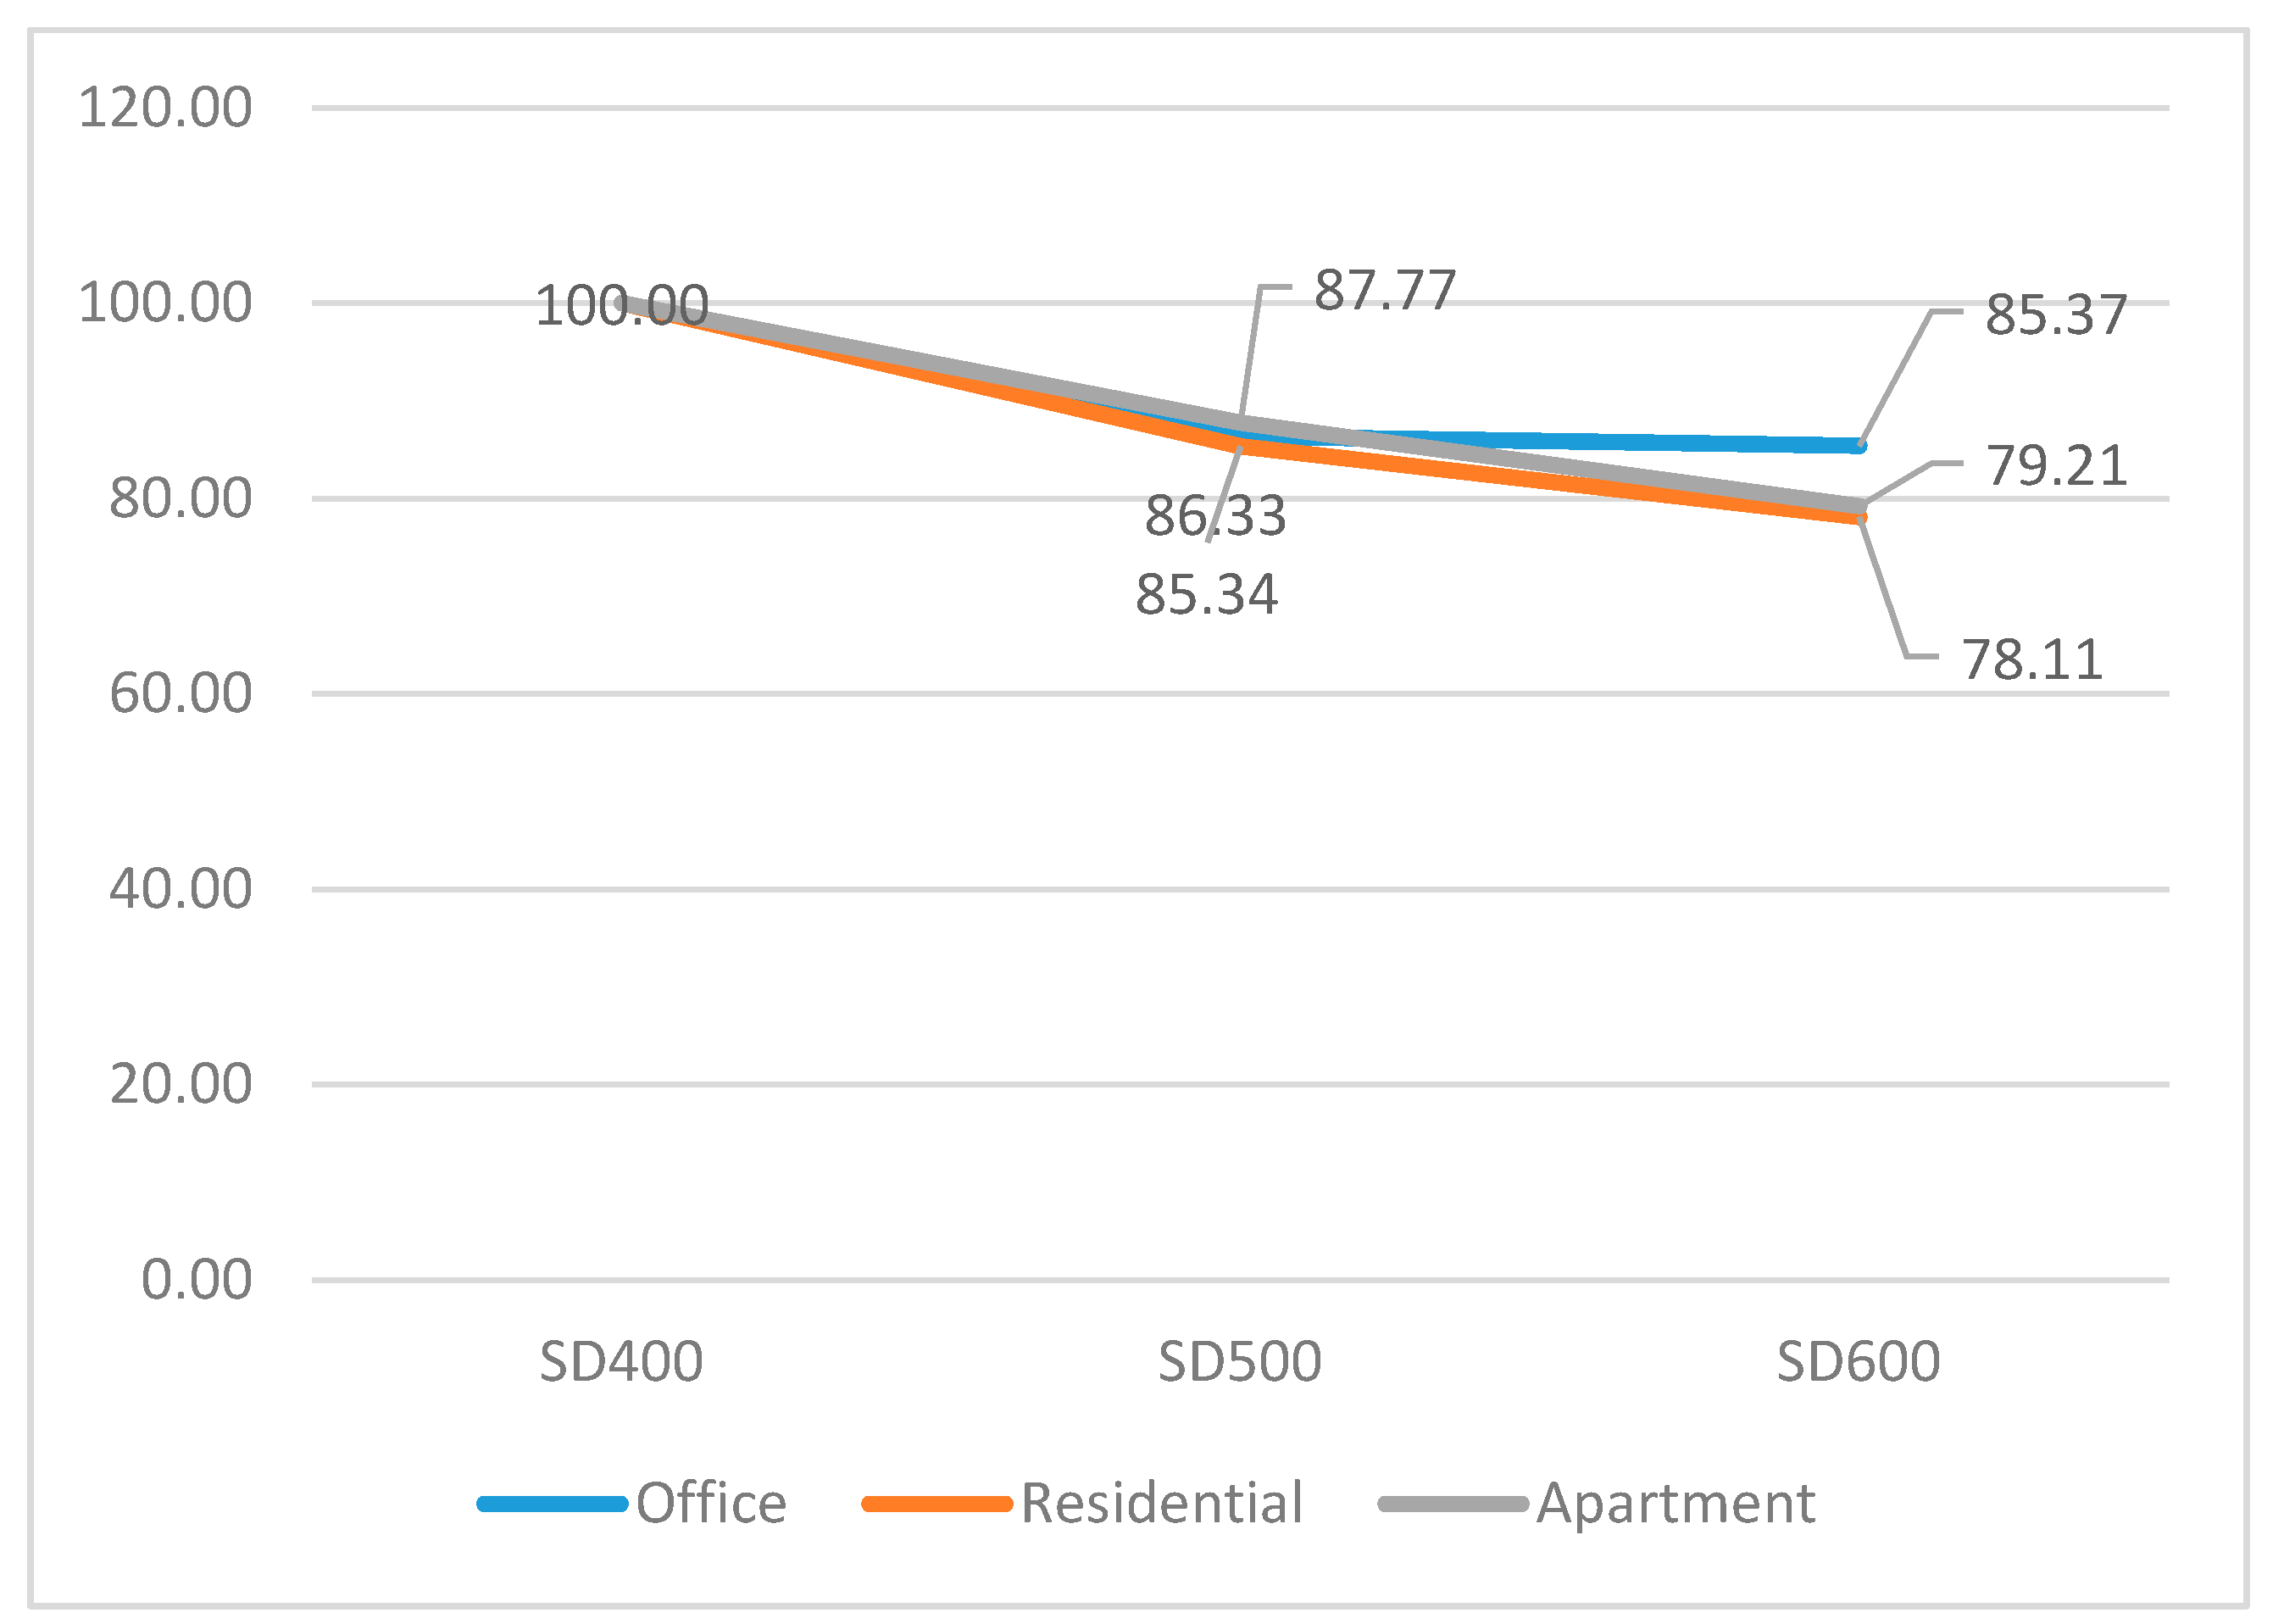
4.2.5. CO2 Emissions on Footings
The CO2 emissions reduction ratio of footings in the three types of buildings showed a decreasing tendency when the strength of reinforcement bars increased (see Figure 10). Additionally, the reduction ratio of three different structures was significant when compared with other components in the building system. Thus, reductions in carbon dioxide emissions on footings in the rigid-frame structure, flat-plate structure, and bearing wall system may be desirable when the footing is designed by implementing the high-strength reinforcing bars. The implementation of SD500 for the footing indicated similar data around 80% that approximately corresponds to a 15% reduction in carbon dioxide emissions. Among the three structural systems, the reduction ratio of the office building was relatively smaller when SD600 re-bars were applied to footings. The others (i.e., the apartment building and the residential–commercial complex) exhibited approximately 30% lowered CO2 emissions of SD600 re-bars. In contrast, the data of the apartment building exhibited a reduction ratio approximately corresponding to 15%.
Based on the results of this study, the rigid-frame structure and the flat plate structure are most effective when high-strength reinforcing bars were applied. Additionally, the effectiveness of SD500 reinforcement bars exceeded that of SD600 re-bars in the two structures. The application of SD600 yields a reduced amount of carbon dioxide emissions. However, the reduction ratio of SD600 slightly increased compared to the application of SD500 deformed bars. Therefore, the use of SD500 re-bars suggests that it is the most effective material for reducing carbon dioxide emissions in the examined models. Although the application of high-strength materials is beneficial in reducing the amount of input material, the utilisation of excessively high-strength materials has a detrimental influence, rather than creating sustainable and eco-friendly construction. Thus, the implementation of high-strength reinforcement bars is required in building structures to carefully design the optimal carbon dioxide emissions, as well as to improve constructability and workability in construction sites.
5. Discussion and Limitation
The aim of this study involved analysing quantity reduction and carbon dioxide emissions lowering ratio given the application of high-strength re-bars to the three different structural systems.
In this study, the application of high-strength reinforcing bars in three different structural would be beneficial compared to normal strength re-bars. Besides, the reduced amount of deformed bars would directly connect to the cost of material. The reduction ratio of high-strength reinforcing bars was higher than the increment ratio of unit cost as the yield strength of deformed bars was increased.
The study adopted the input–output analysis to calculate the carbon dioxide emissions of reinforcing bars by using the yield strength and diameter. While previous relevant studies examined CO2 emissions of steel or re-bars in a comprehensive manner, it may be difficult to calculate the occurrence of carbon dioxide emissions, effectiveness, or sustainability for an individual material. The method adopted in the study fills the above-mentioned gaps in evaluating CO2 emissions of deformed bars of different yield strength and diameter.
Furthermore, this study confirmed that the replacement normal strength reinforcing bars to high-strength ones in reinforced concrete structures and buildings would be one of alternatives for low-carbon buildings or green buildings.
Although the applied CO2 calculation method in this study would contribute to evaluate the CO2 emissions of re-bars, the results of CO2 emissions using the input–output method exhibited slightly higher carbon dioxide emissions when compared with those in the individual integration method.
Furthermore, the input–output method is in a vulnerable position with respect to variations since the unit price of reinforcing bars changes based on the market situation. These factors may fluctuate the result of carbon dioxide emissions and deteriorate the reliability of the results. Thus, it is necessary to study or develop a new approach with respect to the CO2 emissions for re-bars by strength or size to adjust the difference by using compensating factors or coefficients.
Moreover, further studies are necessary to compare the results of the individual integration method with those of the input–output method to verify the reliability and accuracy of the results of the latter approach.
6. Conclusions
This study calculated the quantity variation of reinforcing bars with increases in the yield strength, as well as calculated carbon dioxide emissions of the deformed bars. Based on the material quantity and the CO2 emissions, the carbon dioxide reduction ratio of three different structural systems was compared to confirm the suitability and applicability of the high-strength reinforcing bars for lowering carbon dioxide emissions. The following results were obtained:
- A strength increase rate of SD500 and SD600 reinforcing bars when compared with that of SD400 was approximately 25% and 50%, respectively, and the reduction ratio of materials input on SD500 and SD600 re-bars was approximately 20% and 33%, respectively, when compared with those of SD400.
- The reinforcement quantity of SD500 and SD600 in compliance with the minimum reinforcement ratio in the flexural members and one-way structure was lowered by 20% and 30%, respectively, when compared to those of SD400 re-bars.
- When the high-strength reinforcing bars were applied to the three structural systems, the pure quantity of bar arrangement including upper and lower bar arrangement, stirrup, and hoop generally exhibited a decreasing tendency. Conversely, the quantity of splice and development increased when the strength of deformed bars increased. However, the total quantity of reinforcement bars exhibited a decrease, since the reduction ratio of pure quantity exceeded that of the increment in splice and development.
- Generally, applications to high-strength materials, especially high-strength deformed bars in the study is potentially beneficial in reducing the input amount of materials in the rigid-frame structure, bearing wall system, and flat-plate system.
- The results indicated that the implementation of SD500 deformed bars was the most effective in reducing carbon dioxide emissions. Thus, the excessive pursuit of high-strength materials detrimentally impacts carbon dioxide emissions. Hence, it is necessary to carefully calculate and compare the trade-off between material reduction and CO2 emissions for sustainable structures and buildings.
Acknowledgments
This work was supported by the Korea Science and Engineering Foundation (KOSEF) grant funded by the Korean Government (MOE) (No. 2017R1D1A1B03032279).
Author Contributions
This paper was written and revised by Seunguk Na. Seungho Cho calculated the quantity of reinforcing bars on three different types of structures. Seunguk Na performed the computation of carbon dioxide emissions. All authors contributed equally all aspects of this article.
Conflicts of Interest
The authors declare no conflict of interest.
Appendix A
Application of the Codes
All of the specimens in this study were designed in compliance with Structural Concrete Design Code and Commentary by Korea Concrete Institute (KCI, 2012). The load factors including seismic and wind loads were satisfied with Korean Building Code: Structure (KBC, 2009) which is established by Architectural Institute of Korea (AIK, 2009).
Analysis of the Reference of Codes
- Main reinforcement
- (1)
- Beams;
- Nominal flexural strength at section
Nominal flexural strength at section Specified compressive strength of concrete, MPa Specified yield strength of reinforcement, MPa Tsion reinforcement ratio Width of compression face of member, mm Effective depth, mm
- Minimum reinforcement ratio
- ,
- SD400 is 0.35%, SD500 is 0.28% or lower than 20%, and SD600 is 0.23% or lower than 33.3%.
- Minimum allowable strain
Minimum allowable strain: 0.004, Reinforcement ratio: Minimum allowable strain: 0.005 (), Reinforcement ratio: Minimum allowable strain: 0.005 (), Reinforcement ratio: - Designing beam components
- Design of non-seismic structures as single beam reinforced concrete, and composite reinforcing bars should be applied to two for minimum bar arrangement;
- Design of composite parts in seismic structures should be considered the lateral loads;
- Consideration of space for thermal cracking control.
- (2)
- Slabs;
- Shrinkage and temperature reinforcement
- Limit of space for cracks control (one-way slabs)
- Bars arrangement for horizontal load
- (3)
- Columns: calculating the amount of reinforcement for compression members;
- (a)
- ;
- (b)
- Minimum and maximum reinforcement ratio ;
- (c)
- If a structure is high-rise and the section of the column is same in all floors, the dominant reinforcement ration is minimum reinforcement under certain conditions;
- (d)
- When high strength reinforcing bars are used, it would be required to adjust the section of the column if we want to reduce the input of reinforcing bars.
- (4)
- Walls: core walls;
- (a)
- Horizontal reinforcement: the regulation is equal spacing;
- (b)
- Vertical reinforcement;
- Under D16: 0.12%
- Exceeding D16: 0.15%
- (c)
- Horizontal reinforcement;
- Under D16: 0.2%
- Exceeding D16: 0.25%
- (d)
- There is no regulation in terms of reinforcement in wall regardless of . Thus, the amount of high-strength reinforcing bars is same as the amount of SD400. Moreover, the efficiency would be lowered if the amount of minimum reinforcement would be increased.
- (5)
- Footings;
- (a)
- Design of footings should comply with the code of flexural members;
- (b)
- When SD500 is used, would be reduced 20 %, and when SD600 is applied, would be deducted to 33.3%;
- (c)
- The type of footing is soil bearing capacity of mat foundations.
- (6)
- Deflection;
- There are none of variables affecting deflection, when we use high strength reinforcing bars. However, the deflection would be slightly increased when the high strength reinforcing bars are used, since the cracked moment of inertia is decreased. In this study, each specimen was designed in consideration of deflection and the value was relatively small and negligible.
- (7)
- Cracks;
- (a)
- Reinforcement space of controlling cracks;
- (b)
- If the section of beams is large, especially the width of beam is large, the tests were carried out in consideration of reducing the diameter of the reinforcing bars;
- (c)
- Intervals of controlling cracks on slabs;
- When SD400 is used, it is 200 mm
- When SD500 is used, it is 186 mm
- When SD600 is used, it is 146 mm
- (d)
- Intervals of controlling cracks on beams
- When SD400 is used, it is 170 mm
- When SD500 is used, it is 136 mm
- When SD600 is used, it is 71 mm
- (8)
- Development and splice;
- (a)
- The development length;
- Development length for deformed bars in compression:
- Development length for deformed bars in tension:
- Development length for standard hooks in tension:
- (b)
- Beams: Applied to the general design codes;
- (c)
- Vertical members: Applied seismic resistance design;
- (d)
- Slabs: Applied 1 way slab design code;
- (e)
- Footings: Applied codes in accordance with the design code of beams.
- Shear reinforcement
- (1)
- Beams;
- The strength of concrete with shear and flexural moment
- (a)
- Space of shear reinforcement;
- (b)
- ;
- (c)
- ;
- (d)
- Minimum shear reinforcement;
- All the flexural members (the factored shear strength is not exceeded a half of the minimum shear strength) should place shear reinforcement.
- However, the minimum shear reinforcement should not exceed
- (e)
- Maximum shear strength should be lower than
- (2)
- Columns
- (a)
- The strength of compressive axial force members;
- (b)
- Space of shear reinforcement;
- : Shear reinforcement is not required
- : Shear reinforcement is required
- Shear reinforcement
- Structures located in non-seismic areas
- Structures located in seismic area
- (c)
- Maximum shear strength should be lower than
- (3)
- Walls
- Generally, shear reinforcement in walls is similar to the design of shear reinforcement design in beams. However, there is slight difference between
- (a)
- Shear strength would be selected minimum value,
- or
Light-weight aggregate concrete factor Overall thickness or height of member, Distance from extreme compression fibre to centroid of longitudinal tension reinforcement, Factored axial force normal to cross section occurring simultaneously with or is to be taken as positive for compression and negative for tension, Length of entire wall or length of segment of wall considered in direction of shear force,
- (b)
- When ,
- : Area of shear reinforcement parallel to flexural tension reinforcement within spacing,;
- : Centre-to-centre spacing of longitudinal shear or torsion reinforcement, .
- (c)
- Minimum area of reinforcement and spacing
- : Comply with (a)–(d), or reinforcement of walls
- : Comply with (a)–(d)
- Reinforcement of horizontal shear force: Lower than , , or 450
- Reinforcement of vertical shear force: Lower than , , or 450
Appendix B
The Process of CO2 Emissions of Re-Bars by Yield Strength and Diameter
In this study, the calculation of CO2 emission of each structural reinforcing bars by yield strength and diameter was applied the below procedures.
- (1)
- Production inducement coefficient of structural steel (Table 3);
- (2)
- (3)
- Computation of energy consumption of structural steel (Table 5);
- (4)
- Evaluation of net calorific value of structural steel by each energy source (Table A1);
- (5)
- Assessing CO2 emissions of structural steel with application of CO2 conversion coefficient (44/12);
- (6)
- Determination of CO2 emissions of each structural steel by yield strength and diameter.
The first step of the amount of energy consumption for producing the structural steel i will be calculated by multiplication of production inducement coefficient of structural steel i and the unit price of the structural steel i . Then, the computed value is divided by the unit price of energy source will be the amount of energy consumption for production of the structural steel i. This would be described as the following expression,
According to Enforcement Rule of Energy Ace in South Korea by Ministry of Knowledge Economy, net calorific value of energy sources is indicated and the value is shown in Table A1. The CO2 emission from energy combustion () can be calculated the multiplication of net calorific value (), CO2 emission factor of energy source j (), and 44/12 which is the ratio of the molecular weight ratio of carbon dioxide to carbon. The above process would be expressed in the below expression,
Here, the value of net calorific value () is multiplication of the value of energy combustion () and coefficient of net calorific value () and it is depicted as follows,
When reinforcing bars are manufactured, variety of energy sources which shown in Table A1 is applied for the production of deformed bars. The CO2 emissions of reinforcing bars in this study applied the input–output analysis and it is an indirect approach by computing the consumption of energy sources which combust during the manufacturing processes. According to production inducement coefficient of structural steel would require twelve different types of energy sources. Based on this assumption and Equations (A1) and (A2), the energy consumption and the amount of CO2 would be calculated. For example, the CO2 emissions derived from hard coal was calculated as following the below steps.
- Calculation of input amount of hard coal from Equation (A1),
- Computation of the value of net calorific value () of hard coal from Equation (A3),
- The CO2 emissions from hard coal combustion is calculated from Equation (A2),
- The CO2 emissions from other energy sources were followed the above three steps and the sum of all the energy sources was the CO2 emissions of each deformed bar (see Table 5)

Table A1.
Unit price, net calorific value and CO2 emission factors of energy sources.
| Energy Source | Unit Price (KRW) | Coefficient of Net Calorific Value (10-3TOE) | CO2 Emission Factor |
|---|---|---|---|
| Hard coal | 91.60 | 0.445 | 1.1 |
| Soft coal | 101.36 | 0.537 | 1.059 |
| Crude oil | 712.58 | 1.008 | 0.829 |
| LNG | 706.45 | 1.178 | 0.637 |
| Other bituminous coals | 96.48 | 0.491 | 1.08 |
| Naphtha | 612.00 | 0.716 | 0.783 |
| Further oil refinery products | 380 | 0.936 | 0.912 |
| Gasoline | 1536.00 | 0.723 | 0.783 |
| Kerosene | 1005.50 | 0.82 | 0.812 |
| Diesel | 1384.00 | 0.842 | 0.837 |
| Crude oil | 664.76 | 0.982 | 0.875 |
| LNG | 1053.00 | 1.098 | 0.713 |
References
- Cho, S.H.; Chae, C.U. The comparative study on the environmental impact assessment of construction material through the application of carbon reducing element-focused on global warming potential of concrete products. Int. J. Korea Inst. Ecol. Archit. Environ. 2015, 33, 149–156. [Google Scholar] [CrossRef]
- Kim, T.-H.; Tae, S.-H. A study on the development of an evaluation systems of CO2 emission in the production of concrete. J. Korea Concr. Inst. 2010, 22, 787–796. [Google Scholar] [CrossRef]
- Core Writing Team. Climate Change 2007: Synthesis Report; Intergovernmental Panel on Climate Change: Geneva, Switzerland, 2008. [Google Scholar]
- UN. Kyoto Protocol to the United Nations Framework Convention on Climate Change; United Nations: Kyoto, Japan, 1997. [Google Scholar]
- Hammond, G.P.; Jones, C.I. Embodied energy and carbon in construction materials. Inst. Civ. Eng. Energy 2008, 161, 87–98. [Google Scholar] [CrossRef] [Green Version]
- González, M.J.; Navarro, J.G. Assessment of the decrease of CO2 emissions in the construction field through the selection of materials: Practical case study of three houses of low environmental impact. Build. Environ. 2006, 41, 902–909. [Google Scholar] [CrossRef]
- Poon, C.S.; Yu, A.T.W. Reducing building waste at construction sites in Hong Kong. Constr. Manag. Econ. 2004, 22, 461–470. [Google Scholar] [CrossRef]
- Nadoushani, Z.S.M.; Hammand, A.W.; Akbarnezhad, A. A Framework for Optimizing Lap Splice Positions within Concrete Elements to Minimize Cutting Waste of Steel Bars. In Proceedings of the International Symposium on Automation and Robotics in Construction, Auburn, AL, USA, 18–21 July 2016; Vilnius Gediminas Technical University: Vilnius, Lithuania, 2016. [Google Scholar]
- Liu, C.; Ahn, C.R.; An, X.; Lee, S. Integrated Evaluation of Cost, Schedule and Emission Performance on Rock-Filled Concrete Dam Construction Operation Using Discrete Event Simulation. In Proceedings of the Winter Simulation Conference (WSC), Washington, DC, USA, 8–11 December 2013. [Google Scholar]
- Hammand, A.W.A.; Akbarnezhad, A.; Rey, D. A multi-objective mixed integer nonlinear programming model for construction site layout planning to minimise noise pollution and transport costs. Autom. Constr. 2016, 61, 73–85. [Google Scholar] [CrossRef]
- Ahmadian, F.F.A.; Akabarnezhad, A.; Rashidi, T.H.; Waller, T. BIM-enabled sustainability assessment of material supply decisions. Eng. Constr. Archit. Manag. 2016, 24, 668–695. [Google Scholar] [CrossRef]
- Yan, H.; Shen, Q.; Fan, L.C. H.; Wang, Y.; Zhang, L. Greenhouse gas emissions in building construction: A case study of one Peking in Hong Kong. Build. Environ. 2010, 45, 949–955. [Google Scholar] [CrossRef]
- Lee, K.H.; Lee, H.S.; Yang, J.H. A study on the functional unit trend of carbon dioxide emission in the construction materals between 2000, 2003 and 2005. Int. J. Korea Inst. Ecol. Archit. Environ. 2010, 10, 123–129. [Google Scholar]
- Tae, S.; Baek, C.; Shin, S. Life cycle CO2 evaluation on reinforced concrete structures with high-strength concrete. Environ. Impact Assess. Rev. 2011, 31, 253–260. [Google Scholar] [CrossRef]
- Akbarnezhad, A.; Xiao, J. Estimation and minimization of embodied carbon of buildings: A review. Buildings 2017, 7, 5. [Google Scholar] [CrossRef]
- Cole, R.J. Energy and greenhouse gas emissions associated with the construction of alternative structural systems. Build. Environ. 1999, 34, 335–348. [Google Scholar] [CrossRef]
- Cho, S.H.; Chae, C.U. A study on life cycle CO2 emissions of low-carbon building in South Korea. Sustainability 2016, 8, 579. [Google Scholar] [CrossRef]
- Tae, S.; Shin, S.; Woo, J.; Roh, S. The development of apartment house life cycle CO2 simple assessment system using standard apartment houses of South Korea. Renew. Sustain. Energy Rev. 2011, 15, 1454–1467. [Google Scholar] [CrossRef]
- Baek, C.; Tae, S.; Kim, R.; Shin, S. Life cycle CO2 assessment by block type changes of apartment housing. Sustainability 2016, 8, 752. [Google Scholar] [CrossRef]
- Kim, T.H.; Chae, C.U.; Kim, G.H.; Jang, H.J. Analysis of CO2 emissions characteristics of concrete used at construction sites. Sustainability 2016, 8, 348. [Google Scholar] [CrossRef]
- Park, H.S.; Kwon, B.; Shin, Y.; Kim, Y.; Hong, T. Cost and CO2 emission optimization of steel reinforced concrete columns in high-rise buildings. Energies 2013, 6, 5609–5624. [Google Scholar] [CrossRef]
- Nadousharni, Z.S.M.; Akbarnezhad, A. Effects of structural system on the life cycle carbon footprint of buildings. Energy Build. 2015, 102, 337–346. [Google Scholar] [CrossRef]
- Choi, J.H.; Lee, D.H.; Kwon, G.D.; Kim, S.K. A study on energy consumption and estimation of CO2 from re-bar production. J. Korea Inst. Ecol. Archit. Environ. 2010, 10, 101–109. [Google Scholar]
- Han, Y.S.; Kim, S.D. A comparative study on CO2 amount of construction material in structural design. J. Archit. Inst. Korea 2005, 25, 203–206. [Google Scholar]
- Hong, T.H.; Ji, C.Y.; Jang, M.H. An analysis on CO2 emission of structural steel materials by strength using input-output analysis. Korean J. Constr. Eng. Manag. 2012, 13, 132–140. [Google Scholar] [CrossRef]
- Korea Institute of Concrete. Structural Concrete Design Code and Commentary; Korea Institute of Concrete: Seoul, Korea, 2012. [Google Scholar]
- Choi, Y.H.; Kang, M.G. Korean Building Code–Structure; Architectural Institute of Korea: Seoul, Korea, 2009. [Google Scholar]
- Korea Environemental Industry and Technology; Korea National LCI Network: Seoul, Korea, 2012.
- International Organization for Standardization. ISO 14044:2006—Life Cycle Assessment (Requirement and Guidelines); Interantional Organisation for Standization: Geneva, Switzeland, 2006. [Google Scholar]
- International Organization for Standardization. ISO 21930:2007—Environmental Declaration of Building Product; ISO: Geneva, Switzeland, 2007. [Google Scholar]
- Lave, L.; Hendrickson, C.; Harvath, A.; Joshi, S. Economic input-output models for environment life—Cycle assessment. Environ. Sci. Technol. 2002, 32, 184–191. [Google Scholar]
- Miller, R.E.; Blair, P.D. Input-Output Analysis: Foundations and Extensions; Cambridge University Press: Cambridge, UK, 2009. [Google Scholar]
- Gay, P.W.; Proops, J.L. Carbon dioxide production by the UK economy: An input-output assessment. Appl. Energy 1993, 44, 113–130. [Google Scholar] [CrossRef]
- Minx, J.C.; Widermann, T.; Wood, R.; Peters, G.P.; Lenzenm, M.; Owen, A.; Paul, A. Input–output analysis and carbon foot printing: An overview of applications. Econ. Syst. Res. 2009, 21, 187–216. [Google Scholar] [CrossRef]
- Basbagill, J.; Flager, F.; Lepech, M.; Fischer, M. Application of life—Cycle assessment to early stage building design for reduced embodied environmental impacts. Build. Environ. 2013, 60, 81–92. [Google Scholar] [CrossRef]
- Cabeza, L.F.; Rijcón, L.; Vilariño, V.; Pérez, G.; Castell, A. Life cycle assessment (LCA) and life cycel energy analysis (LCEA) of buildings and the building sector: A review. Renew. Sustain. Energy Rev. 2014, 29, 394–416. [Google Scholar] [CrossRef]
- Hendrickson, C.; Horvath, A.; Joshi, S.; Klausner, M.; Lave, L.B.; McMichael, F.C. Comparing two life cycle assessment approaches: A process model vs. economic input-output-based assessment. In Proceedings of the 1997 IEEE International Symposium on Electronics and the Environment, San Francisco, CA, USA, 5–7 May 1997. [Google Scholar]
- The Bank of Korea. 2014 Input-Output Statistics; The Bank of Korea: Seoul, Korea, 2016. [Google Scholar]
- Korea Price Information Corporation. Korea Price Information; Korea Price Information Corporation: Seoul, Korea, 2017. [Google Scholar]
Figure 1.
Floor plans of the office complex building: (a) typical floor; and (b) basement floor.

Figure 2.
Floor plans of the apartment building: (a) typical floor; and (b) basement floor.

Figure 3.
Floor plans of the residential complex building: (a) typical floor; and (b) baseent floor.
Figure 3.
Floor plans of the residential complex building: (a) typical floor; and (b) baseent floor.

Figure 4.
CO2 emissions of re-bars by yield strength.

Figure 5.
Total CO2 emissions of the studied models.

Figure 6.
CO2 emissions of re-bars by diameter.

Figure 7.
CO2 emissions on slabs.

Figure 8.
CO2 emissions of beams or girders.

Figure 9.
CO2 emissions on columns.

Figure 10.
CO2 emissions on footings.

Table 1.
The profile of the studied models.
| Type | Number of Storeys (Ground/Basement) | Type of Structure | Type of Footings | Concrete Compressive Strength |
|---|---|---|---|---|
| Office complex building | 25/1 | Rigid frame | Bearing capacity of soil (Mat footing) | |
| (Vertical members) | ||||
| (Horizontal members and footings) | ||||
| Apartment | 25/1 | Bearing wall | Bearing capacity of soil (Mat footing) | |
| (11F-RF: Vertical members, B1-RF: Horizontal members and footings) | ||||
| (B1-10F: Vertical members) | ||||
| Residential–commercial complex | 43/1 | Flat plate | Bearing capacity of soil (Mat footing) | |
| (Vertical members) | ||||
| (Horizontal members and footing) |
Table 2.
The factors of seismic and wind loads.
| Type | Seismic Load | Wind Load | |||||
|---|---|---|---|---|---|---|---|
| Site Coefficient | Importance Factor | Ground | Response Modification Coefficient | Terrain Category | Design Wind Speed | Gust Influence Factor | |
| Office complex building | A | 1.5 | Sc | 5.0 | B | 30 m/s | 2.2 |
| Apartment | A | 1.5 | Sc | 4.5 | B | 30 m/s | 2.2 |
| Residential–commercial complex | A | 1.5 | Sc | 5.0 | B | 30 m/s | 2.2 |
Table 3.
Production inducement coefficient of structural steel.
| Production Inducement Coefficient of Structural Steel | |||
|---|---|---|---|
| Contents | Production Inducement Coefficient | Contents | Production Inducement Coefficient |
| Hard coal | 0.01471 | Naphtha | 0.007866 |
| Soft coal | 0.071602 | Further oil refinery products | 0.002327 |
| Crude oil | 0.051524 | Gasoline | 0.003923 |
| LNG | 0.023119 | Kerosene | 0.003667 |
| Other bituminous coals | 0.088715 | Gasoline | 0.003923 |
Table 4.
The unit price of steel re-bars (Unit price: KRW).
| Product | Strength | Diameter | Unit Price |
|---|---|---|---|
| Steel re-bars | SD400 | D10 | 620,000 |
| D13 | 610,000 | ||
| D16–D32 | 604,000 | ||
| SD500 | D10 | 650,000 | |
| D13 | 640,000 | ||
| D16–D32 | 634,000 | ||
| SD600 | D10 | 669,000 | |
| D13 | 659,000 | ||
| D16–D32 | 654,000 |
Table 5.
Energy consumption and CO2 emissions of re-bars.
| Product | Strength | Diameter | Energy Consumption (toe/ton) | CO2 Emissions (kg-CO2/ton) |
|---|---|---|---|---|
| Steel re-bars | SD400 | D10 | 0.6720 | 2526.611924 |
| D13 | 0.6611 | 2485.860118 | ||
| D16–D32 | 0.6546 | 2461.409035 | ||
| SD500 | D10 | 0.7045 | 2648.867339 | |
| D13 | 0.6936 | 2608.115534 | ||
| D16–D32 | 0.6871 | 2583.664451 | ||
| SD600 | D10 | 0.7251 | 2726.295769 | |
| D13 | 0.7142 | 2685.543964 | ||
| D16–D32 | 0.7088 | 2665.169062 |
Table 6.
Total quantity of re-bars in the studied models (Unit: ton).
| Types | Quantity | Slabs | Beams/Girders | Columns | Walls | Footings | Total | |
|---|---|---|---|---|---|---|---|---|
| Office complex building | SD400 | Pure quantity | 233.36 | 654.09 | 381.21 | 192.15 | 284.36 | 1745.17 (100%) |
| Development and splice | 10.26 | 172.88 | 95.27 | 13.31 | 74.84 | 366.56 (100%) | ||
| Subtotal | 243.62 (100%) | 826.97 (100%) | 476.48 (100%) | 205.46 (100%) | 359.2 (100%) | 2106.73 (100%) | ||
| SD500 | Pure quantity | 250.35 | 533.92 | 346.59 | 185.78 | 232.12 | 1548.76 (82.20%) | |
| Development and splice | 13.60 | 120.70 | 89.15 | 14.55 | 63.29 | 301.29 (87.60%) | ||
| Subtotal | 263.95 (108.3%) | 654.62 (79.2%) | 435.74 (91.5%) | 200.33 (97.5%) | 294.41 (82.0%) | 1849.05 (87.6%) | ||
| SD600 | Pure quantity | 291.35 | 464.38 | 335.31 | 182.48 | 214.05 | 1487.57 (100%) | |
| Development and splice | 18.77 | 98.10 | 102.40 | 15.13 | 69.14 | 303.82 (82.8%) | ||
| Subtotal | 310.12 (127.3%) | 562.48 (69.0%) | 437.71 (92.9%) | 197.61 (96.2%) | 283.19 (78.8%) | 1786.64 (84.6%) | ||
| Apartment | SD400 | Pure quantity | 139.83 | 38.76 | 236.41 | 24.85 | 439.85 (100%) | |
| Development and splice | 6.77 | 16.38 | 16.66 | 5.55 | 45.36 (100%) | |||
| Subtotal | 146.60 (100%) | 55.14 (100%) | 253.07 (100%) | 30.40 (100%) | 485.21 (100%) | |||
| SD500 | Pure quantity | 122.05 | 37.70 | 229.03 | 20.75 | 409.53 (93.1%) | ||
| Development and splice | 7.18 | 20.50 | 18.52 | 4.67 | 50.87 (112.2%) | |||
| Subtotal | 129.23 (88.2%) | 58.20 (105.6%) | 247.55 (97.8%) | 25.42 (83.6%) | 460.4 (94.9%) | |||
| SD600 | Pure quantity | 122.05 | 31.37 | 221.67 | 17.88 | 392.97 (89.3%) | ||
| Development and splice | 8.57 | 12.77 | 19.52 | 4.36 | 45.22 (99.7%) | |||
| Subtotal | 130.62 (89.1%) | 44.14 (80.1%) | 241.19 (95.3%) | 22.24 (73.2%) | 438.19 (90.3%) | |||
| Residential–commercial complex | SD400 | Pure quantity | 1873.07 | 182.68 | 852.75 | 708.22 | 141.22 | 3757.94 (100%) |
| Development and splice | 214.28 | 269.33 | 386.32 | 75.85 | 43.63 | 989.41 (100%) | ||
| Subtotal | 2087.35 (100%) | 452.012 (100%) | 1239.06 (100%) | 784.07 (100%) | 184.85 (100%) | 4747.34 (100%) | ||
| SD500 | Pure quantity | 1551.04 | 164.75 | 731.78 | 668.84 | 112.40 | 3228.81 (85.9%) | |
| Development and splice | 221.21 | 279.85 | 344.79 | 78.55 | 37.88 | 962.28 (97.3%) | ||
| Subtotal | 1772.25 (84.9%) | 444.60 (98.4%) | 1076.57 (86.9%) | 747.39 (95.3%) | 150.28 (81.3%) | 4191.09 (88.3%) | ||
| SD600 | Pure quantity | 1330.20 | 151.38 | 637.01 | 656.36 | 96.82 | 2971.77 (79.4%) | |
| Development and splice | 226.28 | 275.99 | 308.71 | 87.48 | 36.53 | 934.99 (94.5%) | ||
| Subtotal | 1556.48 (74.6%) | 427.37 (94.6%) | 945.72 (76.3%) | 743.84 (94.9%) | 133.35 (72.1%) | 3806.76 (80.2%) | ||
© 2017 by the authors. Licensee MDPI, Basel, Switzerland. This article is an open access article distributed under the terms and conditions of the Creative Commons Attribution (CC BY) license (http://creativecommons.org/licenses/by/4.0/).
Share and Cite
MDPI and ACS Style
Cho, S.; Na, S. The Reduction of CO2 Emissions by Application of High-Strength Reinforcing Bars to Three Different Structural Systems in South Korea. Sustainability 2017, 9, 1652. https://doi.org/10.3390/su9091652
AMA Style
Cho S, Na S. The Reduction of CO2 Emissions by Application of High-Strength Reinforcing Bars to Three Different Structural Systems in South Korea. Sustainability. 2017; 9(9):1652. https://doi.org/10.3390/su9091652
Chicago/Turabian StyleCho, Seungho, and Seunguk Na. 2017. "The Reduction of CO2 Emissions by Application of High-Strength Reinforcing Bars to Three Different Structural Systems in South Korea" Sustainability 9, no. 9: 1652. https://doi.org/10.3390/su9091652
Note that from the first issue of 2016, this journal uses article numbers instead of page numbers. See further details here.