Identifying Emerging Trends of Financial Business Method Patents


Department of Information and Industrial Engineering, Yonsei University, 134 Shinchon-dong, Seoul 03722, Korea
*
Author to whom correspondence should be addressed.
Sustainability 2017, 9(9), 1670; https://doi.org/10.3390/su9091670
Submission received: 30 August 2017
/
Revised: 12 September 2017
/
Accepted: 15 September 2017
/
Published: 20 September 2017
(This article belongs to the Section Economic and Business Aspects of Sustainability)
Abstract
:Financial technology has become an important part of the banking industry in recent times. This study attempts to propose a framework to identify emerging areas and trends using financial business method patents. Based on the abstracts of financial business method patents registered at the United States Patent and Trademark Office, this study first applies latent Dirichlet allocation to identify emerging topics. The probability of the annual occurrence of each topic is adjusted through the exponentially weighted moving average to reflect the importance of the recent probability of topics. Each topic is classified as “hot” or “cold” depending on whether the exponentially weighted moving average of the probabilities exceeds the threshold. We applied survival analysis to the time gap of recurrently becoming hot from a cold status with the associated factor of financial business method patents. The findings suggest that the topic with the short granted period and high forward citation is likely to become hot. In addition, the topic that is aged and specific in narrow areas is likely to continuously change into the hot or cold status. The approach proposed in this study contributes toward understanding topic emergence in the financial area and pursuing sustainable development.
1. Introduction
Innovation has been considered as the important factor in achieving a sustainable economy [1]. It is necessary to substantially implement such innovation in industries. Business Method (BM) patents for financial technology play a critical role in sustainable development in the financial industry [2,3,4]. Such flow from innovation to business led by BM can eventually contribute to the sustainable growth of the economy. BM can be patented, and the emergence of BM patents has further accelerated due to advancements in information technology (IT) [5,6].
In particular, BM in the financial industry, which has been conservative, is of interest in this paper. The financial applications of BM patents have increased significantly due to the recent industrial convergence of the IT and financial sectors, i.e., “Fintech” [7,8,9,10,11]. Many financial institutions, such as banks and credit card companies, now focus on financial BMs, mostly concentrating on Fintech [12,13]. Financial institutions in particular attempt to obtain and enforce valuable financial BM patents to maintain their competitiveness. Furthermore, non-financial companies have begun to recognize the importance of financial BM patents in the era of industrial convergence [14,15].
With the increased interest in financial BM patents, it is necessary to understand what kinds of opportunities and critical factors exist. Financial BM patents have been analyzed to deepen our understanding of the financial sector and relevant innovative businesses. Hall [16] studied the particular relevance of financial BM patents that enable Web-based interactions and financial transactions. In addition, as the importance of Fintech increases in financial BMs, identifying emerging areas and understanding their trends have recently become necessary for researchers and practitioners. Various techniques have been exploited for finding emerging technologies [17]. These approaches need to incorporate the technological changes over time [18]. Ju and Sohn [19] analyzed the trends and characteristics of financial patents granted in Korea, the United States, and Japan by using patent network analysis and association rule mining. This study attempts to investigate emerging areas in financial BM and discusses their changes over time.
In particular, this study identifies the rise and fall of emerging areas by jointly applying a topic model and survival analysis. It first identifies emerging topics using the abstracts of financial BM patents registered at the United States Patent and Trademark Office (USPTO) and Latent Dirichlet Allocation (LDA); it uses a generative probabilistic model used to discover topics from documents [20,21]. Topic modeling of abstracts can help identify emerging areas in financial BM patents. Topic probabilities provided by the LDA are summarized by year and an Exponential Weighted Moving Average (EWMA) is applied to these probabilities over time to consider the recent probability of topics more importantly. We classify a topic as “hot” for a particular year if the EWMA of its probability is beyond a certain predefined threshold. We analyze the recurrence of becoming a hot or cold topic over a period of years using the Prentice, William, and Peterson Gap Time (PWP-GT) model. We then summarize and compare how these cases are different.
The findings of this study should be able to identify hot topics and their emerging trends in financial BMs. We also expect that the proposed methodology, with the joint use of topic models and survival analysis, can contribute to our understanding of the changing trends of financial BMs over time. This study is structured as follows. Section 2 reviews the related literature as well as the methodologies. Section 3 introduces the characteristics of financial business method patents along with an empirical data analysis. Section 4 is devoted to an explanation of our analytical results, and Section 5 comprises the discussion, conclusions, and some directions for further study.
2. Research Framework and Literature Review
2.1. Research Framework
This study attempts to identify the emerging areas and trends from financial BM patents to pursue business opportunities for sustainable growth. In this context, the innovation in financial areas can be regarded as the effort to continuously obtain business opportunities [22,23]. The proposed approach here is to examine the way of achieving such a business opportunity by systematically utilizing both the structured and unstructured data of financial BM patents. First, text mining is applied to the abstracts of financial BM patents. Then, LDA, a topic modeling technique, is performed to identify the emerging topics in financial BM patents with 10-fold cross-validation. A marginal posterior probability of each topic is obtained by year to investigate the up and down trends of each instance of topic emergence. The recent probabilities are more weighted and the hot and cold statuses of the topics are annually assessed based on whether these probabilities are beyond a specified threshold. Two emerging patterns by type are then studied: the pattern of becoming a hot topic and the pattern of becoming a cold topic. Finally, we apply PWP-GT to the recurrent patterns of hot and cold topics with covariates associated from financial BM patents.
2.2. Business Method in Finance and Patent Analysis
BM means the new technology or process for enabling the business operation, and firms can exploit it for achieving business opportunities [6]. For example, due to the emergence of web based transaction technology, the financial institutions can expand their business and pursue the efficiency. Since BM functions as the channel for commercializing the technological innovation, it can contribute to fostering entrepreneurship [6]. Furthermore, BM can lead to the establishment of new firms and industries and the improvement of the productivity and performance of existing firms and industries [6]. BMs have provided innovations to a wide range of businesses in a sustainable way [24]. Ou et al. [25] proposed to analyze the knowledge flows through technology-based BM. Kim et al. [26] also analyzed the BM for identifying and managing the opportunities for technology-based services based on the BM patents. Such an aspect of BM can be of our interest in the era of the 4th industrial revolution.
In particular, the financial institutions attempt to identify and manage financial BM patents, and even non-financial companies recognize the importance of financial BM patents [14,15,27]. Hall [16] determined that financial BM patents enable Web-based interactions and financial transactions. To analyze financial BM patents, both structured and unstructured data in patent specifications have been used to assess the latest technological trends and to forecast new technologies [28].
From the perspective of structured specifications, the forward citation, backward citation, and classification of patents have been important resources. Above all, the number of forward citations has been used as an indirect measure of patent quality. Many studies have used forward citations as a measure of patent value and related these to various patent characteristics. A significant number of backward citations can identify an invention that combines existing ideas. The backward citation is the most widely employed measure of knowledge flows [29]. Using a negative binomial regression, Harhoff et al. [30] demonstrated a significant relationship between economic value and the number of patent citations. Harhoff et al. [31] observed that the number of references and the number of forward citations were positively associated with patent value. Lerner [32] indicated that the number of patent classes is an indicator of technological quality. This variable is used to measure the degree of convergence of technologies and it represents technical diversity.
In terms of the unstructured specification of patents, patent abstracts and claims are analyzed. When analyzing emerging areas, the text-mining approach toward unstructured data can be important [33]. Unstructured data can be obtained by including variables that represent information in the title, abstract, and claims, as well as the description of the invention [34,35,36]. Topic extraction from an unstructured specification of patents has recently been proposed in the literature [18,37]. Such attempts at analyzing topics from patents can provide meaningful information for innovation and technological opportunities in the industry [38]. In the following section, such techniques for topical intelligence are reviewed.
2.3. Topic Modeling of Patents
Many researchers have used text mining to extract valuable information based on textual data in patent specifications. Text mining is a knowledge discovery technology that enables researchers to discern patterns and trends based on unstructured text. It is possible to extract hidden knowledge using approaches such as natural language analysis, information retrieval, information extraction, and data mining [17,39,40,41,42,43,44,45,46].
Patent documents contain lengthy and rich explanations in technical and legal terminologies [47,48]. The result of patent text mining has been utilized for technology management [36,49,50,51,52]. Feldman et al. [53] suggested that text mining can be used as a powerful technique to manage knowledge encapsulated in extensive document collections. Tseng et al. [36] proposed an analytical process of text mining that facilitates the automation of the patent analysis of document processing, indexing, topic clustering, and topic mapping based on patent specifications from the USPTO.
Past studies have applied text mining techniques, such as text segmentation, summary extraction, feature selection, term association, cluster generation, and topic identification, to analyze patent documents. Of the various techniques, topic modeling has been widely applied to detect topics and clusters or to generate features [33,37]. Singular value decomposition enables us to derive significantly fewer variables than otherwise from a large text dataset. Alter et al. [54] described the use of latent semantic indexing (LSI) as a topic model in transforming genome-wide expression data to identify useful and much-needed information from a large dataset using singular value decomposition (SVD). Husbands et al. [55] focused on the use of SVDs on large document collections to improve the topic model using LSI.
Lately, LDA has become popular for summarizing and extracting topics from documents. LDA uses probability distribution to provide the most likely occurring terms and topics for documents [20]. It is widely used and being continually updated [25]. LDA was recently applied to discover emerging technologies and research areas [37]. Lee et al. [37] predicted convergent technologies by link prediction and they utilized LDA for extracting emerging areas from the predicted technological convergences. Using LDA, Momeni and Rost [56] analyzed the trends of disruptive technology in the photovoltaic industry. Jiang et al. [57] applied LDA to the articles on hydropower to discover and provide the current status of research trends and intellectual structures.
2.4. Survival Analysis and Topic Emergence
Survival analysis has been widely used in traditional application domains such as medicine and engineering. It has also been adopted by various social studies to analyze the duration of notable issues along with their influencing factors. Moreover, its scope in applications has been extended to technology management. Lewensohn et al. [58] conducted a survival analysis of academic patents to discover that the life of a patent is related to the patent, the inventor, and the assignee characteristics. Tsang et al. [59] conducted a survival analysis to examine a firm’s decision making with regard to patent renewal based on fuel-cell patents. Han and Sohn [33] conducted a survival analysis of renewal data with a covariate of SVD from the abstracts of patents.
This study identifies topics from the financial BM patents up to the present time. As these topics can continuously experience becoming hot or cold over time, the experience and knowledge of a particular topic during a prior occurrence could trigger the topic’s hot or cold status at the next occurrence. This study assumes that the recurrence of becoming hot or cold for each topic can be associated with its prior occurrence. Because this study aims to understand how often the topic reappears, it is important to analyze the time gap of attaining a hot or cold status for each topic. It is expected that PWP-GT can be a proper means of modeling the hot or cold status of a topic as PWP-GT considers that the subsequent event is conditional on the prior event [60]. The PWP-GT model is widely used in epidemiology, business, and medicine for analyzing the time gap of recurrent events [61,62,63,64].
3. Methodology
3.1. Data
The USPTO has issued guidelines regarding business method patents in the form of United States Patent Classifications (UPCs) 705 and 902. Classification 705 addresses data processing: finance, business practices, management, and cost/price determination, while classification 902 encompasses electronic fund transfers. Subclasses such as 4, 14, 16–18, 21, 33, 35–45, 53–56, and 64–79 in the 705 classification have been typically used to represent financial BM patents [65,66,67]. The International Patent Classification (IPC) G06Q is related to the field of business methods and it is divided into several sub-categories. G06Q/20 addresses payment architectures, schemes, and protocols, whereas G06Q/40 caters to finance, insurance, tax strategies, and the processing of corporate or income taxes. This study considers pure financial BM patents that are closely related to the financial systems of institutions such as banks, security companies, and insurance companies. Thus, we consider financial BM patent specifications corresponding to subclasses 4, 14, 16–18, 21, 33, 35–45, 53–56, and 64–79 of the UPC 705 classification and the IPC classification G06Q/40. We only included financial BM patents up to 2012 because it usually takes many years for patents to be granted by patent offices and cited by other patents. We obtained 3866 specifications of financial BM patents granted by the USPTO from 1983 to 2012.
As shown in Figure 1, financial BM patents rapidly increased after 2006. As indicated in Figure 1, one can recognize the changing attitudes toward patent applications among the service and financial organizations. Analyzing recent patents can highlight their business implications through the detection of the emerging trends or topics of the financial BMs.
3.2. Research Variables
This paper mainly concerns the topic probability for identifying the hot or cold status of the topic. After applying the proper threshold to the topic probabilities, the top 10 topics above that threshold are considered as hot and the rest of the topics are regarded as cold for every year. As shown in Table 1, our dependent variable is the gap in time between the emergence of the hot topics or cold topics. That gap time can be defined by the hot or cold status of the topics.
Since all of the independent variables have a different scale, each of the independent variables is scaled by subtracting its mean and dividing by its standard deviation. Then, the probability of each topic is regressed over a period of years. In this paper, the patent-related variables are summarized by each topic, and those are used as the independent variables. These variables can represent the patent specific characteristics for each topic. In addition, since the topic network can represent how related the discovered topics are in financial BM, the topic network-related variables are used as the independent variables. Then, it is hypothesized that those independent variables are associated with the interval of the recurrent emergence of topics. We expect that both patent- and topic network-related variables can contribute to understanding the life cycle of the topic appearance in financial BM.
First, the following patent-related independent variables of each topic include the average number of references per topic, the average number of IPC classes per topic, the average number of forward citations per topic, the average age of patents per topic, the average number of countries per topic, and the average period from the application to the registration of patents per topic. In addition, the topic network-related independent variables are derived from the topic network. Those variables are the betweenness centrality per each topic, the degree centrality per each topic, the transitivity per each topic, and the trend of topic emergence over time.
3.3. LDA and Survival Analysis
3.3.1. Latent Dirichlet Allocation (LDA) and Topic Clusters
This study deploys LDA, which is the probabilistic model that discovers the underlying semantic structure of document collections based on a hierarchical Bayesian model. LDA is widely used because it can discover patterns of word use to connect similar documents [78]. According to Blei et al. [20], LDA considers a topic distribution over a fixed vocabulary of terms. It assumes that K topics are associated with various documents and each document indicates these topics in varying proportions. LDA considers the hidden topical structure of the documents. The posterior distribution of these hidden topical structures is estimated using Gibbs sampling. Furthermore, the results of LDA can be represented as a graph and clustered. The graph of topics can be constructed, along with the use of term co-occurrence, to examine the topic relation and clusters. The graph is also clustered through a walktrap algorithm to identify emerging areas. The walktrap algorithm, which is widely used for analyzing real-world graphs, can detect subgraphs by using random walks [79].
3.3.2. Prentice, William, and Peterson Gap Time (PWP-GT) Model
A topic can emerge and reappear. This study attempts to analyze the recurrence time gap using one of the Cox-based models: Andersen and Gill (AG); Prentice, William, and Peterson conditional probabilities (PWP-CP); gap in time (PWP-GT); and the Wei, Lin, and Weissfeld (WLW) model [25]. These methods were introduced to deal with the interval data of recurrent events. Of these, we consider PWP-GT in our analysis.
PWP-GT is one of the proportional hazard-type models that deal with recurrent event data. It analyzes the time gap between the recurrent events and considers the order of recurrent events as the stratum. Such stratum indicate the specific event number in which the subject is at risk. PWP-GT can provide the estimated hazard rate that explains how fast such events reoccur [60].
PWP-GT is an extension of the Cox model for recurring events [60]. We assume that all covariates are fixed at the beginning of the study and that the proportional hazards function for the sth event of PWP-GT is
Based on Hosmer et al. [60], represents the proportional hazards function for the sth event while t and , respectively, denote the times at which the given and preceding events occurred. represents the time gap between recurrent events, indicates both the patent-related and topic network-related independent variables in this paper. Event-specific parameter estimates are calculated by including the stratum variable as a covariate interaction of the model.
4. Empirical Analysis
4.1. Topic Discovery with LDA
This study applied LDA to identify topics from financial BM patents [80,81]. For LDA, an empirical Bayes method for parameter estimation was used [20]. A topic model was conducted based on the abstracts of financial BM patents using the statistical software R. Unstructured textual data contains abundant and valuable information related to the technologies of financial BM patents. To reduce irrelevant terms in the text data, uninformative elements, such as conjunctions, determiners, prepositions, and numbers, were ignored. Ninety-three high-frequency terms to eliminate general words in financial BMs were also removed. A term-by-document frequency matrix was constructed as the foundation for an analysis of the patent document collection, which enables LDA.
In order to decide the optimal number of topics, the perplexity measure is utilized. The perplexity means the decreasing function of the log-likelihood of the topic model given the estimated parameters [82]. The perplexity has been traditionally used for choosing the optimal number of topics when the cross validation is applied to the topic model [82]. The topics were chosen where the corresponding perplexities from the 10-fold cross-validation on the testing dataset were mostly low, as shown in Figure 2. A lower perplexity score indicates better general performance. Figure 2 shows the change in perplexity by the number of topics (K). Figure 2 can be used to interpret approximately 25 different topics, so 26 was considered to be the maximum number of topics that are within the limits of possibility.
The resulting topics are listed in the table below. Each topic can be represented by “most likely occurring” terms and topic labels can be assigned using these terms. Based on the 20 words with the highest probability of occurrence for each topic, the topics are displayed in Table 2.
Discovered topics are related to the investor system (topic 2, 3, 4, 5, 12, 15, 16, 24), traditional service & corporate finance (topic 1, 8, 14, 17, 23, 25), industry-related (topic 10, 18, 19, 22), individual services (topic 6, 7, 11), and new financial technology (topic 9, 13, 20, 21, 26). In particular, the topics on new financial technology seem to indicate the new electronic transactional and payment technique and services.
We also examined the topic relations by building a graph of topics containing co-occurrence terms. If two topics shared co-occurring terms, the two topics are considered to be related. The relations with less than three co-occurring terms are removed to simplify the graphs. The topic network can expand our understanding on the discovered topics, and the topic network-related variables are utilized in our survival analysis. In order to overview the topic relationship, the graph was also clustered through the walktrap algorithm [83,84]. Figure 3 shows the resulting graph. Five sub-graphs were found based on the co-occurrence of terms described in Table 2.
The identified subgraphs are as follows. The first subgraph (in squares) is about banking and financing, and it covers seven topics: Topics 5, 6, 9, 10, 13, 19, and 25. They are related to taxes, wireless/mobile terminals for money transfers, machines and equipment in bank, processing loans, and financing vehicles. The second subgraph is related to the financial securities, such as stock and insurance, and it is located on the left-hand side and consists of Topics 1, 8, 22, and 23. These topics represent advisory services, brokerages, health insurance, and a system for stock documents. The third subgraph (in circles) in the center shows the investment system and new financial technology. It consists of 13 topics: Topics 2, 3, 5, 7, 11, 12, 15, 16, 17, 18, 20, 21, and 26. They are related to the trade system, the investor support platform, the software for hedging, the client interactions and reporting web systems, financial analysis for the individual, the automated trade strategies and algorithms, the engines for derivatives, the trading annuities, the simulation components for cash flows, the auctions, the electronic wallet services, the optimizing techniques for authentication via the electronic environment, and the direct pay system. The fourth subgraph consists of Topic 24 and the fifth represents Topic 4. The fourth subgraph is related to the equity analysis methodology, while the fifth subgraph is related to allocating the structure of financial income. Particularly, the first subgraph and the third subgraph have the overlapped area, which covers Topic 2, Topic 6, and Topic 16. Those overlapped topics are related to the trading system, and those can connect the banking and financing with the new financial technology and investment system.
4.2. Descriptive Analysis
In this section, both the topic-related and patent-related variables are summarized based on the identified topics. Due to standardization, the mean and standard deviation are 0 and 1, respectively. The following tables further provide the median, minimum, and maximum value for each variable. First, the descriptive statistics of the patent-related variables are shown in Table 3.
As shown in Table 3, the forward citation has the median of −0.3. The median of references to financial BM patents is −0.07 and the median of IPCs is −0.18. Both the average age and period have −0.25 and −0.1 as their median. On the other hand, the number of countries has the 0.25 as its median. The following descriptive statistics of topic-related variables are shown in Table 4.
Table 4 shows that the trend of the topic slope has 0.15 as its median. The transitivity has 0.18 as its median value. The degree and betweenness centrality of the topic network show the negative mean values −0.04 and −0.27.
4.3. Survival Analysis of Topic Emergence
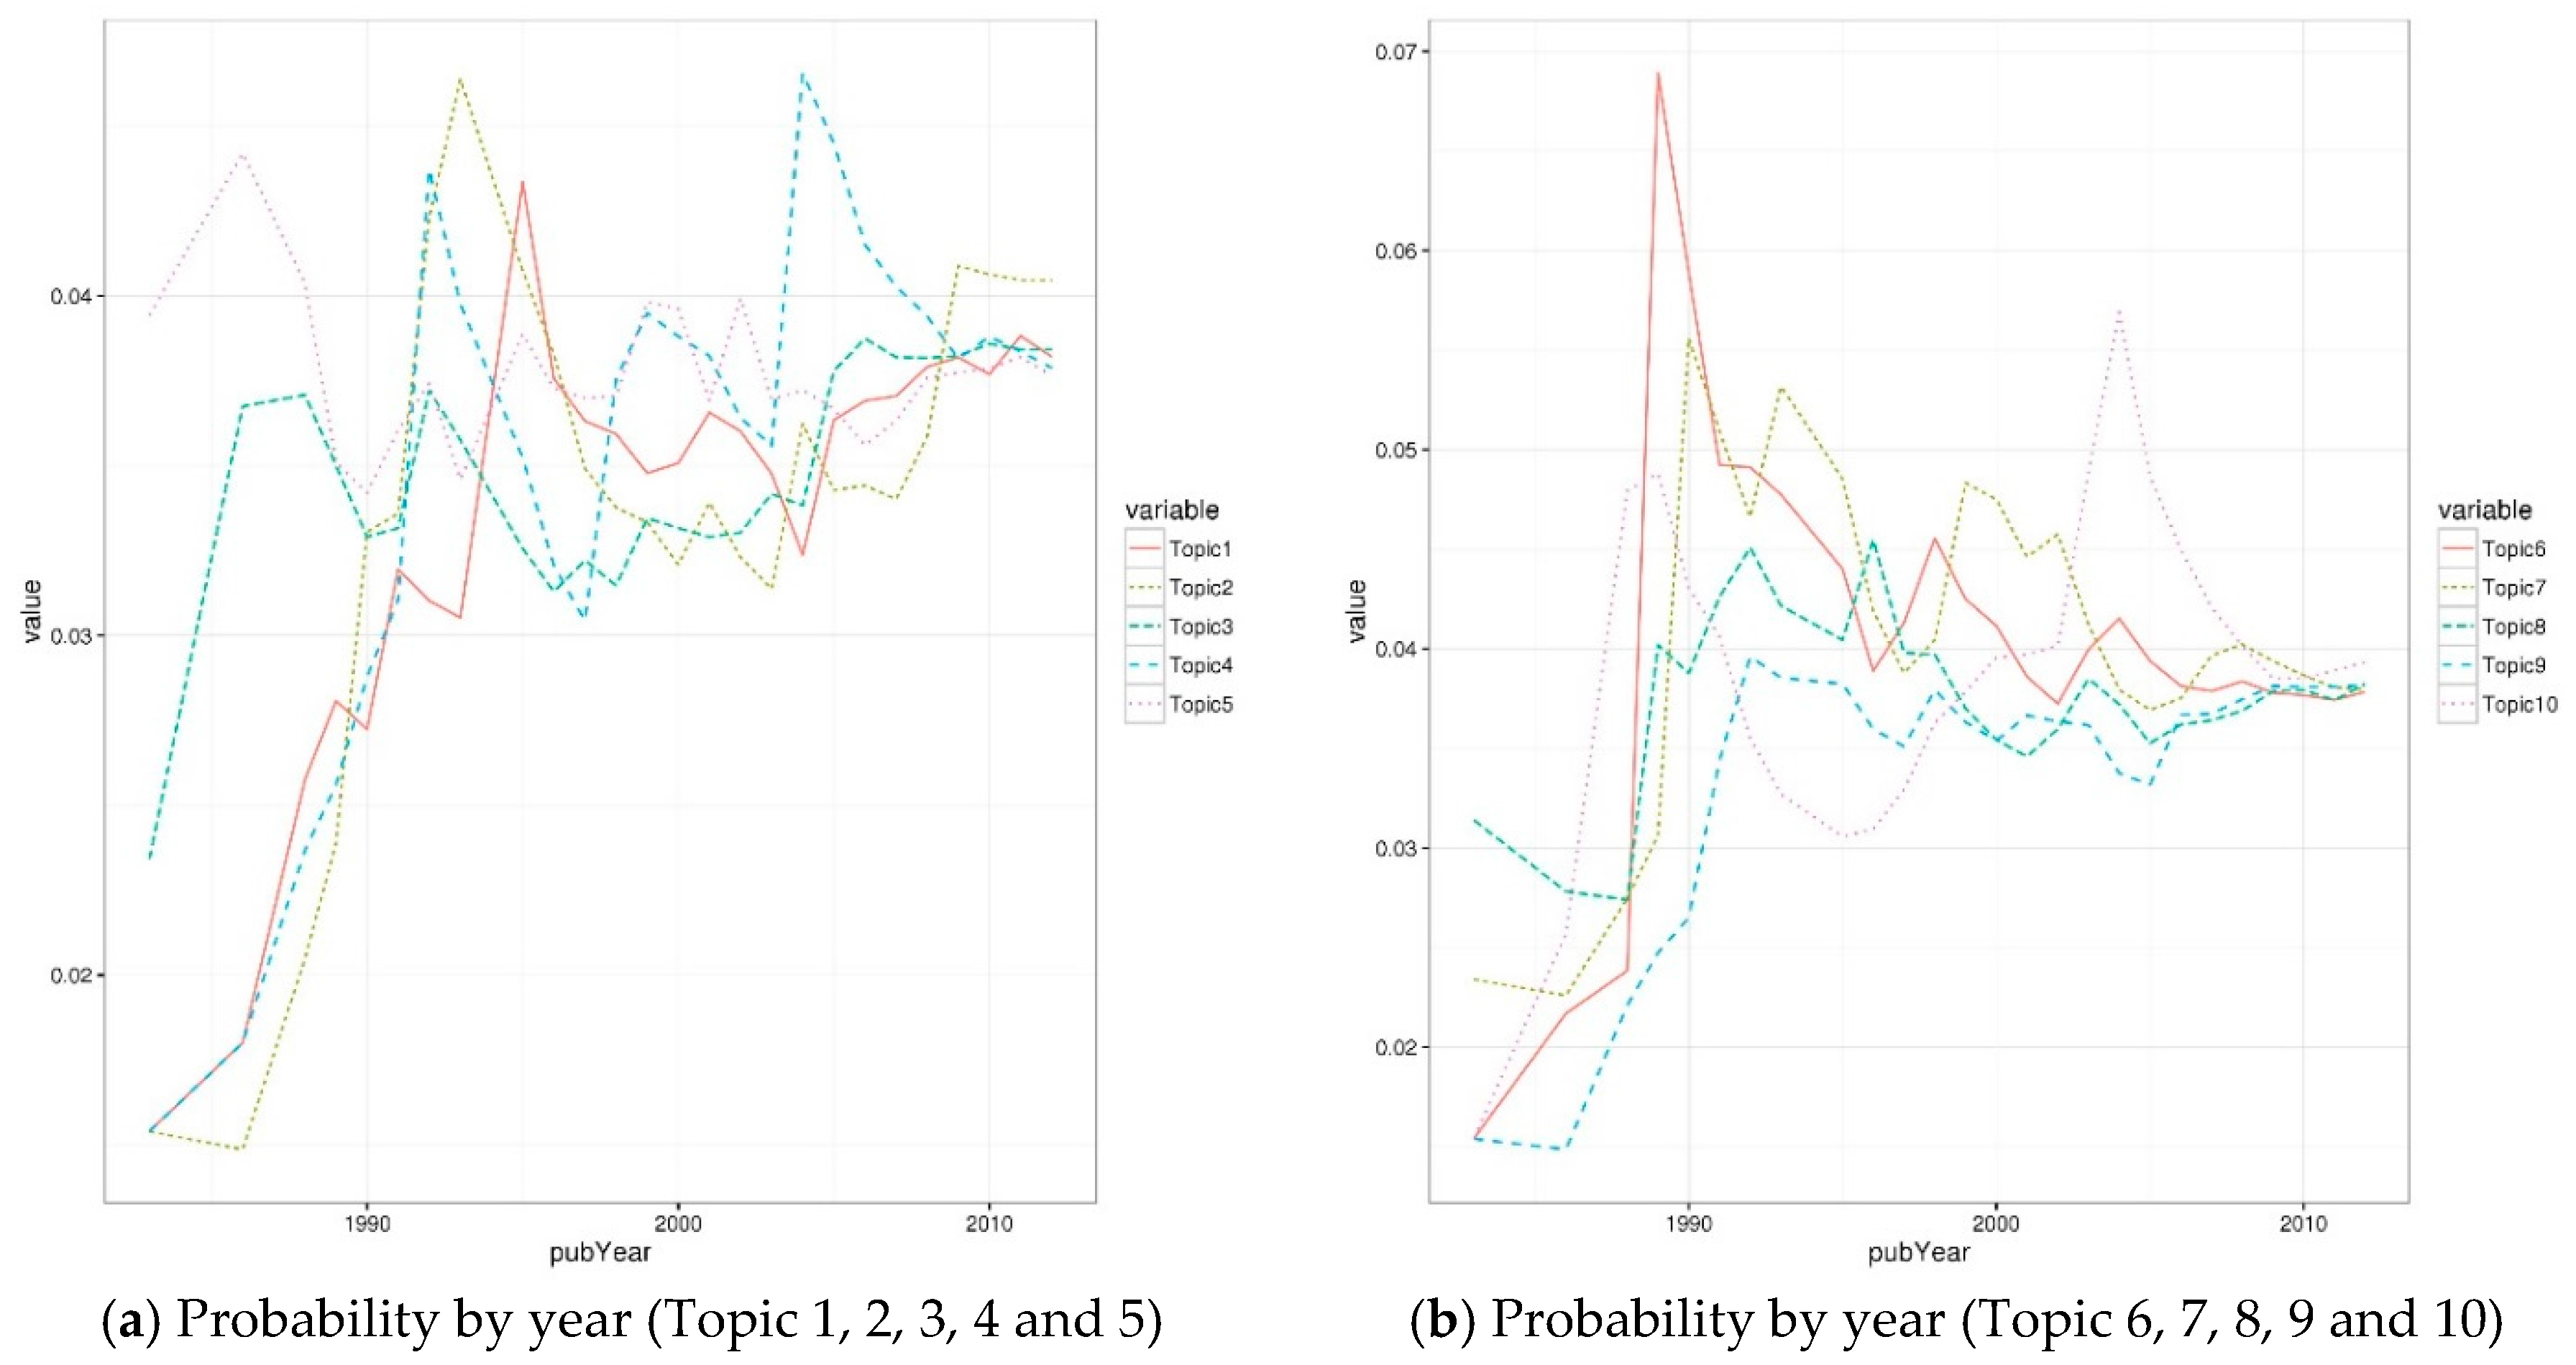
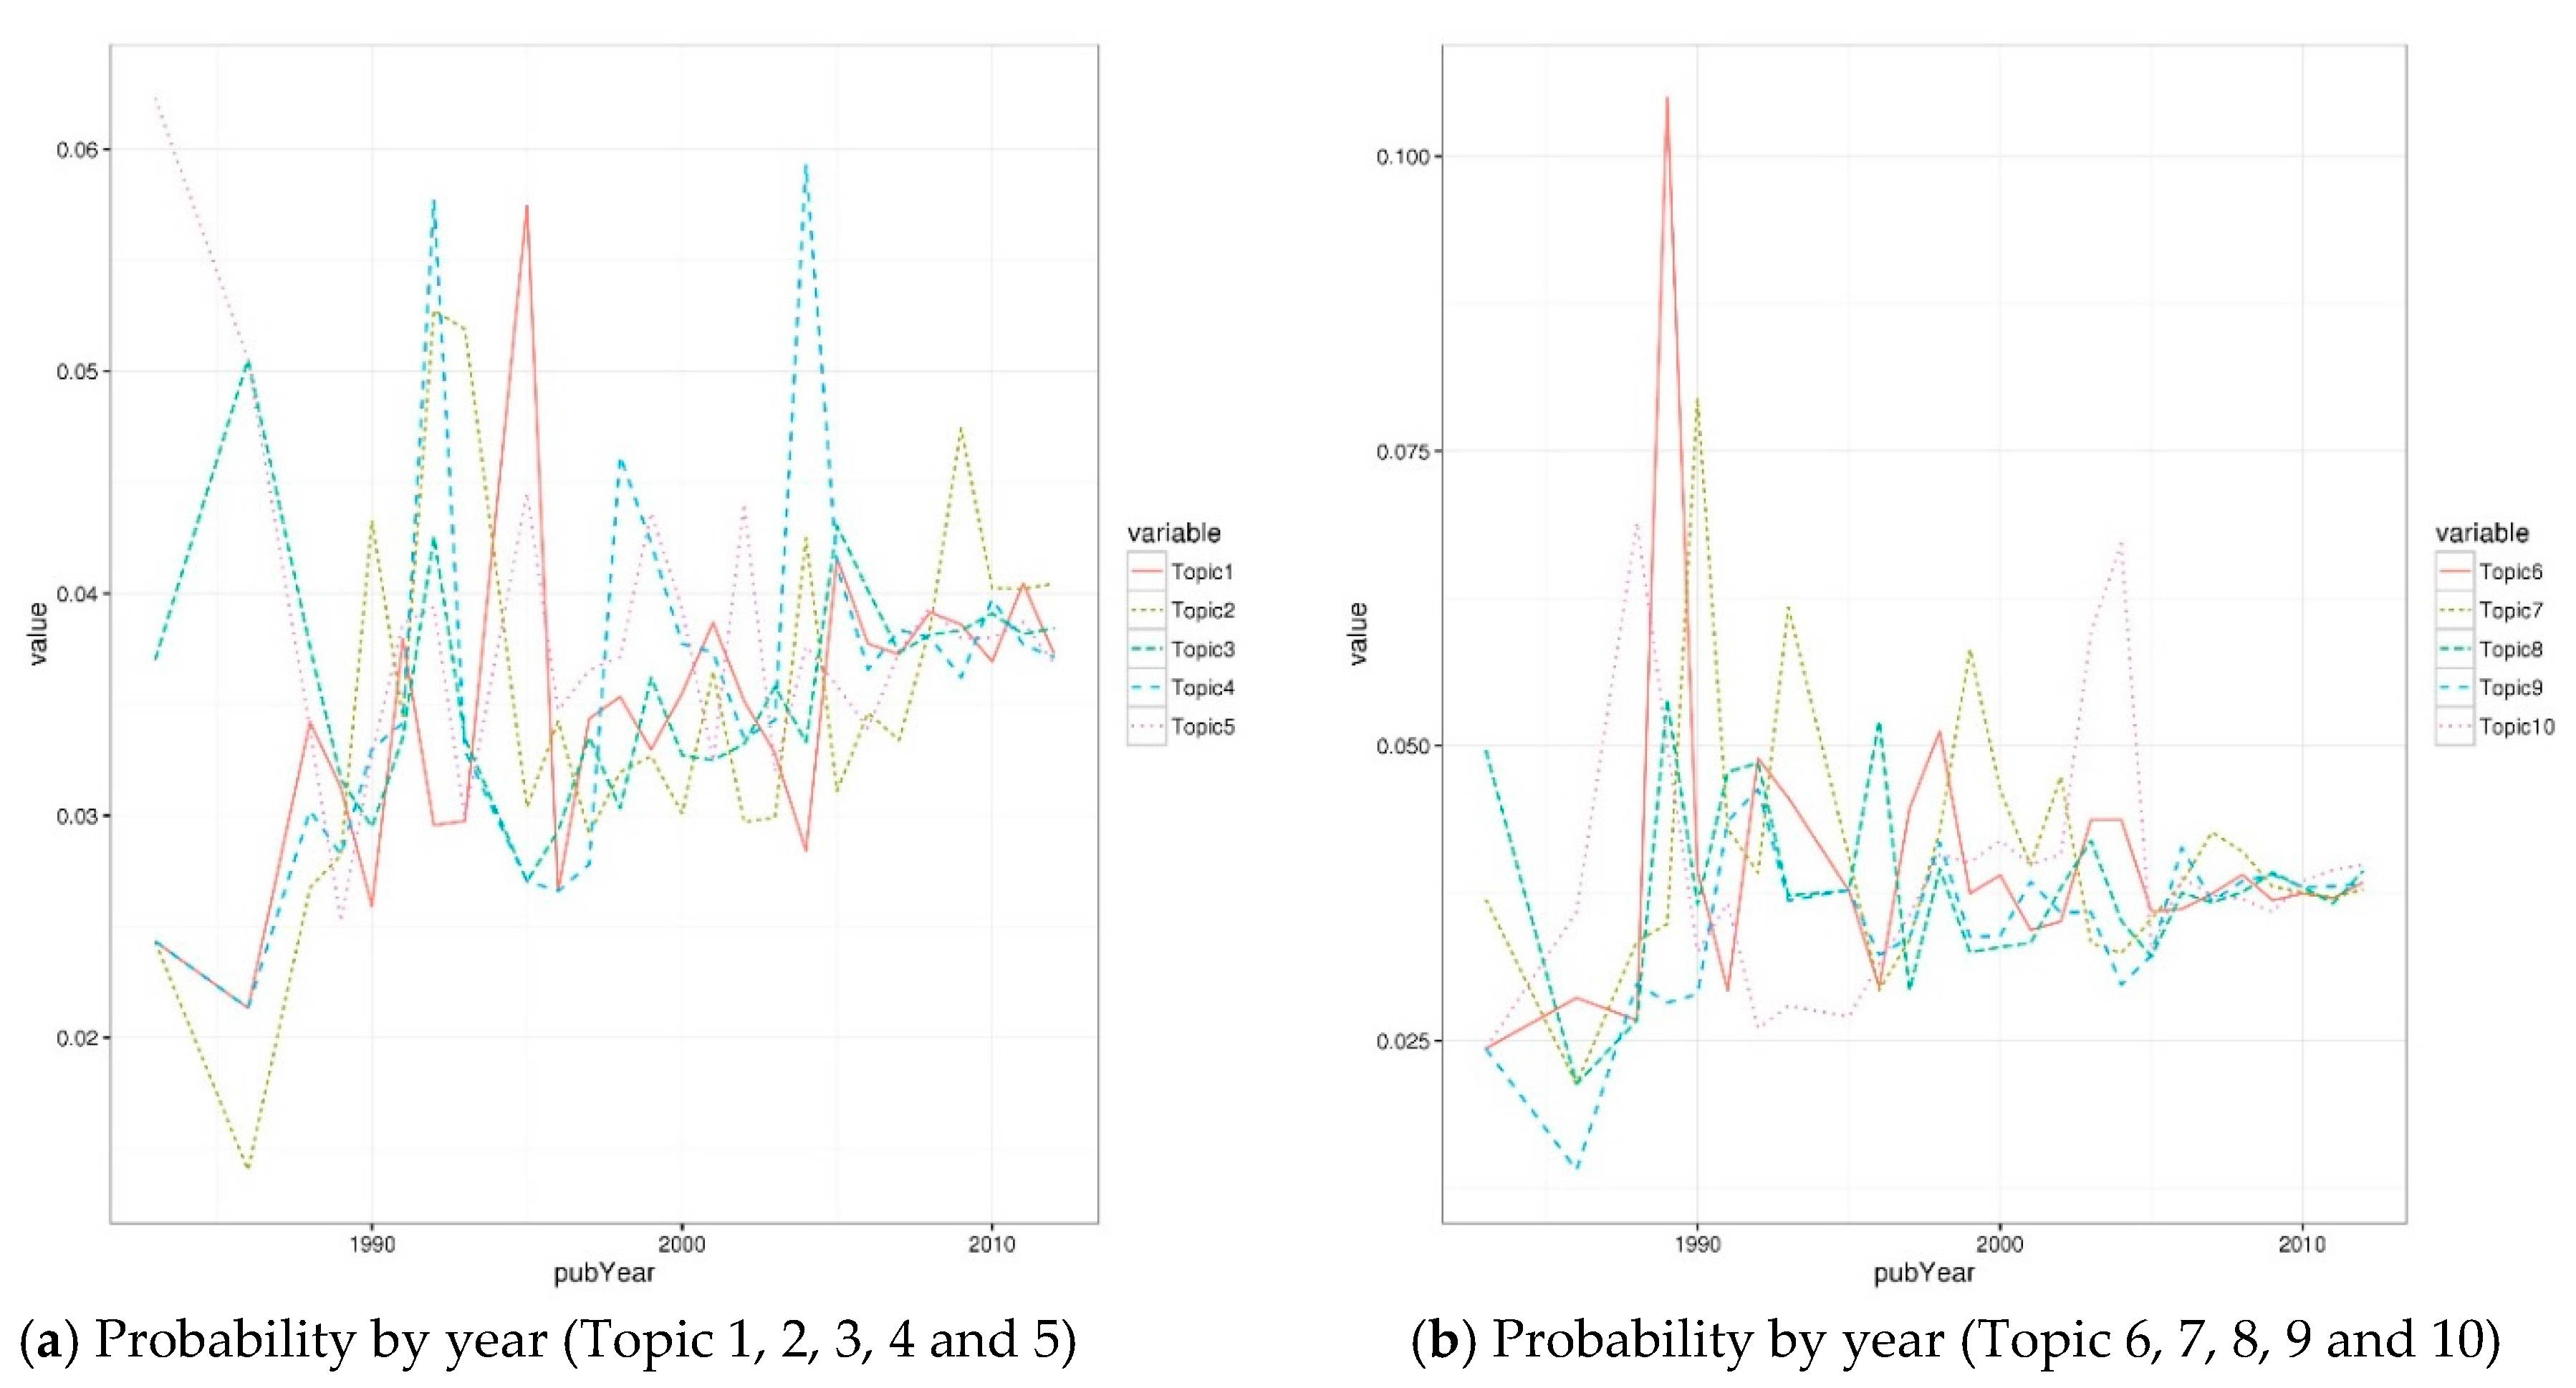
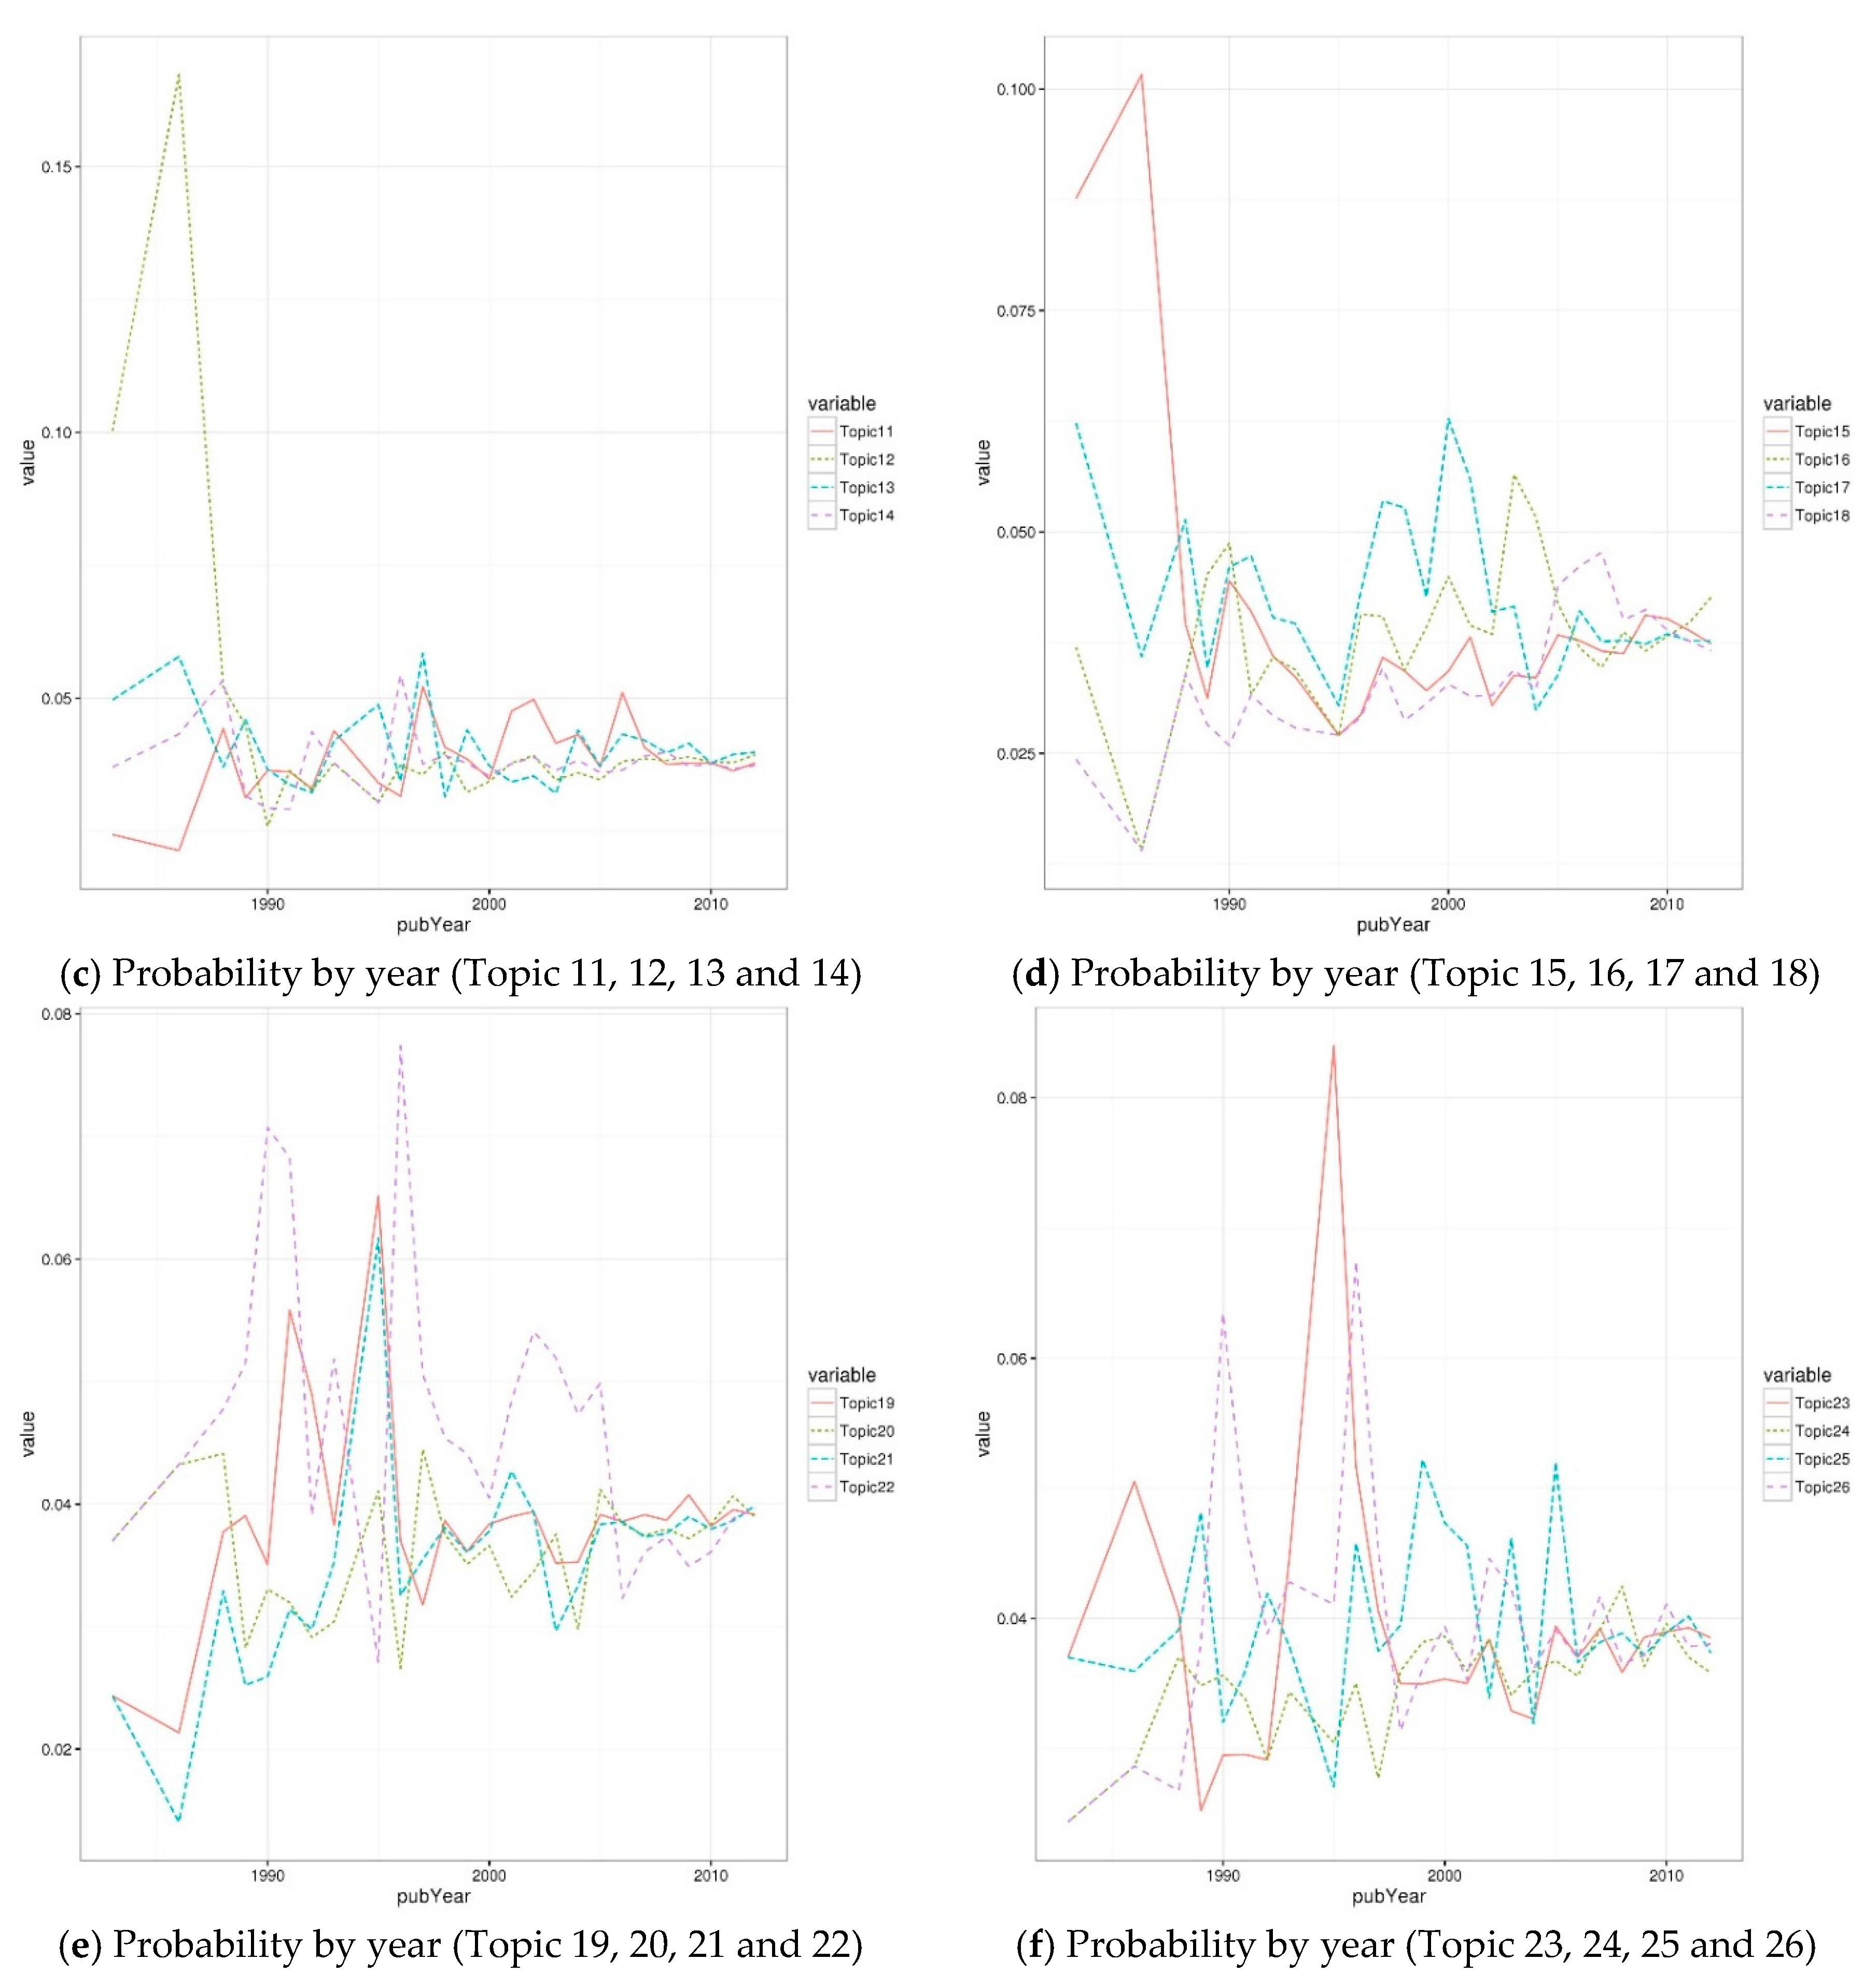
In this section, we analyze the emerging trend of each topic over time. The trend of each topic was examined by obtaining the average probability of each topic by year. Each topic showed a positive slope or negative slope each year, indicating an increasing or decreasing trend for each topic in the financial BMs.
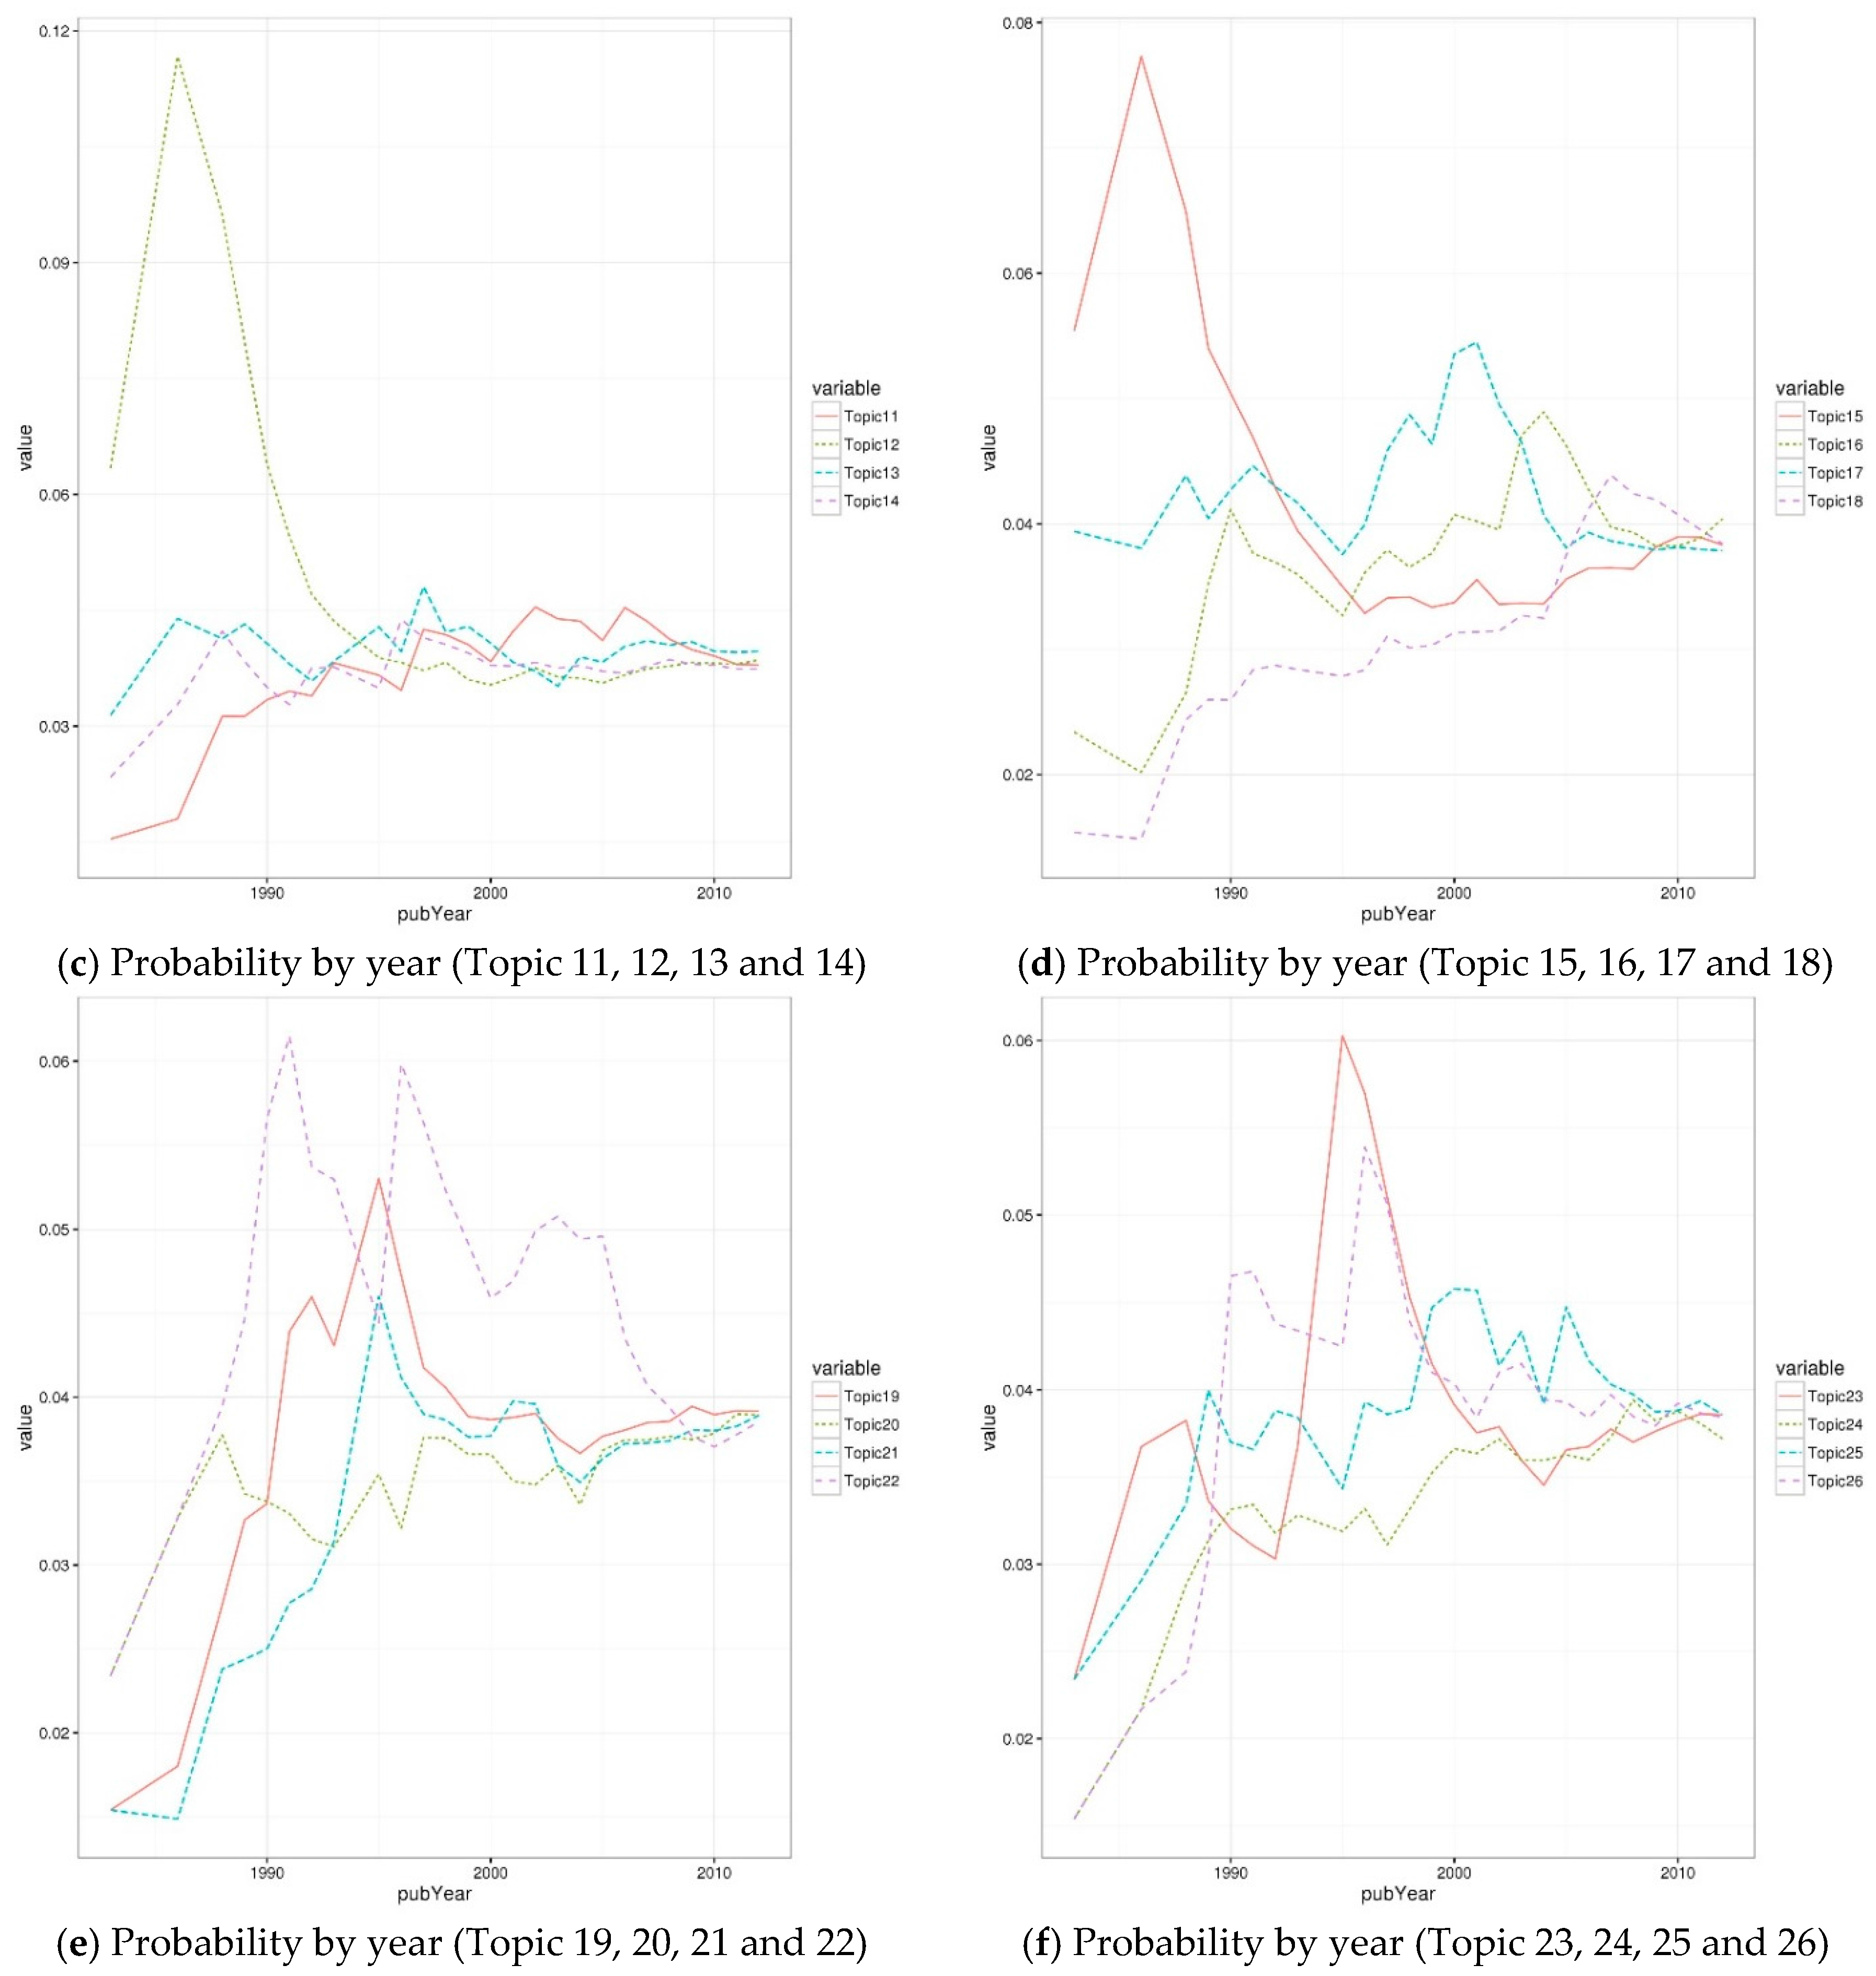
The overall trends of topics over time are observed. In Figure 4, topic probability is on the y-axis and its variability decreases from past to present. To apply recent variability to the analysis, the recent probability of topics needs to be weighted based on the assumption that recent variations are more important than past variations. Thus, the probabilities of each topic are weighted by year to reflect probabilistic recency. According to past studies on technology management, a probability of 0.6 was used to find the EWMA [85,86]. EWMA produces the smoothed probabilities of topics over time and Figure 5 shows the modified probabilities.
Next, we can use this information to define the hot and cold statuses. A topic is classified as hot if its probability per year is above the threshold. The topics were categorized into either a hot or cold status by applying the thresholds to EWMA-weighted probabilities. If the EWMA probability of a topic was beyond the threshold, the topic was labeled as hot. As explained above, this paper chose the threshold that could find the top 10 hot topics per annum. It is empirically discovered that 60 percentiles of topic probabilities per annum could define the top 10 topics from most periods.
As shown in Figure 4 and Figure 5, the probability of various topics continues to rise and fall. The hot and cold statuses of a topic can each show two different kinds of recurrent emergences: a topic assuming a hot status from a cold status, one maintaining its hot status, a topic assuming a cold status from a hot status, and one maintaining its cold status. Such a rise and fall could provide the following possible recurrent events: becoming hot, remaining hot over a period, becoming cold, and remaining cold over a period of years. Among those, the following events were focused and analyzed in this paper. Becoming hot represents the event of changing from a cold to a hot status for a particular topic. Becoming cold represents the event of changing from a hot to a cold status for a particular topic. That is because our focused cases can cover other cases. For example, the case of becoming hot has the gap time that is almost overlapped by the case of remaining cold. The case of becoming cold has the gap time that is mostly overlapped by the case of remaining hot. Such an overlap could lead to the duplicated models for different cases. In addition, the case of becoming cold can be interpreted as the case of remaining hot due to such an overlap.
After the recurrent patterns were identified, the time gap of each topic was calculated for these patterns. For example, assume that the probability of a certain topic was above the threshold in 1995, 2001, 2005, 2008, 2009, 2010, and 2011. The abovementioned patterns, such as becoming hot or cold, could be identified and their time gaps were calculated. The patterns for becoming hot ranged from 1983 to 1995 (a time gap of 12 years), 1996 to 2001 (five years), 2002 to 2005 (three years), and 2006 to 2008 (two years). The patterns for becoming cold ranged from 1995 to 1996 (a time gap of one year), 2001 to 2002 (one year), and 2005 to 2006 (one year). The time gap was modeled with both the patent-related and topic-related explanatory variables.
With the above setting, we constructed PWP-GT models of two patterns for each threshold. As a result, two results on becoming hot or cold were obtained. The estimated PWP-GT coefficient can be interpreted as follows: if the coefficient is positive, then the events tend to quickly reoccur. It is necessary to carefully apply such an interpretation in this study. For the case of becoming hot, a shorter time gap is preferred and the estimated coefficients are interpreted as usual. However, for the case of becoming cold, a longer gap time is appropriate and the estimated coefficients need to be interpreted inversely.
Table 5 and Table 6 show the results of PWP-GT for the two types of patterns, and the p-values of the variable that are less than 5% are considered to be significant.
The PWP-GT model for becoming hot showed as 0.509. Table 6 shows that for the results with a threshold of 0.6 for the average age of patents, the following variables were the significant variables associated with the recurrence of becoming hot: the average period of patents, the average number of patent IPCs, the transitivity on the topic network per topic, and the degree centrality on the topic network per topic.
The average age of patents was positively associated with the frequent recurrence of becoming a hot topic. If the average age increases by one unit, the hazard ratio of becoming a hot topic increases by 72.0461 times. If it decreases by one unit, the hazard ratio decreases by 98.61%. On the other hand, the average period of patents was negatively associated with the frequent recurrence of becoming a hot topic. A one-unit increase in the average period is 0.573 times more likely to decrease the hazard ratio of becoming a hot topic. If it decreases by one unit, the hazard ratio increases by 74.52%. In addition, the average IPCs of patents were negatively associated with the frequent recurrence of becoming a hot topic. If the average number of IPCs increase by one unit, the hazard ratio of becoming a hot topic decreases by 89.15%. If it decreases by one unit, the hazard ratio increases 9.2153 times.
With regard to the topic-related variables, the transitivity of the topic network was positively associated with the frequent recurrence of becoming hot. If the transitivity increases by one unit, the hazard ratio of becoming a hot topic increases by 2.711 times. A one-unit decrease in transitivity is also 0.3689 times more likely to decrease the hazard ratio. On the other hand, the degree centrality on the topic network was negatively associated with the frequent recurrence of becoming hot. If that centrality increases by one unit, the hazard ratio of becoming a hot topic decreases by 84.42%. A one-unit decrease in transitivity is also 6.42 times likely to increase the hazard ratio.
The model shows as 0.413, and Table 6 provides that the following variables are significant on the recurrence of becoming a cold topic: the average forward citations of patents, the average age of patents, the average period of patents, the trend of topic slope, and the transitivity on the topic network per each topic. The dependent variable of this model is the frequent recurrence of becoming a cold topic, and the coefficient is inversely interpreted.
The average forward citations of patents were negatively associated with the frequent recurrence of becoming a cold topic. If the average forward citation increases by one unit, the hazard ratio of becoming a cold topic decreases by 81.38%. If it decreases by one unit, the hazard ratio increases by 5.3716 times. In terms of maintaining a hot topic, the average forward citation was positively associated. In addition, the average IPCs of patents were negatively associated with the frequent recurrence of becoming cold topic. If the average number of IPCs increases by one unit, the hazard ratio of becoming a hot topic decreases by 88.8%. If it decreases by one unit, the hazard ratio increases by 8.9324 times. This variable could be also inversely interpreted that it was positively associated with the topic’s maintaining a hot status.
On the other hand, the following variables showed a positive association with becoming a cold topic, and those variables could be negatively interpreted in terms of maintaining a hot topic status. First, the average age of patents was positively associated with the frequent recurrence of becoming a cold topic. A one-unit increase in the average period is 16.6845 times more likely to increase the hazard ratio of becoming a cold topic. If it decreases by one unit, the hazard ratio decreases by 94.1%. Next, with regard to the topic-related variables, the transitivity of the topic network was positively associated with the frequent recurrence of becoming cold. If the transitivity increases by one unit, the hazard ratio of becoming a hot topic increases by 1.9745 times. A one-unit decrease in transitivity is also 0.5065 times more likely to decrease the hazard ratio. Finally, the trend of the topic slope was positively associated with the frequent recurrence of becoming hot. If that centrality increases by one unit, the hazard ratio of becoming a hot topic increases 2.1810 times. A one-unit decrease in transitivity is also 0.4585 times likely to decrease the hazard ratio.
Interestingly, the average age of patents, the average IPCs of patents, and the transitivity of the topic network have the same sign of coefficients. These variables were positively associated with becoming a hot topic, and those were negatively associated with maintaining a hot topic. Those topics were considered to lead the change of topic status. On the other hand, the average period of patents and the degree on the topic network only affected becoming a hot topic. Similarly, the average forward citations of patents and the trend of the topic slope only had an influence on becoming a cold topic.
5. Discussion and Conclusions
Managing intellectual property is increasingly important in diverse industries [1,87]. Particularly, the innovative BM is necessary for effective business management [88]. Managing and utilizing BM patents have widely been exploited and expanded in the financial sector. Various forms of financial BM patents have been granted due to the convergence of the IT and financial industries, considered “Fintech”. Many financial companies are interested in creating influential financial BM patents because they are recognized as essential assets and important opportunities for organizations [89,90]. Therefore, an effective methodology is necessary for identifying emerging topics and their rising and falling trends in financial BMs.
By applying LDA to financial BM patents, 26 topics related to financial BMs are identified. The annual probabilities of the topics were summarized and adjusted by EWMA. The overall trend of each topic was observed and summarized the top five hot and cold topics. The hot topics included the following areas: auction marketplace, consumer authentication, asset allocation system, advisory service, and trading system. Cold topics mainly included the automated algorithms to deal with long and short positions, matching preferences on derivatives, health insurance, project cash flow simulations, and mobile money transferring techniques.
Following this procedure, the up and down trends for the 26 topics were investigated by year based on both patent-related and topic-related features. A topic was annually classified as hot if its annual probabilities exceeded the threshold. PWP-GT was employed to examine two types of recurrent patterns, whereby the topics of financial BMs became hot or cold based on the financial BM patents. Moreover, this study also examined how the variables from the patent side and the topic side were associated with such recurrent patterns. In the following, we discuss the effect of both patent side and topic side variables. First, the findings provide that the status change can be led by the high age of patents, the low IPCs of patents, and the high transitivity of the topic network. It indicates that a topic that is aged and specific in certain areas is likely to experience its becoming hot or cold. Second, if a topic is promptly granted and not widely associated with other topics, it is likely to become hot. In addition, it also shows that a topic with a high forward citation slowly becomes cold. Therefore, a topic that is quickly granted with high forward citations needs to be monitored for its high possibility of becoming and maintaining hot. Third, for a topic in which occurrence probability has an increasing trend over periods, it could be difficult to retain a hot status. That is, a topic with an increasing trend over time could have a rather low probability of becoming hot, although it is normally expected that the topics with an increasing trend are likely to become hot. In other words, the results imply that it is important to monitor the cold topics with non-increasing trends over time.
Interestingly, the findings show the life cycle of the identified topics in financial BMs. From the findings of this study, we provide the following implications for the financial BMs. The methodology of this paper can contribute to predicting the hot topics, and it can even support firms or R&D team to focus on those hot topics for their R&D planning. By concentrating the hot topics, R&D activity can reduce the probability of experiencing trial and error, and such efficiency can eventually contribute to the sustainable growth of economy. In addition, as our methodology and its effective exploitations are demonstrated, the patent based innovation ecosystem can expand its role for sustainable economic growth.
This study proposed a methodology based on unstructured and structured data for identifying emerging topics and trends in financial BMs. Findings of this paper will be helpful in discovering and monitoring emerging topics and their recurrent appearance in both financial and non-financial institutions. Our approach can also be utilized to further analyze emerging topics for articles and various reports in other industries. The limitations of this study are as follows. First, this paper only considered financial BM patents from USPTO. When patents corresponding to the financial BM are considered from other patent offices, it is expected that the results could provide more meaningful findings and contribute towards the discovery of hot topics and their trends in the financial area. Second, the findings are limited because only abstracts of papers were analyzed. The claims within the bodies of patents can also be utilized. These extensions to our work are left as areas for further study.
Acknowledgments
This work was supported by a National Research Foundation of Korea (NRF) grant funded by the Korean government (MSIP) (2016R1A2A1A05005270).
Author Contributions
Won Sang Lee reviewed the related literature, conducted the analysis, interpreted the results, and wrote the manuscript. So Young Sohn designed the study, outlined the methodology, and helped to draft the paper. Both authors have read and approved the final manuscript.
Conflicts of Interest
The authors declare no conflict of interest.
References
- Han, E.J.; Sohn, S.Y. Firms’ Negative Perceptions on Patents, Technology Management Strategies, and Subsequent Performance. Sustainability 2017, 9, 440. [Google Scholar] [CrossRef]
- Kim, Y.S.; Han, E.J.; Sohn, S.Y. Demand Forecasting for Heavy-Duty Diesel Engines Considering Emission Regulations. Sustainability 2017, 9, 166. [Google Scholar] [CrossRef]
- Sadri McCampbell, A.; Moorhead Clare, L.; Howard Gitters, S. Knowledge management: The new challenge for the 21st century. J. Knowl. Manag. 1999, 3, 172–179. [Google Scholar] [CrossRef]
- Spiegler, I. Technology and knowledge: Bridging a generating gap. Inf. Manag. 2003, 40, 533–539. [Google Scholar] [CrossRef]
- Leal-Millán, A.; Roldan, J.L.; Leal-Rodríguez, A.L.; Ortega-Gutiérrez, J. IT and relationship learning in networks as drivers of green innovation and customer capital: Evidence from the automobile sector. J. Knowl. Manag. 2016, 20, 444–465. [Google Scholar] [CrossRef]
- Spulber, D.F. Should business method inventions be patentable? J. Legal Anal. 2011, 3, 265–340. [Google Scholar] [CrossRef]
- Moon, T.H.; Kim, Y.; Sohn, S.Y. Technology credit rating system for funding SMEs. J. Oper. Res. Soc. 2011, 62, 608–615. [Google Scholar] [CrossRef]
- Moon, T.H.; Sohn, S.Y. Survival analysis for technology credit scoring adjusting total perception. J. Oper. Res. Soc. 2011, 62, 1159–1168. [Google Scholar] [CrossRef]
- Moon, T.H.; Sohn, S.Y. Technology credit scoring model considering both SME characteristics and economic conditions: The Korean case. J. Oper. Res. Soc. 2010, 61, 666–675. [Google Scholar] [CrossRef]
- Sohn, S.Y.; Moon, T.H.; Kim, S.H. Improved technology scoring model for credit guarantee fund. Expert Syst. Appl. 2005, 28, 327–331. [Google Scholar] [CrossRef]
- Sohn, S.Y.; Kim, Y.S. Behavioral credit scoring model for technology-based firms that considers uncertain financial ratios obtained from relationship banking. Small Bus. Econ. 2013, 41, 1–13. [Google Scholar] [CrossRef]
- Austin, N. The future of the financial workplace: Banks, workplace and property in a changing world. Corp. Real Estate J. 2015, 4, 156–165. [Google Scholar]
- Walker, A. Banking without banks: Exploring the disruptive effects of converging technologies that will shape the future of banking. J. Secur. Oper. Custody. 2014, 7, 69–80. [Google Scholar]
- Hirsch-Kreinsen, H. Financial market and technological innovation. Ind. Innov. 2011, 18, 351–368. [Google Scholar] [CrossRef]
- Petruzzi, C.; Del Valle, M.; Judlowe, S. Patent and copyright protection for innovations in finance. Financ. Manag. 1988, 17, 66–71. [Google Scholar] [CrossRef]
- Hall, B.H. Business Method Patents, Innovation, and Policy; Working Paper; National Bureau of Economic Research: Cambridge, MA, USA, 2003. [Google Scholar]
- Ju, Y.H.; Sohn, S.Y. Identifying patterns in rare earth element patents based on text and data mining. Scientometrics 2015, 102, 389–410. [Google Scholar] [CrossRef]
- Arora, S.K.; Porter, A.L.; Youtie, J.; Shapira, P. Capturing new developments in an emerging technology: An updated search strategy for identifying nanotechnology research outputs. Scientometrics 2013, 95, 351–370. [Google Scholar] [CrossRef]
- Ju, Y.H.; Sohn, S.Y. Patent network analysis for finance sector. Financ. Inf. Res. 2012, 1, 1–32. [Google Scholar]
- Blei, D.M.; Ng, A.Y.; Jordan, M.I. Latent dirichlet allocation. J. Mach. Learn. Res. 2003, 3, 993–1022. [Google Scholar]
- Yan, Z.; Zhou, J. Optimal answerer ranking for new questions in community question answering. Inf. Process. Manag. 2015, 51, 163–178. [Google Scholar] [CrossRef]
- Chen, S.H. The influencing factors of enterprise sustainable innovation: An empirical study. Sustainability 2016, 8, 425. [Google Scholar] [CrossRef]
- Gorissen, L.; Vrancken, K.; Manshoven, S. Transition Thinking and Business Model Innovation—Towards a Transformative Business Model and New Role for the Reuse Centers of Limburg, Belgium. Sustainability 2016, 8, 112. [Google Scholar] [CrossRef]
- De Marchi, V.; Grandinetti, R. Knowledge strategies for environmental innovations: The case of Italian manufacturing firms. J. Knowl. Manag. 2013, 17, 569–582. [Google Scholar] [CrossRef]
- Ou, W.; Xie, Z.; Jia, X.; Xie, B. Detection of Topic Communities in Social Networks Based on Tri-LDA Model. In Proceedings of the 4th International Conference on Computer Engineering and Networks, Shanghai, China, 19–20 July 2014; Springer: Cham, Switzerland, 2015; pp. 1245–1253. [Google Scholar]
- Kim, C.; Jeon, J.H.; Kim, M.S. Identification and Management of opportunities for technology-based services: A patent-based portfolio approach. Innovation 2015, 17, 232–249. [Google Scholar] [CrossRef]
- Ju, Y.H.; Sohn, S.Y. Technology credit scoring based on a quantification method. Sustainability 2017, 9, 1057. [Google Scholar] [CrossRef]
- Starešinic, M.; Boh, B. Patent informatics: The issue of relevance in full-text patent document searches. Online Inf. Rev. 2009, 33, 157–172. [Google Scholar] [CrossRef]
- Roach, M. Lens? Or Prism? Patent Citations as a Measure of Knowledge Flows from Public Research; Working Paper No. 18292; National Bureau of Economic Research: Cambridge, MA, USA, 2012. [Google Scholar]
- Harhoff, D.; Narin, F.; Scherer, F.M.; Vopel, K. Citation frequency and the value of patented inventions. Rev. Econ. Stat. 1999, 81, 511–515. [Google Scholar] [CrossRef]
- Harhoff, D.; Scherer, F.M.; Vopel, K. Citation, family size, opposition and the value of patent rights. Res. Policy 2003, 32, 1343–1363. [Google Scholar] [CrossRef]
- Lerner, J. The importance of patent scope: An empirical analysis. RAND J. Econ. 1994, 25, 319–333. [Google Scholar] [CrossRef]
- Han, E.J.; Sohn, S.Y. Patent valuation based on text mining and survival analysis. J. Technol. Transf. 2014, 40, 821–839. [Google Scholar] [CrossRef]
- Daim, T.U.; Rueda, G.; Martin, H.; Gerdsr, P. Forecasting emerging technologies: Use of bibliometircs and patent analysis. Technol. Forecast. Soc. Chang. 2006, 73, 981–1012. [Google Scholar] [CrossRef]
- Grönqvist, C. The private value of patents by patent characteristics: Evidence from Finland. J. Technol. Transf. 2009, 34, 159–168. [Google Scholar] [CrossRef]
- Tseng, Y.H.; Lin, C.J.; Lin, Y.I. Text mining techniques for patent analysis. Inf. Process. Manag. 2007, 43, 1216–1247. [Google Scholar] [CrossRef]
- Lee, W.S.; Han, E.J.; Sohn, S.Y. Predicting the pattern of technology convergence using big-data technology on large-scale triadic patents. Technol. Forecast. Soc. Chang. 2015, 100, 317–329. [Google Scholar] [CrossRef]
- Ma, J.; Porter, A.L. Analyzing patent topical information to identify technology pathways and potential opportunities. Scientometrics 2015, 102, 811–827. [Google Scholar] [CrossRef]
- Al-Hassan, A.A.; Alshameri, F.; Sibley, E.H. A research case study: Difficulties and recommendations when using a textual data mining tool. Inf. Manag. 2013, 50, 540–552. [Google Scholar] [CrossRef]
- Herschel, R.T.; Jones, N.E. Knowledge management and business intelligence: The importance of integration. J. Knowl. Manag. 2005, 9, 45–55. [Google Scholar] [CrossRef]
- Lee, M.Y.; Lee, A.S.; Sohn, S.Y. Behavior scoring model for coalition loyalty programs by using summary variables of transaction data. Expert Syst. Appl. 2012, 40, 1564–1570. [Google Scholar] [CrossRef]
- Mikawa, K.; Ishida, T.; Goto, M. An Optimal Weighting Method in Supervised Learning of Linguistic Model for Text Classification. Ind. Eng. Manag. Syst. 2012, 11, 87–93. [Google Scholar] [CrossRef]
- McGarry, K.; Garfield, S.; Morris, N. Recent trends in knowledge and data integration for the life sciences. Expert Syst. 2006, 23, 330–341. [Google Scholar] [CrossRef]
- Sun, J.; Wang, G.; Cheng, X.; Fu, Y. Mining affective text to improve social media item recommendation. Inf. Process. Manag. 2014, 51, 444–457. [Google Scholar] [CrossRef]
- Uramoto, N.; Matsuzawa, H.; Nagano, T.; Murakami, A.; Takeuchi, H.; Takeda, K. A text-mining system for knowledge discovery from biomedical documents. IBM Syst. J. 2004, 43, 516–533. [Google Scholar] [CrossRef]
- Yang, H.C.; Lee, C.H. A text mining approach on automatic generation of web directories and hierarchies. Expert Syst. Appl. 2004, 27, 645–663. [Google Scholar] [CrossRef]
- Choi, J.Y.; Jeong, S.; Kim, K. A study on diffusion pattern of technology convergence: Patent analysis for Korea. Sustainability 2015, 7, 11546–11569. [Google Scholar] [CrossRef]
- Romano, M.; Del Giudice, M.; Nicotra, M. Knowledge creation and exploitation in Italian universities: The role of internal policies for patent activity. J. Knowl. Manag. 2014, 18, 952–970. [Google Scholar] [CrossRef]
- Lee, W.J.; Lee, W.K.; Sohn, S.Y. Patent Network Analysis and Quadratic Assignment Procedures to Identify the Convergence of Robot Technologies. PLoS ONE 2016, 11, e0165091. [Google Scholar] [CrossRef] [PubMed]
- Seol, H.; Lee, S.; Kim, C. Identifying new business areas using patent information: A DEA and text mining approach. Expert Syst. Appl. 2011, 38, 2933–2941. [Google Scholar] [CrossRef]
- Trappey, A.J.; Trappey, C.V. An R&D knowledge management method for patent document summarization. Ind. Manag. Data Syst. 2008, 108, 245–257. [Google Scholar]
- Zhu, D.; Porter, A.L. Automated extraction and visualization of information for technological intelligence and forecasting. Technol. Forecast. Soc. Chang. 2002, 69, 498–506. [Google Scholar] [CrossRef]
- Feldman, R.; Fresko, M.; Hirsh, H.; Aumann, Y.; Liphstat, O.; Schler, Y.; Rajman, M. Knowledge management: A text mining approach. In Proceedings of the 2nd International Conference on Practical Aspects of Knowledge Management (PAKM98), Swiss Life Information Systems Research, Zurich, Switzerland, 29–30 October 1998. [Google Scholar]
- Alter, O.; Brown, P.O.; Botstein, D. Singular value decomposition for genome-wide expression data processing and modeling. Proc. Natl. Acad. Sci. USA 2000, 97, 10101–10106. [Google Scholar] [CrossRef] [PubMed]
- Husbands, P.; Simon, H.; Ding, C. On the use of the singular value decomposition for text retrieval. Comput. Inf. Retr. 2001, 106, 145–156. [Google Scholar]
- Momeni, A.; Rost, K. Identification and monitoring of possible disruptive technologies by patent-development paths; topic modeling. Technol. Forecast. Soc. Chang. 2016, 104, 16–29. [Google Scholar] [CrossRef]
- Jiang, H.; Qiang, M.; Lin, P. A topic modeling based bibliometric exploration of hydropower research. Renew. Sustain. Energy Rev. 2016, 57, 226–237. [Google Scholar] [CrossRef]
- Lewensohn, D.; Dahlborg, C.; Kowalski, J.; Lundin, P. Applying patent survival analysis in the academic context. Res. Eval. 2015, 24, 197–212. [Google Scholar] [CrossRef]
- Tsang, S.S.; Chang, F.C.; Wang, W.C. A Survival Analysis on Fuel Cell Technology Patent Maintenance and Values Exploration between 1976 and 2001. Adv. Mater. Sci. Eng. 2015, 2015. [Google Scholar] [CrossRef]
- Hosmer, D.W.L.S.; Lemeshow, S.; May, S. Applied Survival Analysis; Wiley: Hoboken, NY, USA, 2008. [Google Scholar]
- Deans, K.J.; Thackeray, J.; Groner, J.I.; Cooper, J.N.; Minneci, P.C. Risk factors for recurrent injuries in victims of suspected non-accidental trauma: A retrospective cohort study. BMC Pediatr. 2014, 14, 217. [Google Scholar] [CrossRef] [PubMed]
- Frick, U.; Frick, H.; Langguth, B.; Landgrebe, M.; Hübner-Liebermann, B.; Hajak, G. The revolving door phenomenon revisited: Time to readmission in 17’415 patients with 37’697 hospitalisations at a German psychiatric hospital. PLoS ONE 2013, 8, e75612. [Google Scholar] [CrossRef]
- Godlewski, C.J. The dynamics of bank debt renegotiation in Europe: A survival analysis approach. Econ. Model. 2015, 49, 19–31. [Google Scholar] [CrossRef]
- Larney, S.; Toson, B.; Burns, L.; Dolan, K. Effect of prison based opioid substitution treatment and post-release retention in treatment on risk of re-incarceration. Addiction 2012, 107, 372–380. [Google Scholar] [CrossRef] [PubMed]
- Hall, B.H. Business and Financial Method Patents, Innovation, and Policy; Working Paper; National Bureau of Economic Research: Cambridge, MA, USA, 2009. [Google Scholar]
- Lerner, J. The new financial thing: The origins of financial innovations. J. Financ. Econ. 2006, 79, 223–255. [Google Scholar] [CrossRef]
- USPTO. Automated Financial or Management Data Processing Methods (Business Methods); White Paper; USPTO: Alexandria, VA, USA, 1999.
- Lanjouw, J.O.; Schankerman, M. Patent quality and research productivity: Measuring innovation with multiple indicators. Econ. J. 2004, 114, 441–465. [Google Scholar] [CrossRef]
- Lee, B.K.; Sohn, S.Y. Exploring the effect of dual use on the value of military technology patents based on the renewal decision. Scientometrics 2017, 112, 1203–1227. [Google Scholar] [CrossRef]
- Guellec, D.; van Pottelsberghe de la Potterie, B. Applications, grants and the value of patent. Econ. Lett. 2000, 69, 109–114. [Google Scholar] [CrossRef]
- Sohn, S.Y.; Lee, W.S.; Ju, Y.H. Valuing academic patents and intellectual properties: Different perspectives of willingness to pay and sell. Technovation 2013, 33, 13–24. [Google Scholar] [CrossRef]
- Lee, J.; Sohn, S.Y. What makes the first forward citation of a patent occur earlier? Scientometrics 2017. [Google Scholar] [CrossRef]
- Harhoff, D.; Wagner, S. Modeling the Duration of Patent Examination at the European Patent Office; Paper No. 5283; Centre for Economic Policy Research: London, UK, 2005. [Google Scholar]
- Gilsing, V.A.; Cloodt, M.; Bertrand–Cloodt, D. What makes you more central? Antecedents of changes in betweenness-centrality in technology-based alliance networks. Technol. Forecast. Soc. Chang. 2016, 111, 209–221. [Google Scholar] [CrossRef]
- Lazzeretti, L.; Capone, F. How proximity matters in innovation networks dynamics along the cluster evolution. A study of the high technology applied to cultural goods. J. Bus. Res. 2016, 69, 5855–5865. [Google Scholar] [CrossRef]
- Wang, C.; Rodan, S.; Fruin, M.; Xu, X. Knowledge networks, collaboration networks, and exploratory innovation. Acad. Manag. J. 2014, 57, 484–514. [Google Scholar] [CrossRef]
- Choi, H.S.; Lee, W.S.; Sohn, S.Y. Analyzing research trends in personal information privacy using topic modeling. Comput. Secur. 2017, 67, 244–253. [Google Scholar] [CrossRef]
- Srivastava, A.N.; Sahami, M. (Eds.) Text Mining: Classification, Clustering, and Applications; CRC Press: Boca Raton, FL, USA, 2009. [Google Scholar]
- Jacobson, K.; Sandler, M.B.; Fields, B. Using Audio Analysis and Network Structure to Identify Communities in On-Line Social Networks of Artists. In Proceedings of the ISMIR 2008—9th International Conference of Music Information Retrieval, Philadelphia, PA, USA, 14–18 September 2008; pp. 269–274. [Google Scholar]
- Bolelli, L.; Ertekin, Ş.; Giles, C.L. Topic and trend detection in text collections using latent dirichlet allocation. In Advances in Information Retrieval; Springer: Berlin/Heidelberg, Germany, 2009; pp. 776–780. [Google Scholar]
- Linstead, E.; Lopes, C.; Baldi, P. An application of latent dirichlet allocation to analyzing software evolution. In Proceedings of the ICMLA’08—Seventh International Conference on Machine Learning and Applications, San Diego, CA, USA, 11–13 December 2008; pp. 813–818. [Google Scholar]
- Hornik, K.; Grün, B. Topicmodels: An R package for fitting topic models. J. Stat. Softw. 2011, 40, 1–30. [Google Scholar]
- Duque, A.; Martinez-Romo, J.; Araujo, L. Choosing the best dictionary for cross-lingual word sense disambiguation. Knowl.-Based Syst. 2015, 81, 65–75. [Google Scholar] [CrossRef]
- Ferreira, L.N.; Zhao, L. Time series clustering via community detection in networks. Inf. Sci. 2016, 326, 227–242. [Google Scholar] [CrossRef]
- Moon, T.H.; Sohn, S.Y. Case-based reasoning for predicting multiperiod financial performances of technology-based SMEs. Appl. Artif. Intell. 2008, 22, 602–615. [Google Scholar] [CrossRef]
- Sohn, S.Y.; Kim, J.W. Decision tree-based technology credit scoring for start-up firms: Korean case. Expert Syst. Appl. 2012, 39, 4007–4012. [Google Scholar] [CrossRef]
- Wu, I.L.; Chen, J.L. Knowledge management driven firm performance: The roles of business process capabilities and organizational learning. J. Knowl. Manag. 2014, 18, 1141–1164. [Google Scholar] [CrossRef]
- Wu, K.J.; Liao, C.J.; Tseng, M.L.; Chou, P.J. Understanding innovation for sustainable business management capabilities and competencies under uncertainty. Sustainability 2015, 7, 13726–13760. [Google Scholar] [CrossRef]
- Rajan, R.G. Presidential address: The corporation in finance. J. Financ. 2012, 67, 1173–1217. [Google Scholar] [CrossRef]
- Ray, S. Towards searching the relevance of intellectual property audit in India: An appraisal. Res. J. Financ. Account. 2011, 2, 86–97. [Google Scholar]
Figure 1.
Number of financial Business Method (BM) patents registered with the United States Patent and Trademark Office (USPTO) (by year).
Figure 1.
Number of financial Business Method (BM) patents registered with the United States Patent and Trademark Office (USPTO) (by year).
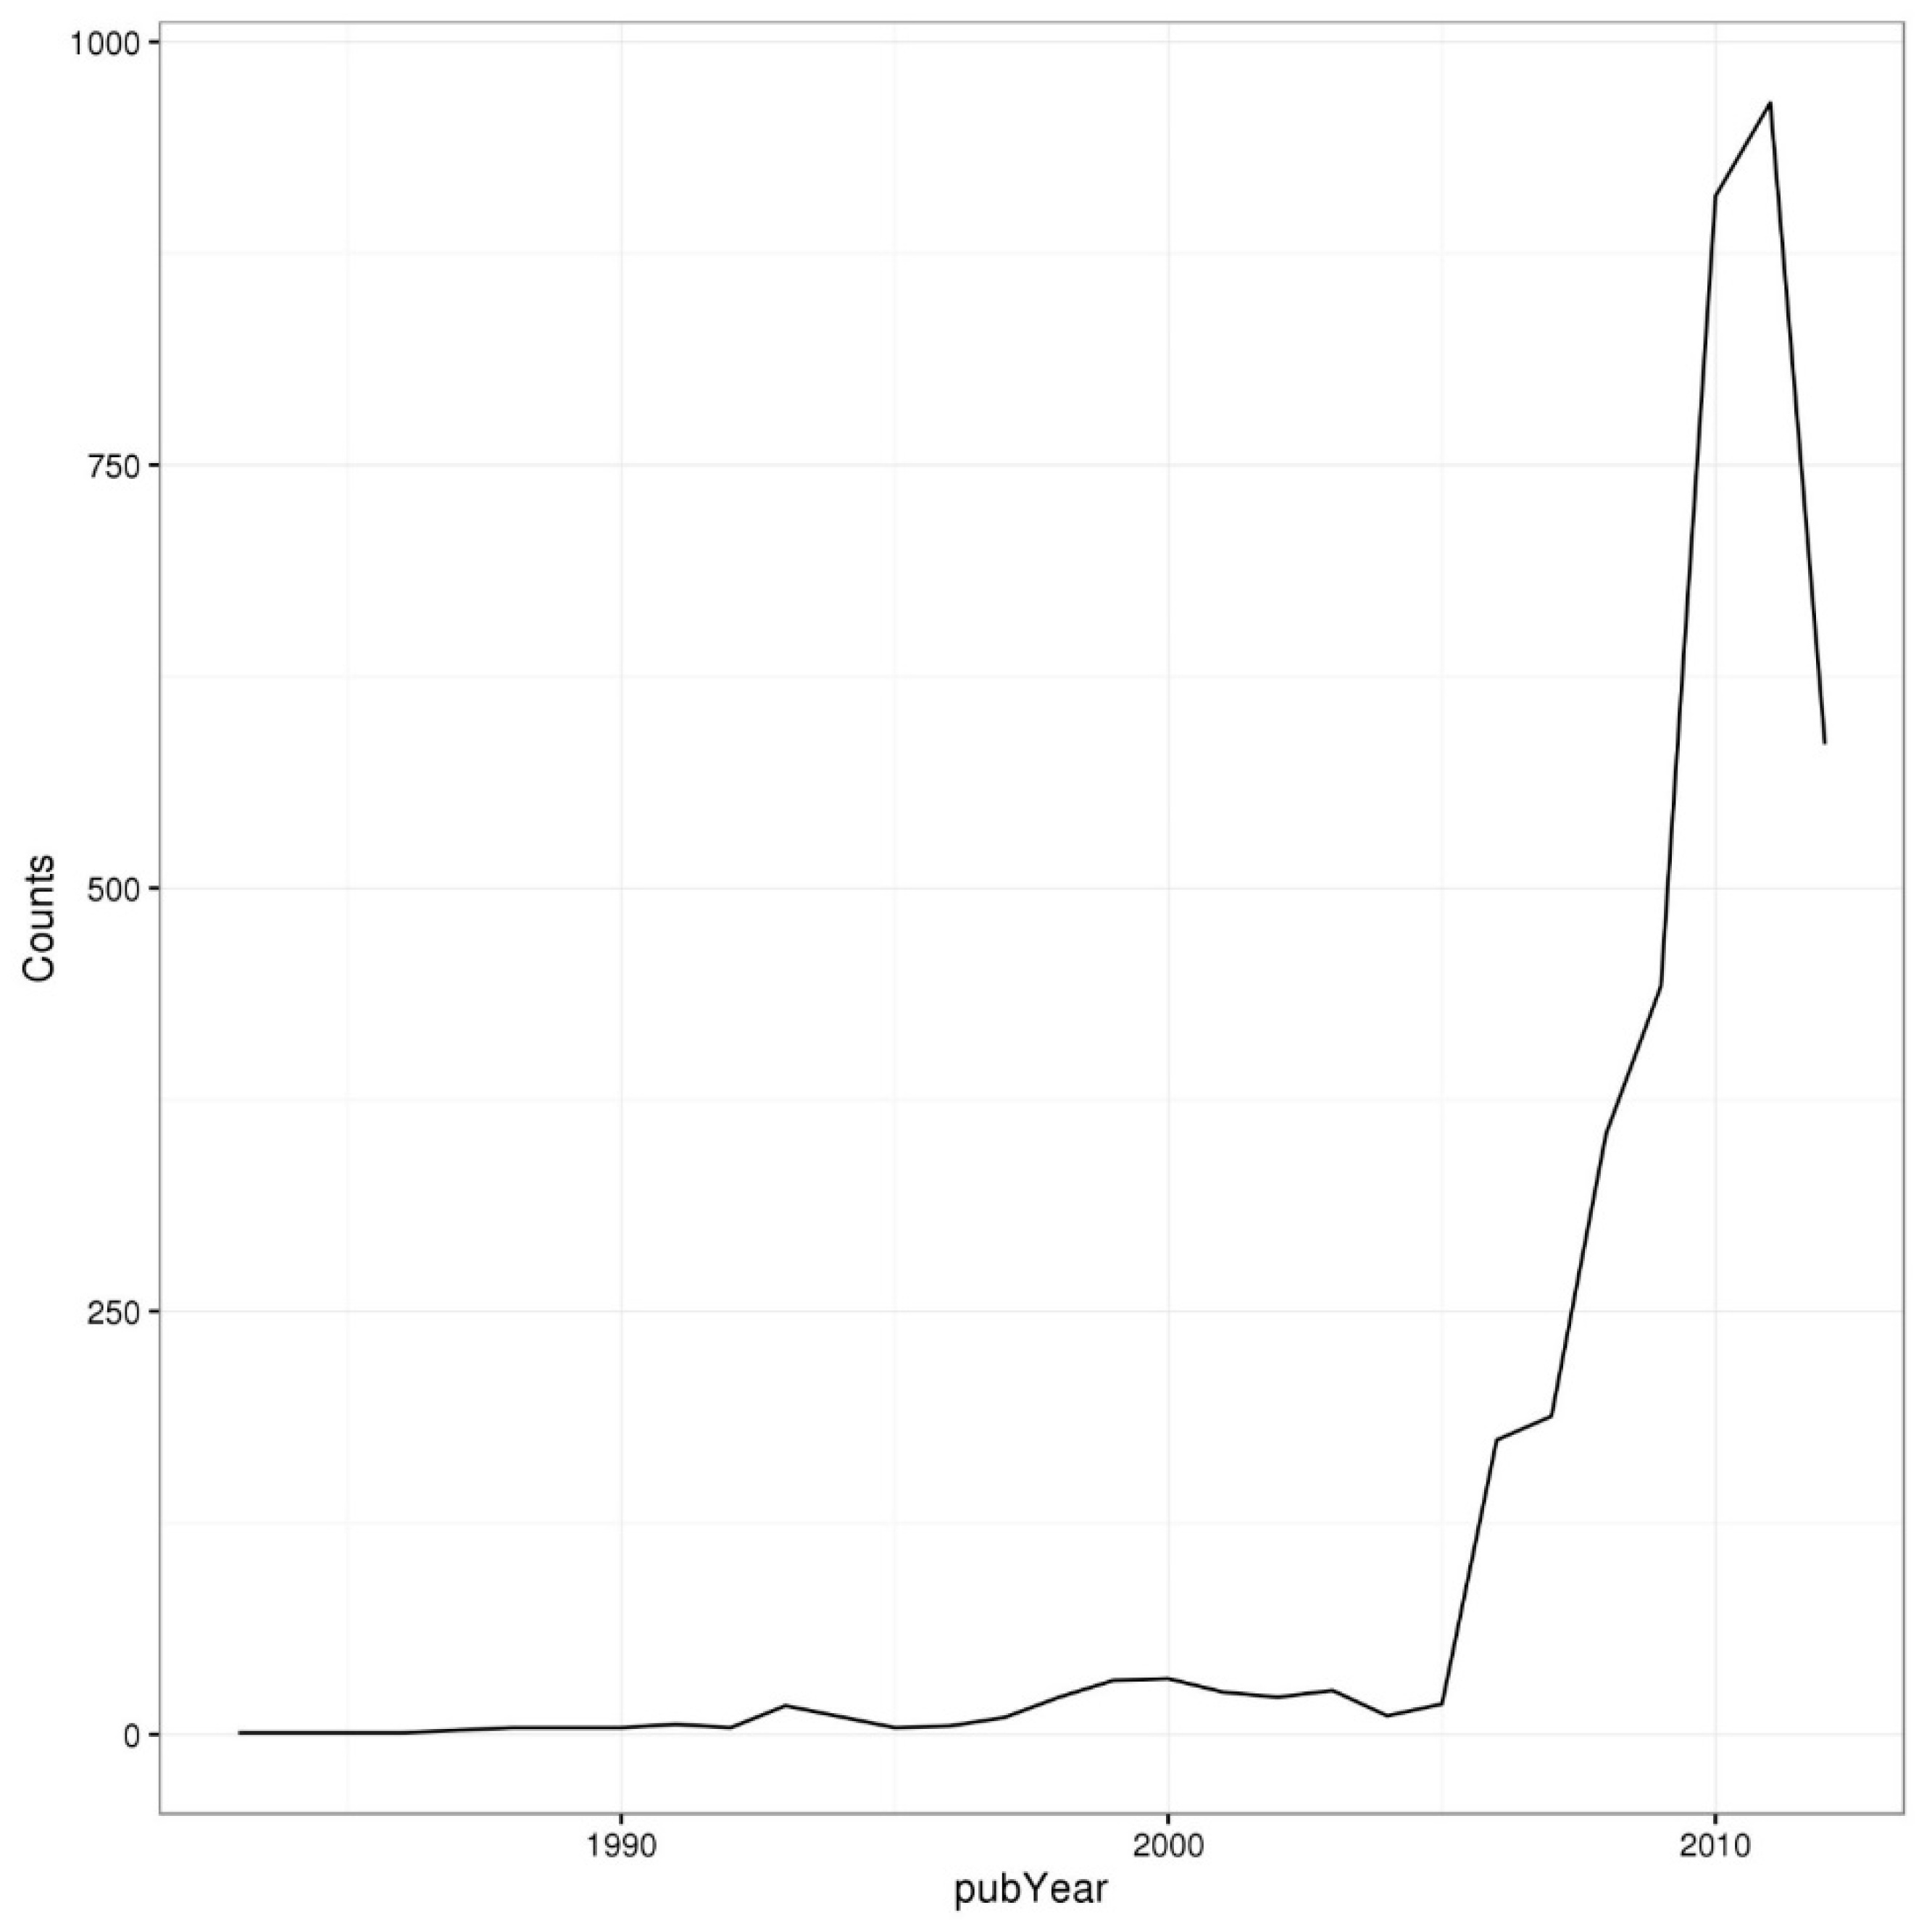
Figure 2.
Perplexity by Number of Topics (K) with 10-fold cross-validation.
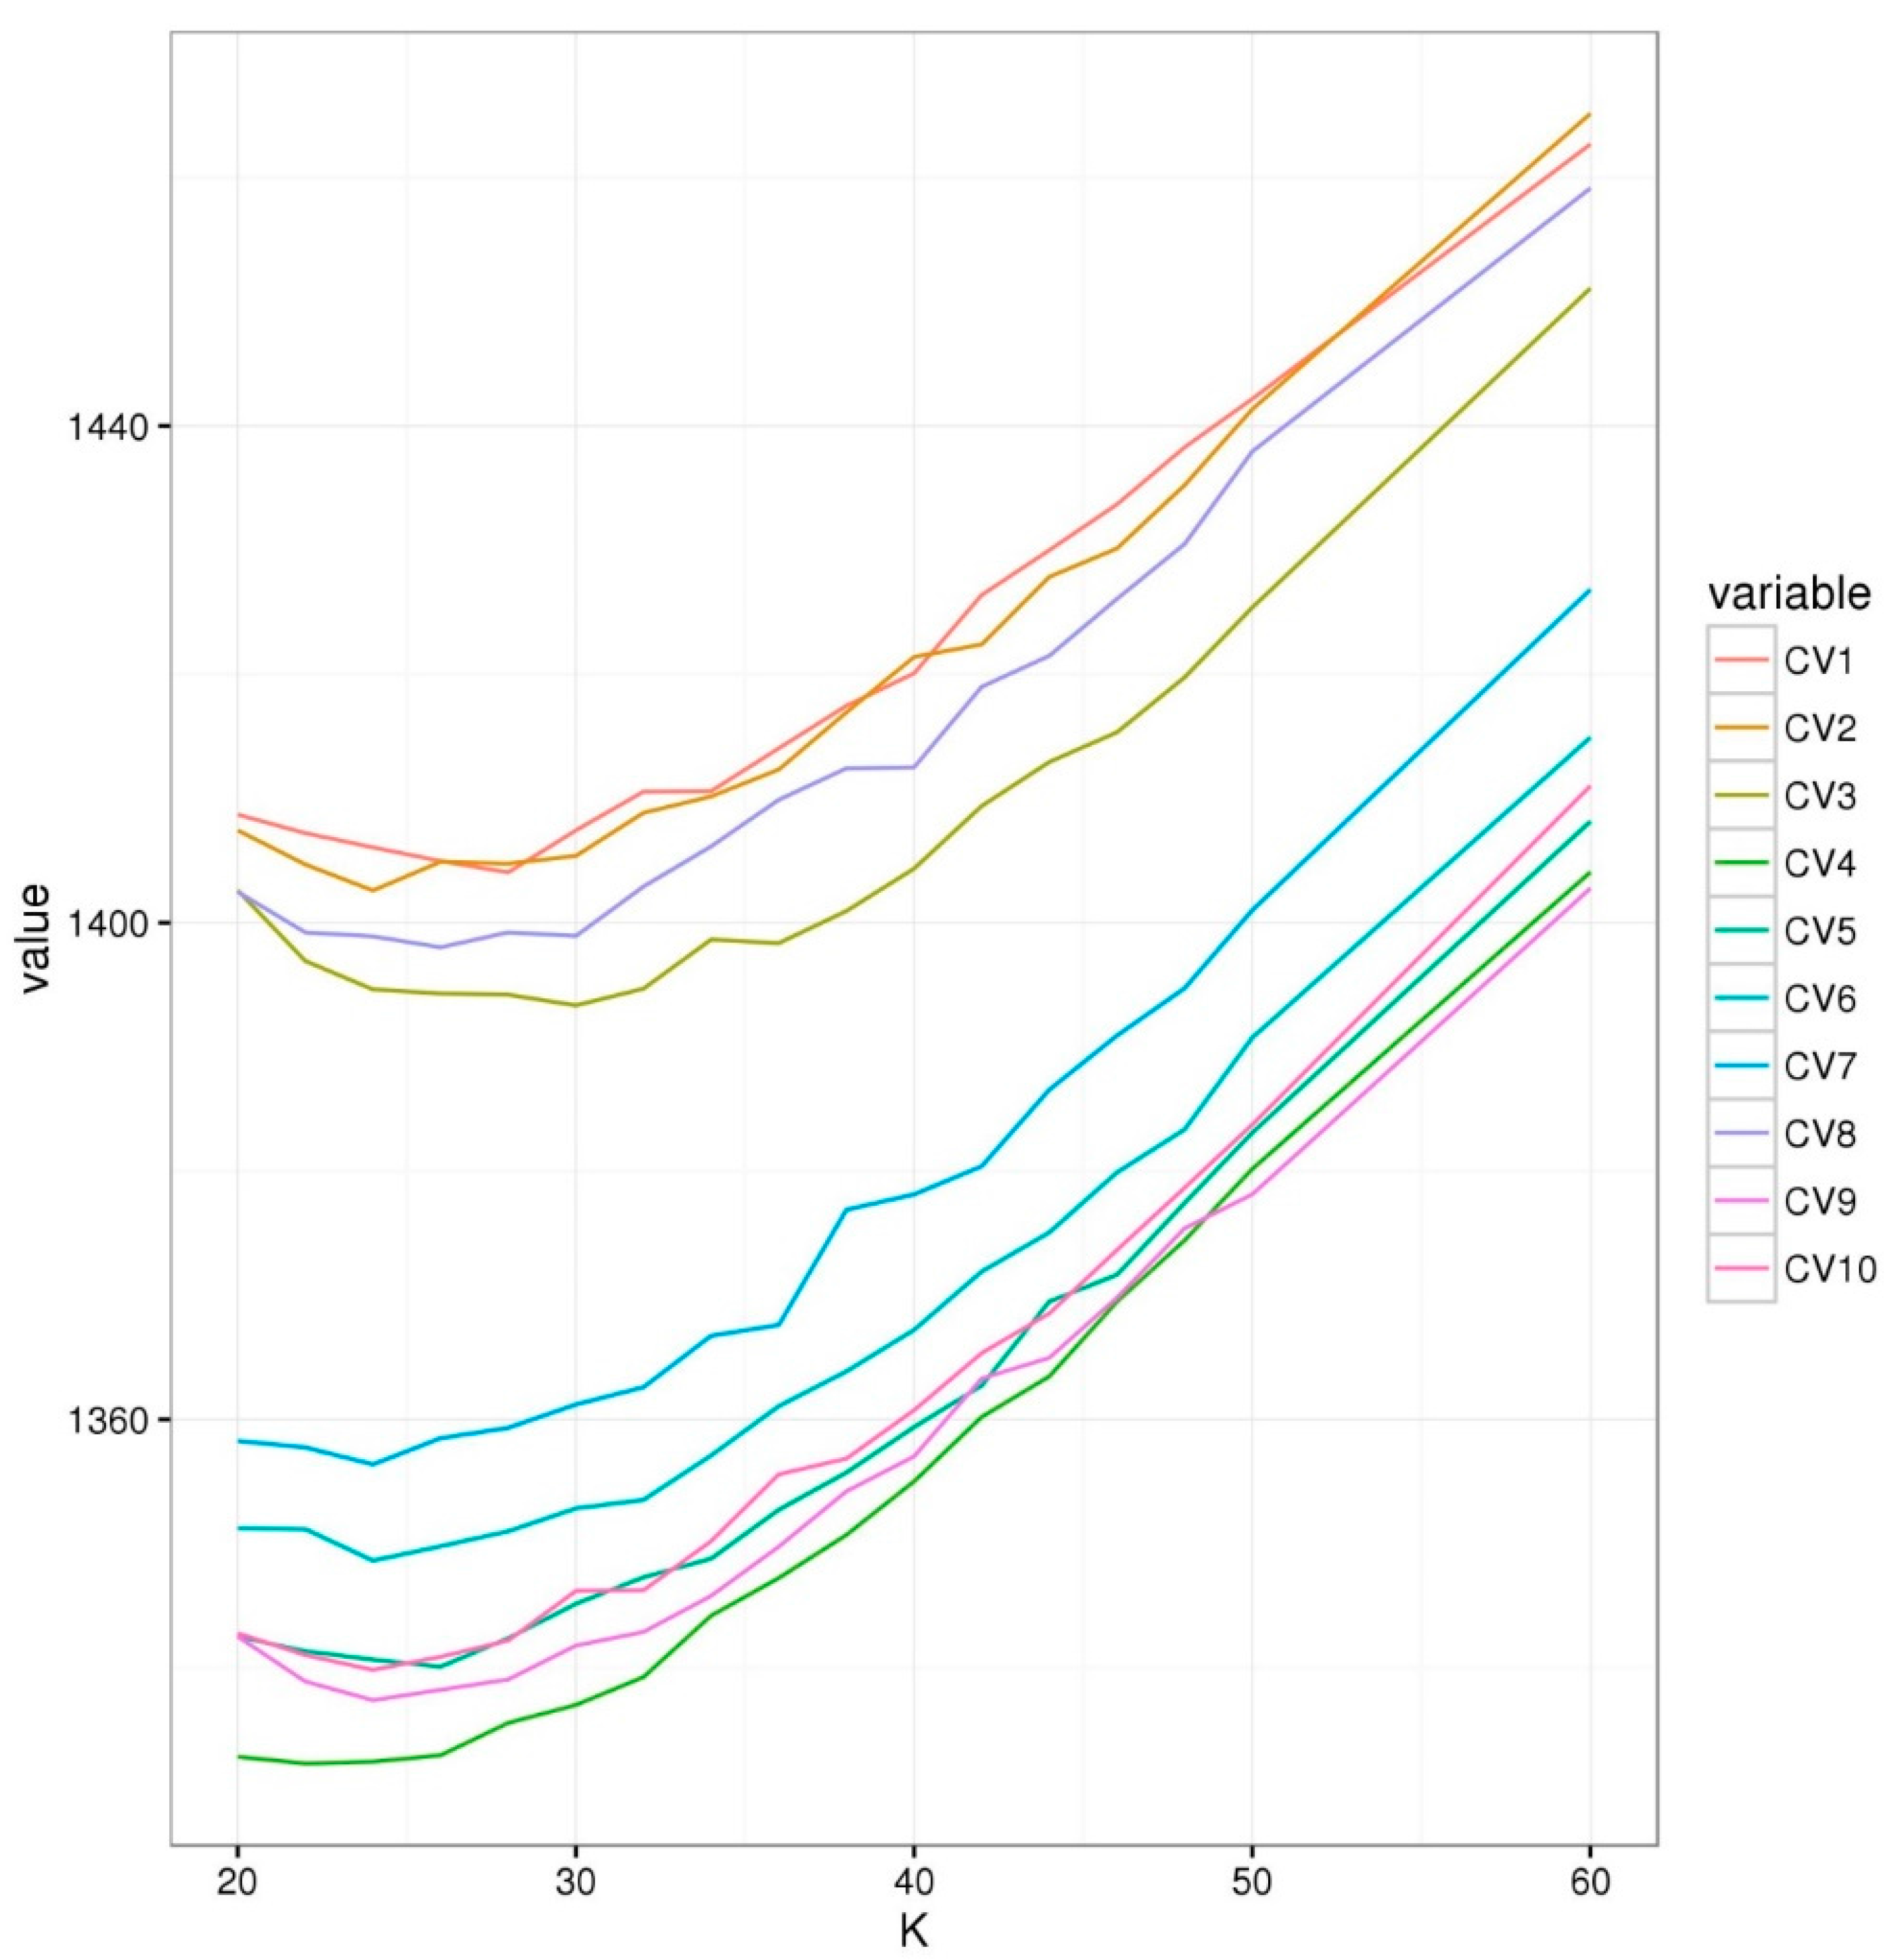
Figure 3.
Detected subgraphs of topics.
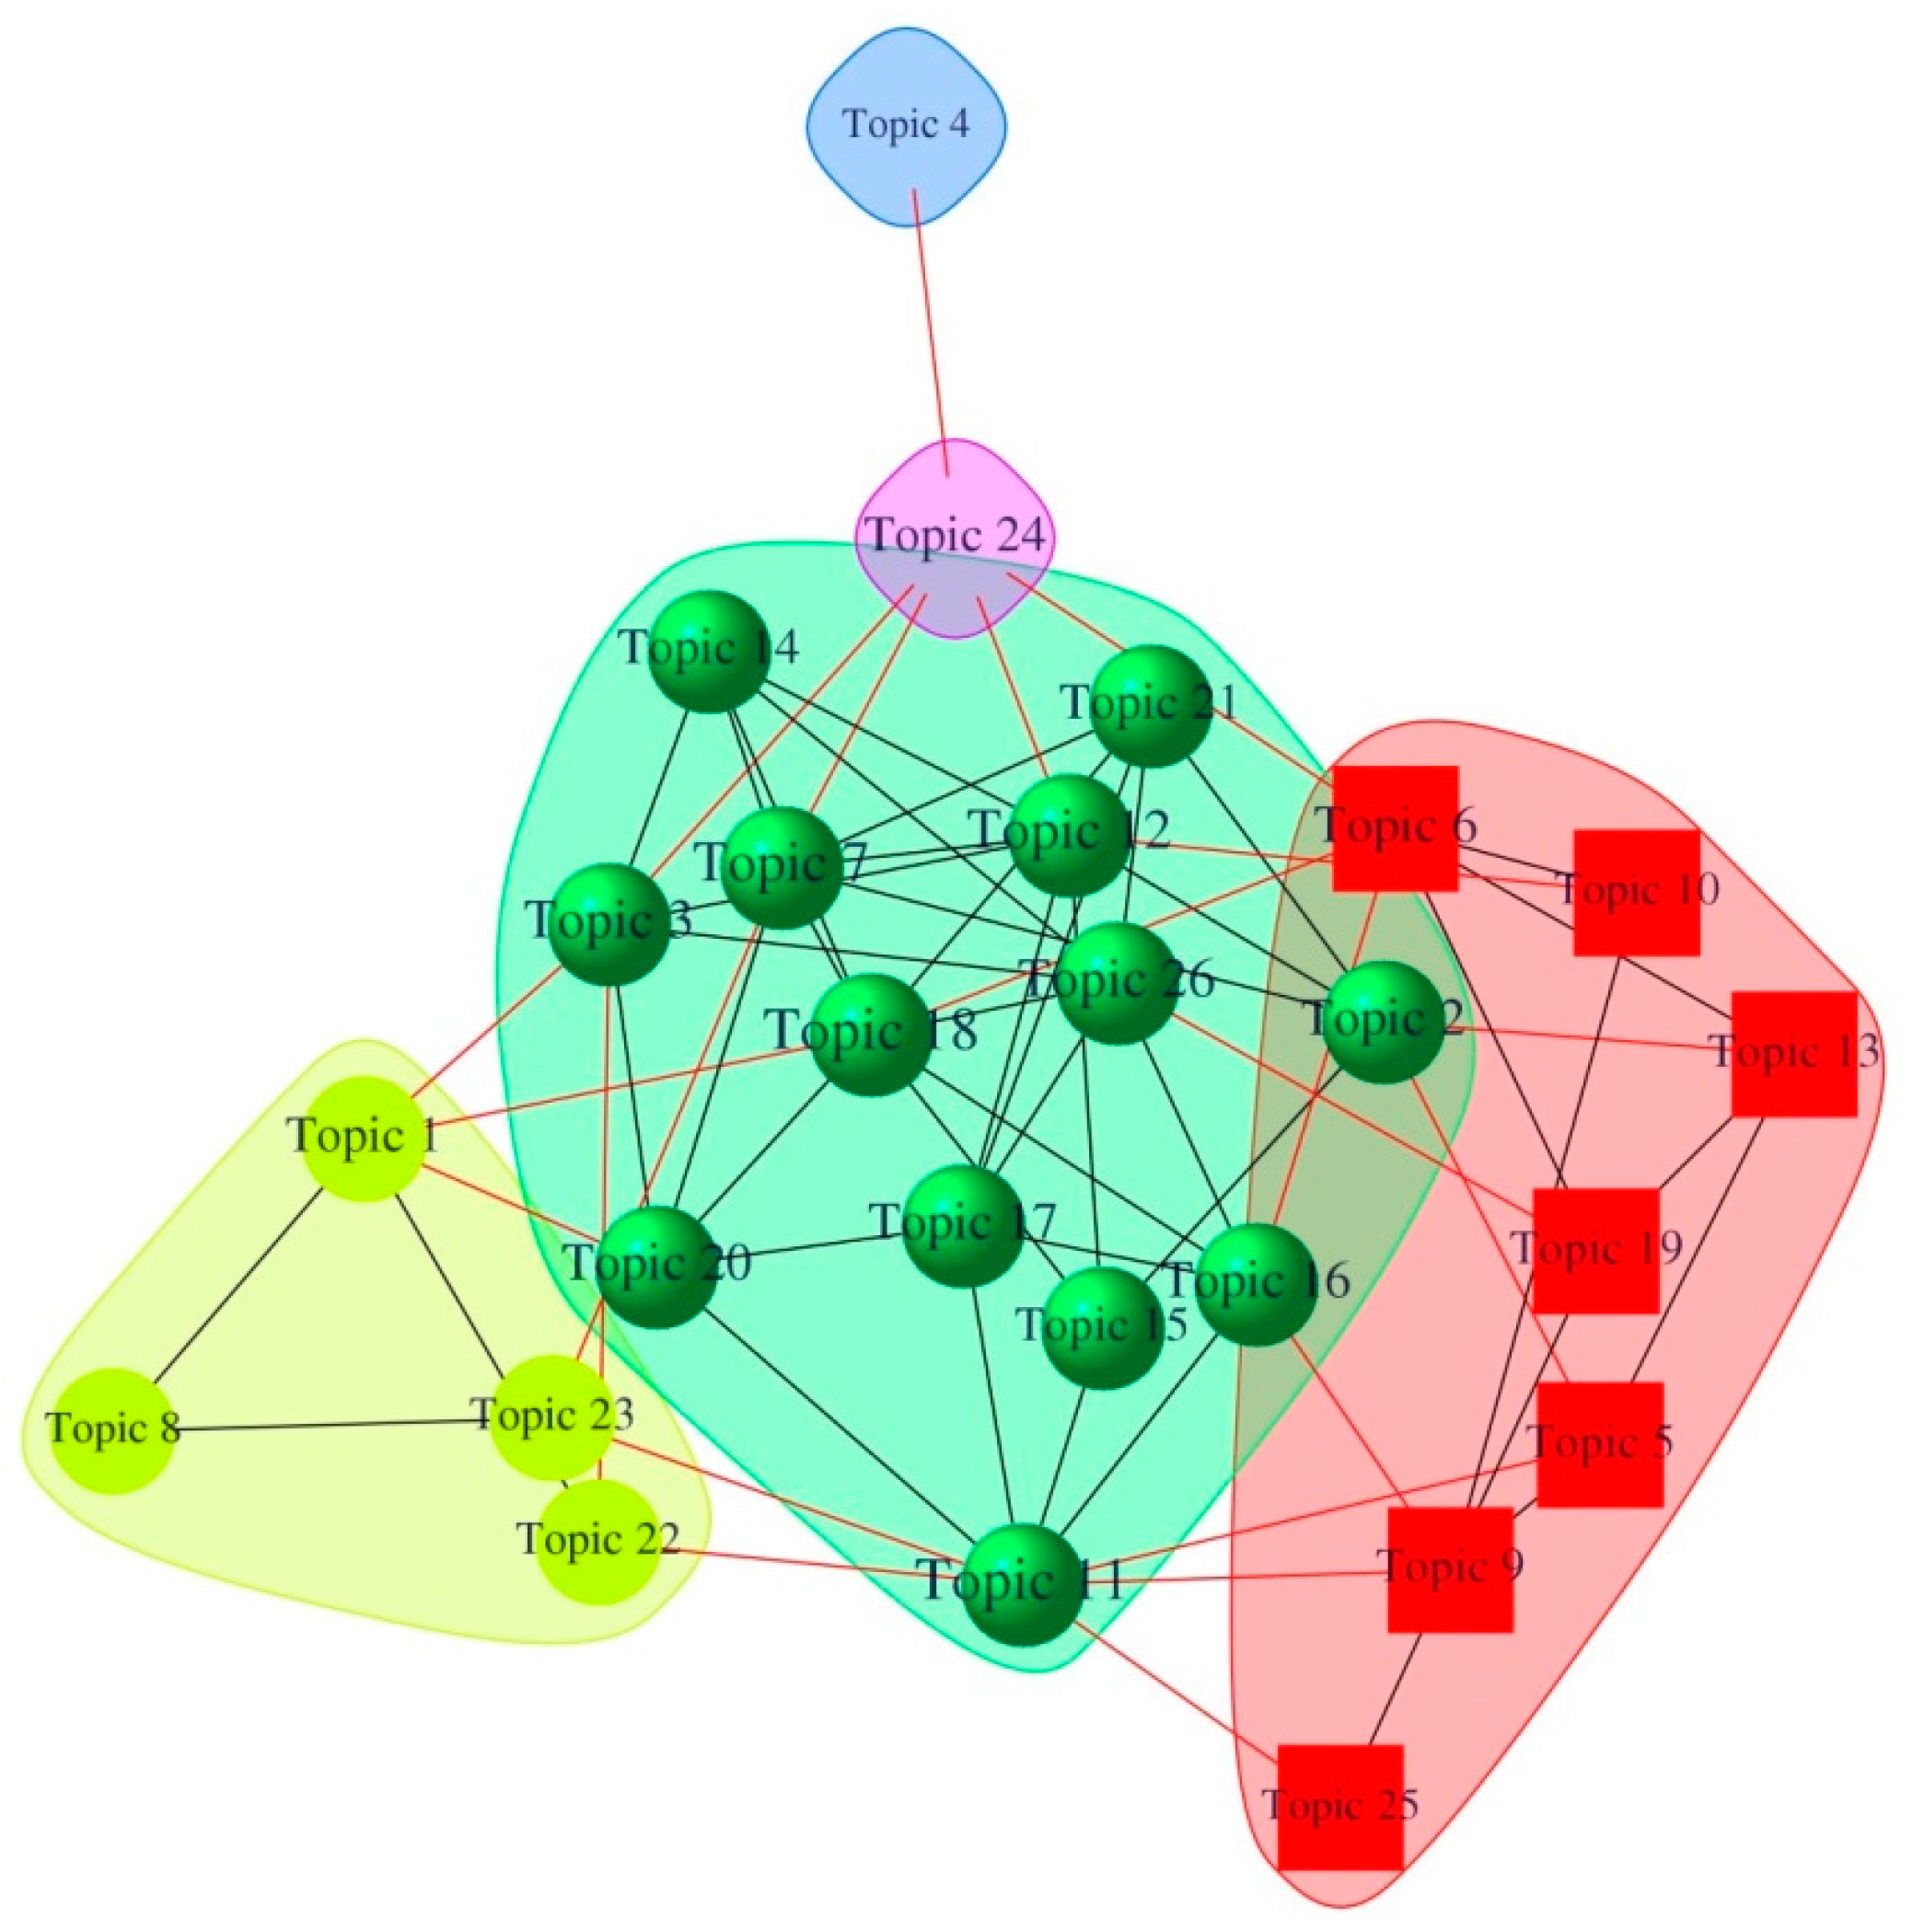
Figure 4.
Topic probability by year.


Figure 5.
Exponential Weighted Moving Average EWMA-weighted probability.


Table 1.
Description of variables.
| Variable Type | Variable | Abbreviation | References | Reasoning |
|---|---|---|---|---|
| Dependent variable | Gap in time | GT | - | To measure the gap in time between the emergence of hot or cold topics |
| Explanatory variables: patents related variables per each topic | Average number of references per topic | meanBCK | Harhoff et al. [31], Lanjouw and Schankerman [68], Lee and Sohn [69] | To indicate breadth of scope and the existence of technologies |
| Average number of International Patent Classification (IPC) classes | meanIPC | Lerner [32], Guellec, and Potterie [70], Sohn et al. [71] | To reflect technological diversity embodied in the invention as a combination of ideas and devices | |
| Average number of forward citations | meanFWD | Harhoff et al. [30], Lee and Sohn [72] | To reflect the value of patents | |
| Average period from the date of application to the date of registration (years) | meanPRD | Harhoff and Wagner [73] | To be associated with the complexity of the examination of the patent | |
| Average number of countries | meanCTRY | Lee and Sohn [69] | To reflect national diversity embodied in the invention | |
| Average years from the grant date of patent to present | meanAGE | Hall et al. [65] | To indicate the number of years from the date of grant of the patent to the present time | |
| Explanatory variables: topic network related variables | Betweenness Centrality from topic network | betCentrality | Gilsing et al. [74] | To indicate how central the topic is from the financial BM area |
| Transitivity from topic network | transitivity | Lazzeretti and Capone [75] | To indicate how closed the topic is | |
| Degree Centrality from topic network | degree | Wang et al. [76] | To indicate how associated with other areas the topic is | |
| Trend of topic emergence | slope | Choi et al. [77] | To reflect the emergence of each topic over periods |
Table 2.
Selected topics.
| # | Most Probable Terms (Stemmed) | Label |
|---|---|---|
| 11 | parti rule paramet fee agreement refer resourc negoti subject assign part complianc queri satisfi involv restrict advisor independ advic interchange | Advisory Service |
| 22 | quantiti object level indic tradeabl axi screen locat entri graphic region associ queue predefin enter chart tradabl work center side | Trading System |
| 33 | investor limit addit list support line submit computerimpl platform dealer day enhanc threshold subset involv made complex revenu note networkbas | Investor Support Platform |
| 44 | alloc structur incom current holder fix class pool state oblig common action hold altern size stream retir substanti block default | Asset allocation System |
| 55 | properti real code under hedg softwar total effect indic deal exposur estat volatil benchmark yield depend test surfac continu trend | S/W for hedging Volatility |
| 66 | busi factor return condit tax predetermin weight target averag exist intern computer composit rank prepar measur ratio travel univers refund | Tax |
| 77 | client report person enter function web site close open integr featur interact virtual lot schedul host page internet subsequ center | Client Reporting Web System |
| 88 | collect type file link broker track clear status settlement content standard swap rout forward assign packag usag ach settl leg | Brokerage |
| 99 | specif score quot accept potenti tool monitor assess counterparti variabl categori fraud detect general relationship anonym correl high cross abil | Fraud Detection |
| 110 | futur estim distribut point predict vehicl liquid characterist liabil expect reward probabl conting earn fuel deliveri exercis behavior disclosur outcome | Financing Vehicles |
| 111 | individu valu evalu group analysi histor valuat appli actual decis develop statist recommend underwrit compar purpos sampl seri tabl variabl | Financial Analysis for individual |
| 112 | autom repres combin posit spread strategi singl algorithm graphic aspect accord margin permit impli function rang short offset long require | Automated Trade Strategy and Algorithm |
| 113 | transfer termin author unit messag transmit connect money central remot send locat identif node wireless mobil capabl recipi atm advertis | Mobile System for Transferring Money and Message |
| 114 | compani establish charg financ requir debit facil capit vendor member call metric made meet suppli growth maintain public payabl contact | Corporate Finance |
| 115 | match prefer deriv engin updat chang reduc level subscrib modifi search volum environ book desir prioriti trigger increas place maker | Engines for Matching Preferences on Derivatives |
| 116 | contract share sell buy life annuiti date guarante predetermin net benefit variabl administ matur percentag withdraw phase accumul equal convers | Trading Annuity |
| 117 | compon plan cash simul adjust mean result flow make project construct produc statement detail econom budget contribut accord administr retail | Simulation Component for Cash Flow |
| 118 | auction buyer seller onlin sale bidder good conduct internet invoic supplier maintain desir mechan reserv allow computer marketplac proxi seat | Auction Market Place |
| 119 | bill institut bank portion deposit aggreg currenc agent instruct biller format machin station foreign award countri held act larg send | Machine & Equipment for Banking |
| 220 | merchant commod activ issuer sourc balanc improv profil util commerci valid spend cardhold approv acquir output prepaid commerc wallet descry | Electronic Wallet |
| 221 | consum control form respect optim techniqu convert primari dynam uniqu authent certif constraint secondari electr signal telephon problem intermediari solute | Authentication via Electronic Environment |
| 222 | claim polici cost premium loss coverag appli health scenario compens case expens medic care healthcar cover medium patient procedur enterpris | Health Insurance |
| 223 | check record modul stock document imag digit retriev storag compar separ filter element captur enrol arrang print ticket comparison previous | Processing Digitized Stock Documents |
| 224 | event index analyz attribut organ criteria equiti profit propos protect forecast demand consist flexibl measur current accur methodolog occurr impact | Equity Analyzing Methodology |
| 225 | loan processor mortgag term borrow debt memori lender logic bond origin collater coupl field workflow coupon princip underwrit commit home | Processing Mortgage Loan |
| 226 | entiti benefit direct pay paye design payor employe employ payer end trust make opportun paid prior receipt behalf maintain suffice | Direct Pay System |
Table 3.
Basic statistics of the explanatory variables: patent-related.
| Variable | Median | Min | Max |
|---|---|---|---|
| Average number of forward citations | −0.30 | −1.17 | 3.23 |
| Average age from the grant date to present (years) | −0.10 | −2.17 | 2.39 |
| Average number of references | −0.07 | −2.00 | 2.22 |
| Average number of IPC classes | −0.18 | −1.35 | 3.63 |
| Average period from the date of application to the date of registration (years) | −0.25 | −1.27 | 2.04 |
| Average number of countries | 0.25 | −1.69 | 1.54 |
Table 4.
Basic statistics of the explanatory variables: topic-related.
| Variable | Median | Min | Max |
|---|---|---|---|
| Trend of topic slope | 0.15 | −3.24 | 1.52 |
| Degree from Topic Network | −0.04 | −1.91 | 1.84 |
| Transitivity from Topic Network | 0.18 | −1.73 | 2.09 |
| Betweenness Centrality from Topic Network | −0.27 | −1.14 | 3.09 |
Table 5.
Prentice, William, and Peterson Gap Time (PWP-GT) with the time gap for becoming hot (threshold = 0.6).
Table 5.
Prentice, William, and Peterson Gap Time (PWP-GT) with the time gap for becoming hot (threshold = 0.6).
| Variable | Coefficient | exp(coef) | exp(-coef) | se(coef) | Robust se | z | Pr( > |z|) | |
|---|---|---|---|---|---|---|---|---|
| meanFWD | −0.4529 | 0.6358 | 1.5729 | 0.5065 | 0.2859 | −1.5840 | 0.1131 | |
| meanAGE | 4.2773 | 72.0461 | 0.0139 | 0.9898 | 0.9430 | 4.5360 | 0.0000 | * |
| meanBCK | 0.5008 | 1.6500 | 0.6061 | 0.3409 | 0.4062 | 1.2330 | 0.2176 | |
| meanPRD | −0.5569 | 0.5730 | 1.7452 | 0.2896 | 0.2353 | −2.3670 | 0.0179 | * |
| meanIPC | −2.2209 | 0.1085 | 9.2153 | 0.6272 | 0.6178 | −3.5950 | 0.0003 | * |
| numCTRY | −0.0680 | 0.9342 | 1.0704 | 0.2824 | 0.2273 | −0.2990 | 0.7647 | |
| betcent | −0.9540 | 0.3852 | 2.5961 | 0.6055 | 0.6069 | −1.5720 | 0.1160 | |
| slope | 0.5662 | 1.7616 | 0.5677 | 0.3560 | 0.2963 | 1.9110 | 0.0560 | |
| transitivity | 0.9973 | 2.7111 | 0.3689 | 0.4175 | 0.3817 | 2.6130 | 0.0090 | * |
| degree | −1.8594 | 0.1558 | 6.4200 | 0.8698 | 0.7946 | −2.3400 | 0.0193 | * |
* Significant at 5%.
Table 6.
PWP-GT with the time gap for becoming cold (threshold = 0.6).
| Variable | Coefficient | exp(coef) | exp(-coef) | se(coef) | Robust se | z | Pr( > |z|) | |
|---|---|---|---|---|---|---|---|---|
| meanFWD | −1.6811 | 0.1862 | 5.3716 | 0.7626 | 0.4522 | −3.7180 | 0.0002 | * |
| meanAGE | 2.8145 | 16.6845 | 0.0599 | 1.0836 | 0.7855 | 3.5830 | 0.0003 | * |
| meanBCK | −0.2907 | 0.7477 | 1.3374 | 0.3743 | 0.4144 | −0.7020 | 0.4829 | |
| meanPRD | 0.0824 | 1.0859 | 0.9209 | 0.3579 | 0.3398 | 0.2430 | 0.8083 | |
| meanIPC | −2.1897 | 0.1120 | 8.9324 | 0.7825 | 0.6250 | −3.5030 | 0.0005 | * |
| numCTRY | −0.2171 | 0.8049 | 1.2425 | 0.3434 | 0.2583 | −0.8400 | 0.4007 | |
| betcent | −0.2413 | 0.7856 | 1.2729 | 0.6791 | 0.4592 | −0.5260 | 0.5992 | |
| slope | 0.7798 | 2.1810 | 0.4585 | 0.5442 | 0.3420 | 2.2800 | 0.0226 | * |
| transitivity | 0.6803 | 1.9745 | 0.5065 | 0.4138 | 0.2537 | 2.6810 | 0.0073 | * |
| degree | −0.8003 | 0.4492 | 2.2261 | 0.9347 | 0.6775 | −1.1810 | 0.2375 |
* Significant at 5%.
© 2017 by the authors. Licensee MDPI, Basel, Switzerland. This article is an open access article distributed under the terms and conditions of the Creative Commons Attribution (CC BY) license (http://creativecommons.org/licenses/by/4.0/).
Share and Cite
MDPI and ACS Style
Lee, W.S.; Sohn, S.Y. Identifying Emerging Trends of Financial Business Method Patents. Sustainability 2017, 9, 1670. https://doi.org/10.3390/su9091670
AMA Style
Lee WS, Sohn SY. Identifying Emerging Trends of Financial Business Method Patents. Sustainability. 2017; 9(9):1670. https://doi.org/10.3390/su9091670
Chicago/Turabian StyleLee, Won Sang, and So Young Sohn. 2017. "Identifying Emerging Trends of Financial Business Method Patents" Sustainability 9, no. 9: 1670. https://doi.org/10.3390/su9091670
Note that from the first issue of 2016, this journal uses article numbers instead of page numbers. See further details here.