LEED, Its Efficacy and Fallacy in a Regional Context—An Urban Heat Island Case in California


1
Railroad System Research Center, Korea Railroad Research Institute, 360-1 Woram-dong, Uiwang-si, Gyeonggi-do 437-757, Korea
2
Division of Architecture and Urban Design, College of Urban Sciences, Incheon National University, 119 Academy-Ro, Songdo-dong, Yeonsu-Gu Incheon 22012, Korea
3
Department of Landscape Architecture and Urban Planning, College of Architecture, Texas A & M University, 3137 TAMU, College Station, TX 77843, USA
4
Department of Architecture, College of Architecture, Texas A & M University, 3137 TAMU, College Station, TX 77843, USA
*
Author to whom correspondence should be addressed.
Sustainability 2017, 9(9), 1674; https://doi.org/10.3390/su9091674
Submission received: 1 September 2017
/
Revised: 18 September 2017
/
Accepted: 18 September 2017
/
Published: 20 September 2017
(This article belongs to the Section Sustainable Engineering and Science)
Abstract
:The use of energy in the building sector has increased rapidly over the past two decades. Accordingly, various building assessment methods have developed in green building practices. However, the questions still remain in regard to how positively green buildings affect regional surroundings. This study investigates the possible relationship between LEED-certified buildings and urban heat island effect. Using GIS with spatial regression, the study found that constructing an LEED building in a 30-m boundary could possibly lower the temperature of the surrounding environment by 0.35 °C. Also, having a higher certification level, such as Gold or Platinum, increased the lowering effect by 0.48 °C, while a lower certification level, such as Certified or Silver, had a lowering effect of 0.26 °C. Although LEED has gained a substantial amount of interest and skepticism at the same time, the study results could be a potential sign that the Sustainable Sites Credits or energy-efficient materials play a positive role in lowering the temperature.
1. Introduction
The use of energy in the building sector has increased rapidly over the past two decades, currently accounting for 20% to 40% of the world’s total energy use. This trend will continue in both developed nations and emerging economies, due to a near-universal increase in urbanization [1]. As part of the effort to reduce environmental problems, the creation of sustainable built environments has become a significant global issue in both architecture and urban planning disciplines. Accordingly, various sustainable building and environment assessment methods have developed, and the main goal is to evaluate a building’s performance and its influence on the surrounding environment, including the issues related to construction, maintenance, and resource management [2]. Such assessment methods have played a key role in bringing green building practices to the current construction market as well as in mitigating international environmental problems. Moreover, these practices now serve as a new set of guidelines and standards for those seeking to create sustainable built environments.
It has been found that proper environmental assessment methods can offer owners and occupants significant benefits regarding land prices [3,4,5,6], cost savings [7,8,9], and productivity and health [10,11]. Although assessment methods deal with built environment issues ranging from the building scale to the urban scale, there is a lack of studies on the regional benefits stemming from their use. For example, efforts to reduce the urban heat island effect are included in the most widely-used assessment methods, such as Leadership in Energy and Environmental Design (LEED) in the United States, Building Research Establishment Environmental Assessment Method (BREEAM) in the United Kingdom, Comprehensive Assessment System for Built Environment Efficiency (CASBEE) in Japan, and Building Environmental Assessment Method (BEAM) in Hong Kong [12]. In Europe, there is a collective effort to reduce energy consumption in buildings, such as the Energy Performance Buildings Directive (EPBD) and the European Union Green Paper [13,14]. In addition, many have articulated how to properly assess the energy performance of buildings, ranging from the Net Zero Energy Building theory to environmental indicators [15,16,17].
However, questions remain in regard to how positively green buildings affect their regional surroundings. Therefore, the goal of this study is to investigate the possible relationship between a particular building assessment method and outdoor temperature, with the main focus on LEED-certified buildings in the state of California, USA.
2. Backgrounds
The United States Green Building Council (USGBC) has developed the LEED, a green building certification system designed to help build sustainable buildings and neighborhoods [18]. Since its beginning, more than 72,500 LEED-certified buildings have been built internationally, rendering it the most popular green building rating system in the world [19]. Consequently, its efficacy has been investigated by various scholars. For instance, one study found that LEED-certified buildings were 25% to 30% more energy efficient than the national average [20]. Particularly, higher-rated LEED buildings such as Gold and Platinum-level buildings perform up to 45% better than non-LEED buildings [21]. Although there has been some skepticism regarding the energy efficiency of LEED-certified buildings [22,23,24,25,26], earning a LEED badge may allow owners and users to take advantage of certain benefits and become a part of a recognized standard for mitigating energy consumption in the United States and around the world.
The USGBC has established four levels of LEED certification; each corresponds to the number of points on a scale with a maximum of 100. These levels include: Certified (40 to 49 points), Silver (50 to 59 points), Gold (60 to 79 points), and Platinum (80 points or more) [18]. LEED credits are also awarded based on several categories: Sustainable Site (26 possible points), Water Efficiency (10 possible points), Energy and Atmosphere (35 possible points), Materials and Resources (14 possible points), Indoor Environmental Quality (15 possible points), Innovation in Design (6 possible points), and Regional Priority (4 possible points) [20]. Although LEED covers a variety of environmental issues, most post-occupancy evaluations of LEED-certified projects focus on Energy and Atmosphere, measuring the building’s total energy use intensity (EUI) [21,22,23,24,25,27,28].
In this regard, there are two key lines of inquiry that contribute to this research area. First, despite the large portion of points awarded for Energy and Atmosphere in the LEED rating systems, this category is still just a sub-section of the overall sustainability evaluation system. Thus, an inclusive post-occupancy evaluation for LEED projects is required, one that includes all of the other categories. Second, previous studies have clearly shown that LEED-certified buildings bring benefits that are enjoyed predominantly by the owners of these buildings, such as energy savings. Accordingly, this means that the benefits resulting from other credit areas and the building’s overall interaction with the surrounding environment should be emphasized.
The urban heat island effect occurs when there is a significant temperature difference between an urban space and its surrounding rural areas. Urbanization leads to increases in high density built environments and related human activities, resulting in an urban heat island [29]. There are several causes, such as anthropogenic heat emissions, air pollution, urban canyons among high density buildings, a lack of green space, and the material properties of buildings and pavement [30]. Precisely, the use of materials with low levels of albedo and solar reflectance indices (SRIs) [31,32], decreased wind speeds [33], and increased stored long-wave radiation [34] in the built environment all directly correlate with the increase in urban temperature. Consequently, the temperature increase in such areas has a negative effect on energy consumption [33,35]. In other words, although numerous studies have investigated methodologies to increase building energy savings and contribute to the built environment [36], there are only limited building energy savings in urban environments, due to the higher temperatures of the buildings’ surroundings. As a result, there is a growing interest in examining the relationship between a building’s energy performance and the heat island effect.
In accordance with the demand, the USGBC awards LEED credits for reducing the urban heat island by establishing the required paving properties through the use of shade, paving materials with SRIs of at least 29, an open grid system for non-roof areas such as the site hardscape, and vegetated materials with high albedos and a sloped shape for roof areas [20]. The 23rd most commonly earned point, “Sustainable Sites Credit 7.1: Heat Island Effect”, was awarded to 62% of projects. The 31st most commonly earned point, “Sustainable Sites Credit 7.2: Heat Island Effect” was awarded to 53% of projects [37]. In other words, around 50% of all LEED-certified projects earned points from heat island measurements, meaning that these buildings played a role in mitigating the heat island effect in their respective areas through materials or technologies.
As mentioned above, LEED as a regulatory system has achieved an impressive reputation and level of confidence worldwide. However, the credits are based on US-oriented environmental, social, and economic parameters [38]. This means that further regional adjustments in terms of the local characteristics of various countries are necessary to establish the system’s efficacy in terms of international application and accuracy [39,40]. Although LEED v. 4, the newest version, offers some alternative evaluation systems, it still does not function as a flexible and adaptable weighting system in terms of local parameters [38]. For example, sustainable site credits awarded for the heat island effect deal with the built environment’s local and regional context, addressing certain types of material properties. In practice, however, the same points are assigned for heat island credits regardless of local geographic and climate characteristics. In addition, research projects investigating how LEED credits mitigate urban heat island are yet both scarce and unreliable.
To this extent, the objective of this study is to examine the effect of LEED certification on urban temperature, to facilitate its use as a measure of regional interaction. A LEED certificate is a reliable indicator of a sustainable built environment; consequently, a group of these certificates should demonstrate a building’s ability to bestow significant benefits. In this respect, the authors question whether a large cluster of certified buildings and their surrounding temperature could have a relationship. As described, some LEED credits are designed to address issues in a regional context. If these credit assignments are an effective means of incentivizing the incorporation of green elements, then regional credits such as sustainable sites and reductions in the heat island effect should offer a reliable foundation for a more reliable evaluation process.
3. Research Framework
3.1. Study Area and Data Analysis Procedure
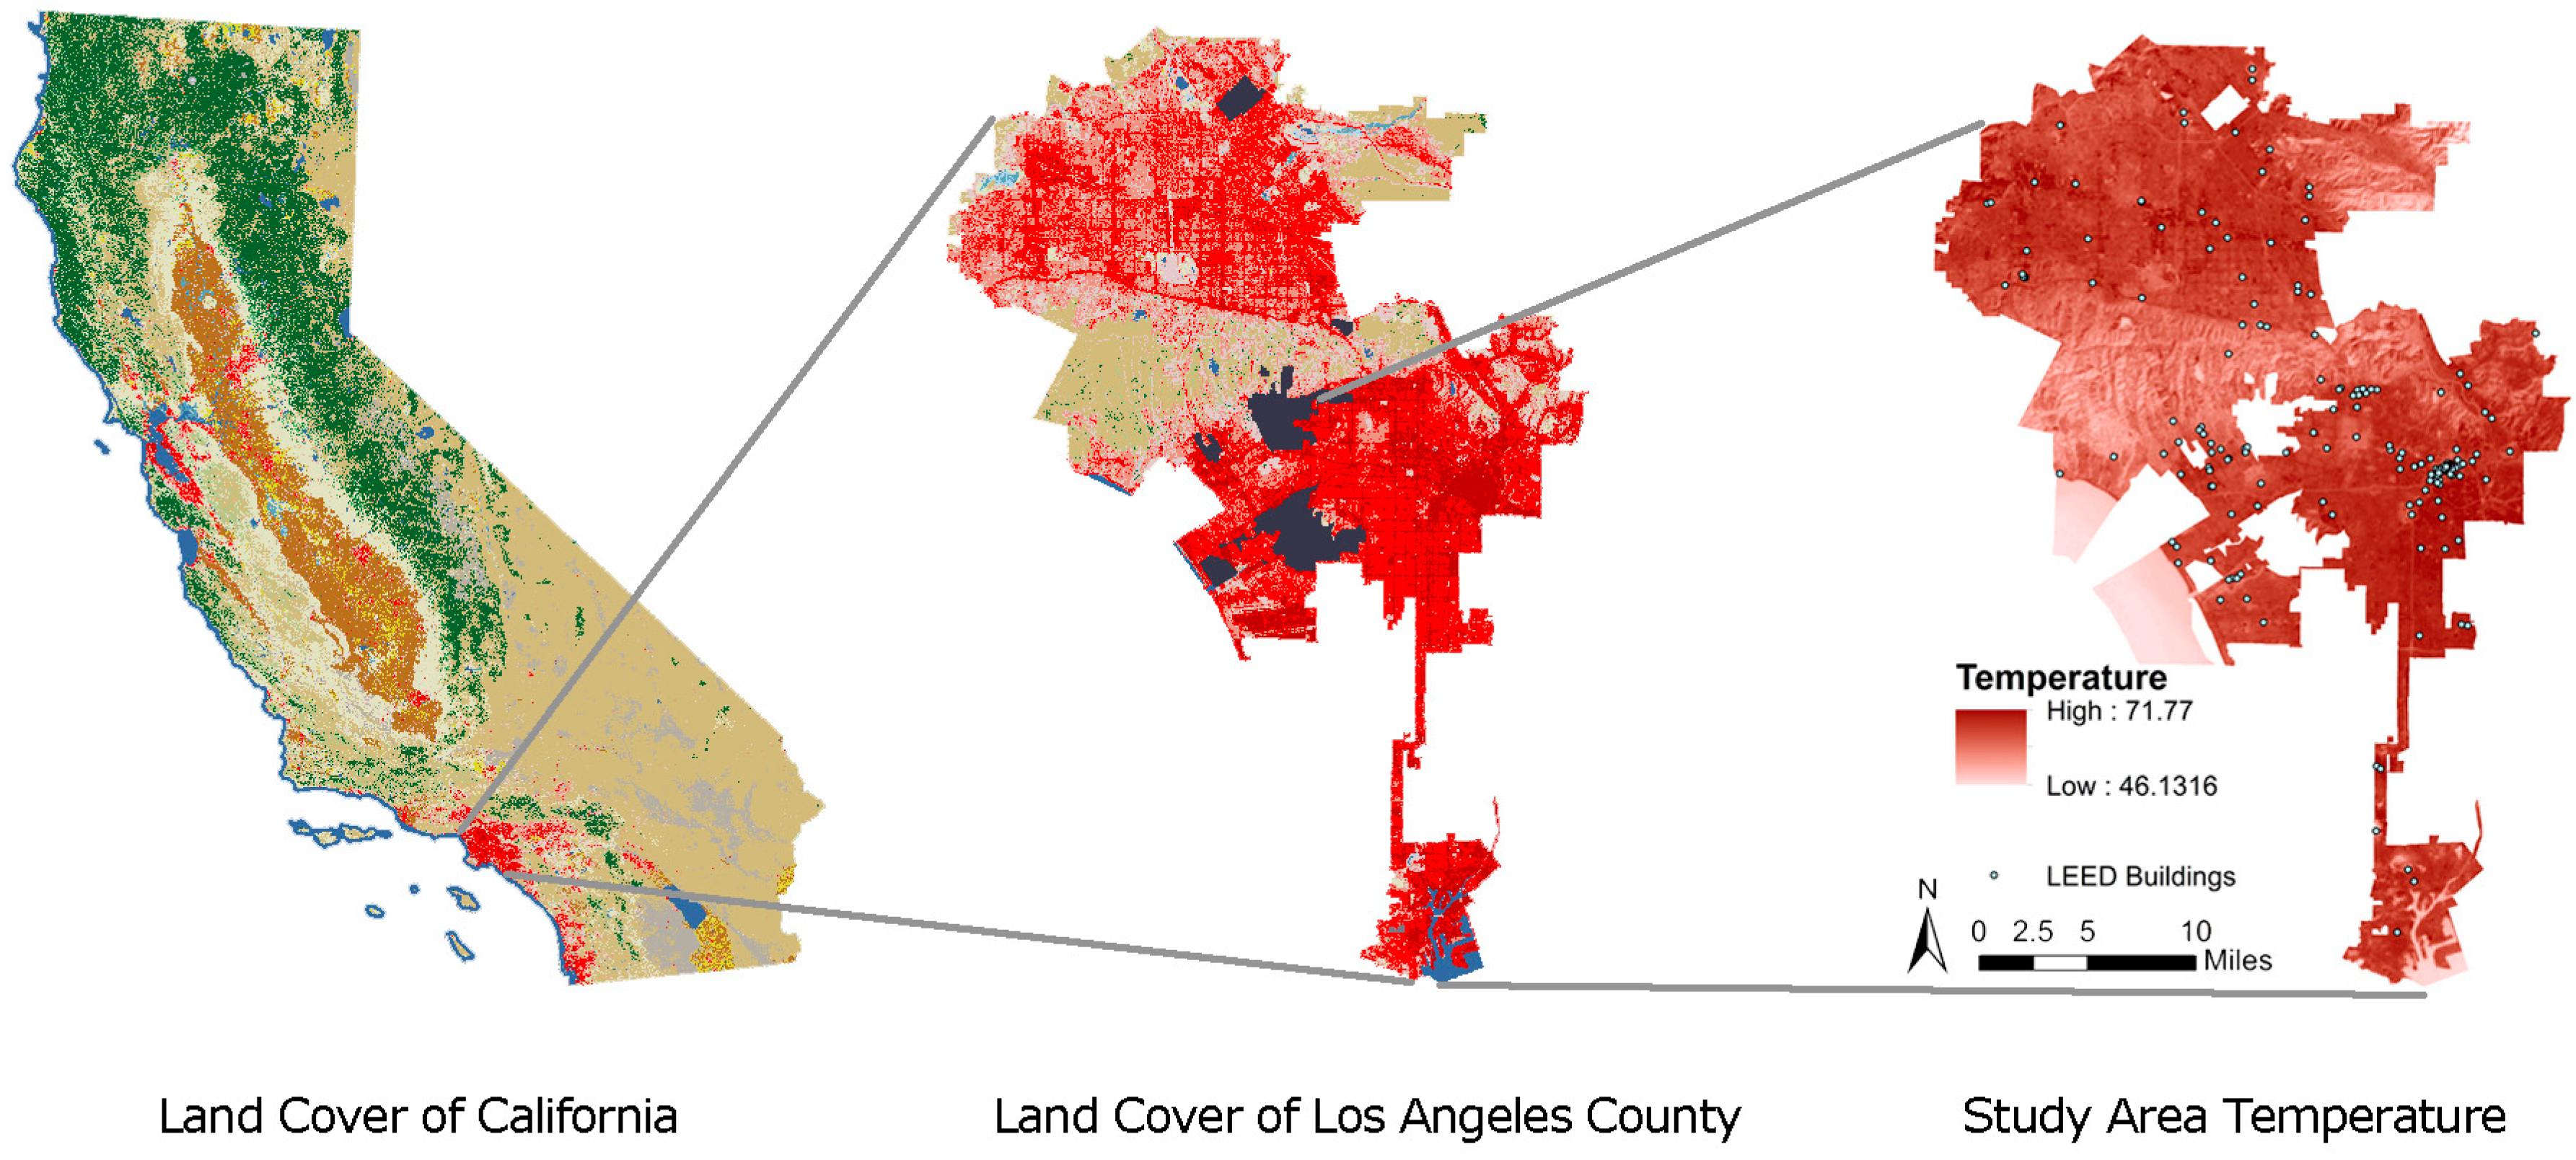
The study boundary was set to the city of Los Angeles in the state of California. Based on the previous study, the state of California showed the highest number of LEED buildings and their negative correlation coefficients with its annual temperature among the three southern states—California, Texas, and Florida, [41]. Also, the three counties selected in the state of California according to the clustered LEED buildings—Los Angeles, San Diego, and San Francisco counties—presented the highest correlations with their temperature. These results suggested that an urban area with a group of LEED buildings in California will show the most distinctive outcome to test the research questions rather than rural areas. Well known for its natural and cultural assets, Los Angeles is one of the most populous metropolitan areas in the world. Another practical reason for selecting Los Angeles is because of the city’s strong preference towards environment-friendly policies. In 2002, the Los Angeles City Council voted for a requirement of LEED certification for all public constructions whose gross square footage is greater than 7500. Also, in 2003, the Council required that all projects sponsored by the city comply with the certificate standards [42].
To properly assess the possible relationship between LEED certificates and their effects on urban temperature, non-LEED buildings and certified buildings are the two main predictors. For information regarding the certified buildings, the USGBC database provides details about all LEED buildings in the US and each building’s details, such as address, certification level, certification date, and rating systems, were collected. As of January 2014, there are 47,496 certified buildings in the US, including all levels of certification buildings. After a data-clearing process to obtain a more reliable sample, a pool of 13,273 buildings remained. During the process, buildings with incomplete physical addresses and no clear statements on certification levels were dropped for a clearer research outcome. By using Geographic Information Systems (GIS), all LEED buildings were geocoded based on their physical addresses, and the buildings within the Los Angeles city boundary were selected. For the non-LEED buildings, the Los Angeles County GIS Data Portal was utilized as it provides building outlines collected from January through April 2008, measuring all the buildings with a size greater than 400 square feet. Overall, the city of Los Angeles has 1,143,945 non-LEED buildings and 197 certified buildings within its city limits.
The authors utilized two steps of analyses. First, a citywide analysis through ordinarily least squares (OLS) regression models was performed and after that, a spatial regression analysis through the spatial error and spatial lag models was conducted. The OLS models focused on identifying the certified buildings and its relationship with the outdoor temperature. These models predicted how much outdoor land temperature change was induced by an LEED-certified building. Also, the certified buildings were divided into two categories based on the level of certification, low level (Certified and Silver) and high level (Gold and Platinum), to figure out whether the levels of certifications do make a difference in heat reduction capability. Accordingly, the dependent variable was the outdoor temperature of the study site, and there were three categories of independent variables: (1) the number of LEED-certified buildings; (2) the number of non-LEED buildings; and (3) the presence of impervious land covers. Lastly, the number of non-LEED buildings was divided by the low and high level of LEED certificates.
The second step was the spatial regression analysis. This research investigated the outdoor temperature data as the dependent variable. The problem is that temperature is spatially correlated in nature. Specifically, temperature in a particular cell will tend to be similar to temperature in adjacent cells. The degree of spatial similarity was measured by the Moran’s I coefficient, ranging from −1 to +1. If there was spatial correlation, Moran’s I indicates higher or lower values than zero, and suggests a geographical clustering. In this case, controlling special autocorrelation was required to generate unbiased results. Therefore, this study developed two spatial regression models: spatial error and spatial lag. The spatial error models assumed that the error terms in the model were spatially correlated, while the spatial lag model assumed that the dependent and independent variables were spatially correlated as well as error terms [43,44,45]. The assumption of the spatial lag model was more related to this research, since the dependent variable is temperature and it spreads out over an adjacent area.
3.2. Dependent and Independent Variables
The United States Geological Survey (USGS) provides Landsat Thematic Mapper (TM) and Enhanced Thematic Mapper Plus (ETM+) sensor thermal bands images. The heat data to measure the outdoor temperature was acquired by using both the ETM+ and TM datasets. The guideline for the selection of a satellite image was based on the percentage of cloud coverage and its filming date. The basic rules of thumb were twofold. First, the percentage of cloud coverage should be minimal because the amount of cloud cover reduces the degree of urban heat island magnitude [46]. This study features the image that had the lowest cloud coverage option in USGS, lower than 10%. In addition, the selected image should have been taken between January and April to generate the best outcome according to the Environmental Protection Agency (EPA) research outcomes about atmospheric urban heat island [47]. Therefore, the satellite image captured on 13 March 2014 was utilized because it corresponds with the most conditions described above. The top of atmosphere brightness temperature is estimated from the digital numbers (DN) of the Landsat 8 ETM+ Band 6 under an assumption of unity emissivity. The majority of urban studies used this approximation, since they focus on spatial variations of temperature. [48]. Accordingly, the top of atmosphere temperature is sufficient for estimating relative temperature differences created by LEED buildings. The image contains 1,376,820 cells and the resolution is in 30 m × 30 m. Figure 1 show the temperature image of the study site.
Land cover data was another predictor, and was used as a dummy variable. Since the temperature dataset was consisted of 30 m × 30 m cells, the authors selected the same cell size for their examination. The land cover data provided by the USGS Land Cover Institute (LCI) also matches the same resolution [49], and it was closer to measuring whether an impervious cover is present or not present within the 30-m boundary. Having a land cover dummy was an important indicator because it provides the foundations for whether or not the final outcome is a reliable measure; it is a reliable measure if the LEED certificates and impervious cover coefficient directions illustrate the same result. Finally, the authors decided to test whether there is any difference among the certification levels. Accordingly, the certification levels were grouped to two types for more effective modeling: (1) buildings with Certified and Silver LEED certifications (low level); and (2) buildings with Gold and Platinum LEED certifications (high level). Table 1 shows the descriptive statistics of non-LEED buildings, LEED-certified buildings, land cover types, and certification level differences in the city of Los Angeles.
As described above, the dependent variable of outdoor temperature was observed in 30 m × 30 m resolutions. Accordingly, the number of observation is 1,376,820, the same number as the total number of the cells. For the number of non-LEED buildings and LEED-certified buildings, their total numbers within the 30-m distances from the cell centroid were calculated based on each cell. Land cover was converted into a dummy variable to indicate the imperviousness of each cell and paired with one cell for each temperature value. To verify the effectiveness of LEED certification level, four OLS regression models were designed. Model 1 includes all certification levels of LEED as an independent variable, whereas the second and third models contain the low and high levels of LEED certification, respectively, as an independent variable. The last model (Model 4) includes both the low and high levels of LEED certification to measure the difference between the levels of LEED certifications. In addition, two spatial regression models, spatial error and spatial lag models, were designed to control the spatial autocorrelation effect.
4. Analysis and Results
Table 2 shows the results from the OLS regression analyses. The total number of LEED buildings was used for Model 1 to represent the overall effect of LEED buildings. Model 2 and Model 3 were used to gauge the effect of low- and high-level LEED buildings. Model 4 used the number of low- and high-level LEED buildings cumulatively to indicate the differences between certification levels. As can be seen, the R-square and adjusted R-square show very similar results (R2 = 0.3895, Adj. R2 = 0.3895) across the four models. All of the independent variables indicate statistically significant results.
For Model 1, land cover shows the coefficient of negative 4.6, meaning that if the cell boundary of 30 m × 30 m is mainly made with pervious covers, such as open spaces or natural vegetation, it could lower the outdoor temperature by −4.6 °C. The non-LEED buildings’ coefficient of 0.128 illustrates that within the 30 m × 30 m boundary, one non-LEED building may increase the surrounding outdoor temperature by 0.128 °C. Lastly, the LEED buildings’ coefficient shows that one certified building within the 30-m boundary, regardless of its certification level, could have an effect of lowering the surrounding temperature by −0.35 °C. This is a noteworthy result, as it shows that the certified buildings do have an effect on lowering the temperature of their surroundings. It also means that the regional credits of the LEED certification system, such as Sustainable Sites or Urban Island credits, may deliver even greater environmental benefits to the overall environment.
Coefficients for both the numbers of Certified and Silver buildings (Model 2) and the number of Gold and Platinum buildings (Model 3) revealed negative values, indicating that the areas with more LEED building units have a higher probability of having lowered outdoor temperature. In addition, the coefficients for the Certified and Silver buildings in Model 2 show a lower result (−0.30 °C) than the coefficient of the Gold and Platinum buildings in Model 3 (−0.52 °C). This means that the higher levels of LEED certification tend to have more of a mitigation effect on outdoor temperature. The effect of low and high certification levels was also revealed in Model 4. As can be seen, the presence of a Gold or Platinum building within a 30m boundary could lower the outdoor temperature by −0.48 °C. Compared to the overall effect of low-level LEED buildings, this is an improvement of about −0.22 °C. In this sense, it is possible to say that the higher levels of the LEED certification system could provide more effective temperature reduction results in terms of a broader environmental context.
This is particularly interesting result given that the maximum points for the LEED heat island credit is two points regardless of certification levels. This means that regardless of Certified or Platinum certification, the consideration given to heat island effect is the same. The possibility of earning a higher certification, however, will likely involve obtaining the maximum credits and thus, Gold and Platinum projects have a higher probability of fully satisfying the heat island and other credit evaluations. This could possibly be the primary explanation for the resulting higher coefficient for LEED buildings in Model 4, and should be examined by future studies accordingly.
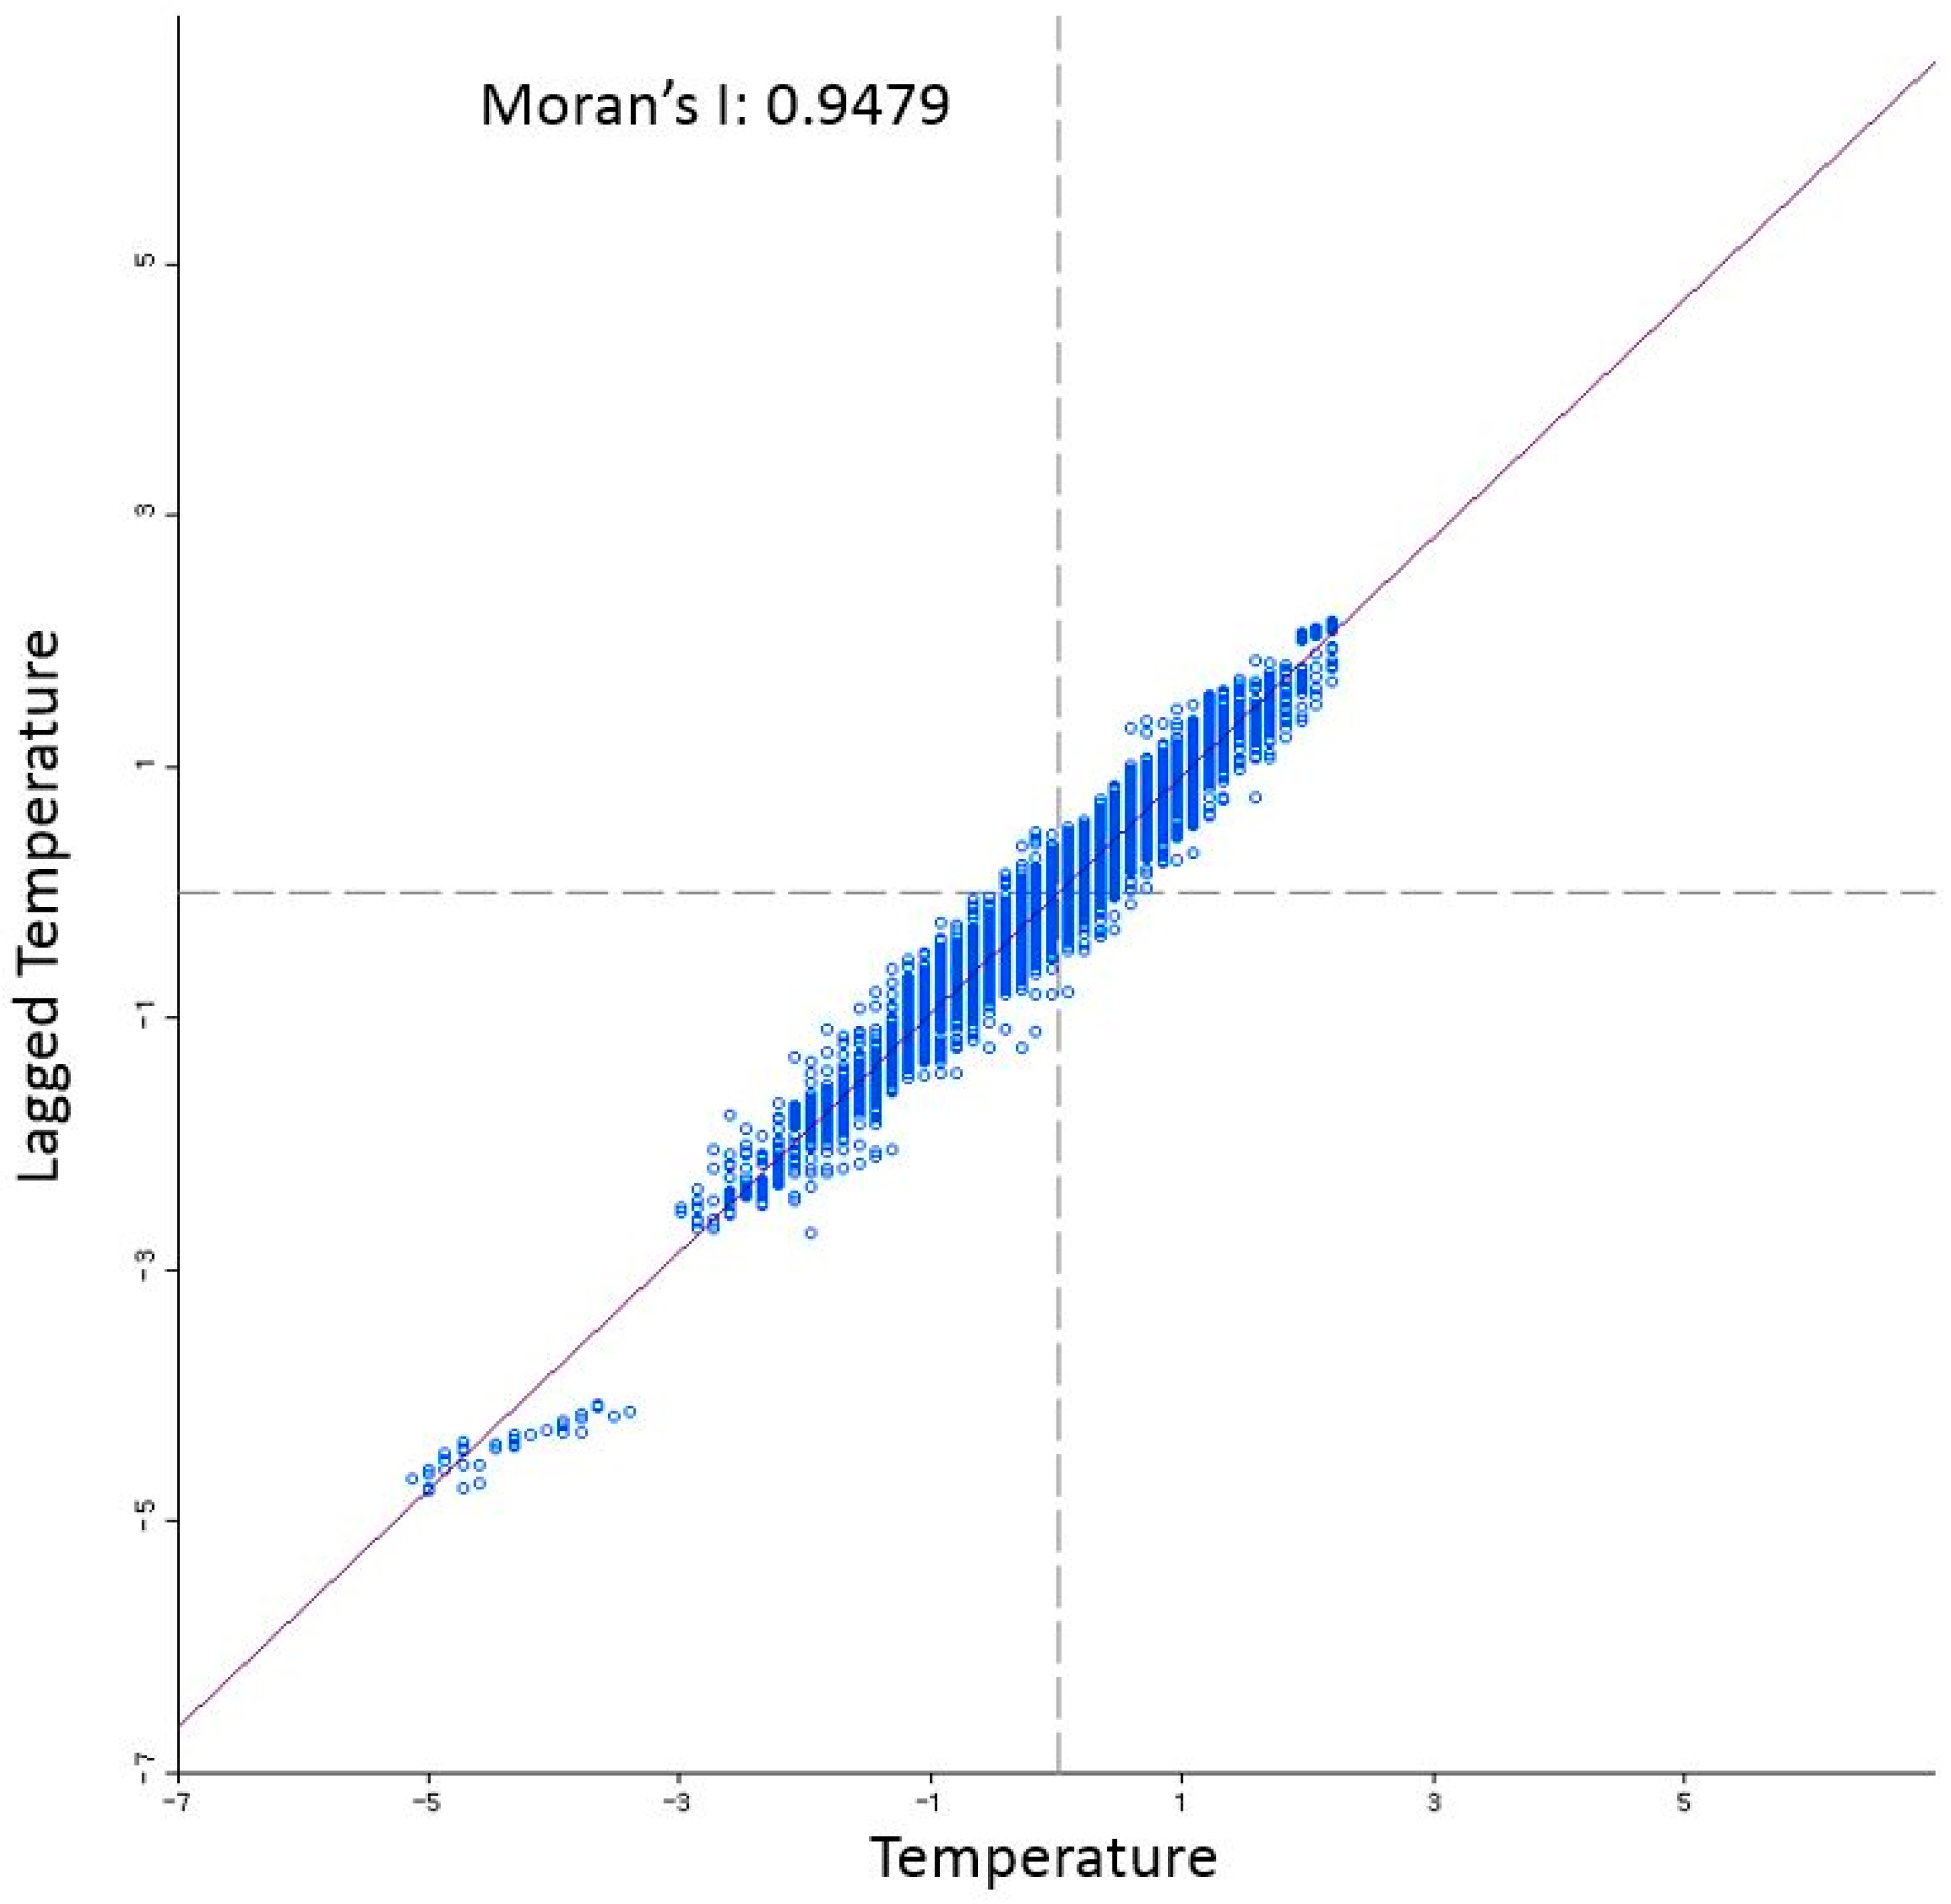
To emphasize the spatial pattern of temperature by the LEED buildings, temperature cells within a 100-m distance from each LEED building were selected for the research area, and the number of observations is 5595 cells. Figure 2 shows the Moran scatterplot, calculated by the GeoDaSpace software version 1.6.7 (University of Chicago, Chicago, USA) [43]. The Moran’s I statistic (0.9479) presents a significant spatial correlation, suggesting a clustering pattern of temperature. A Moran’s I value of 0.95 means that the sample used in this analysis has a significant chance of having a spatial autocorrelation. A positive spatial autocorrelation occurs when there are similar values situated near one another, and for that reason the sample may indicate a biased pattern of its distribution. Therefore, the spatial regression analysis is required to correct the spatial dependence issue.
Table 3 lists the results from the Ordinary Least Square (OLS) regression, spatial error, and spatial lag models. Unlike the OLS model, maximum likelihood estimations are utilized for the spatial error and spatial lag models. All signs are identical to the OLS model, while the degree of effect of a non-LEED building diminished drastically in the spatial models. On the other hand, LEED buildings still decrease the surrounding outdoor temperature significantly, by 0.12 and 0.13 °C, respectively.
5. Conclusions
To identify whether the LEED certification system has effective regional measurements, the authors questioned the system on two aspects. First, if LEED is a good indicator for energy saving and sustainability at large, then how much could the outdoor temperature be lowered as a result of the certified buildings? Second, if LEED does help lower the surrounding temperature, then will the level of the certification make a difference? Using GIS and OLS regression analysis, the authors observed that constructing an LEED-certified building in a 30-m boundary could possibly lower the temperature of the surrounding environment by 0.35 °C. Also, having a higher certification level, such as Gold or Platinum, could increase the lowering effect by 0.48 °C, while a lower certification level, such as Certified or Silver, had a lowering effect of 0.26 °C. This is a meaningful result, as not many previous studies have articulated the empirical relationship of LEED certifications and their effects on a regional climate. It should also be noted that spatial regression models present identical signs with OLS regression models. Even after controlling for the sample’s spatial clustering effect, the analysis results still imply the same signs of reduction around the LEED buildings, and this could be an evidence for the effect of the certificate system.
Two things should be noted, however. First, as the R-square values for both models show relatively low scores (R2 = 0.39), interpretation of the results should be carried out in a careful manner. Possible considerations for other factors affecting the heat could be wind, building orientation, density, and so forth. This means that there may be other possible concerns involved in the heat island effect. Also, although the satellite image for the heat data was estimated in a conventional way, the analysis results could vary to a certain degree depending on the quality of the satellite data and the method to estimate the temperature. The top of atmosphere brightness temperature may have errors up to 0.2−0.4 K due to land surface emissivity and up to 0.2−0.7 K due to atmospheric effect [50]. In addition, future studies should improve on minimizing such limitations by using more sophisticated temperature estimation methods, addressing multiple satellite images.
Despite the fact that the study has some possible limitations, this paper adds a meaningful contribution to the ongoing efforts of the LEED industry and sustainable architecture at large. Based on the analysis results, it could be possibly said that the LEED certification system not only saves costs in energy usage for the users and the owners, but it also provides meaningful environmental benefits to the surroundings. In addition, the LEED certification system’s regional credits, such as Sustainable Site and Heat Island Effect, may contribute to overall environmental justice regardless of their possible maximum points. This is a preliminary indicator for a more environment-friendly building standard and should be studied more thoroughly. Future studies should investigate a more specific relationship between LEED buildings and heat island effect, such as energy-efficient materials, the amount of vegetation areas, higher SRI values, and so forth. It should be also noted that subsequent studies should identify the typology of each building and its rating scores, to investigate whether there is any correlation between building rating systems and typology.
Acknowledgments
The authors would like to thank to the Department of Landscape Architecture and Urban Planning at Texas A & M University and the Division of Architecture & Urban Design at Incheon National University for allowing a joint meeting for the researchers between the two universities.
Author Contributions
Min Ho Shin prepared the entire research framework and managed the manuscript; Hwan Yong Kim has prepared initial data, analysis check, and manuscript submission. Donghwan Gu and Hyoungsub Kim performed the analysis and statistical models.
Conflicts of Interest
There is no conflict of interests.
References
- Pérez-Lombard, L.; Ortiz, J.; Pout, C. A review on buildings energy consumption information. Energy Build. 2008, 40, 394–398. [Google Scholar] [CrossRef]
- Horvat, M.; Fazio, P. Comparative review of existing certification programs and performance assessment tools for residential buildings. Arch. Sci. Rev. 2005, 48, 69–80. [Google Scholar] [CrossRef]
- Eichholtz, P.; Kok, N.; Quigley, J.M. Doing well by doing good? Green office buildings. Am. Econ. Rev. 2010, 100, 2492–2509. [Google Scholar] [CrossRef]
- Fuerst, F.; McAllister, P. Green noise or green value? Measuring the effects of environmental certification on office values. Real Estate Econ. 2011, 39, 45–69. [Google Scholar] [CrossRef]
- Miller, N.; Spivey, J.; Florance, A. Does green pay off? J. Real Estate Portf. Manag. 2008, 14, 385–400. [Google Scholar]
- Wiley, J.A.; Benefield, J.D.; Johnson, K.H. Green design and the market for commercial office space. J. Real Estate Financ. Econ. 2010, 41, 228–243. [Google Scholar] [CrossRef]
- Kats, G. Greening America’s Schools: Costs and Benefits. A Capital E Report. Available online: www.cap-e.com (accessed on 26 June 2013).
- Kats, G.; Alevantis, L.; Mills, E. The Costs and Financial Benefits of Green Buildings: A Report to California's Sustainable Building Task Force; Capital E: Wellington, New Zealand, 2003. [Google Scholar]
- Kats, G.; James, M.; Apfelbaum, S.; Darden, T.; Farr, D.; Fox, R.; Frank, L.; Laitner, J.; Leinberger, C.; Saulson, G. Greening Buildings and Communities: Costs and Benefits; Good Energies: Zug, Switzerland, 2008. [Google Scholar]
- Ries, R.; Bilec, M.M.; Gokhan, N.M.; Needy, K.L. The economic benefits of green buildings: A comprehensive case study. Eng. Econ. 2006, 51, 259–295. [Google Scholar] [CrossRef]
- Singh, A.; Syal, M.; Korkmaz, S.; Grady, S. Costs and benefits of IEQ improvements in LEED office buildings. J. Infrastruct. Syst. 2010, 17, 86–94. [Google Scholar] [CrossRef]
- O’Malley, C.; Piroozfar, P.; Farr, E.R.; Pomponi, F. Urban Heat Island (UHI) mitigating strategies: A case-based comparative analysis. Sustain. Cities Soc. 2015, 19, 222–235. [Google Scholar] [CrossRef]
- Andaloro, A.P.; Salomone, R.; Ioppolo, G.; Andaloro, L. Energy certification of buildings: A comparative analysis of progress towards implementation in European countries. Energy Policy 2010, 38, 5840–5866. [Google Scholar] [CrossRef]
- Casals, X.G. Analysis of building energy regulation and certification in Europe: Their role, limitations and differences. Energy Build. 2006, 38, 381–392. [Google Scholar] [CrossRef]
- Beccali, M.; Galatioto, A.; Leone, G.; Longo, S. Is the NZEB benchmarking approach suitable for assessing energy retrofit design? Appl. Mech. Mater. 2013, 361–363, 402–407. [Google Scholar] [CrossRef]
- Boarin, P.; Guglielmino, D.; Pisello, A.L.; Cotana, F. Sustainability assessment of historic buildings: Lesson learnt from an Italian case study through LEED® rating system. Energy Procedia 2014, 61, 1029–1032. [Google Scholar] [CrossRef]
- Dias, W.; Chandratilake, S.; Ofori, G. Dependencies among environmental performance indicators for buildings and their implications. Build. Environ. 2017, 123, 101–108. [Google Scholar] [CrossRef]
- USGBC. USGBC LEED Green Associate Study Guide; US Green Building Council: Washington, DC, USA, 2009. [Google Scholar]
- USGBC. Green Building Facts; US Green Building Council: Washington, DC, USA, 2015. [Google Scholar]
- USGBC. LEED 2009 for New Construction and Major Renovations; US Green Building Council: Washington, DC, USA, 2010. [Google Scholar]
- Turner, C.; Frankel, M.; Council, U.G.B. Energy Performance LEED for New Construction Buildings; New Buildings Institute: Vancouver, WA, USA, 2008. [Google Scholar]
- Gifford, H. A Better Way to Rate Green Buildings. Available online: EnergySavingsScience.com (accessed on 15 May 2014).
- Lstiburek, J.W. Why green can be wash. ASHRAE J. 2008, 50, 28–36. [Google Scholar]
- Richter, B.; Goldston, D.; Crabtree, G.; Glicksman, L.; Goldstein, D.; Greene, D.; Kammen, D.; Levine, M.; Lubell, M.; Savitz, M. Energy future: Think efficiency; American Physical Society: College Park, MD, USA, 2008. [Google Scholar]
- Scofield, J.H. Do LEED-certified buildings save energy? Not really…. Energy Build. 2009, 41, 1386–1390. [Google Scholar] [CrossRef]
- Scofield, J.H.; Oberlin, O. A re-examination of the NBI LEED Building Energy Consumption Study. In Proceedings of the International Energy Program Evaluation Conference, Portland, OR, USA, 12–14 August 2009. [Google Scholar]
- Newsham, G.R.; Mancini, S.; Birt, B.J. Do LEED-certified buildings save energy? Yes, but…. Energy Build. 2009, 41, 897–905. [Google Scholar] [CrossRef]
- Diamond, R.; Opitz, M.; Hicks, T.; Vonneida, B.; Herrera, S. Evaluating the energy performance of the first generation of LEED-certified commercial buildings. In Proceedings of the ACEEE 2006 Summer Study, Pacific Grove, CA, USA, 13–18 August 2006. [Google Scholar]
- Santamouris, M. On the built environment—The urban influence. In Energy and Climate in the Urban Built Environment; Taylor & Francis: Milton Park, UK, 2013; pp. 3–18. [Google Scholar]
- Oke, T.; Johnson, G.; Steyn, D.; Watson, I. Simulation of surface urban heat islands under ‘ideal’conditions at night Part 2: Diagnosis of causation. Bound. Layer Meteorol. 1991, 56, 339–358. [Google Scholar] [CrossRef]
- Heidt, V.; Neef, M. Benefits of urban green space for improving urban climate. In Ecology, Planning, and Manag. Urban Forests; Springer: Berlin, Germany, 2008; pp. 84–96. [Google Scholar]
- Santamouris, M.; Synnefa, A.; Karlessi, T. Using advanced cool materials in the urban built environment to mitigate heat islands and improve thermal comfort conditions. Sol. Energy 2011, 85, 3085–3102. [Google Scholar] [CrossRef]
- Santamouris, M.; Papanikolaou, N.; Livada, I.; Koronakis, I.; Georgakis, C.; Argiriou, A.; Assimakopoulos, D. On the impact of urban climate on the energy consumption of buildings. Sol. Energy 2001, 70, 201–216. [Google Scholar] [CrossRef]
- Smith, C.; Levermore, G. Designing urban spaces and buildings to improve sustainability and quality of life in a warmer world. Energy Policy 2008, 36, 4558–4562. [Google Scholar] [CrossRef]
- Hassid, S.; Santamouris, M.; Papanikolaou, N.; Linardi, A.; Klitsikas, N.; Georgakis, C.; Assimakopoulos, D. The effect of the Athens heat island on air conditioning load. Energy Build. 2000, 32, 131–141. [Google Scholar] [CrossRef]
- Machairas, V.; Tsangrassoulis, A.; Axarli, K. Algorithms for optimization of building design: A review. Renew. Sustain. Energy Rev. 2014, 31, 101–112. [Google Scholar] [CrossRef]
- Marceau, M.; Van Geem, M.G. Solar Reflectance Concrete for LEED Sustainable Sites Credit: Heat Island Effect; Portland Cement Association: Portland, OR, USA, 2007. [Google Scholar]
- Suzer, O. A comparative review of environmental concern prioritization: LEED vs other major certification systems. J. Environ. Manag. 2015, 154, 266–283. [Google Scholar] [CrossRef] [PubMed]
- Cavanaugh, L.M. Redefining the green roof. J. Arch. Eng. 2008, 14, 4–6. [Google Scholar] [CrossRef]
- Kumar, S. Introducing Comparative Analysis to the LEED System: A Case for Rational and Regional Application. Teaming Effic. Energy Environ. Policy 2002, 9, 83. [Google Scholar]
- Gu, D.; Kim, H.; Kim, H. LEED, its efficacy in regional context: Finding a relationship between regional measurements and urban temperature. Energy Build. 2015, 86, 687–691. [Google Scholar]
- Everblue. Laws, Mandates, and Ordinances Requiring LEED. Available online: http://www.everbluetraining.com/blog/laws-mandates-and-ordinances-requiring-leed (accessed on 26 August 2015).
- Anselin, L. Spatial Econometrics: Methods and Models; Springer Science & Business Media: New York, NY, USA, 2013; Volume 4. [Google Scholar]
- Dormann, C.F.; McPherson, J.M.; Araújo, M.B.; Bivand, R.; Bolliger, J.; Carl, G.; Davies, R.G.; Hirzel, A.; Jetz, W.; Kissling, W.D.; et al. Methods to account for spatial autocorrelation in the analysis of species distributional data: A review. Ecography 2007, 30, 609–628. [Google Scholar] [CrossRef]
- Getis, A. Reflections on spatial autocorrelation. Reg. Sci. Urban Econ. 2007, 37, 491–496. [Google Scholar] [CrossRef]
- Morris, C.; Simmonds, I.; Plummer, N. Quantification of the influences of wind and cloud on the nocturnal urban heat island of a large city. J. Appl. Meteorol. 2001, 40, 169–182. [Google Scholar] [CrossRef]
- Wong, E.; Hogen, K. Reducing Urban Heat Islands: Compendium Strategies; Environmental Protection Agency: Washington, DC, USA, 2011.
- Weng, Q. Thermal infrared remote sensing for urban climate and environmental studies: Methods, applications, and trends. ISPRS J. Photogramm. Remote Sens. 2009, 64, 335–344. [Google Scholar] [CrossRef]
- The USGS Land Cover Institute. USGS Land Cover. Available online: http://landcover.usgs.gov/usgslandcover.php (accessed on 30 September 2015).
- Jiménez-Muñoz, J.; Sobrino, J. Error sources on the land surface temperature retrieved from thermal infrared single channel remote sensing data. Int. J. Remote Sens. 2006, 27, 999–1014. [Google Scholar]
Figure 1.
Study area temperature and LEED buildings distribution.

Figure 2.
Moran scatterplot for temperature.


Table 1.
Summary of dependent and independent variables.
| Dependent Variable | Independent Variables | ||||||||
|---|---|---|---|---|---|---|---|---|---|
| Temperature (°C) | No. of LEED Buildings | % | No. of Buildings | % | Land Cover | No. of Cells | % | ||
| Min | 46.13 | Total | 197 | 100% | 1,143,945 | 100% | Total | 1,376,820 | 100% |
| Max | 71.77 | Certified | 39 | 20% | Pervious | 959,271 | 70% | ||
| Mean | 64.48 | Silver | 54 | 27% | Impervious | 417,549 | 30% | ||
| Std. dev. | 4.54 | Gold | 78 | 40% | |||||
| Platinum | 26 | 13% | |||||||
Table 2.
Summary of the models.
| Variables | Model 1 | Model 2 | Model 3 | Model 4 |
|---|---|---|---|---|
| Intercept | 66.1409 *** | 66.1408 *** | 66.1408 *** | 66.1409 *** |
| Land Cover | −4.5995 *** | −4.5994 *** | −4.5994 *** | −4.5995 *** |
| Non-LEED Buildings | 0.1281 *** | 0.1281 *** | 0.1281 *** | 0.1281 *** |
| LEED Buildings | ||||
| All LEED Buildings | −0.3524 *** | |||
| C&S LEED Buildings | −0.3047 *** | −0.2620 *** | ||
| G&P LEED Buildings | −0.5163 *** | −0.4817 *** | ||
| N | 1,376,820 | 1,376,820 | 1,376,820 | 1,376,820 |
| R-squared | 0.3895 | 0.3895 | 0.3895 | 0.3895 |
| Adjusted R-squared | 0.3895 | 0.3895 | 0.3895 | 0.3895 |
Dependent variables: outdoor temperature (°C). Note: ***, **, and * indicate significance at the 99%, 95%, and 90% confidence levels, respectively. C&S LEED Buildings: number of Certified and Silver LEED buildings. G&P LEED Buildings: number of Gold and Platinum LEED buildings.
Table 3.
Spatial regression results.
| Variables | OLS | Spatial Error | Spatial Lag |
|---|---|---|---|
| Intercept | 65.7879 *** | 66.1712 *** | 2.5252 *** |
| Land Cover | −2.9768 *** | −0.2206 *** | −0.2868 *** |
| Non-LEED Buildings | 0.1706 *** | 0.0111 *** | 0.0098 *** |
| LEED Buildings | −0.2324 *** | −0.1233 *** | −0.1286 *** |
| Lambda | 0.9666 *** | ||
| Rho | 0.9622 *** | ||
| N | 5595 | 5595 | 5595 |
| R-squared | 0.1100 | ||
| Pseudo R-squared | 0.0843 | 0.9486 |
Dependent variables: outdoor temperature (°C). Note: *** and ** indicate significance at the 99% and 95% confidence levels, respectively.
© 2017 by the authors. Licensee MDPI, Basel, Switzerland. This article is an open access article distributed under the terms and conditions of the Creative Commons Attribution (CC BY) license (http://creativecommons.org/licenses/by/4.0/).
Share and Cite
MDPI and ACS Style
Shin, M.H.; Kim, H.Y.; Gu, D.; Kim, H. LEED, Its Efficacy and Fallacy in a Regional Context—An Urban Heat Island Case in California. Sustainability 2017, 9, 1674. https://doi.org/10.3390/su9091674
AMA Style
Shin MH, Kim HY, Gu D, Kim H. LEED, Its Efficacy and Fallacy in a Regional Context—An Urban Heat Island Case in California. Sustainability. 2017; 9(9):1674. https://doi.org/10.3390/su9091674
Chicago/Turabian StyleShin, Min Ho, Hwan Yong Kim, Donghwan Gu, and Hyoungsub Kim. 2017. "LEED, Its Efficacy and Fallacy in a Regional Context—An Urban Heat Island Case in California" Sustainability 9, no. 9: 1674. https://doi.org/10.3390/su9091674
Note that from the first issue of 2016, this journal uses article numbers instead of page numbers. See further details here.