MODIS Hotspot Validation over Thailand

Abstract
:1. Introduction
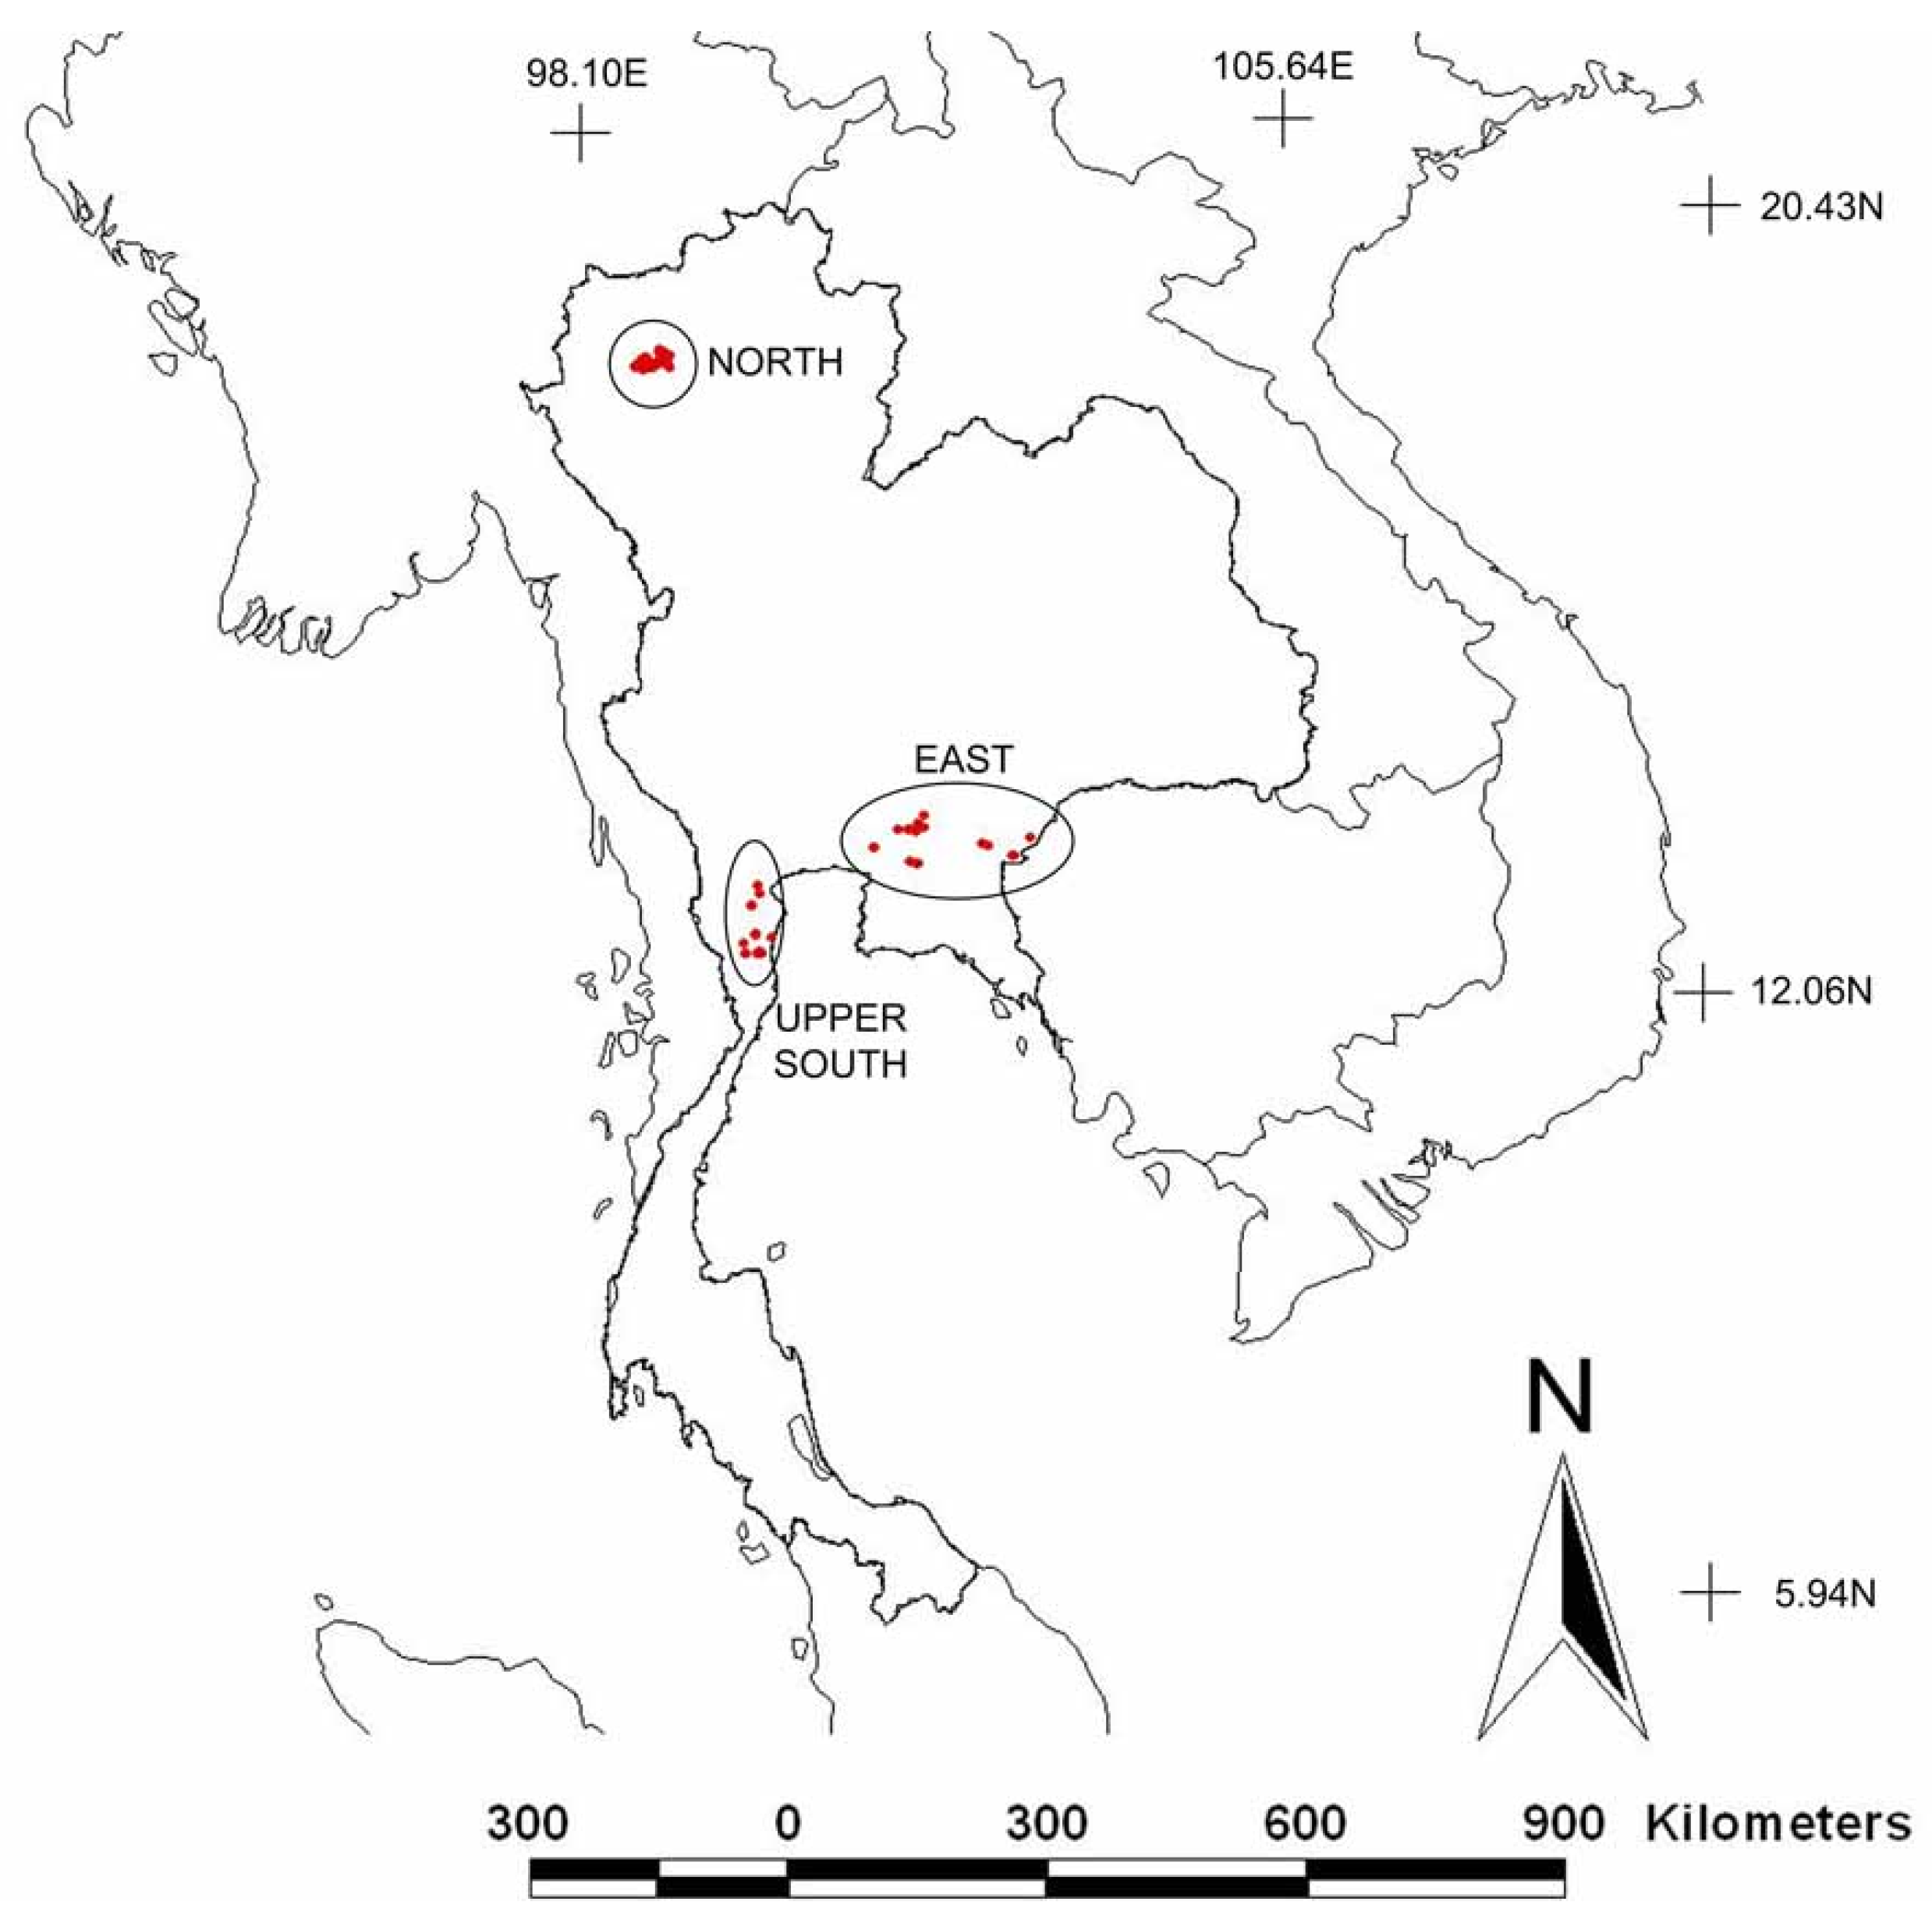
2. Study Sites
- (1)
- In the North (approximate geographic extension within 18.83N, 98.52E, 18.96N, 98.88E, 18.70N, 98.56E, and 18.76N, 98.95E, in Op Khan and Doi Suthep-Pui National Park, Chieng-mai Province)
- (2)
- In the Upper South (approximate geographic extension within 13.15N, 99.60E, 13.15N, 100.06E, 12.60N, 99.60E, and 12.60N, 100.06E, in Petchaburi Province)
- (3)
- In the East (approximate geographic extension within 14.10N, 100.98E, 14.10N, 102.70E, 13.55N, 100.98E, and 13.53N, 102.70E, in Chacheongsao, Chanthaburi, and Sakkaew Provinces)


| Average precipitation in dry period* (mm) | Average precipitation in wet period** (mm) | Average humidity in dry period* (%) | Average humidity in wet period** (%) | |
|---|---|---|---|---|
| Thailand | 234.3 | 1,165.1 | 70.5 | 80.5 |
| North | 116.5 | 955.2 | 62 | 81 |
| Upper South | 197.9 | 661.2 | 77 | 78 |
| East | 257.8 | 1,440.2 | 74 | 81 |

3. Materials and Methods
3.1. Materials
3.1.1. MODIS fire products
3.1.2. MODIS Level 1 data
3.1.3. Field data from test sites, forest fire validation reports and daily forest fire report
- (1)
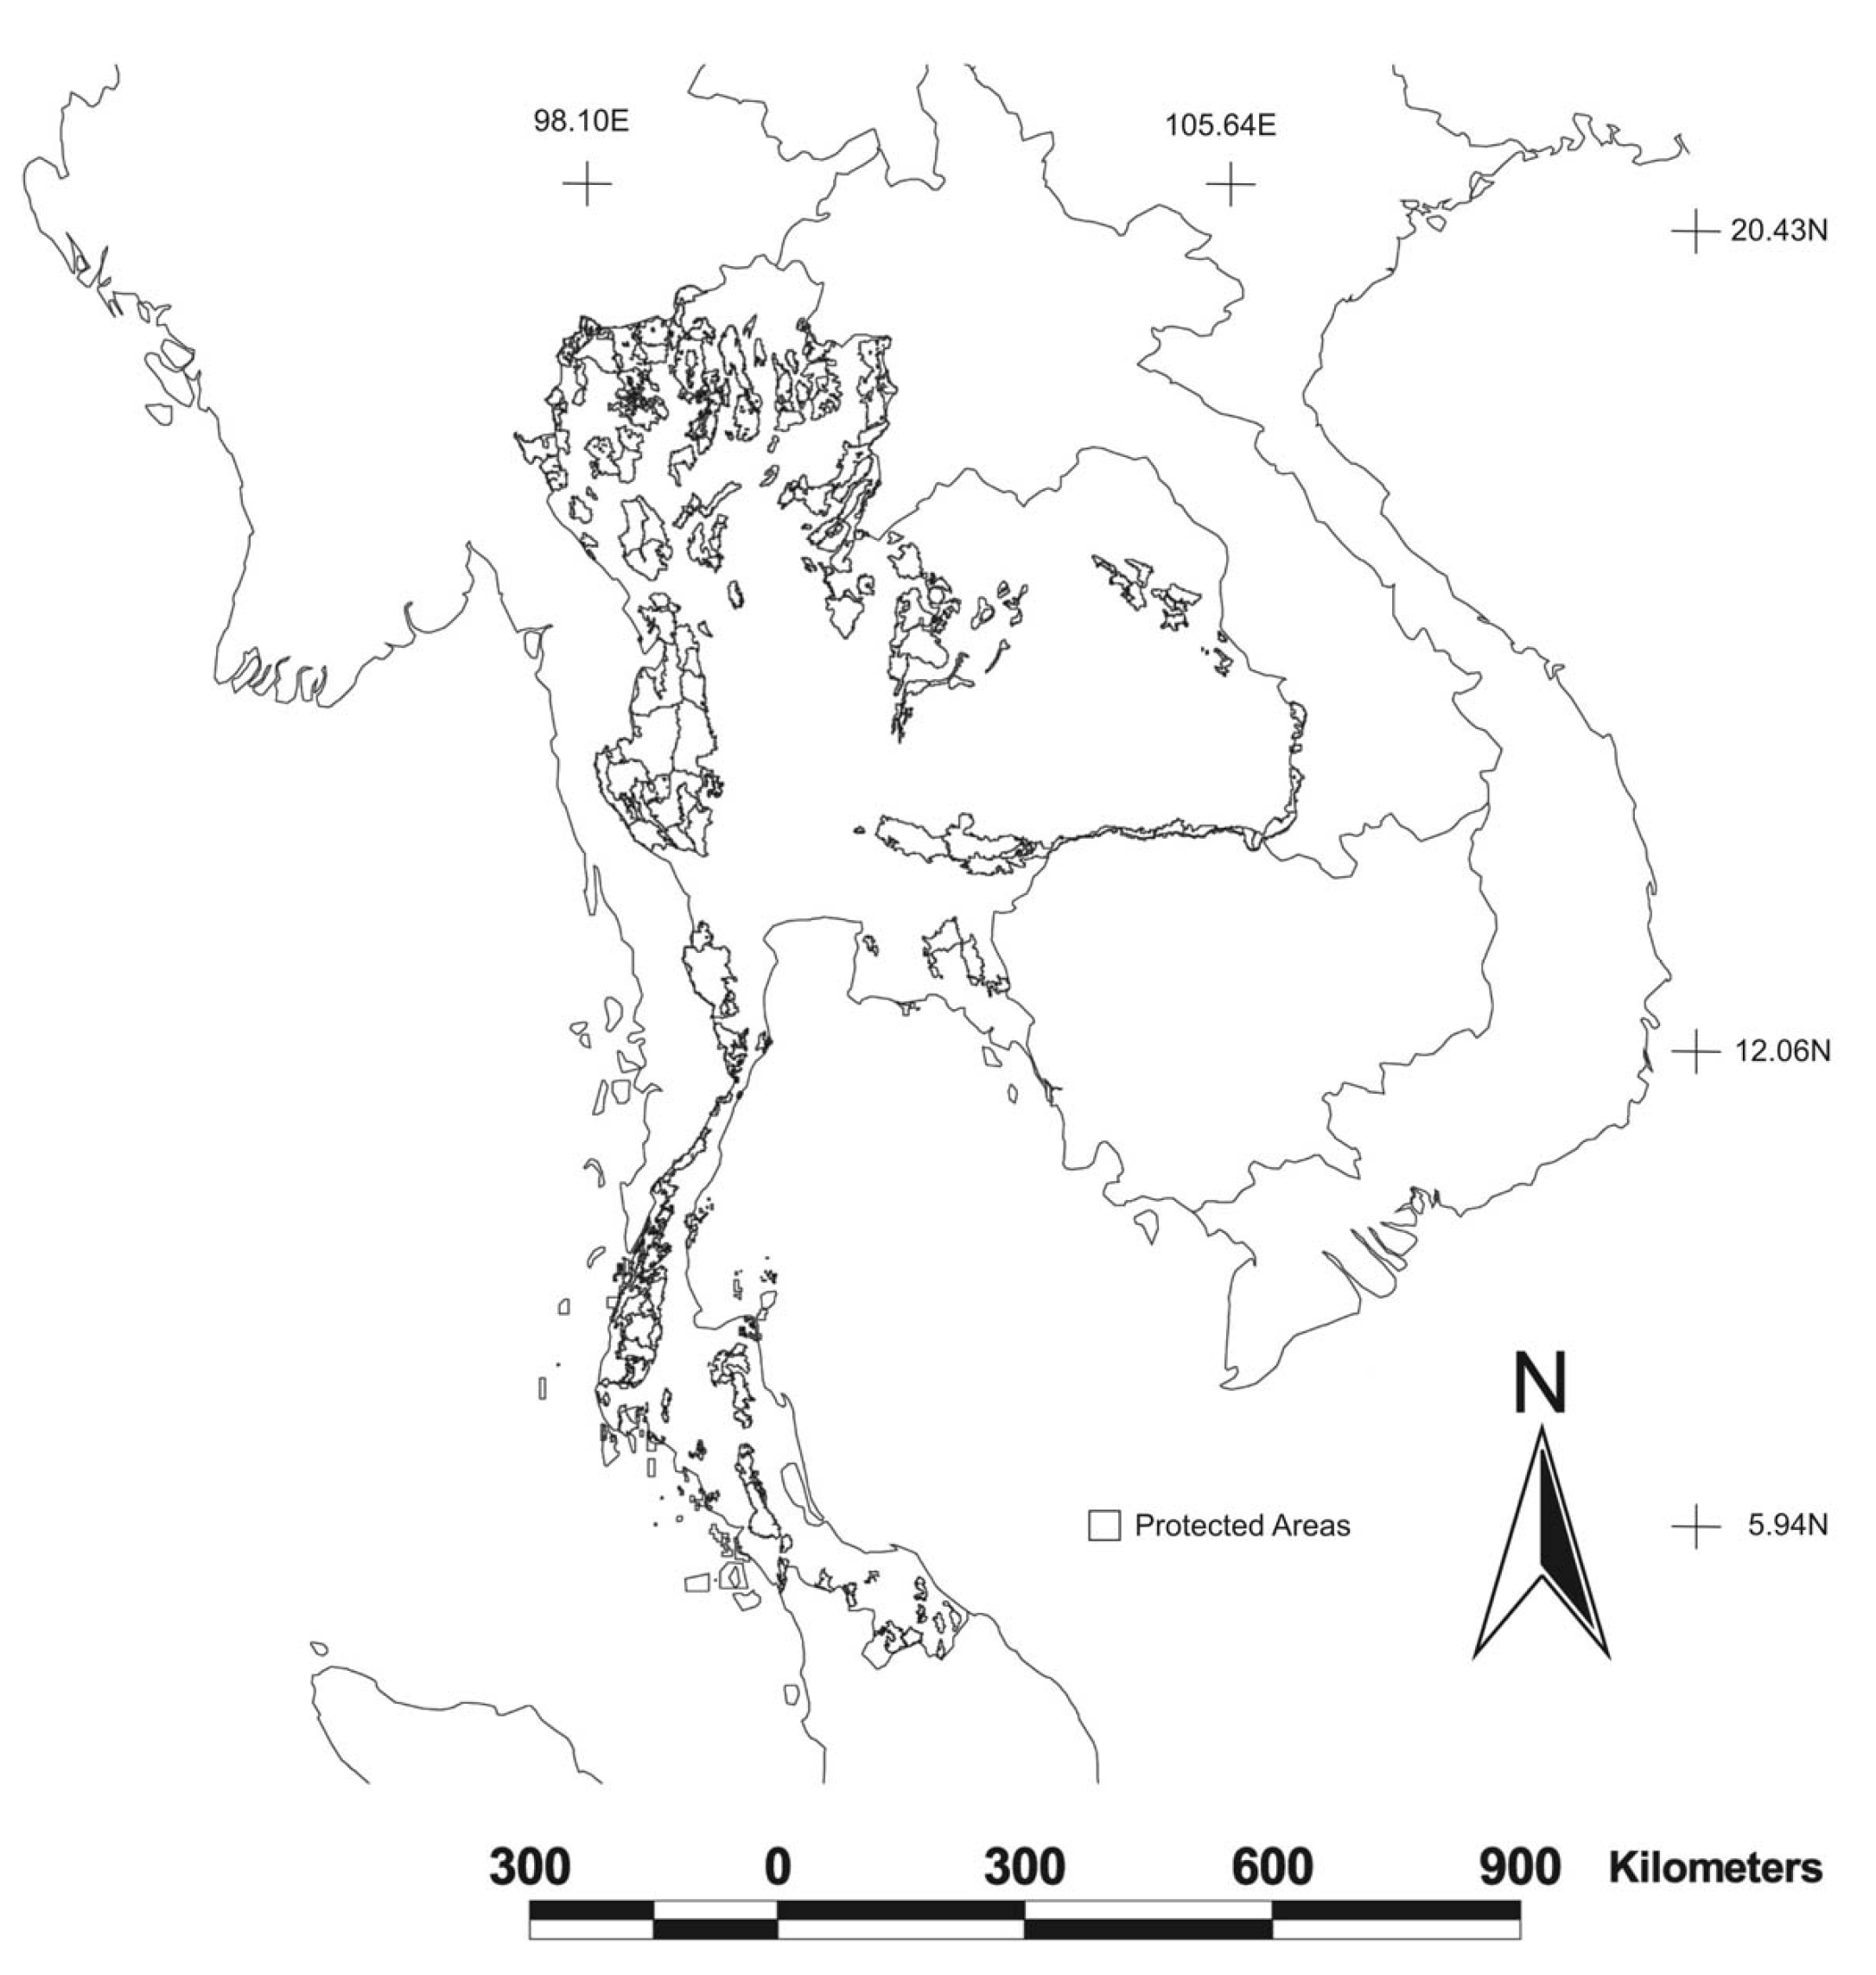
- Seventy two hotspots out of 35,278 (during March–April, 2007) from the three validation test sites (Figure 1): 43 hotspots in the North, 13 in the Upper South, and 16 in the East. Out of the 72 total hotspots, 43 were within the protected areas (Op Khan and Doi Suthep-Pui National Parks) while 29 were outside, and in the suburban and agricultural zones. Feasible guidelines are to be established from this data collection.
- (2)
- The established guidelines were employed by 138 forest fire stations (for 187 protected areas) around the country. The total of 10,589 hotspots during 2007–2009 was to be validated. However, only 2,223 hotspots were verified and reported back to the FFCD (Table 2).
| Recording period of hotspots | Hotspots | Validated | %Validated | Found | %Found | Not Found | %Not Found |
|---|---|---|---|---|---|---|---|
| 1. Mar 07–Apr 07 | 2,114 | 478 | 22.61 | 439 | 91.84 | 39 | 8.16 |
| 2. Oct 07–Apr 08 | 4,167 | 773 | 18.55 | 739 | 95.60 | 34 | 4.40 |
| 3. Dec 08–May 09 | 4,308 | 972 | 22.56 | 948 | 97.53 | 24 | 2.47 |
| Total | 10,589 | 2,223 | 20.99 | 2,126 | 95.64 | 80 | 4.36 |
| Month | HS AM | FFR AM | HS PM | FFR PM |
|---|---|---|---|---|
| Jan–07 | 1,672 | 373 | 4,055 | 692 |
| Feb–07 | 2,628 | 843 | 7,949 | 1,737 |
| Mar–07 | 3,651 | 935 | 14,485 | 2,166 |
| Apr–07 | 982 | 257 | 1,936 | 621 |
| Jan–08 | 1,035 | 201 | 2,668 | 434 |
| Feb–08 | 1,018 | 451 | 2,544 | 1,146 |
| Mar–08 | 2,404 | 808 | 9,529 | 1,706 |
| Apr–08 | 632 | 166 | 1,992 | 553 |
| Jan–09 | 29 | 89 | 105 | 206 |
| Feb–09 | 372 | 648 | 1,243 | 1,679 |
| Mar–09 | 506 | 592 | 2,465 | 1,468 |
| Apr–09 | 81 | 91 | 477 | 284 |
| Total 07–09 | 15,010 | 5,454 | 49,448 | 12,692 |
| Total–07 | 8,933 | 2,408 | 28,425 | 5,216 |
| Total–08 | 5,089 | 1,626 | 16,733 | 3,839 |
| Total–09 | 988 | 1,420 | 4,290 | 3,637 |
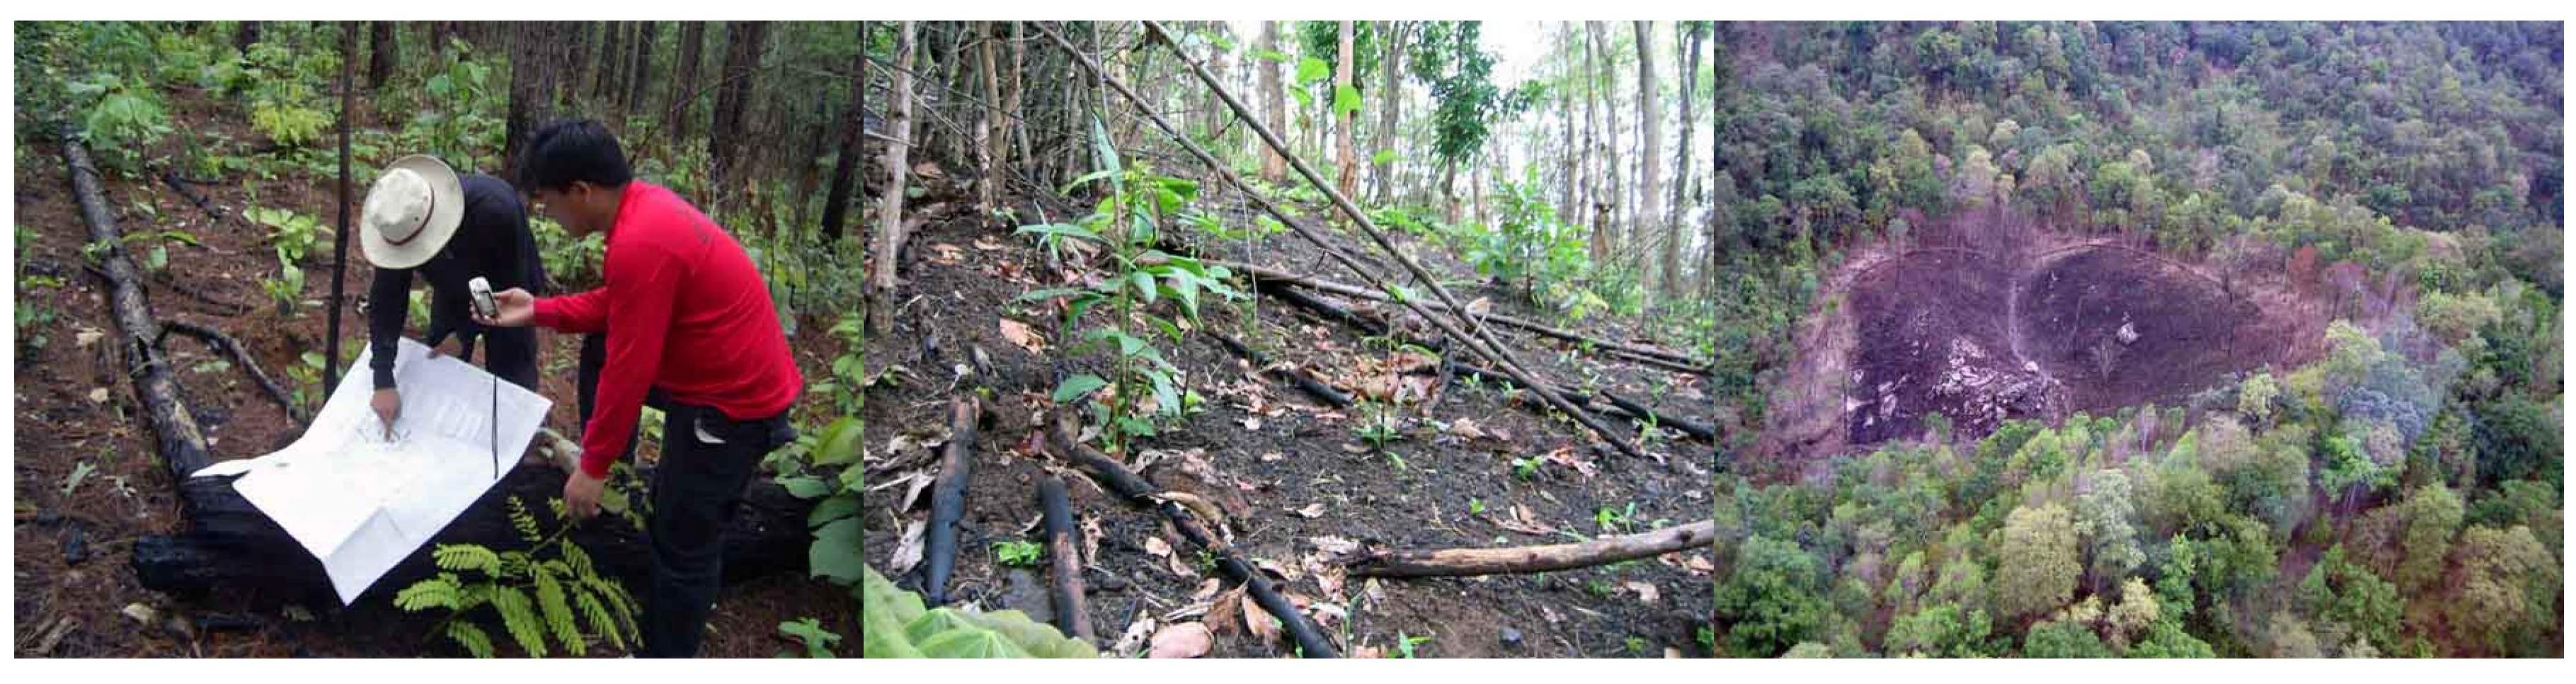
3.2. Method
- (1)
- The hotspots selected must be evenly-distributed throughout the study areas.
- (2)
- The locations must contain representative dominated land cover type.
- (3)
- Those selected locations must not be too difficult to access due to time and budget constraints.

4. Results and Analyses
4.1.Field Data from Test Sites
| ID | OBJECTID | LATITUDE | LONGITUDE | BT | ACQDATE | Local Time | SATELLITE | BT 21 | BT 31 | Diff BT21-31 |
|---|---|---|---|---|---|---|---|---|---|---|
| 1 | 6214434 | 18.7620 | 98.8960 | 326.80 | 2007-03-01 | 1320 | A | 324.46 | 305.28 | 19.18 |
| 2 | 6320543 | 18.7890 | 98.7620 | 312.10 | 2007-03-02 | 1100 | T | 309.61 | 301.47 | 8.14 |
| 3 | 6540048 | 18.8000 | 98.8050 | 314.50 | 2007-03-04 | 1045 | T | 311.18 | 303.03 | 8.15 |
| 4 | 6819666 | 18.9060 | 98.8390 | 311.40 | 2007-03-06 | 1340 | A | 310.99 | 295.96 | 15.02 |
| 5 | 7107491 | 18.8060 | 98.7870 | 314.70 | 2007-03-08 | 1330 | A | 313.54 | 302.76 | 10.78 |
| 6 | 7107544 | 18.8800 | 98.8120 | 316.90 | 2007-03-08 | 1330 | A | 314.00 | 304.00 | 10.00 |
| 7 | 7249268 | 18.7560 | 98.5630 | 314.40 | 2007-03-11 | 1050 | T | 311.97 | 301.44 | 10.53 |
| 8 | 7453910 | 18.7900 | 98.8870 | 313.60 | 2007-03-13 | 1345 | A | 308.87 | 301.52 | 7.35 |
| 9 | 7453919 | 18.7610 | 98.5660 | 316.80 | 2007-03-13 | 1345 | A | 311.72 | 300.92 | 10.80 |
| 10 | 7448920 | 18.8350 | 98.6070 | 311.60 | 2007-03-13 | 1040 | T | 309.35 | 299.95 | 9.40 |
| 11 | 7462887 | 18.7950 | 98.8940 | 308.80 | 2007-03-13 | 200 | A | 303.54 | 295.33 | 8.21 |
| 12 | 7572197 | 18.8590 | 98.8460 | 316.50 | 2007-03-14 | 1125 | T | 308.80 | 303.05 | 5.75 |
| 13 | 7572221 | 18.7660 | 98.5740 | 315.60 | 2007-03-14 | 1125 | T | 309.28 | 301.25 | 8.03 |
| 14 | 7753458 | 18.7820 | 98.6320 | 317.20 | 2007-03-15 | 1335 | A | 308.99 | 304.51 | 4.47 |
| 15 | 7753487 | 18.8000 | 98.6170 | 320.80 | 2007-03-15 | 1335 | A | 312.33 | 303.45 | 8.88 |
| AVG | 315.45 | 311.24 | 301.60 | 9.65 | ||||||
| MAX | 326.80 | 324.46 | 305.28 | 19.18 | ||||||
| MIN | 308.80 | 303.54 | 295.33 | 4.47 |
| Test Site | Hotspots | False Alarms | Accuracy (%) |
|---|---|---|---|
| North | 43 | 1 | 97.67 |
| Upper South | 13 | 2 | 84.64 |
| East | 16 | 2 | 87.50 |
| Total | 72 | 5 | 92.06 |
4.2. Forest Fire Validation Reports
4.3. Daily Forest Fire Reports
5. Discussions and Conclusion
Acknowledgments
References and Notes
- Akaakara, S. Forest Fire Control in Thailand; Forest Fire Control Office, Royal Forest Department: Bangkok, Thailand, 2001; pp. 2–5. [Google Scholar]
- Plodpail, A.; Akaakara, S.; Manirat, B.; Parnnakapitak, W.; Songporn, N. The Management of Forest Fire Control in Thailand; Natural Disaster Office, Royal Forest Department: Bangkok, Thailand, 1987; pp. 15–20. [Google Scholar]
- Justice, C.O.; Malingreau, J.P.; Seltzer, A. Satellite remote sensing of fires: Potential and limitations. In Fire in the Environment: The Ecological, Atmospheric, and Climatic Importance of Vegetation Fires; Crutzen, P., Goldammer, J., Eds.; John Wiley & Sons: New York, NY, USA, 1993; pp. 77–88. [Google Scholar]
- Justice, C.O.; Hall, D.; Salomonson, V.; Privette, J.; Riggs, G.; Strahler, A.; Lucht, W.; Myneni, R.; Knjazihhin, Y.; Running, S.; Nemani, R.; Vermote, E.; Townshend, J.; Defries, R.; Roy, D.; Wan, Z.; Huete, A.; van Leeuwen, W.; Wolfe, R.; Giglio, L.; Muller, J.P.; Lewis, P.; Barnsley, M. The Moderate Resolution Imaging Spectroradiometer (MODIS): land remote sensing for global change research. IEEE Trans. Geosci. Remote Sens. 1998, 36, 1228–1249. [Google Scholar] [CrossRef]
- Justice, C.O.; Kaufman, Y. MODIS Fire Products, Version 2.2, Nov. 10 1998 Algorithm Technical Background Document; NASA: Washington, DC, USA, 1998; pp. 2–20.
- Arino, O.; Rosaz, J. 1997 and 1998 World ASTR Fire Atlas Using ERS-2 ATSR-2 Data. In Proceedings of the Joint Fire Science Conference, Boise, Idaho, 15-17 June 1999; Neuenschwander, L.F., Tyan, K.C., Golberg, G.E., Eds.; University of Idaho, Boise, ID, USA and the International Association of Wildland Fire: Birmingham, AL, USA, 1999; pp. 177–182. [Google Scholar]
- Elvidge, C.; Dee, W.P.; Elaine, P.; Eric, A.K.; Jackie, K.; Kimberly, E.B. Remote Sensing Change Detection: Environmental Monitoring Methods and Applications, Wildfire Detection with Metorological Satellite Data: Results from New Mexico During June of 1996 Using GOES, AVHRR, and DMSP-OLS; CRC Press: Boca Raton, FL, USA, 1998; pp. 103–121. [Google Scholar]
- Justice, C.O.; Giglio, L.; Korontzi, S.; Owens, J.; Morisette, J.T.; Roy, D.; Descloitres, J.; Alleaume, S.; Petitcolin, F.; Kaufman, Y. The MODIS fire products. Remote Sens. Environ. 2002, 83, 244–262. [Google Scholar] [CrossRef]
- Li, Z.; Kaufman, Y.K.; Ichoku, C.; Fraser, R.; Trishchenko, A.; Giglio, L.; Jin, J.Z.; Yu, X. Review of AVHRR-Based Active Fire Detection Algorithms: Principles, Limitations and Recommendations. In Global and Regional Vegetation Fire Monitoring from Space: Planning a Coordinated International Effort; Ahern, F., Gregoire, J.M., Justice, C., Eds.; SPB Academic Publishing: The Hague, The Netherlands, 2001; pp. 199–225. [Google Scholar]
- Menzel, W.P.; Prins, E.M. Monitoring Fire Activity in Western Hemisphere with the New Generation of Geostationary Satellites. In Proceedings of the 22nd Conference on Agricultural and Forest Meteorology with Symposium on Fire and Forest Meteorology, Atlanta, GA, USA, 28 January–2 February, 1996; pp. 272–275.
- Prins, E.M.; Menzel, W.P. Geostationary satellite detection of biomass burning in South America. Int. J. Remote Sens. 1992, 13, 2783–2799. [Google Scholar] [CrossRef]
- Elvidge, C.; Kroehl, H.W.; Kihn, E.A.; Baugh, K.E.; Davis, E.R.; Hao, W.M. Algorithm for the Retrieval of Fire Pixels from DMSP Operational Linescan System Data. In Biomass Burning and Global Change; Levine, J.S., Ed.; the MIT Press: Cambridge, MA, USA, 1996. [Google Scholar]
- Giglio, L.; Kendall, J.D.; Tucker, C.J. Remote Sensing of fires with TRMM VIRS. Int. J. Remote Sens. 2000, 21, 203–207. [Google Scholar] [CrossRef]
- Giglio, L.; Descloitres, J.; Justice, C.O.; Kaufman, Y.J. An enhanced contextual fire detection algorithms for MODIS. Remote Sens. Environ. 2003, 87, 273–282. [Google Scholar] [CrossRef]
- Morisette, J.T.; Giglio, L.; Csiszar, I.A.; Justice, C.O. Validation of the MODIS active fire product over Southern Africa with ASTER data. Int. J. Remote Sens. 2005, 26, 4239–4264. [Google Scholar] [CrossRef]
- Morisette, J.T.; Giglio, L.; Csiszar, I.A.; Schroeder, W.; Morton, D.; Justice, C.O. Validation of MODIS active fire detection products derived from two algorithms. Earth Interact. 2005, 9, 1–25. [Google Scholar] [CrossRef]
- Csiszar, I.A.; Morisette, J.T.; Giglio, L. Validation of active fire detection from moderate-resolution satellite sensors: the MODIS example in Northern Eurasia. IEEE Trans. Geosci. Remote Sens. 2006, 44, 1757–1764. [Google Scholar] [CrossRef]
- Kud-In, A.T. Ecology: Fundamental Basics in Forestry; Forestry School, Kasertsar University: Bangkok, Thailand, 1998; pp. 423–539. [Google Scholar]
- Royal Thai Meteorological Department. Available online: http://www.tmd.go.th/en/ (accessed 6 November 2009).
© 2009 by the authors; licensee Molecular Diversity Preservation International, Basel, Switzerland. This article is an open-access article distributed under the terms and conditions of the Creative Commons Attribution license (http://creativecommons.org/licensescommons.org/licenses/by/3.0/).
Share and Cite
Tanpipat, V.; Honda, K.; Nuchaiya, P. MODIS Hotspot Validation over Thailand. Remote Sens. 2009, 1, 1043-1054. https://doi.org/10.3390/rs1041043
Tanpipat V, Honda K, Nuchaiya P. MODIS Hotspot Validation over Thailand. Remote Sensing. 2009; 1(4):1043-1054. https://doi.org/10.3390/rs1041043
Chicago/Turabian StyleTanpipat, Veerachai, Kiyoshi Honda, and Prayoonyong Nuchaiya. 2009. "MODIS Hotspot Validation over Thailand" Remote Sensing 1, no. 4: 1043-1054. https://doi.org/10.3390/rs1041043